THE NPD GROUP. 2010 Results --A growing market (up 4.7%) World Toy Market (billion $) Trends are in...
25
THE NPD GROUP The European Toy M arketin 2011 Specially prepared forW .I.T. 3rd February 2012
-
Upload
geraldine-flynn -
Category
Documents
-
view
215 -
download
0
Transcript of THE NPD GROUP. 2010 Results --A growing market (up 4.7%) World Toy Market (billion $) Trends are in...
THE NPD GROUP
The European Toy Market in 2011Specially prepared for W.I.T.
3rd February 2012

2007 2008 2009 201070.000
72.000
74.000
76.000
78.000
80.000
82.000
84.000
86.000
88.000
90.000
$78.100$77.200
$79.600$83.300
US
D b
illi
on
2010 Results --A growing market (up 4.7%)
World Toy Market (billion $)
Trends are in USD using foreign exchange rates as of Dec 31st of each yearSource NPD ICTI Report 2010.
2

2010 toy revenues by region (billions of $)North America, Europe and Asia are now relatively equal in size
3
World Toy Market by Region (billion $)
$23.9 +2.5%
$23.3 -.7%
$23.1 +9.2%
$7.3+10.7%
$3.1 +5.6% $2.6
+23%

Proprietary and Confidential
Toy Value Trends 2011 v 10
4Note: Europe 5 = 65% of European Sales
Source: NPD Group Retail Tracking in Europe (Full Year)Consumer Tracking in U.S. (Full Year)
U.S. U.K. France Germany Italy Spain
-15%
-10%
-5%
0%
5%
10%
15%
-2%
3%
5%
7%
-3%
-7%
0%
4%
9%
12%
-2%
-9%
Full Year December
Europe 5:+3% in 2011

Proprietary and Confidential
US: 2011 sector growth
5Source: The NPD Group / NPD Point of Sale & Consumer Data
2011
2010
$ % change vs. year ago
TOYS
+2%
-2%
CONSUMER TECHNOLOGY
-1%
-4%
VIDEO GAMES
-2%
-5%
SOFTWARE
+1%
-16%
SMALLAPPLIANCES
+7%
+6%
ATHLETIC FOOTWEAR
+10%
+1%
FASHION FOOTWEAR
+8%
FlatWATCHES*
+1%
+8%
HANDBAGS
Flat
+6%
US toys under performing some other categories

Proprietary and Confidential
Consumer confidence comparison by country up to December 2011
-50
-40
-30
-20
-10
0
10
20
Dec09
janv-10
févr-10
Mar10
avr-10
mai-10
juin-10
juil-10
août-10
sept-10
oct-10
nov-10
déc-10
janv-11
févr-11
mars-11
avr-11
mai-11
juin-11
juil-11
août-11
sept-11
oct-11
nov-11
dec-11
Germany Spain France Italy UK EU
Italy, France and the UK reach a 2-year low in November / December
Source: European Commission, Directorate General for Economic and Financial Affairs
6

Proprietary and Confidential
Traditional Toy Trends by CountryYTD % Change (value) 2010 v 2011
-2%
9% 9% 9%
2%
-6%
-2%
6% 6%
-3%
-7%
-3%
3%4%
7%
-5%
-8%
0%
0
0
0
0
0
0
0
0
0
0
0
US UK France Germany Italy Spain
Run up to Easter (Jan-Apr)
Summer (May-Oct)
Holiday season (Nov-Dec)Yr/Yr
Worsening trend throughout the year in several countries
Source: NPD Group / Retail Tracking in Europe (Full Year)Consumer Tracking in U.S. (Full Year)
7

AUTOMOTIVE
BEAUTY
COMMERCIAL TECHNOLOGY
CONSUMER TECHNOLOGY
ENTERTAINMENT
FASHION
FOOD & BEVERAGE
FOODSERVICE
HOME
OFFICE SUPPLIES
SOFTWARE
SPORTS
TOYS
WIRELESS
http://corpdevnew/image_library/
Key Highlights
8

Proprietary and Confidential
UK FR GE IT SP
Mini Figures - LEGO
Building Sets
Beyblade Asst - Hasbro
Monster High - Mattel
Beyblade Asst - Hasbro
Toffee- Preziosi
Action Figures Action Figures Plush Dolls
Beyblade Tops Charts In 2 Countries
Source: NPD EuroToys / Retail Tracking
9
Top Value Selling Toy By Country 2011

Proprietary and Confidential
Beyblade frenzy – 14th December 2011
How badly do you want this toy? €100 for a Beyblade stadium….
Source: NPD EPoS Retail Tracking
10

Proprietary and ConfidentialSource: NPD EPoS Retail Tracking
11
Tablets for all in continental Europe in 2012?
1 in every 11 UK kid aged 3-6 received a ‘toy’ tablet for Christmas
• Approximately 250,000 tablets were sold in the UK in 2011
• Preschool electronic Learning rose by 43% for the year (Total preschool +2%)

Proprietary and Confidential
Value Trends in Local Currency (2011 versus 2010)
12Source: NPD Epos Retail Tracking in Europe and
Consumer Service in U.S.
Everywhere, the Big ones are getting Bigger
U.S. U.K. France Germany Italy Spain
-10%
-5%
0%
5%
10%
15%
20%
-2%
3%
5%
7%
-3%
-7%
-1%
7%
11%
14%
-1%
-3%
Full Year 2011 Top 5 Groups

Proprietary and ConfidentialSource: NPD EPoS Retail Tracking
13
34,5
21,3
3132,6
28,6
21,7
29,8
18,5
24
27,1
UK FR GE IT SP
2010 2011
License Penetrati
on (%)
Licensed Sales 2011 & chg vs.
2010
+17%
€539m
-3%
€723m
+24%
€413m
+12%
€227m
-12%
€254m
#1 european license??…. Cars!
License Value Shares by country– Full Year 2010 v 11

Proprietary and ConfidentialSource: NPD EPoS Retail Tracking
14
Top 15 Properties Across Europe (Value)Full Year 2011
• Definition: a property includes brand and licenses sales. For Barbie it includes Mattel Barbie and toy licensees’ sales for Barbie in all monitored categories
Playmobil remains #1 property for G5
UK FRANCE GERMANY ITALY SPAIN
1 CARS THE MOVIE PLAYMOBIL PLAYMOBIL BARBIE CARS THE MOVIE
2 STAR WARS BEYBLADE STAR WARS HELLO KITTY & FRIENDS MONSTER HIGH
3 LEGO CITY CARS THE MOVIE CARS THE MOVIE CARS THE MOVIE PLAYMOBIL
4 HELLO KITTY & FRIENDS BARBIE BARBIE BEN 10 BARBIE
5 BARBIE HELLO KITTY & FRIENDS LEGO DUPLO LEGO CITY HELLO KITTY & FRIENDS
6 TOY STORY LITTLEST PET SHOP LEGO CITY MICKEY & FRIENDS NANCY
7 NERF VTECH BABY BEYBLADE BAKUGAN MICKEY & FRIENDS
8 DISNEY PRINCESS STAR WARS LEGO TECHNIC CICCIOBELLO NENUCO
9 SYLVANIAN FAMILIES ZHU ZHU GO GO PETS FILLY DISNEY PRINCESS SPONGEBOB SQUARE PANTS
10 PEPPA PIG WINNIE THE POOH & FRIENDSCARRERA WINNIE THE POOH & FRIENDS BEYBLADE
11 THOMAS AND FRIENDS POKEMON LEGO NINJAGO HOT WHEELS DORA THE EXPLORER
12 VTECH BABY LEGO CITY HELLO KITTY & FRIENDS BEYBLADE GORMITI
13 TRANSFORMERS BAKUGAN HOT WHEELS MOTORAMA DISNEY PRINCESS
14 BEN 10 DISNEY PRINCESS TIPTOI WINX CLUB NERF
15 MOSHI MONSTERS NERF KIDI... LEGO DUPLO STAR WARS

AUTOMOTIVE
BEAUTY
COMMERCIAL TECHNOLOGY
CONSUMER TECHNOLOGY
ENTERTAINMENT
FASHION
FOOD & BEVERAGE
FOODSERVICE
HOME
OFFICE SUPPLIES
SOFTWARE
SPORTS
TOYS
WIRELESS
http://corpdevnew/image_library/
Consumer Trends
15

Proprietary and Confidential
Traditional toys sales for children 0-11 years old in € millions (+4%) January – September 2010 v 2011
328 325
1 117
975
774
525
337331 326
1 120
966
806
614
382
0
200
400
600
800
1 000
1 200
0-11 MONTHS 12-23 MONTHS 2-3 YRS 4-5 YRS 6-7 YRS 8-9 YRS 10-11 YRS
Mill
ion
s YTD 10 YTD 11
+17%
flat
+1% flat
-1%
+4%
+13%
Source: The NPD Group / Consumer Tacking / £1 = €1,1626
KGOO: Kids Getting Older Older or growth comes from 6 years+
16

Proprietary and Confidential
-10%
-6%-5%
4%
8% 8%
6%
-3%
2%3%
5%5%
-10%
0%
10%
US UK France Germany Italy Spain
Non Occasion Occasion
How is the recession changing behaviour?
1. Low price points down
2. Non-Family purchases decline
3. Promotional purchases increase share
4. ‘No Special Occasion’ share down in Europe 5
17
Source: NPD Group / Consumer & Retail Tracking in EuropeConsumer Tracking in U.S. (Full Year)

Proprietary and Confidential
Total
< 2.50
2.50 to 4.99
5 to 9.99
10 to 19.99
20 to 49.99
>50
Price Point % Change2011 v 2010
UK France Germany Italy SpainUS
18
Source: NPD Group Retail Tracking in Europe (Full Year)Consumer Tracking in U.S. (Full Year) – in local currency
-2
-7
-17
-11
-7
12
17
3
-1
-4
1
4
1
23
5
-4
-13
3
8
5
10
7
0
-8
0
10
9
15
-3
-5
-11
-9
-4
2
-1
-9
-11
-15
-13
-11
-6
-1
High price points fared better

Proprietary and Confidential
19
Sales change YTD September 2011 v 10 by recipient
Family first: sales plunge for ‘not-related’
39% 19% 33% 9% €% of spend YTD Sep-11
Source: The NPD Group / Consumer Tacking / £1 = €1,1626
73
11
-22
-40
-20
0
20
40
Parents Grand Parents Other Family Not Related

Proprietary and Confidential
Share of Sales on Promotion Online v Offline Value Shares – January – September 2010 v 11
Sales on promotion have increased by 2%
Source NPD Consumer Panel YTD September 2010 v 2011 - £1 = €1.1626
31,8 30,7
40,6
32,5 30,9
43,1
0
5
10
15
20
25
30
35
40
45
50
G5 - Offline Online
flat
+34%
+5%
20

Proprietary and Confidential
21
Online is still gaining shares in largest countries
6
18
5
17
7
22
8
20
5 4
13
15 14
6
16
4
US - UK France Germany
2008 2009 2010 2011
Total Online % of Toy Spend by Country 2008 to 2011 (Value sales)
+29% +54% +28%YR/YR
Note: Online shares in Italy and Spain are below 2% of the total market
Source: NPD Group Consumer Tracking Europe (12 mths to Sep’)Consumer Tracking in U.S. (12 mths to Sep’)
+12%

Proprietary and Confidential
Outlook for 2012

Proprietary and Confidential
2012 in a nutshell
Online Channel growth changing shopping habits
Growth in Virtual Shops & Mobile Shopping
Increased Digital Gaming Into Toys & Into Europe
23
Proprietary and Confidential
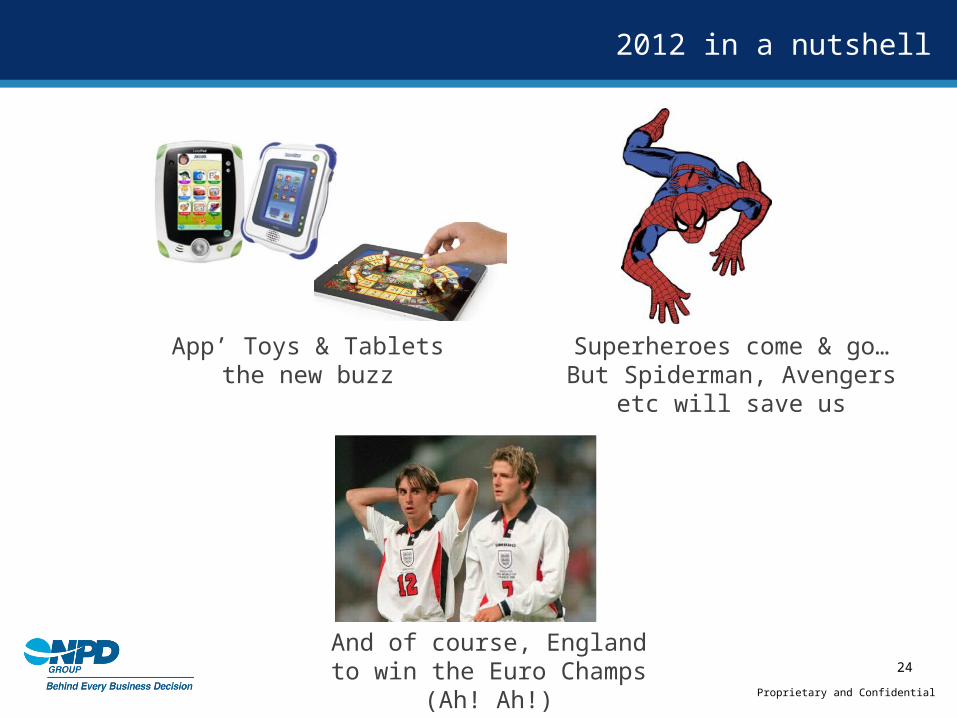
2012 in a nutshell
App’ Toys & Tablets the new buzz
Superheroes come & go…But Spiderman, Avengers etc
will save us
And of course, England to win the Euro Champs (Ah! Ah!) 24

Proprietary and ConfidentialSource: NPD EPoS Retail Tracking26
Thank you for your time - Any [email protected] Analyst Europe
[email protected] Sales U.S.
[email protected] Sales Europe