
The Norwegian Cyclone Model - shorstmeyer.com · The Norwegian Cyclone Model A revolutionary method...
11
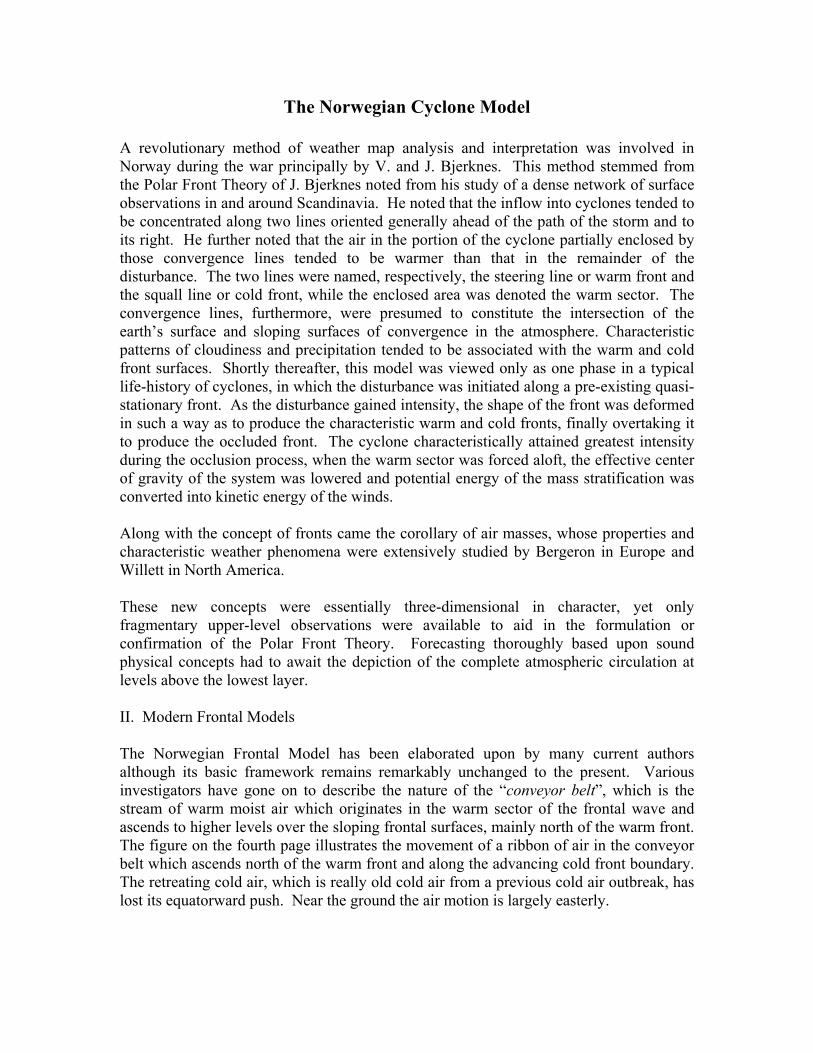
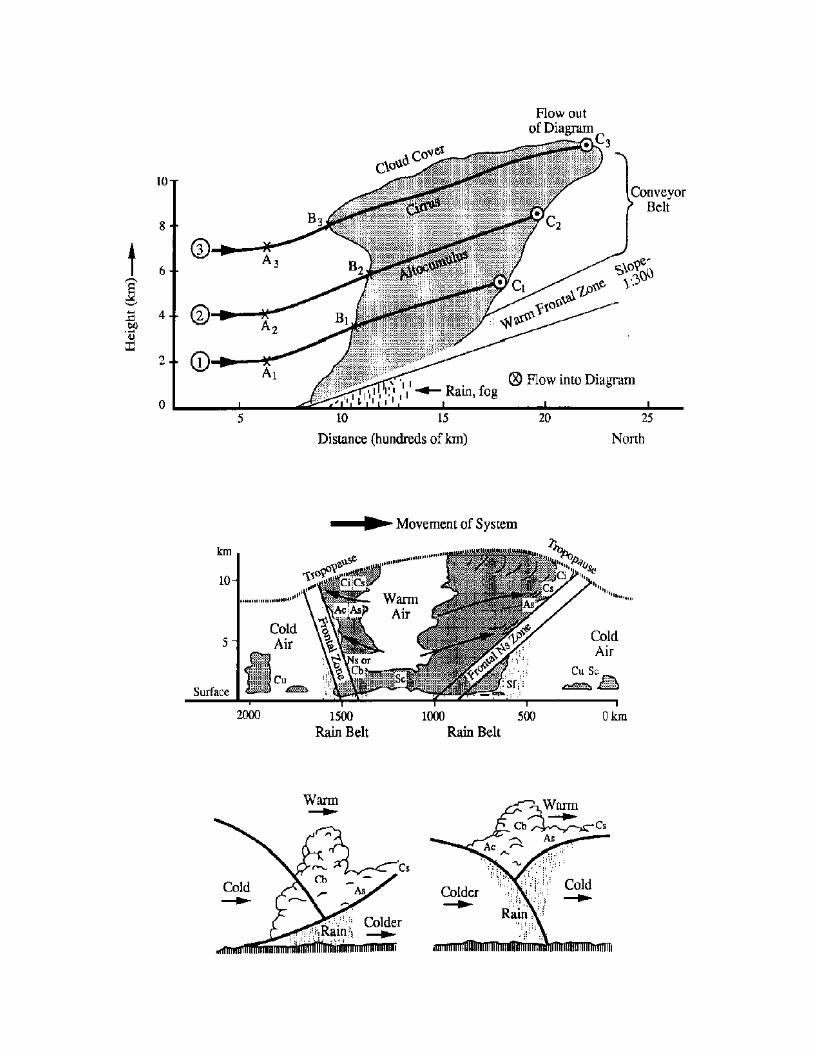
The Norwegian Cyclone Model A revolutionary method of weather map analysis and interpretation was involved in Norway during the war principally by V. and J. Bjerknes. This method stemmed from the Polar Front Theory of J. Bjerknes noted from his study of a dense network of surface observations in and around Scandinavia. He noted that the inflow into cyclones tended to be concentrated along two lines oriented generally ahead of the path of the storm and to its right. He further noted that the air in the portion of the cyclone partially enclosed by those convergence lines tended to be warmer than that in the remainder of the disturbance. The two lines were named, respectively, the steering line or warm front and the squall line or cold front, while the enclosed area was denoted the warm sector. The convergence lines, furthermore, were presumed to constitute the intersection of the earth’s surface and sloping surfaces of convergence in the atmosphere. Characteristic patterns of cloudiness and precipitation tended to be associated with the warm and cold front surfaces. Shortly thereafter, this model was viewed only as one phase in a typical life-history of cyclones, in which the disturbance was initiated along a pre-existing quasi- stationary front. As the disturbance gained intensity, the shape of the front was deformed in such a way as to produce the characteristic warm and cold fronts, finally overtaking it to produce the occluded front. The cyclone characteristically attained greatest intensity during the occlusion process, when the warm sector was forced aloft, the effective center of gravity of the system was lowered and potential energy of the mass stratification was converted into kinetic energy of the winds. Along with the concept of fronts came the corollary of air masses, whose properties and characteristic weather phenomena were extensively studied by Bergeron in Europe and Willett in North America. These new concepts were essentially three-dimensional in character, yet only fragmentary upper-level observations were available to aid in the formulation or confirmation of the Polar Front Theory. Forecasting thoroughly based upon sound physical concepts had to await the depiction of the complete atmospheric circulation at levels above the lowest layer. II. Modern Frontal Models The Norwegian Frontal Model has been elaborated upon by many current authors although its basic framework remains remarkably unchanged to the present. Various investigators have gone on to describe the nature of the “conveyor belt”, which is the stream of warm moist air which originates in the warm sector of the frontal wave and ascends to higher levels over the sloping frontal surfaces, mainly north of the warm front. The figure on the fourth page illustrates the movement of a ribbon of air in the conveyor belt which ascends north of the warm front and along the advancing cold front boundary. The retreating cold air, which is really old cold air from a previous cold air outbreak, has lost its equatorward push. Near the ground the air motion is largely easterly.
Transcript of The Norwegian Cyclone Model - shorstmeyer.com · The Norwegian Cyclone Model A revolutionary method...
The Norwegian Cyclone Model
A revolutionary method of weather map analysis and interpretation was involved in Norway during the war principally by V. and J. Bjerknes. This method stemmed from the Polar Front Theory of J. Bjerknes noted from his study of a dense network of surface observations in and around Scandinavia. He noted that the inflow into cyclones tended to be concentrated along two lines oriented generally ahead of the path of the storm and to its right. He further noted that the air in the portion of the cyclone partially enclosed by those convergence lines tended to be warmer than that in the remainder of the disturbance. The two lines were named, respectively, the steering line or warm front and the squall line or cold front, while the enclosed area was denoted the warm sector. The convergence lines, furthermore, were presumed to constitute the intersection of the earth’s surface and sloping surfaces of convergence in the atmosphere. Characteristic patterns of cloudiness and precipitation tended to be associated with the warm and cold front surfaces. Shortly thereafter, this model was viewed only as one phase in a typical life-history of cyclones, in which the disturbance was initiated along a pre-existing quasi-stationary front. As the disturbance gained intensity, the shape of the front was deformed in such a way as to produce the characteristic warm and cold fronts, finally overtaking it to produce the occluded front. The cyclone characteristically attained greatest intensity during the occlusion process, when the warm sector was forced aloft, the effective center of gravity of the system was lowered and potential energy of the mass stratification was converted into kinetic energy of the winds. Along with the concept of fronts came the corollary of air masses, whose properties and characteristic weather phenomena were extensively studied by Bergeron in Europe and Willett in North America. These new concepts were essentially three-dimensional in character, yet only fragmentary upper-level observations were available to aid in the formulation or confirmation of the Polar Front Theory. Forecasting thoroughly based upon sound physical concepts had to await the depiction of the complete atmospheric circulation at levels above the lowest layer. II. Modern Frontal Models The Norwegian Frontal Model has been elaborated upon by many current authors although its basic framework remains remarkably unchanged to the present. Various investigators have gone on to describe the nature of the “conveyor belt”, which is the stream of warm moist air which originates in the warm sector of the frontal wave and ascends to higher levels over the sloping frontal surfaces, mainly north of the warm front. The figure on the fourth page illustrates the movement of a ribbon of air in the conveyor belt which ascends north of the warm front and along the advancing cold front boundary. The retreating cold air, which is really old cold air from a previous cold air outbreak, has lost its equatorward push. Near the ground the air motion is largely easterly.


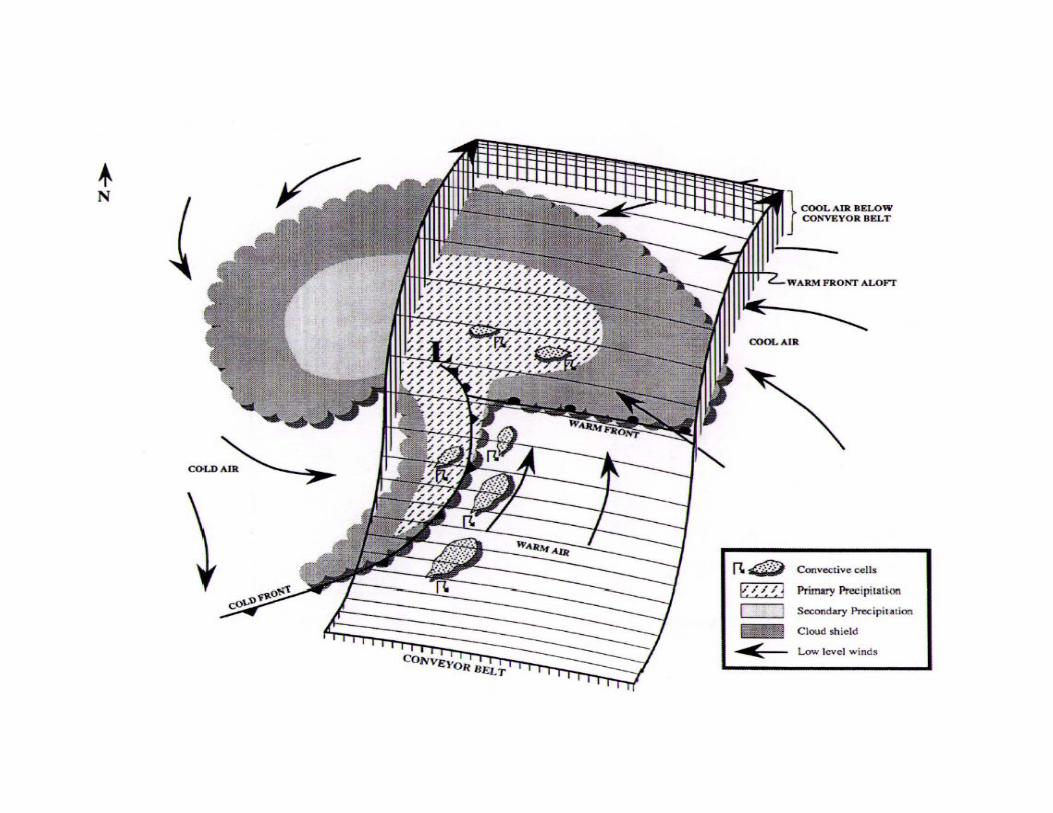
Precipitation resulting from ascent and condensation within the conveyor ribbon is shown by the stippling in an area north of the warm front and is called the “primary precipitation.” Simplistically, the figure shows the ribbon to have rather discreet edges to it. Ascent along the cold front on the left edge of the ribbon is rather abrupt, even violent due to the relatively steep slope of the cold frontal surface. However, the area of penetration by the ribbon west of the cold front surface position is relatively narrow and consequently the cold front precipitation tends to be fairly brief in nature. Heavy, sometimes convection (air rising vertically in towers) precipitation is characteristic of the cold front activity. Convection showers of an even more violent nature may be present in the warm air sector although these are usually confined to a zone fairly close to the front and aligned parallel with it where the stronger vertical wind shear and higher moisture content of the air (the trajectory has its most southerly extent in this area), form organized development of intense squalls. Indeed, the cumulumbus cells which form in this part of the warm sector may reach some tens of thousands of feet. Convective development behind the cold front is apt to be less violent than in the warm sector. Most of the sustained precipitation will generally occur north of the warm front where the conveyor belt ascends slantwise over the retreating cold air. Although warm front overrunning need not accompany a well developed frontal system and low pressure disturbance, its presence signals the likelihood of more development. Convection showers can also form in the conveyor ribbon although there is general vertical stability in this region. If the air above the conveyor belt is dry and forced to lift, vertical instability may develop over a limited vertical extent (perhaps 10 or 20,000 ft.) with continued lift resulting in the formation of middle level could turrets of altocumulus caslellatus. This is illustrated in the figure below.
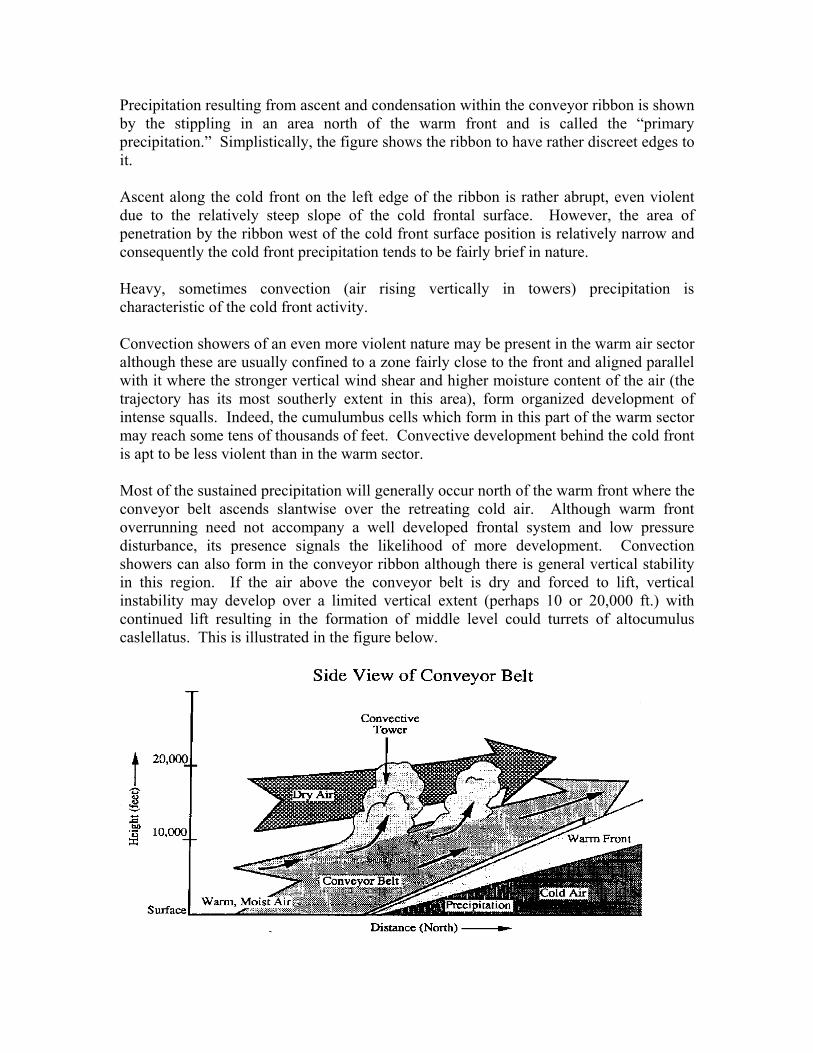
These middle level cells are a mesoscale phenomena. Precipitation forming from these cells may be briefly rather heavy but the convective processes are, on the whole, more gentle than those associated with the warm sector or the cold front. Various types of convection occurring on the cold side of the warm front are indicated by heavy shading in the in the plain-view of the conveyor belt. Harfold refers to the warm front convection as “cluster bands.” His analyses show that these cells do tend to be aligned in bands and rows in the ascending warm air. The next time you experience sustained warm front precipitation, watch for the intermittent heavier bursts of rain or snow which may be due to the presence of a cluster band cell. An illustration of these bands is shown below.
In the cold air beneath the rising conveyor band north of the surface warm front, the air may be initially quite dry and even sinking a bit. It is clear, however, that the continued fall of precipitation into the retreating cold air wedge will considerably moisten the air. We can imagine the formation of a secondary area of precipitation. Immediately west of the advancing cold front (actually an occluded front now) which results from the lifting of the moistened easterly flow in the retreating cold air wedge. This we depict by the light shaded area west of the occluded front and by an overlapping shaded area between the edge of the conveyor belt and the occluded front where both types of precipitation are occurring. The occluded front can actually be one of two types; either the retreating cold air is lifted by the advancing cold air or the advancing cold air is lifted by the retreating cold air, depending on which cold air is actually the coldest. See the following figures. The rising conveyor belt begins to turn clockwise toward the east as it ascends, eventually threading its way into the upper westerly flow. Far to the north and east, high and middle clouds mark the approach of the conveyor belt, first cirrus, thickening to cirrostratus, lowering to altostratus and altocumulus, then becoming (from ground view) stratus and finally (with precipitation) nimbostratus. The presence of higher cloud need not indicate that the air has come from low levels in the warm sector, gone through the precipitation processes, or has ascended to middle or upper levels with its moisture becoming squeezed out. Air may, in fact, have condensed at upper levels, depending on the moisture content of the ascending air. This is indicated by the figure below. Cirrus formation, for example, or it may already be present as the result of outflow from the upper parts of the cumulonimbus cells in the warm sector.
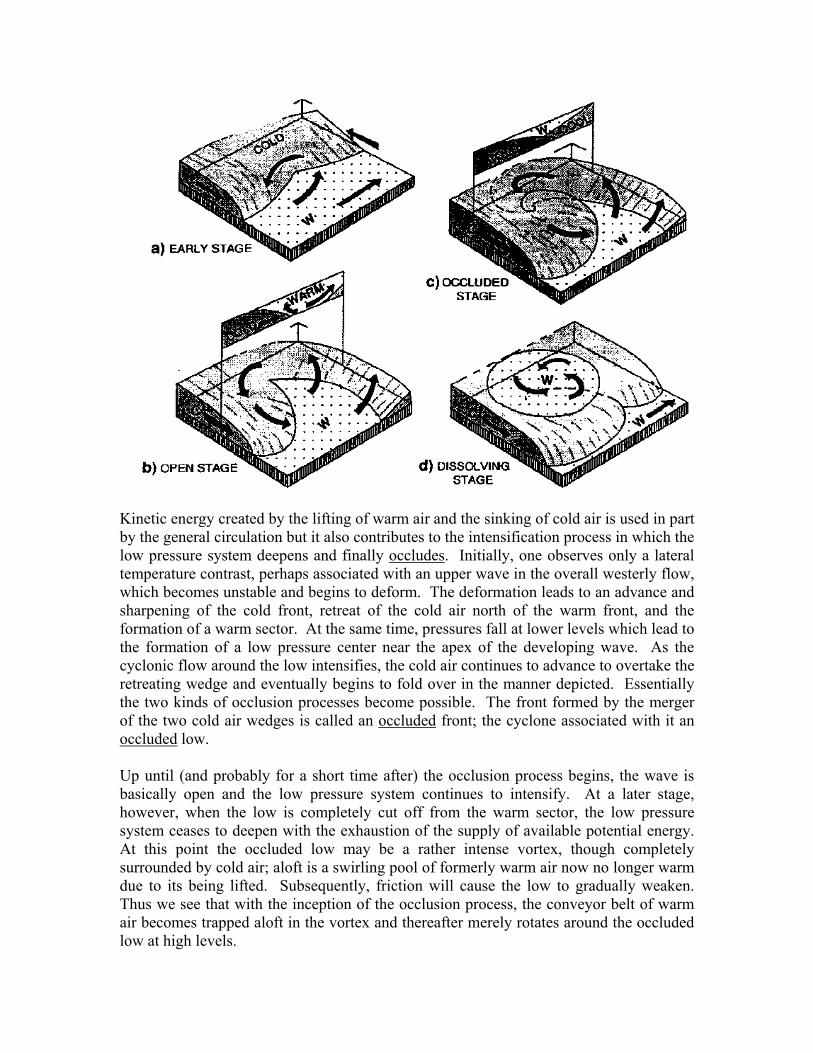
Kinetic energy created by the lifting of warm air and the sinking of cold air is used in part by the general circulation but it also contributes to the intensification process in which the low pressure system deepens and finally occludes. Initially, one observes only a lateral temperature contrast, perhaps associated with an upper wave in the overall westerly flow, which becomes unstable and begins to deform. The deformation leads to an advance and sharpening of the cold front, retreat of the cold air north of the warm front, and the formation of a warm sector. At the same time, pressures fall at lower levels which lead to the formation of a low pressure center near the apex of the developing wave. As the cyclonic flow around the low intensifies, the cold air continues to advance to overtake the retreating wedge and eventually begins to fold over in the manner depicted. Essentially the two kinds of occlusion processes become possible. The front formed by the merger of the two cold air wedges is called an occluded front; the cyclone associated with it an occluded low. Up until (and probably for a short time after) the occlusion process begins, the wave is basically open and the low pressure system continues to intensify. At a later stage, however, when the low is completely cut off from the warm sector, the low pressure system ceases to deepen with the exhaustion of the supply of available potential energy. At this point the occluded low may be a rather intense vortex, though completely surrounded by cold air; aloft is a swirling pool of formerly warm air now no longer warm due to its being lifted. Subsequently, friction will cause the low to gradually weaken. Thus we see that with the inception of the occlusion process, the conveyor belt of warm air becomes trapped aloft in the vortex and thereafter merely rotates around the occluded low at high levels.
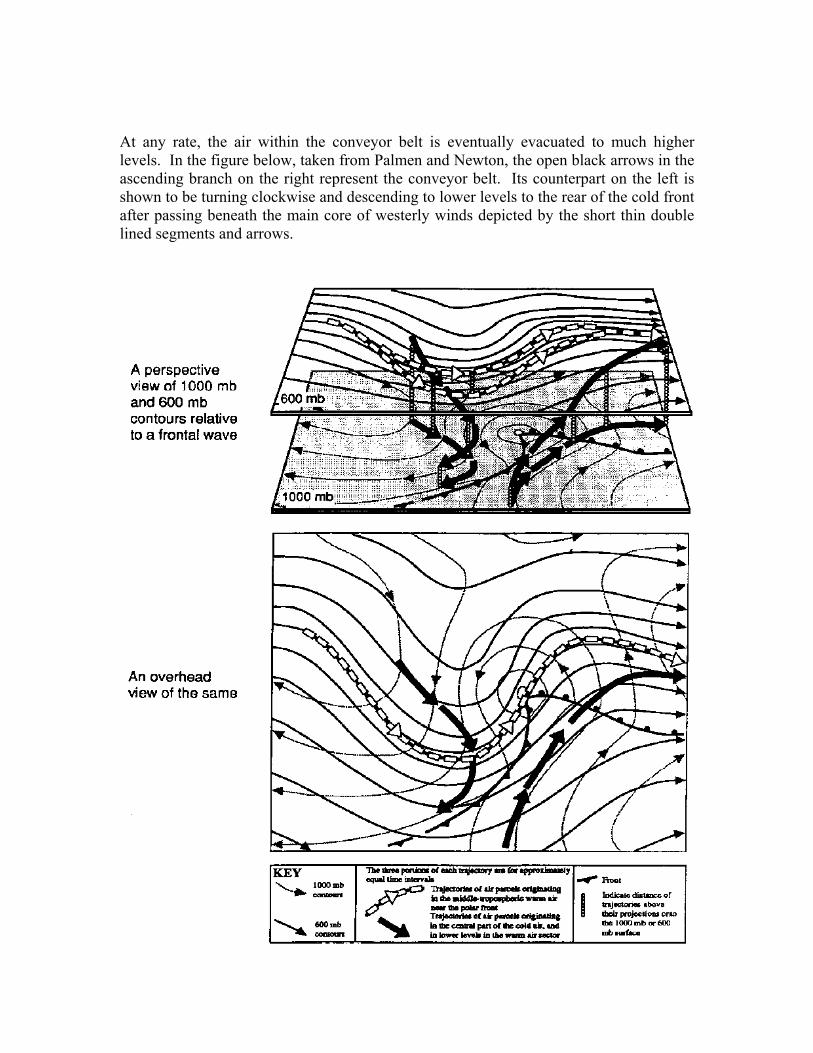
At any rate, the air within the conveyor belt is eventually evacuated to much higher levels. In the figure below, taken from Palmen and Newton, the open black arrows in the ascending branch on the right represent the conveyor belt. Its counterpart on the left is shown to be turning clockwise and descending to lower levels to the rear of the cold front after passing beneath the main core of westerly winds depicted by the short thin double lined segments and arrows.
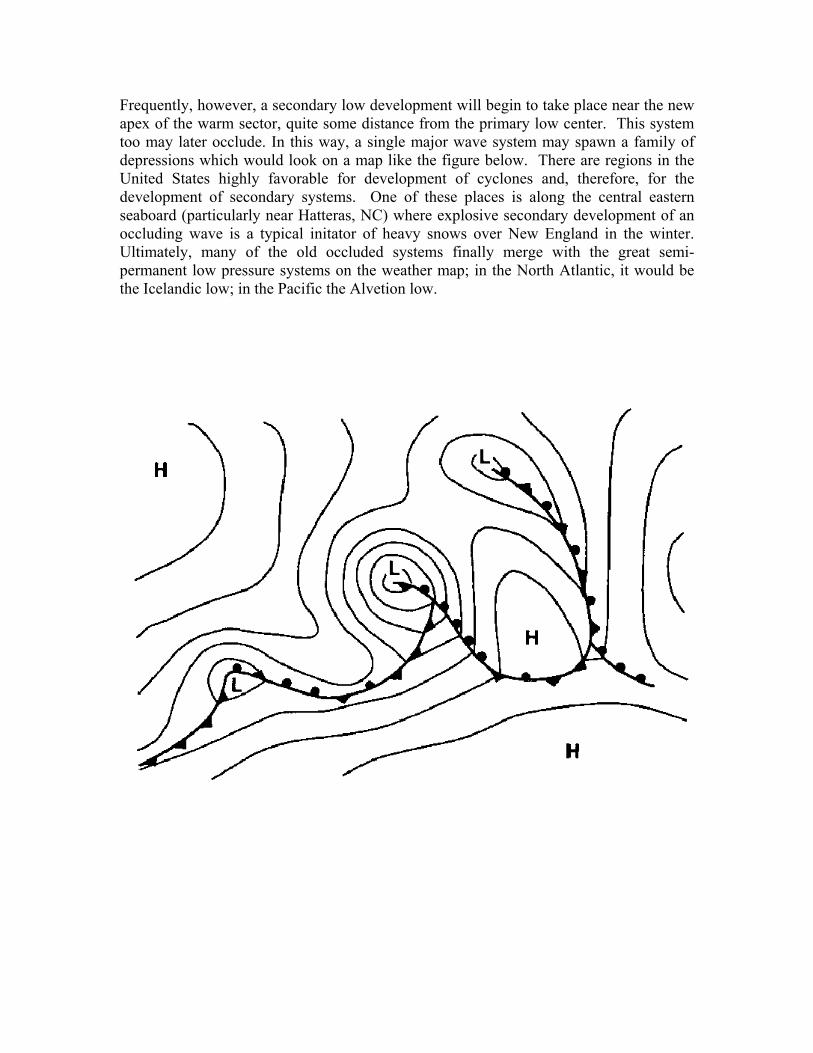
Frequently, however, a secondary low development will begin to take place near the new apex of the warm sector, quite some distance from the primary low center. This system too may later occlude. In this way, a single major wave system may spawn a family of depressions which would look on a map like the figure below. There are regions in the United States highly favorable for development of cyclones and, therefore, for the development of secondary systems. One of these places is along the central eastern seaboard (particularly near Hatteras, NC) where explosive secondary development of an occluding wave is a typical initator of heavy snows over New England in the winter. Ultimately, many of the old occluded systems finally merge with the great semi-permanent low pressure systems on the weather map; in the North Atlantic, it would be the Icelandic low; in the Pacific the Alvetion low.