The Northeast/Mid-Atlantic Profile of Environmental Public ... · The Johns Hopkins Bloomberg ....
46
The Johns Hopkins Bloomberg School of Public Health September 2008 The Northeast/Mid-Atlantic Profile of Environmental Public Health Practice
Transcript of The Northeast/Mid-Atlantic Profile of Environmental Public ... · The Johns Hopkins Bloomberg ....

The Johns Hopkins Bloomberg School of Public Health September 2008
The Northeast/Mid-Atlantic Profile of Environmental Public Health Practice

The Northeast/Mid-Atlantic Profile of Environmental Public Health Practice 2
The Northeast/Mid-Atlantic Profile of Environmental Public Health Practice
Johns Hopkins Bloomberg School of Public Health Project Staff
Beth Resnick, MPH Assistant Scientist
Thomas Burke, PhD
Associate Dean for Public Health Practice and Training
Joanna Zablotsky, MPH PhD Candidate, Research Assistant
Erik Janus, M.S.
Researcher
Brad Maggy
PhD Candidate, Research Assistant
Robin Dranbauer Administrative Assistant

The Northeast/Mid-Atlantic Profile of Environmental Public Health Practice 3
The Northeast/Mid-Atlantic Profile of Environmental Public Health Practice
Acknowledgements The authors of this report would like to thank the many individuals, and in particular all those interviewed, for their time, support and willingness to assist us in compiling this report. A special thanks to the Maryland Conference of Local Environmental Health Directors, the Maryland State-Local Environmental Health Liaison Committee, and the Virginia Environmental Health Managers for their continued support and assistance with this project. We want to acknowledge the support of the Environmental Services Branch of the National Center for Environmental Health of the Centers for Disease Control and Prevention, particularly Daneen Collier-Farrow for her continued support as our project officer. Furthermore, we would like to acknowledge Captain Patrick Bohan R.S., M.S., M.S.E.H whose vision and leadership helped to initiate this project. We would also like to thank Carolyn Leep and Patrick Bohan for their invaluable assistance in reviewing the report. Finally, we are grateful for the assistance of Robin Dranbauer in formatting and producing this report.

The Northeast/Mid-Atlantic Profile of Environmental Public Health Practice 4
The Northeast/Mid-Atlantic Profile of Environmental Public Health Practice
Table of Contents Contents Page Executive Summary…………………………………………………………………. .. 6
Introduction…………………………………………………………………………….. 8
Project Background……………………………………………………………………. 9 Environmental Public Health Infrastructure ………………………………………. 12 Environmental Public Health Workforce…………………………………………… 19 Training ………………………………………………………………………………..26
Funding………………………………………………………………………………...27 Technology ……………………………………………………………………………30 On-going Environmental Public Health (EPH) Challenges……………………… 31
• Growth and Development……………………………………………….. 32 • Emergency Preparedness………………………………………………. 33 • Climate Change………………………………………………………….. 36 • On-Going Challenges…………………………………………………… 37
The Road Ahead……………………………………………………………………... 37 Summary of Findings and Call to Action…………………………………………... 38 References……………………………………………………………………………. 41
The Northeast/Mid-Atlantic Profile of Environmental Public Health Practice 5
The Northeast/Mid-Atlantic Profile of Environmental Public Health Practice
Table of Contents (con’t)
Contents Page Figures and Tables
Figure 1 Northeast/Mid-Atlantic Region……………………………………… 9 Figure 2 Environmental Health Services…………………………………….. 11 Figure 3 The Environmental Public Health Web…………………………......13 Figure 4 Environmental Health Knowledge Areas………………………….. 20 Figure 5 Comparison of Average Wage Trends for Selected Professions– 1999 to 2006………………………………………….. 22 Figure 6 Comparison of Workers (age 45+) in Government and Private Sector Jobs: 1994-2006………………………………..24 Table 1 State and Local Environmental Public Health Agency Structure in the Region……………………………………………....16 Table 2 Population Growth Rates in the Region…………………………… 32 Table 3 Land Development Rates in the Region……………………………33
Appendix State Profiles
Connecticut Delaware District of Columbia Maine Maryland Massachusetts New Hampshire New Jersey New York Pennsylvania Rhode Island Vermont Virginia

The Northeast/Mid-Atlantic Profile of Environmental Public Health Practice 6
Executive Summary As we enter the 21st century, ensuring a healthful environment is critical to the
well being of our nation. Food, water, and sanitation protections remain the traditional cornerstone of the nation’s public health efforts. However, realities such as preparedness, emerging contaminants and infectious diseases, growth and development pressures, and climate changes present new challenges to anticipate, respond and prevent environmental public health (EPH) threats. From food-borne illness outbreaks to chemical emergencies, drinking water safety to extreme weather events, our state, county, and city EPH professionals are essential to the nation’s overall health.
Today’s EPH professionals must be well prepared to adequately address these increasingly complex EPH threats. State and local EPH programs are the backbone of these efforts, but vary considerably in structure, capacity, and function and face many challenges. This Profile report by the Johns Hopkins Bloomberg School of Public Health, examines state and local EPH programs in the Northeast/Mid-Atlantic Regiona of the United States. Based on the findings, a Call to Action is offered to ensure adequate EPH protections to safeguard the health and well-being of the Region. Summary of Findings & Call to Action Varied Leadership, Structure & Authority Finding: The EPH system is a complex, diverse web of agencies, institutions and legislative bodies at all levels of government. Although this disparate system provides opportunities for multi-disciplinary approaches and collaborative efforts, it has created an EPH leadership void and uncoordinated EPH approaches. Call to Action: Establish a designated EPH leadership structure at each level of government (federal, state and local) with defined roles and responsibilities. Aging Workforce Finding: Current EPH leadership is dedicated and committed; however, nearly 25% will be eligible to retire within the next 5-10 years1,2 An aging workforce along with recruitment and retention challenges threaten the ability to maintain adequate EPH protections.
a The Northeast/Mid-Atlantic region includes the following 13 jurisdictions: CT, District of Columbia (DC), DE, MA, MD, ME, NJ, NJ, NY, PA, RI, VT, and VA.

The Northeast/Mid-Atlantic Profile of Environmental Public Health Practice 7
Call to Action: Employ the dedication, commitment and institutional knowledge of current EPH professionals to prepare the next generation of leaders. Strengthen recruitment, retention, and enumeration efforts to ensure an adequate EPH workforce. Training Gaps Finding: EPH training opportunities are available, particularly in preparedness. Moreover, collaborative efforts with academic institutions are on the rise. However, as the field of EPH continues to evolve and new threats emerge, training must be available to enable EPH professionals to learn new skills and work in new environments. Call to Action: Expand existing partnerships with academic institutions and other EPH organizations to ensure relevant education and training is available to anticipate, respond to, and prevent future EPH threats. Technological Challenges Finding: Many technological advances have enhanced EPH programs and data access. Yet, the majority of these advances have been implemented within individual agencies, curtailing the ability to coordinate efforts and share information with other EPH partners. Additionally, adequate information technology training and technical support remains a challenge. Call to Action: Develop EPH technology protocols, data standards and collection procedures to allow for compatibility and comparability across jurisdictions and agencies. Provide adequate funding not only to purchase, but also to maintain and utilize technology effectively. Funding Needs Finding: Since 2002, additional federal preparedness dollars have greatly enhanced the EPH infrastructure. It is critical to sustain this level of federal support and make certain that state and local governments uphold their financial commitments to ensure adequate EPH protections

The Northeast/Mid-Atlantic Profile of Environmental Public Health Practice 8
Call to Action: Establish mechanisms to maintain federal EPH support and ensure that state and local governments uphold their EPH financial commitments. On-Going EPH Challenges Finding: EPH practitioners must be prepared to handle both existing and emerging EPH challenges. Effective tools and services must be available to anticipate, respond, and prevent these EPH threats. Call to Action: Develop a strategic plan for EPH that allows for flexibility, continuing education, partnerships, and adequate surge capacity to address unanticipated EPH emergencies and emerging threats. Introduction According to Healthy People 2010, public health’s mission is “to prevent epidemics and the spread of disease, protect against environmental hazards, prevent injuries, promote and encourage healthy behaviors, respond to disasters and assist communities in recovery, and ensure quality and accessibility of health services.”3 The practice of environmental public health (EPH)—assuring safe food and water, healthy air, and protection from environmental threats—is vital to fulfilling this public health mission. Yet, several studies have found the EPH infrastructure inadequate to fulfill its portion of the public health mission. According to the Institute of Medicine’s (IOM)’s 1988 The Future of Public Health report, "the removal of environmental health authority from public health agencies has led to fragmented responsibility, lack of coordination, and inadequate attention to the public health dimensions of environmental issues.”4 The National Environmental Health Association (NEHA)’s 1992 The Future of Environmental Health report, found “the nation does not have an environmental health and protection system, but a confusing patchwork of often overlapping and competing agencies having different and sometimes conflicting missions and divergent priorities.”5 In 2001, the Pew Environmental Health Commission reached a similar conclusion. In their groundbreaking report, the Commission stated, “the nation has a critical lack of capacity in public health agencies at the state and local level to address growing environmental health needs.”6
Despite the findings from these national reports, scant attention or resources have been dedicated to enhancing the EPH infrastructure. In particular, this neglect has been evident at the state and local level. State and local agencies are the backbone of the EPH infrastructure, together providing the bulk of EPH services delivered to

communities. Yet, as this report reveals, the manner and extent to which EPH services are provided varies greatly by state and local jurisdiction. Consequently, the overarching goal of this report is to provide a comprehensive assessment of the EPH infrastructure in the Northeast/Mid-Atlantic Region, outlined in Figure 1, heretofore referred to as “the Region.” As such, the objectives of this report are to: 1) describe and assess the breadth and depth of EPH infrastructure and service delivery across the study Region, 2) demonstrate the critical importance of EPH to the overall health and well-being of the Region’s communities; and 3) provide a call to action to build on the identified strengths as well as address critical EPH infrastructure needs. Figure 1 - Northeast/Mid-Atlantic Region
Project Background In 2003, the Johns Hopkins Center for Excellence in EPH Practice (JHU Center) published the Profile of Maryland Environmental Public Health Practice report (Maryland Profile).7 This report, funded by the Centers for Disease Control and Prevention (CDC), was conducted in collaboration with Maryland state and local health officials and provided a comprehensive review of local EPH practice. Similar to the national study findings, the Maryland Profile revealed a dedicated workforce grappling with a “fragile, neglected, fragmented, and under-funded environmental public health infrastructure.”8 Based on these findings, the report offered recommendations on critical issues such as workforce development, funding, technology, and legal authority to protect the future health and well-being of all Marylanders.
“The public health infrastructure in Maryland is stronger as the result of this landmark study, The Profile of Maryland Environmental Public Health Practice. Study findings and recommendations provided critical information when updating the Memorandum of Understanding between the State Environment and Health agencies and Maryland’s 24 county health departments in 2006. The Profile provides sustained value by highlighting the need for continued meetings of these parties to address workforce, funding, policy, planning, training, technology, and communication issues.”
Frances Phillips, County Health Officer for Anne Arundel County, Maryland
The Northeast/Mid-Atlantic Profile of Environmental Public Health Practice 9

The Northeast/Mid-Atlantic Profile of Environmental Public Health Practice 10
The Maryland Profile has served as a catalyst for collaboration amongst state and local Maryland EPH officials. Inter-agency communication and collaboration have been strengthened to address key needs, such as workforce recruitment, training, and career advancement.
As a result of the Maryland accomplishments, the JHU Center received additional
funding from the CDC to conduct an expanded assessment effort in the Northeast/Mid-Atlantic area to examine EPH infrastructure, capacity, strengths, needs, and challenges. The study region included the following 13 jurisdictions: CT, DE, District of Columbia (DC), MA, MD, ME, NJ, NH, NY, PA, RI, VA, and VT. For simplicity, the study area is referred to as the “Region” and the District of Columbia is regarded as equivalent to a state jurisdiction. Approach To assess the capacity, strengths, needs, and challenges of the Region’s EPH infrastructure, investigators focused their efforts on state agencies that were engaged in EPH service delivery and local departments that operated either within the authority of the state agency, or served as an independent provider of EPH services outlined in Figure 2. The study was framed by the Pew Environmental Health Commission definition of environmental health - “Those aspects of human health, including quality of life that is determined by interactions with physical, chemical, biological and social factors in the environment. It also refers to the theory and practice of assessing, correcting, controlling and preventing those factors in the environment that may adversely affect the health of present and future generations.”9

Figure 2 - Environmental Health Services
State and Local Environmental Public Health Services in the Northeast/Mid-Atlantic Region
State and Local Environmental Public Health Services in the Northeast/Mid-Atlantic Region
Air Quality
The Northeast/Mid-Atlantic Profile of Environmental Public Health Practice 11
Outdoor Air
Indoor Air
Air QualityOutdoor Air
Indoor Air
Animal ServicesAnimal Control
RabiesQuarantine
Animal ServicesAnimal Control
RabiesQuarantine
EpidemiologySurveillance
Outbreak InvestigationZoonotic Disease
Vector-borne Disease
EpidemiologySurveillance
Outbreak InvestigationZoonotic Disease
Vector-borne Disease
yWater QualitWetland and Waterways
Fish/ShellfishBeaches
Drinking WaterWastewater
Inspection/Permitting
Water QualityWetland and Waterways
Fish/ShellfishBeaches
ency Prepa
Drinking WaterWastewater
Inspection/Permitting
Emerg rednessBiologicaChemical
Radiologica
l
l
Natural Disasters
Emergency PreparednessBiologicalChemical
Radiological
Food & Drug Safety
Natural Disasters
Commercial Food ProcessingConsumer Product Protection
Retail Food Inspection/Permitting
Investigation/Surveillance
Food & Drug SafetyCommercial Food ProcessingConsumer Product Protection
Retail Food Inspection/Permitting
Investigation/Surveillance
Plan ReviewBuilding Inspection/Permit
Onsite Water and SewerPercolation Testing
Plan ReviewBuilding Inspection/Permit
Onsite Water and SewerPercolation Testing
Outreach and EducationWebsiteTraining
Community EngagementHealth Education
Outreach and EducationWebsiteTraining
Community EngagementHealth Education
Nuisance ComplaintsWater
AirSoil
NoiseAnimalOdor
Nuisance ComplaintsWater
AirSoil
NoiseAnimalOdor
lEnvironmentaHazardous and Solid Waste
BrownfieldsPesticides
Risk AssessmenToxicology
t
Lead
EnvironmentalHazardous and Solid Waste
BrownfieldsPesticides
Risk AssessmentToxicology
Lead
Licensing and Permitting
Nursing HomesSchoolsCamps
Daycare Facilities
Licensing and Permitting
Nursing HomesSchoolsCamps
Daycare Facilities
Services in Italics are generally provided by state agencies,while services in Plain Text are generally provided by local agencies.
Investigators developed a multi-step research process that was approved by the Johns Hopkins Bloomberg School of Public Health Institutional Review Board. First, a comprehensive literature review of EPH infrastructure reports, documents and materials, as well as pertinent documents for each state in the study region was conducted. The state specific materials, including government infrastructure and budget reports, along with environmental monitoring, census and health surveillance data, were used to create a series of state profiles located in the appendices of this report. The literature review findings framed the second qualitative phase of the study, telephone and face to face interviews with EPH practitioners. Study investigators utilized a “snowball” sampling technique for the qualitative outreach efforts. This method involves asking each outreach participant for referrals to others with information relevant to the study and contacting those individuals in turn.10
The initial outreach list was developed by identifying key leadership in the state and local agencies involved in EPH, including at the state level agencies such as health, environment, agriculture, and natural resources and, at the local level, representatives from county and city health agencies. Additionally, investigators contacted other relevant organizations, such as state associations of EPH directors.

The Northeast/Mid-Atlantic Profile of Environmental Public Health Practice 12
Each identified individual was contacted by phone or e-mail and requested to participate in a face to face meeting or telephone call to last approximately one hour. An interview guide was developed to ensure a consistent format was used in each interview. The guide was framed by the literature review findings, as well as the survey utilized in the 2003 Maryland Profile project. The interview guide was reviewed and pilot tested by EPH practitioners from the Region and addressed the following topic areas: EPH budget, workforce, technology, preparedness, and legal authority. Furthermore, all study interviewees were asked to provide feedback on the project, as well as recommendations for other key contacts. Generally, three to four key leaders were interviewed from each state; a total of 39 interviews were conducted. The interviewees offered a wealth of expertise and experience. For the most part, they had over 20 years of EPH experience, served in their current leadership positions for at least five years, and will be eligible for retirement within the next five to ten years. Although some of the interviewees were from environmental or other related agencies or associations, the majority of the interviewees (29) worked at state or local health departments. In addition to the key informant interviews, when schedules and resources allowed, face-to face meetings were held with state and/or local EPH groups. Meetings were conducted in three states (MD, PA and VA) and were generally a ½ day in length. The meeting discussions were framed by the survey, while allowing for additional free-form discussion and exchange of ideas Environmental Public Health Infrastructure EPH responsibility and authority rests within a complex web of agencies, institutions and legislative bodies at all levels of government. Building on the “Environmental Web” diagrams conceived in a 1997 report by Burke et al. 11 Figure 3 lays out the EPH infrastructure at the federal, state and local levels. Following a general overview of EPH structure, a more detailed description of the infrastructure specific to the study region is presented.

Figure 3 - The Environmental Public Health Web
Federal LevelPrimary Public Health Authority
Surgeon GeneralPrimary Public Health Authority
Surgeon GeneralExecutivePresident
ExecutivePresident Legislative
CongressLegislativeCongress
DOE
Local LevelLegislative
City CouncilTown Meeting
County CommissionersTribal Council
LegislativeCity Council
Town MeetingCounty Commissioners
Tribal Council
ExecutiveMayor
County ExecutiveCity Manager
ExecutiveMayor
County ExecutiveCity Manager
Primary Public Health AuthorityBoard of HealthHealth Officer
Primary Public Health AuthorityBoard of HealthHealth Officer
The Environmental Public Health Web
Agency Administrators/SecretariesAgency Administrators/Secretaries
HUD DOD CPSCDHSDOI DOL
State LevelEPADHHSUSDA DOT
LegislativeState legislatureLegislative
State legislatureExecutiveGovernor
ExecutiveGovernor
Primary Public Health AuthorityState Board of Health
Councils/Commissions
Primary Public Health AuthorityState Board of Health
Councils/Commissions
Agency Administrators/SecretariesAgency Administrators/Secretaries
Agency DirectorsAgency
Directors
Other(s) ConsumerProtectionLicensingEducationEmer.
Mgmt.Policy/
PlanningEnviron.HealthAgric.
Parks &RecreationPublic Safety Licensing Code
EnforcementZoningEducation Public
WorksHealthOther(s) Environment
Federal EPH At the federal level, the EPH infrastructure was significantly altered in 1970 by the establishment of the United States Environmental Protection Agency (EPA). Many programs previously housed within other federal agencies, such as the Departments of Health and Human Services, Agriculture, and Education and Welfare, were shifted to the EPA.12 These federal agencies share responsibility and authority over federally mandated or regulated EPH issues (e.g., Safe Drinking Water Act). However, primary enforcement authority and responsibility are often given to an authorized, approved, or delegated state agency.13 Furthermore, federal agencies have the lead responsibility for any international or interstate EPH issues such as food imports and transportation of hazardous materials across state lines. In coordination with these agencies, there are a number of national councils and committees, such as the White House Council on Environmental Quality (CEQ) and the EPA’s Children’s Health Protection Advisory Committee, which provide EPH oversight and guidance. State EPH Over the next few decades, the shift of EPH programs to the EPA was replicated at the state levels. Presently, all but five states have independent state EPAs.b,14 State level EPH responsibilities are generally shared among four to six agencies such as
The Northeast/Mid-Atlantic Profile of Environmental Public Health Practice 13
b Five states with environment and health still housed together within one state agency: Colorado, Hawaii, Kansas, North Dakota, and South Carolina.

The Northeast/Mid-Atlantic Profile of Environmental Public Health Practice 14
Health, Environment, Agriculture, Natural Resources, and Labor. In coordination with these agencies, there are state boards, councils and committees that serve either in an advisory and/or policy-making capacity such as state boards of health or other specific entities such as state air quality councils.
State agency organization, as well as the distribution of EPH functions, varies
greatly from state to state. The bulk of EPH responsibilities at the state level are generally shared by the departments of health and environment; however, there are other state agencies such as agriculture, natural resources, education, and planning that generally have some EPH functions. State health departments can be either stand-alone agencies or a division within a larger agency such as a department of health and human services. For the most part, state environmental protection agencies are stand alone agencies; however, in some cases they are together with other departments, such as natural resources. Furthermore, these state agency constructs often change in response to social, political, and economic trends. The National Governor’s Association reported that during 2003, almost half the states in the nation (22) “considered, planned or implemented structural changes to their state health agency.” 15 For example, the recent trend to streamline government functions for more “efficient” government and resource allocation has occurred in the region, as demonstrated by Maine’s 2004 merger of the Departments of Human Services and Behavioral and Developmental Services into the Department of Health and Human Services.16, 17
State health and environmental agencies, with delegated authority from the
federal government, generally have primary responsibility for federally mandated or regulated EPH issues within their state, such as drinking water, pesticide applications or wetland protection. States can also enact their own environmental policies which must meet the federal standards or be more stringent, if desired.18
With regards to specific programmatic areas, such as restaurant or swimming
pool inspections, states often delegate authority to local agencies to direct these programs. The state role for these delegated programs usually includes establishing criteria and guidelines for the local agencies, providing some funding, offering technical and training support when needed, and, in some cases, providing regulatory authority. When there is no local agency available, which tends to occur in sparsely populated areas or in geographically small states such as Delaware and Rhode Island, state agencies are usually directly responsible for all EPH programs and services.19
Local EPH
The tenth amendment to the United States Constitution gives states the authority to establish local governments.20 Each state established their own individual system of local government based on a variety of factors such as state history, economic influences, and cultural traditions. States, for the most part, have at least two layers of local government: counties and municipalities. There are various forms of municipalities, such as cities, towns, townships, boroughs, or villages.

The Northeast/Mid-Atlantic Profile of Environmental Public Health Practice 15
Authority granted to these counties and municipalities varies widely, by state and even among localities within a state, as populous metropolitan jurisdictions tend to have more localized authority. Overall, in a 2004 Association of State and Territorial Health Officials (ASTHO) survey of statewide preparedness coordinators, about half (51%) characterized their state as decentralized, with the majority of public health authority at the local level, 28% indicated their state is centralized with public health authority housed at the state-level, and the remaining states (21%) characterized their states mixed or shared, thus public health authority rests at both the state and local levels21. Thus, with varying forms of local public health authority many localities have the ability to set their own environmental ordinances, regulations, and statutes, as long as they at least meet the state standards. This can result in neighboring jurisdictions with varying rules and regulations. These local agencies operate in coordination with a variety of local boards and commissions, such as local boards of health and local zoning commissions, which can serve in a governing, policy making, and/or advisory capacity. According to the National Association of County and City Health Officials (NACCHO) 2005 Profile of Local Health Departments (2005 NACCHO Profile) 74% of local health departments indicated that they have some form of a local board of health in their jurisdiction.22
This mix of state and local authority can play out in a variety of ways. For example, a local agency may have responsibility for individual drinking well inspections, yet enforcement powers reside with a state agency. In other instances, such as well drillers, a state may license the regulated entities, but local governments are responsible for inspections
and/or enforcement.
History has profound implications on the modern-day workings of local government. New England, due to climate and soil conditions, developed mainly as a commercial and industrial area. New England’s coast, with its many indentations, became home to many harbor villages and towns. This urbanization, along with the New England penchant for “individualism,” led to the establishment of strong local governments. Strong localized government carries on today in the form of “town meetings,” which are unique to New England. Town meetings allow all citizens to directly participate in local governance. Following this town-centered model, individual town health departments and town boards of health were established and are still in existence. In the present day, these agencies and boards have the authority to enact town environmental ordinances, make zoning decisions, and set fees for services.27
A significant difference in EPH structure at the local level, as compared to state and federal levels is the general absence of separate health and environment agencies. For the majority of local jurisdictions, except for more populous areas, health and environment programs are housed together within a local health department. Although local agencies such as public works or planning may have some EPH functions, the bulk of local EPH services are typically provided by a local health department. Local health departments are most often county or municipality-based. However, other types of arrangements do exist, such as a consolidated city-county agency, or a regional public health district, which can cover several municipalities or counties. The total number of local health departments within a state varies widely. According to the 2004 ASTHO survey, 27% of states reported 0-10 local health departments, 24% reported 11-50, 36% reported 51-100, and 13% reported over 100.21

Similar to federal and state EPH structures, local EPH structures are not static. Rather, they continually evolve in response to social, economic and political trends, such as the recent trend to regionalize local health departments. This trend was brought about in part because of capacity requirements for agencies to obtain federal preparedness funds; requirements that small municipal agencies often fail to meet given their independent operation.23 Interviewees corroborated this finding, as participants from New Jersey and Connecticut mentioned efforts underway to link small municipal health departments into regional or district entities.
EPH Infrastructure in the Region
Given the complex and varied nature of the EPH infrastructure, it is not surprising that the review of the Region revealed a wide range of organizational systems at the state and local levels. The specific structure for each state is outlined in the State Profiles and Table 1 provides a summary.
Table 1 - The Region’s State and Local Health Environmental Public Health Agency Structure
The Northeast/Mid-Atlantic Profile of Environmental Public Health Practice 16

The Northeast/Mid-Atlantic Profile of Environmental Public Health Practice 17
All states in the Region have separate state environment and health agencies.c, d
State health departments were stand-alone departments in eight states (CT, DC, MA, MD, NY, PA, RI, VA) and part of a larger health and human service “Super” agency in five states (DE, ME, NH, NJ, VT). State environmental agencies were stand-alone departments in all but two states (ME, VT).e
Within the Region, typically the bulk of EPH responsibilities at the state level are
shared among the departments of health and environment; however, other state agencies such as agriculture, natural resources, education, and planning do have some EPH functions. There is a wide range in the total number of state agencies with some EPH functions: there are six state agencies with EPH functions in CT, MA, MD, NH, NJ; five state agencies with EPH functions in ME, RI; four state agencies with EPH functions in VA; three state agencies with EPH functions in PA; and two state agencies with EPH functions in DC, DE, NY, VT. The EPH structure, function, and responsibilities of these state agencies varies widely. In three states (DE, RI, VT), nearly all EPH services are provided by state agencies. In the District of Columbia, services are provided by City agencies only. In the remainder of the Region (PA, MD, NY, NJ, CT, NH, ME, VA, ME), services are provided by both state and local agencies.
Local level structure varies even more widely than state structure. For the most
part, except in populous areas, such as NYC and DC, there are no separate local environmental agencies. Health and environment programs are housed within a local health department. Thus, except in the three states with no local health agencies (DE, RI, VT) or less populous areas within a state that have no local health agencies, the bulk of local EPH services in the Region are provided by local health departments. However, in most jurisdictions there are some other local agencies, such as public works and planning, with some EPH functions.
Local government in the Region can typically be categorized as either town or
county based; however, there are some local government exceptions within every state. Five states (CT, MA, NJ, RI, VT) generally opt for local town (borough or township) based governments that are unique to this Region. These town-centered states have differing EPH structures. In three (CT, MA, NJ), there are over 80 health departments in each state, as the majority of towns either have their own local health agency or have joined together to form county or district agencies that provide local EPH services. In addition, Connecticut also has two tribal health departments. In the other two states (RI, VT), there is usually a single town health officer with limited EPH authority and no other local health agencies, thus the majority of local EPH services are provided by state agencies.
c This includes the District of Columbia, which established a separate Department of the Environment in 2005 d Note, New York does have a Center for Environmental Health within the Department of Health. e Two states with environment departments combined into larger departments: Maine Department of Natural Resources and Environmental Control and the Vermont Department of Environmental Conservation which is housed within the Vermont Department of Natural Resources

In Pennsylvania, restaurant inspections are handled by multiple state and local agencies. All food establishments must follow the Pennsylvania Food Code;28 however, individual jurisdictions can adopt their own more stringent standards.29 Four city and six county health departments conduct their own food establishment inspections; the remainder of the state is under the purview of the Pennsylvania Department of Agriculture.30 This piecemeal structure results in a variety of inspection practices, regulations and fees throughout the state. Furthermore, the local health departments have authority over other inspection areas, such as water and plumbing, whereas the Department of Agriculture does not.31 Moreover, in some areas of Pennsylvania, usually sparsely populated jurisdictions, a local board of health may also have responsibility for some food establishment inspections. These local boards of health are not health departments and are independent from the state agencies.32 Thus, restaurant owners must navigate through this complex web of varying rules and regulations. Additionally, a different state agency, the Department of Health, handles the investigation of food-borne outbreaks.
Four states in the Region (DE, MD, NY, VA) favor county-based local governments. In two (MD, NY), there are county health departmentsf that provide local EPH services, MD has 24 and NY has 58 county health departments. In Virginia the county based health agencies, except for a few larger metropolitan areas, have been organized into 35 health districts that provide EPH services. In Delaware, there are no local health departments, thus EPH services are provided by the state agencies.
Lastly, three states in the Region (ME, NH, PA) have varied structures; local health agencies can be county, city or town-based and provide some EPH services. Pennsylvania has ten county or city health departments, New Hampshire and Maine both have two city health departments, and Maine also has five tribal health departments. Additionally, in all three of these states, there are many towns with only a single health officer with limited EPH authority and no local health agency present. In these jurisdictions, the bulk of local EPH services are provided by state agencies.
With regards to EPH authority, there are a variety of structures within the Region. These systems are difficult to categorize, as most of the states have certain exceptions, such as larger municipalities with more localized authority. In general, four states favor a centralized approach with the bulk of EPH authority residing at the state level (DE, RI, VA, VT); five others overall opt for stronger local EPH authority (CT, DC, MA, NJ, NY); and the remaining four (MD, ME, NH, PA) have a mix of EPH authority among state and local agencies.24 Furthermore, there are Boards of Health at the state and local levels that serve in varying governing, policy making, and/or advisory capacities.25 Seven states within the Region have state boards of health (DC, MA, NJ, NY, RI, VT, VA),26 and all states, except for RI and DE, have some form of local boards of health.
Public Health Infrastructure Conclusion The wide assortment of EPH structures creates many challenges to effective EPH practice. The IOM reported that the creation of the EPA resulted in “fragmented responsibility, lack of coordination, and inadequate attention to public health dimensions of environmental issues.”33 With regards to EPH authority, the IOM found, “the law relating to public health is scattered across countless statues and regulations at the state
The Northeast/Mid-Atlantic Profile of Environmental Public Health Practice 18
f Note, in Maryland and New York, investigators considered Baltimore and New York City equivalent to county jurisdictions

The Northeast/Mid-Atlantic Profile of Environmental Public Health Practice 19
and local levels and is highly fragmented among the states and territories.”34 This complex organizational system directly translates to EPH practice at the state and local levels.
While the separation of environmental programs from health agencies at the Federal and state levels has been beneficial in many ways - leading to collaborative efforts, effective regulations and new research on the environment - many drawbacks exist. Often, the fragmentation of health and environmental agencies results in agencies with distinct missions without adequate support and staff to properly share data and information, as well as coordinate efforts with one another and their constituencies.
This piecemeal system has resulted in many agencies involved in EPH, but no one agency or individual in charge. This leadership vacuum makes it difficult to make decisions, collaborate effectively, gather accurate and complete EPH data, and develop a clear vision for EPH. This was corroborated by the Pew Environmental Health Commission finding that “there is a national leadership void, resulting in little or no coordination of environmental health activities.”35 A consistent EPH vision and coordinated EPH approaches are necessary to ensure adequate EPH protections. A designated EPH leadership structure at the federal, state and local governmental levels is critical to the implementation of this vision.
Environmental Public Health Workforce
The complex, interdisciplinary nature of EPH, as well as the numerous agencies involved, and variation in governmental structures hampers the collection of accurate and complete EPH workforce data. However, it is clear that EPH professionals constitute a significant portion of the total public health workforce. Previous public health workforce enumeration efforts have estimated the EPH workforce to account for 10% - 20% of the overall public health workforce.36, 37 The 2005 NACCHO Profile found that 10% of the nation’s local health department workforce is comprised of EHP professionals, behind only the nursing (24%) and clerical staff (27%) categories.38 It is important to note that the majority of these enumerations are likely underestimates, as they reflect health department personnel only, excluding EPH professionals at environment or other agencies with EPH functions.
Personnel systems vary among states, localities and even within individual
agencies. EPH professionals have a diversity of classifications with regards to both the position title (e.g., environmental health specialist vs. sanitarian), as well as the type of employee (e.g., temporary or contract worker vs. full time employee). These varying job titles and personnel categories often have distinctive pay structures, benefits, and career pathway opportunities. Furthermore, hiring requirements, such as professional certifications and levels of education, also tend to differ. For example, in the Region, only three states (CT, MD, NJ) require a Registered Sanitarian (RS) or a Registered Environmental Health Specialist (REHS) license for EPH positions. Voluntary RS programs exists in five states (D.C., MA, PA, RI, VA); and in the remaining five states (DE, ME, NH, NY, VT), no RS licenses are required to practice EPH.39 According to the

NEHA 2002 salary survey of EH Professionals, 51% of survey respondents have a professional certification (93% of those certified have either RS or REHS).40
Overall, interview findings revealed that retirement, retention, and recruitment problems threaten the ability of agencies to maintain an adequate EPH workforce in the Region. According to the IOM “Future of the Public’s Health in the 21st Century” report, the most significant worker shortage areas included environmental health, along with nursing, epidemiology and laboratory science.41 New staff recruitment is a challenge for many EPH positions. Although the diversity of EPH job tasks and the vast array of necessary background knowledge are generally viewed as stimulating by EPH professionals, it creates challenges in finding adequately qualified applicants. Figure 4 illustrates the wide breadth of EPH content areas addressed in the NEHA RS exam,42 along with the Centers for Disease Control and Prevention (CDC) and the American Public Health Association (APHA) recommended core competencies for local EPH practitioners.43 Further complicating this lack of qualified applicants is the paucity of EPH training programs.
Figure 4 – Environmental Health Knowledge Areas
The Northeast/Mid-Atlantic Profile of Environmental Public Health Practice 20

The Northeast/Mid-Atlantic Profile of Environmental Public Health Practice 21
The National Environmental Health Science and Protection Accreditation Council (EHAC) reports a total of 30 academic institutions with accredited undergraduate and/or graduate level environmental health programs in the United States. Of these 30 institutions, only three were located in the Northeast Region, and two of these programs were disbanded in 2007 due to low enrollmentsg.44 The decline in enrollment in the Region’s programs reflects an overall trend throughout the nation. Data collected from all the EHAC programs over the last 10 years shows an enrollment decline, with 2007 enrollment at approximately 1,100 total students and 300 graduates down from the 1997 level of 1700 total students and 600 graduates.45 Although this data only reflects accredited environmental health programs, as opposed to other non-accredited EPH programs and general life sciences training, these findings corroborate anecdotal reports from interviewees about difficulties in finding appropriately trained EPH job candidates. Thus, although, the overwhelming majority of EPH professionals do have a bachelor’s degree, according to the 2002 NEHA salary survey 91% of survey respondents have bachelor’s degrees, finding EPH trained professionals remains a challenge. 46
In addition to the scarcity of EPH trained professionals, low salaries, particularly
at starting pay grades, create recruitment difficulties. Salaries for EPH positions vary widely depending on a number of factors including the job location, title, and responsibilities, along with the employee’s tenure, previous experience, and training. Thus, Hopkins investigators found it difficult to find comparable salary data. However, general web site searches for entry level EPH positions in the Region were found to be in the $30 - $40K range for the most part, with agencies in larger, metropolitan jurisdictions paying more than less populous areas. It is evident that salaries for EPH professionals tend to lag behind other comparable professions. The Bureau of Labor Statistics (BLS) wage estimates from 1999 – 2006 in Figure 5 provide some general wage indicator and trend comparisons. In Harford County, Maryland, a specific example of the pay differential can be found in 2006 starting salaries for a college graduate with a bachelor’s degree at $38,964 for a teacher in the Harford County School system versus $30,844 for an entry level sanitarian position at the Harford County Health Department.47 Over the first few years of their careers, this pay differential widens. A teacher has the opportunity to raise his or her salary to $41-$43K by obtaining additional education and advanced professional certificates.48 The sanitarian, on the other hand, must meet field requirements as well as earn a passing score on the registered sanitarian exam to raise their salary to $32,768.49
In addition to low compensation, rigid and often antiquated personnel systems
complicate and lengthen the hiring process. Moreover, limited career advancement opportunities, particularly at small local agencies, as well as a general lack of public awareness of EPH positions, heighten recruitment challenges. Lastly, many traditional government jobs enticements, such as generous health insurance and retirement
g The three accredited programs in the Region were at Old Dominion University (VA), Salisbury University (MD), and Richard Stockton College of New Jersey. Programs at Salisbury and Richard Stockton have been disbanded. An environmental health program at the University of Massachusetts Lowell is currently seeking accreditation.
benefits, are increasingly being curtailed. Government agencies strapped for funds, facing increasing retirement burdens as the workforce ages, and under political pressure to reduce the number of government employees are reducing or eliminating many of these benefits. Examples include shifting greater portions of health insurance costs to employees, reducing retirement benefits, as well as converting full-time positions to contract, temporary, or part-time employees, who are ineligible for benefits.
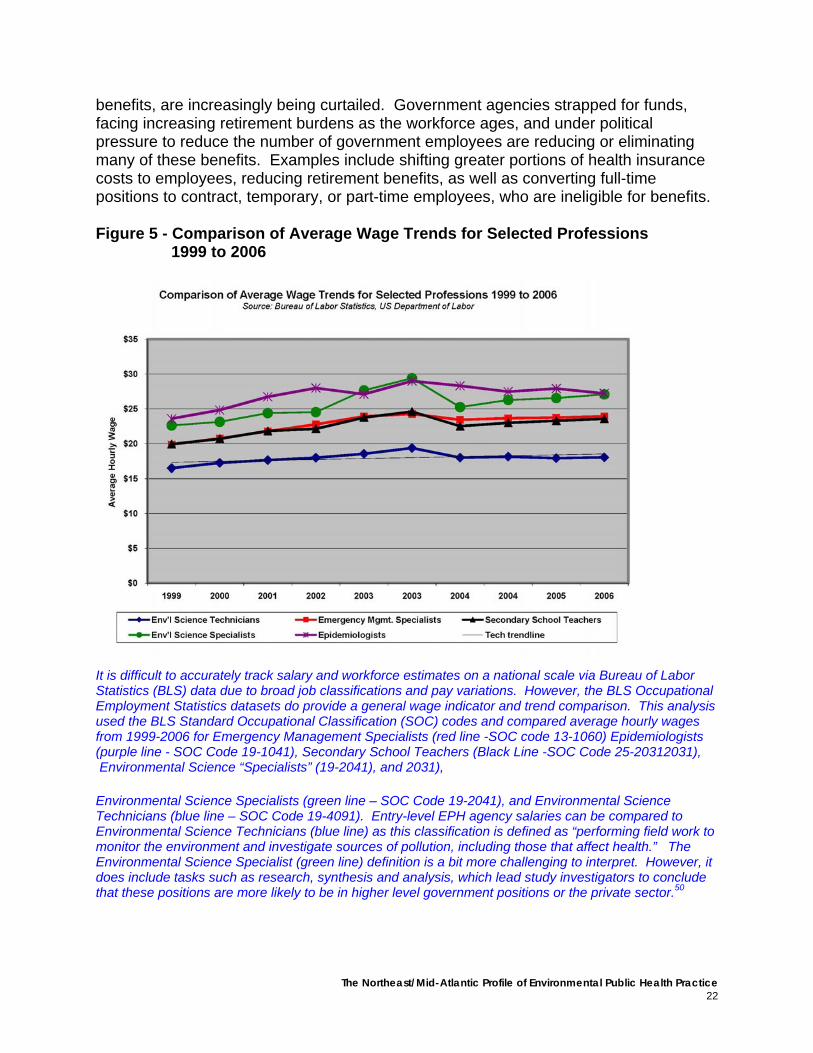
Figure 5 - Comparison of Average Wage Trends for Selected Professions 1999 to 2006
It is difficult to accurately track salary and workforce estimates on a national scale via Bureau of Labor Statistics (BLS) data due to broad job classifications and pay variations. However, the BLS Occupational Employment Statistics datasets do provide a general wage indicator and trend comparison. This analysis used the BLS Standard Occupational Classification (SOC) codes and compared average hourly wages from 1999-2006 for Emergency Management Specialists (red line -SOC code 13-1060) Epidemiologists (purple line - SOC Code 19-1041), Secondary School Teachers (Black Line -SOC Code 25-20312031), Environmental Science “Specialists” (19-2041), and 2031), Environmental Science Specialists (green line – SOC Code 19-2041), and Environmental Science Technicians (blue line – SOC Code 19-4091). Entry-level EPH agency salaries can be compared to Environmental Science Technicians (blue line) as this classification is defined as “performing field work to monitor the environment and investigate sources of pollution, including those that affect health.” The Environmental Science Specialist (green line) definition is a bit more challenging to interpret. However, it does include tasks such as research, synthesis and analysis, which lead study investigators to conclude that these positions are more likely to be in higher level government positions or the private sector.50
The Northeast/Mid-Atlantic Profile of Environmental Public Health Practice 22

The Northeast/Mid-Atlantic Profile of Environmental Public Health Practice 23
Retention of existing staff is also a challenge for many EPH positions. A 2003 ASTHO State Public Health Employee Worker Shortage report indicated an annual state employee public health worker turnover rate of 14%.51 Comparing this with BLS turnover data from 2006, it appears this rate is higher than the turnover rate for government overall (8.2%), yet lower than the rate for certain sectors, such as education and health services (18.6%).52 Yet, any rate of turnover is problematic when faced with hiring freezes, which prohibit vacated positions from being refilled and in some cases require abolishment of vacated positions. Carroll and Moss reported that in 2002, 27 states had enforced some sort of mandatory hiring freeze.53 Hiring freezes, along with difficulties in recruiting qualified EPH staff, exacerbate staff retention challenges.
Interviewees indicated retention problems are particularly acute with new staff members, as they tend to turnover more frequently than more experienced higher-ranking EPH professionals. Young employees often work for a year or two and then move on to other local or state agency positions or private industry for higher pay and/or more advancement opportunities. The diversity in pay scales and career opportunities, particularly in states where neighboring localities have differing pay rates, heighten this “county hopping” problem. For example, over an 18-month period in 2004-2006, the Baltimore City, Maryland EPH Division in the City Health Department lost four of its twenty-three environmental sanitarians (17%); two to neighboring local jurisdictions with higher salaries and two to other professions.54 These findings were corroborated by the 2002 NEHA salary survey finding that nearly a quarter (23%) of survey respondents had been in the profession for less than 5 years.55 Furthermore, the ASTHO State Worker Shortage Report reported “current challenges for recruiting and retaining existing environmental health workers include low pay scales at the state level, minimal advancement opportunities, and competition with the private sector. State environmental programs often serve as a training ground for people to learn needed skills and then move into the private sector at higher salaries.”56
In addition to employee retention, frequent EPH leadership changes present
challenges. Interviewees indicated state environment and health agency leaders change quite frequently. They reported that this trend has accelerated over the last ten years as state agencies have become more affected by political appointment processes. Throughout the Region, state agency leaders are usually appointed by the Governor (or mayor), who generally is elected every four years.h An examination of the Region found that, in 2006, ten states held governor elections.i Of these ten 2006 elections, six states had governors re-elected.j, 57 However, health and environment agency leadership changes occurred throughout the Region, even in those states with returning governors. A corresponding review of state environmental and health agency websites revealed all but three state environmental agencies had a change in leadership in 2006 or 2007; the remaining three were appointed in 2005 (RI), 2004 (CT),
h Vermont and New Hampshire have two year governor terms i States that did not have governor elections in 2006: DE (2004); VA and NJ (2005). j Governors re-elected in CT, ME, NH, PA, RI, and VT

and 2002 (DE). An examination of 1997-2007 membership rosters from the state environmental health directors association, the Environmental Council of the States (ECOS), indicates a membership turnover rate of approximately 27% per year.58 State health agency leadership was found to be slightly more stable; six were appointed in 2006-2007 (MA, MD, ME, NH, NY, VT); and seven were appointed between 2001 and 2005 (CT, DC, DE, NJ, PA, RI, VA). A review of the ASTHO 1990 - 2006 membership data indicate the average tenure for a state health officer during this time period was 3.76 years.59 Although many key deputies and support staff at these state agencies are long term employees, these continual changes at the top pose many challenges with regards to consistency in EPH vision, priorities and approaches.
On a positive note, it is important to note that local EPH leadership was found to
be very stable. Interviewees indicated that many long-serving leaders exist at local agencies. This finding was substantiated by the NACCHO 2005 Profile, which reported 32% of local health agency top executives have been in their current positions for ten years or more.60 Furthermore, with respect to EPH leadership, the 2002 NEHA salary survey found that local EPH directors had been in their positions for an average of almost 20 years.61
Although leadership at the local level is for the most part stable, retirements pose
a grave threat to the future of the EPH workforce at all levels. As the baby boomers approach retirement age, all sectors are grappling with an aging workforce. However, as illustrated in Figure 6, this problem is particularly acute in the public sector as compared to the private. The majority of the interviewees for this study indicated that they will be eligible for retirement within the next 5-10 years. A review of relevant documents and reports verify these findings.
Figure 6 - Age Comparison Chart
The Northeast/Mid-Atlantic Profile of Environmental Public Health Practice 24

The Northeast/Mid-Atlantic Profile of Environmental Public Health Practice 25
The 2002 NEHA salary survey revealed the average age of local EPH professionals at all levels was 42, and at the director level, over 41% were age 50-59.62 Carroll and Moss found in 2002 that, on average, about 24% of the overall public health workforce is eligible for retirement, 63 and the 2005 NACCHO Profile reported that approximately 20% of local health department employees will be eligible for retirement within five years.64 Furthermore, the Maryland Profile found, in 2003 alone, 25% of Maryland local health department EPH directors either retired or moved to other positions. Of these, only half had identified replacements at their time of departure.65
With the anticipated increasing retirements, leadership succession planning is crucial to retaining institutional knowledge and ensuring adequate EPH protections.
Workforce Conclusion There were several positive findings with regards to the EPH workforce that should be highlighted. First and foremost, it is important to note that overall, the interviewees were very positive about their jobs. The diversity in tasks, continually evolving EPH challenges, opportunities for field work, and interaction with the public were routinely cited as positive aspects of EPH work. Furthermore, a sense of pride in their accomplishments and the importance of EPH to overall public health were clearly expressed by a majority of the interviewees. These findings were corroborated in the Maryland Profile project finding of a “dedicated and enthusiastic workforce.”66
There is a growing understanding and appreciation of the need for accurate and
complete personnel data on the EPH workforce. An enumeration of the EPH workforce is included as a goal in the CDC’s 2002 Strategy to Revitalize Environmental Public Health Services.67 In 2005, ASTHO developed strategies to enumerate the public health workforce, as a result of this effort a State Public Health Workforce Survey has been initiatied.68
Furthermore, initiatives are underway to address workforce challenges. Carroll
and Moss found that 75% of states have developed long-term plans to address the personnel crisis and 34 states are establishing new recruitment and retention policies.69
Moreover, recruitment and retention efforts have expanded beyond the traditional pay and benefits increases to include other incentives, such as flexible work schedules, telecommuting, and training opportunities.70 The Carroll and Moss findings were corroborated by interviewees indicating stepped up recruitment efforts and initiatives to increase compensation throughout the Region. Additionally, policy changes, such as modifications to allow agency retirees to return to work while still collecting retirement benefits, are being pursued.
In order to ensure adequate EPH protection for the Region, it is essential to enhance current workforce enumeration, recruitment and retention initiatives. In preparing the next generation of EPH leaders, it is critical to build on the dedication, commitment and institutional knowledge of the current EPH leadership. Along with leadership development, an EPH training pipeline is a key component to the future of the EPH workforce.

Training “To be able to engage in the most effective public health practice, practitioners in local
health departments must be well educated and trained to fulfill their roles.”71 Institute of Medicine, Who Will Keep the Public Healthy?
Educating Public Health Professionals for the 21st Century (2003)
The Northeast/Mid-Atlantic Profile of Environmental Public Health Practice 26
In the Region, as well as throughout the nation, training of the EPH workforce is a key component of effective EPH protection. As documented previously, there is a lack of EPH trained graduates preparing to enter the field. Furthermore, as the field of EPH continues to evolve, the existing EPH workforce will be required to adapt to advances in the scientific understanding of the environment and its relationship to health, new policies and regulations, and changing community needs. As a result, EPH professionals must be prepared to learn new skills and work in new environments. However, providing adequate training for EPH practitioners continues to pose significant challenges for both state and local agencies. In the majority of states interviewed for this study, line items within the state budget do not exist for EPH training. Although state agencies often take the lead on implementing training programs, interviewees reported that the majority of training funds originated from federal or local sources. In particular, interviewees mentioned availability of federal funds for preparedness training. While preparedness training is typically very specific, interviewees reported that basic public health skills (e.g., surveillance) are often addressed. Furthermore, it was noted that preparedness training facilitated agency-wide enhancements. For example, Connecticut utilized preparedness monies to support online training systems that include a wide array of training courses available to state and local personnel. Interviewees reported that training is provided by a variety of sources including state agencies and non-governmental organizations, as well as academic institutions. This finding was corroborated by the 2001 Council on Linkages Between Academia and Public Health Practice report, Bridging the Gap Progress Report, that found education and training at the state and local level are provided by a variety of agencies
including federal agencies, state health departments, professional organizations, and academic institutions.72
The EPH practice initiatives at the School of Public Health at the University at Albany are a model for effective practice and academic partnerships. The multitude of initiatives funded at the school allows for a “hub” of academic practice. The Continuing Education and Professional Development Program, the Center for Public Health Preparedness, the Wadsworth Center, and the Northeast Regional Public Health Leadership Institute, offer a wealth of training, partnership, and applied research opportunities.74, 75, 76 Furthermore, the Wadsworth Center, home of the Department of Environmental Health Sciences at the School, serves as the public health laboratories of the New York State Department of Health.77 In this assessment, every New York State interviewee spoke highly of the school’s offerings and partnership opportunities. The Albany School of Public Health is a strong model to emulate for future practice and academia partnerships and research and training opportunities.
In 2003, the IOM found that “linkages with schools of public health could enhance the capacity of local health departments to provide broader and higher quality

The Northeast/Mid-Atlantic Profile of Environmental Public Health Practice 27
training.”73 Fortunately, this study found that many state and local health departments have availed themselves of the training and expertise that resides in academic institutions. In Pennsylvania, for example, interviewees reported extensive collaboration with and training from the University of Pittsburgh Center for Public Health Preparedness, as well as the Carnegie Mellon University. Overall, interviewees reported that adequate training opportunities did exist and most indicated that they had received training within the last year, particularly on preparedness topics. These findings are consistent with the NEHA 2002 salary survey responses indicating over 80% of EPH professionals were able to take time off during the day for continuing education.78 Although ample training opportunities do exist, in an ideal situation where funding was not a constraint, most interviewees suggested additional training in a variety of disciplines. These disciplines included environmental health policy, management and administration, information technology and/or database management, and media and written communication.
Up-to-date, on-going, relevant training is essential for a strong and prepared EPH workforce. While an adequate training infrastructure is a challenge to fund and maintain, it is vital to ensuring adequate EPH protection.
Funding
Funding for EPH services comes from a variety of sources including federal, state and local governments, as well as other sources, such as private grants. These multiple funding sources, along with the complex and multi-agency EPH structure, prohibited investigators from obtaining accurate and complete EPH budget data.
At the federal level, EPH funding comes from a number of agencies, with the
bulk of funding come from the Department of Health and Human Services (DHHS) and the EPA. Federal funds either are generally given to state agencies through categorical grants or block granting.79 The majority of federal funds are distributed to states through categorical grants that are to be spent for a specifically designed purpose, and states are often required to match a portion of the federal funds. For example, the EPA provides states with Public Water System Supervision Grants to implement the Safe Drinking Water Act. States are required to match their grants by 25%. State general revenues and fees provide the majority of operational funding for state drinking water programs; on average states contribute about 65% of the costs and federal funds cover the remaining 35%.80 A federal block grant, such as the Preventive Health and Health Services (PHHS) Block Grant, provides funding for multiple programs and allows states more discretion with regards to how the funds can be used. The New York State Department of Health uses the PHHS block grant funds to support 19 public health programs, including a childhood lead poisoning prevention program and a healthy neighborhood program, which assesses homes for environmental hazards such as carbon monoxide and lead.81
Federal allocations to states vary widely from state to state and by program.
Federal funding levels for specific programs are determined in a number of ways,

The Northeast/Mid-Atlantic Profile of Environmental Public Health Practice 28
including per capita funding, formula funding based on variables such as demonstration of need, and a competitive review of state grant proposals. An example of a competitive review of state grant proposals is the Agency for Toxic Substances and Disease Registry (ATSDR) cooperative agreements for environmental health activities. Seven states within the Region received this ATSDR funding in 2006 (CT, DC, MA, NH, NJ, NY, PA) in amounts ranging from over $300,000 (NY) to just over $26,000 (NH).82 Funding in other areas, such as chronic disease, went to all states in the Region. In 2006 CDC provided approximately 146 million to the Region for chronic disease activities. The state ranges varied widely, with over 25 million to Massachusetts to just over three million to Delaware.83 The EPA provides the bulk of federal funding to states with delegated authority to conduct federally mandated or regulated programs, such as the Clean Air and Safe Drinking Water acts. According to ECOS in 2003, the total federal portion of state spending on environment was about 33%.84
Funding for state agency EPH activities comes from a mix of federal and state funds. The funding amounts from state and federal sources vary significantly from state to state. State funds originate from a variety of sources including general state tax revenues, specific tax levies or fees, and private grants. States then generally allocate a portion of their total funds to local agencies, most often to local health departments, or to other departments such as a local department of environment if it exists, or another relevant agency, such as public works. These state allocations to localities can vary by program and are determined in a number of ways, including per capita funding, formula funding based on variables such as per capita income or rates of disease, categorical grants directed to specific programs, reimbursement funding for specified services, or contract funding which involves a pre-negotiated contract between the local agency and the state to provide certain public health services.85 The state allocations vary widely from state to state and even between local jurisdictions within a state. Within the Region, according to the NACCHO 2005 Profile, state funding as a % of total local health department budgets ranges from a high of 79% in Delaware to a low of 17% in New Jersey, with most states falling within the 30-50% range.86 EPH structure appears to impact these funding patterns, as Delaware, at the high-end of the state funding range, has no local health agencies. Conversely, New Jersey, at the low-end, has a more locally-based structure.
Local funds are usually derived from local tax revenues, specific tax levies such as a cigarette tax, private grants, and fees. The NACCHO 2005 Profile data on local funding as a percent of total local health department revenue indicate again that EPH structure appears to influence funding formulas. The high and low-end of the ranges of the local funding are converse to the state funding totals, with New Jersey on the high-end with 60% local funding and Delaware at the low-end of the range with 0%.87
Fees are particularly relevant to EPH as many EPH programs at the state and
local levels, such as permits, discharges, inspections, and licensing, are fee for service programs. For the most part, agencies need legislative approval, at the state or local levels, to establish fees or alter the amounts charged. The fee amounts vary widely at both the state and local levels, as well as how the fees are allocated. ECOS reports in

The Northeast/Mid-Atlantic Profile of Environmental Public Health Practice 29
2003 that for most state environmental agencies, permitting fees are the largest funding component.88
At the local level, some jurisdictions utilize fee revenues to directly fund EPH
programs while others deposit fee income into a state or local general fund. In certain jurisdictions, fees can generate significant portions of total EPH funding. The NACCHO 2005 Profile reports, on average for the nation, six percent of total local health department revenues come from fees.89 Within the Region, at the local level, total revenue from fees as a percentage of total local budgets varies widely from zero to over 25%.90 In 2003, The Maryland Profile found that fees accounted for at least 40% of the total local EPH budget for nearly 30% of county health departments.91 It is important to note that in Maryland, the budget information refers to EPH division budgets only, as opposed to the NACCHO data which refers to total health department budgets. Furthermore, in Maryland, the county health departments reported that fees usually did not cover the total cost of providing the services.92
One area of funding that interviewees discussed at length was public health
preparedness and emergency response, as significant amounts of federal funding have been provided to states since the events of September 11, 2001. Preparedness funding from CDC provided nearly 200 million dollars to public health agencies in the Region in 2005. This funding ranged widely from a low of 5.1 million to Vermont to a high of nearly 55 million to New York State and New York City combined.93 Additionally, according to the ASTHO research brief, “A State-Based Analysis of Public Health Preparedness Programs in the United States”, more than one third of states reported contributing state funds in 2004 for preparedness activities in addition to the federal funds.94 The ASTHO survey reported total preparedness budgets for state health departments in 2004 ranging from a low of under 10 million (nearly one quarter of states) and a high of over 45 million (nearly one quarter of states) with the most state health departments (nearly a third) falling in the $10 - $20 million range.95 It is important to note that these numbers reflect budgets of the state health departments only, and does not include preparedness budgets of other state agencies.
States in the Region have taken various approaches to utilizing these health department preparedness funds. However, interviewees overwhelmingly reported that the funds have bolstered the overall EPH infrastructure. These findings are corroborated by the NACCHO 2005 Profile which found that over 80% of local health departments indicated, that from 2002-2005, they had strengthened communication systems, workforce training, information systems, public health surveillance, and epidemiology as a result of efforts to improve emergency preparedness planning and response.96 Furthermore, the ASTHO preparedness survey revealed, on average, states have added a total of 117 employees per state with 65 of these at local agencies, 49 at the state public health agency, and four at partner organizations (e.g., Red Cross).97
Although much progress has been made, there are concerns that some of the
preparedness monies could be replacing state and local funds, and reducing attention

The Northeast/Mid-Atlantic Profile of Environmental Public Health Practice 30
and funding for “core” public health services. Hebert et al. noted that during 2002, “37 states had to cut their enacted budgets by an aggregate $13 billion and as a result, many localities used federal preparedness funding streams to defray the impact of state budget cuts.”98 This raises concerns about state and local government commitment to assuring adequate EPH protection, as well as the long-term viability of these federal funds. This uneasiness was reflected in interviewees indicating an overall sense that federal preparedness monies are declining, when in fact a Trust for America's Health analysis found that the federal data, at least for the near-term, show funding levels are consistent. 99 It is clear that preparedness funds have helped enhance the EPH infrastructure; yet concern remains about sustaining adequate support for EPH. It is critical that EPH funding levels are maintained and that state and local governments uphold their EPH financial commitments. Systems to collect and track accurate and complete EPH budget data are needed to assure adequate EPH funding to protect the health and well-being of the Region. Technology The ability of state and local health departments to effectively use and maintain information technology (IT) systems is a key component of an adequate EPH infrastructure. According to a 2005 General Accounting Office (GAO) report, Federal Agencies Face Challenges in Implementing Initiatives to Improve Public health Infrastructure, “development of IT can build upon the existing system capabilities of state and local public health agencies, not only to provide routine public health functions, but also to support public health emergencies, including bioterrorism.”100 Furthermore, state and local agencies must advance technologically in response to federal initiatives, such as the EPA’s Safe Drinking Water Information System (SDWIS) adoption of web-based reporting requirements for public water system drinking water regulation violations.101 Given the broad need for effective information systems at the state and local levels, it is encouraging to report that most states and localities interviewed in this study reported either effectively maintaining or currently developing new and innovative databases or technologies that enhance the day to day practice of EPH. According to the NACCHO 2005 Profile, 98% of local health departments have access to the Internet and 50% of all local health departments provide their staff members with portable devices that can send and receive voice and e-mail remotely.102 Some interviewees indicated adoption of statewide IT systems. These statewide efforts appear to be more common in states with a state-centralized structure, such as Vermont and Virginia. However, there were some statewide efforts in states with mixed state-local systems, such as Pennsylvania. In Pennsylvania and Vermont, interviewees described the development of new, statewide databases for restaurant inspection reports. These new databases allow for enhanced coordination, data analysis, and release of inspection results.103 A number of other technological advances were cited, including the use of geographic information systems (GIS) for mapping and portable, remote devices, such as scanning pens for restaurant inspections in New York State.

The Northeast/Mid-Atlantic Profile of Environmental Public Health Practice 31
The adoption of new technology, while offering new opportunities and enhanced efficiency, does pose challenges. Given the complex web of EPH agencies at all levels of government, it is critical to ensure information is transferable and properly communicated. The 2005 GAO report states, “these (IT) initiatives involve the need to coordinate among federal, state, and local public health agencies, but establishing effective coordination among the large number of disparate agencies is a major undertaking.”104 While some states in the Region are attempting coordinated state-wide efforts, many municipalities interviewed for this study reported adopting database management software tools independently from their local and state counterparts. Though statewide efforts generally take more time and are more costly than local technology initiatives, this lack of consistency within and between states reduces opportunities to share data and coordinate efforts.
Additionally, a majority of interviewees reported capacity and training challenges
to maintain and update IT systems. More often than not, IT support and in-person assistance are not available in a timely manner. According to the 2005 NACCHO Profile, only 30% of local health departments employ an information systems specialist.105 Furthermore, interviewees cited difficulties in getting employees, particularly longer-serving ones, to adapt to the new technologies.
Beyond the training challenges, the availability of funds to maintain such systems
was questioned by interviewees. Many states and municipalities reported using federal preparedness funds to both update existing systems and purchase new technology. Yet, despite this influx of funds, most interviewees reported problems in sustaining funding to maintain these new technologies.
Information technology, from collecting and transferring information electronically, to new comprehensive and coordinated databases to store and analyze complex EPH information, has become an integral component of everyday EPH practice. For EPH in particular, given its inter-disciplinary nature and complex web of agencies, technology offers great promise to advance the science and practice of EPH. Funding is critical not only to maintain and update current systems, but also to ensure adequate training for EPH practitioners to fully access and utilize these technologies. Information technology is the future of public health practice; EPH practitioners must have the necessary IT tools and skills to enhance EPH protection. On-Going EPH Challenges Environmental public health is one of the most vital and rapidly expanding fields of public
health. The duties have moved far beyond that of the inspector or the regulator. The environmental public health specialist of the 21st century needs to be on the front lines of disease prevention, using new and effective tools and methods to investigate the environmental causes of disease and mortality. The September 11 (2001) attack and the environmental public health response are an example of the vital role that environmental public health must play in protecting the health of America.106
Richard Jackson, MD, MPH, Former Director, National Center for Environmental Health, CDC

While traditional food, water and sanitation protections will remain the
cornerstone of environmental public health efforts in the 21st century, EPH practitioners must be prepared to address evolving EPH challenges. Interviewees cited a number of challenges, such as growth and development and emergency preparedness, as well as the need to adequately respond to “routine emergencies,” such as sanitary overflows or water main breaks. Additionally, emerging EPH threats such as climate changes and new environmental contaminants were identified as some of the most complex and pressing EPH service-related challenges. Growth and Development As illustrated in Table 2, the Region’s population increased dramatically from 1980- 2006, with New Hampshire clocking in as the fastest-growing state. As noted in Table 2, the current population growth rates have declined from the double digit levels in the 1980’s; however, the Region’s population continues to grow at a steady rate. Table 2 - Population Growth Rates
The Northeast/Mid-Atlantic Profile of Environmental Public Health Practice 32
Moreover, commercial and residential development rates are accelerating. According to the National Resources Inventory, the pace of development in the United States from 1992-1997 (2.2 million acres a year) was more than 1.5 times that of the previous 10 year period (1.4 million acres a year).107 The Region, as shown in Table 3, reflects this national trend as land development continues to escalate.

Table 3 - Land Development Rates
The Boston area offers an example of this rapid land development. As reported by the Brookings Institution, “the Boston metropolitan area grew in population by 6.7% between 1982 and 1997, but the amount of land developed increased by 46.9%”, more than either Atlanta or Los Angeles.108 According to the Chesapeake Bay Commission, between the years of 1950-1980, “the percent of land used for residential and commercial purposes in the Chesapeake Bay alone increased nearly 180%, while population increased only about 50%.”109 Furthermore, more and more residents are building and nurturing their own “American dream” of a large single-family house on an acre of land. According to the National Institute of Homebuilders, the average finished area of a home has climbed from 1,500 feet in 1970 to 2,434 in 2005.110 This trend towards larger homes is even more acute within the Region, where the average new house in the Northeastk in 2006 averaged 2,571 square feet, as compared to 2,451 square feet for the U.S. overall. 111 This rapid development, often referred to as “sprawl”, or “uncontrolled, poorly planned, low-density, and single-use community growth”, has enormous environmental and public health implications.112 According to the EPA, “population growth is the most
The Northeast/Mid-Atlantic Profile of Environmental Public Health Practice 33
k The Census bureau includes the following 9 states in the Northeast Region: CT, ME, MA, NH,RI, VT, NJ, NY, PA http://www.census.gov/geo/www/us_regdiv.pdf accessed on 11/14/2007

The Northeast/Mid-Atlantic Profile of Environmental Public Health Practice 34
significant factor effecting urban sprawl in the Mid-Atlantic region,”113 and “sprawl development is ‘the number one environmental issue facing New England.” 114
Sprawl has a significant impact on air quality, water quality and quantity, loss of natural areas such as farmland, and “brownfield” creation. A “brownfield” is defined by the EPA as, “real property, the expansion, redevelopment, or reuse of which may be complicated by the presence or potential presence of a hazardous substance, pollutant, or contaminant.”115 In addition to environmental impacts, the economic implications of sprawl, such as increased infrastructure costs related to sewage disposal and the treatment and delivery of drinking water, are enormous. Examples of the EPH impact of sprawl permeate the public health literature. In Northern Virginia, the EPA reports that “development is expanding beyond the current service areas of public water supplies provided by the Potomac River. Specifically, Loudoun County, Virginia’s population has increased by nearly 150% from 57,000 in 1980 to nearly 140,000 today, with the landscape changing from rural to suburban. Ground water is being utilized to support the uncontrolled growth.”116 In Vermont, over the past thirty years, the number of annual vehicle miles traveled by Vermonters has more than doubled while population has only grown 33%.117 According to a 1999 study jointly conducted by the EPA and the Massachusetts Audubon Society, unplanned and unchecked development consumes “more than 1,200 acres of open space, farmland and wetlands each week in New England - including nearly two acres an hour in Massachusetts alone.”118 Along with the environmental and economic effects, growth and development dramatically increases the EPH workload. The 2003 Maryland Profile Report found that EPH professionals are involved in many steps of the development process, from inspecting and approving septic system and well installations, to conducting percolation tests, reviewing and approving land plats, as well as inspecting new and temporary food facilities.119 Not only are EPH professionals often called upon to approve new developments, they are also required to manage environmental problems that occur after new neighborhoods have been built. For example, flooding of low-lying cities and towns across the Region was noted as a pressing issue amongst states in this study. According to the Sierra Club, over the past seven years, floods have “killed more than 850 people across the country and caused at least $89 billion in property damage and much of this flooding occurred in places where weak zoning laws allowed developers to drain wetlands and build on floodplains.”120 Beyond death and destruction, severe rainfall and flooding often results in a greater occurrence of sanitary sewer overflows, a common response issue for EPH practitioners across the region.121 Issues such as sanitary overflows, water main breaks, and food-borne illness outbreaks are “routine emergencies,” events that occur often and generally require a known and specific response. However, continued pressures from increasing populations and the corresponding growth and development required to house, feed and meet the needs of this population have resulted in an increase in the frequency and scope of these “routine emergencies.” These larger scale incidents often require greater personnel and budget expenditures to adequately address and effectively manage these issues.

The Northeast/Mid-Atlantic Profile of Environmental Public Health Practice 35
Public awareness of and concern over the environmental impacts of growth and development has increased significantly over the last decade. This increased awareness and concern has facilitated much activity. A number of states in the Region have initiated efforts to reduce the environmental impacts of growth and development, such as the EPA Smart Growth Program in New England launched in 1999 to foster new tools and projects to develop new approaches to growth and development in the region.122 However, this growth and development awareness and concern can also create significant political pressure on EPH professionals when faced with development decisions, such as approval of land plats. Thus, EPH professionals must have the political skills to ensure their focus remains on the public health consequences of growth and uphold professional standards.
Although population growth rates in the Region have slowed from peaks in the 1980’s, it is clear that growth and growth-related environmental pressures are not going away, and will in fact continue to accelerate. EPH professionals must have the resources and capacities to address these issues in order to adequately protect the public’s health. Emergency Preparedness
The tragic attacks on the Pentagon and World Trade Center in September of 2001 brought attention to the country’s woefully inadequate emergency response capacity and provided a powerful incentive for change. As a result of emergency preparedness funding, federal, state, and local government agencies in the Region and throughout the nation have made many advances in disaster preparedness and response such as additional staff, improved communication, and enhanced partnerships, as well as new technology, training, and equipment. In the NACCHO 2005 Profile, over 90% of local health departments reported having collaborative relationships with schools, emergency responders, media, physician practices and community-based organizations.123
Despite these improvements, there is still much work to be done to ensure
adequate EPH protections. Interviewees indicated that in order to sustain this enhanced capacity, on-going training, communications and updated technology are critical. Additionally, a number of interviewees cited the need to further define and clarify EPH emergency response roles and responsibilities across agencies. Furthermore, many interviewees reported that the additional roles and responsibilities brought on by the new all-hazards emergency preparedness and response approaches have not necessarily been accompanied by adequate staffing levels. Connecticut and Massachusetts have tried to address the staffing challenge by creating a quasi-regional infrastructure of personnel, using preparedness funds to hire networks of “regional epidemiologists” to assist with event investigations, training, planning and response, outreach and technical assistance.
The need for bolstered emergency response capacity was evident in the nation’s
inadequate response to Hurricane Katrina. Government agencies lacked the capacity to provide the most basic food, water and sanitation protections and are still grappling

The Northeast/Mid-Atlantic Profile of Environmental Public Health Practice 36
with the long-term EPH impacts on the gulf coast region and its residents. The Katrina tragedy is a vivid reminder that EPH protection is critical to overall health and well-being. Given the anticipated climate changes and the corresponding weather transformations predicted in the near future, it is essential that steps are taken now to ensure adequate EPH protection and response capacity. Climate Change Despite controversy regarding the nature and impacts of global warming, there is little scientific doubt that the Earth is warming and our climate is changing. According to the National Oceanic and Atmospheric Administration (NOAA), the average temperature in the United States increased about 1°F over about the past 50 years.124 There is now consensus amongst research scientists and climatologists that the average temperature on the Earth will likely increase 2.5 to 10°F over the next 100 years, with more warming in higher latitudes.125 Along with increasing temperature, climate change is projected to raise sea levels and increase the frequency and intensity of heat events, droughts, floods, and hurricanes, as well as other events such as sea level rise, and air pollution.126 Not surprisingly, these extreme weather events pose significant EPH risks. In the Northeast, the Intergovernmental Panel on Climate Change predicts the following changes: northward shifts in the ranges of plant and animal species resulting from warmer temperatures, coastal erosion, loss of wetland habitat, increased risk from storm surges from sea level rise, reduced winter recreation (skiing), increased warm season activities, higher summer heat and increase in heat-related morbidity and mortality, especially in urban areas, and reduced winter cold stress with associated decrease in cold-related mortality.127
These changes not only affect the health of the population, but also the actions and activities of state and local agencies charged with protecting the public’s health. Storm-related flooding requires state and local health departments to re-inspect restaurants and businesses to ensure safe food and water. Droughts force EPH professionals, particularly in more rural areas, to alter their inspection and permitting process for new development. A changing climate can bring more extreme weather events and related complications such as cold and/or heat-related illnesses. Climate changes can alter the geographic ranges of certain vector-borne diseases, requiring health departments to adjust their preparations for and management of infectious diseases such as Lyme disease and West Nile Virus. Therefore, the extent of future impacts will be determined not only by the severity of changes in climate, but also by concurrent changes in non-climatic factors and by the adaptation measures implemented to reduce negative impacts. Yet, to date, the level of preparation for potential health impacts linked to climate change in state and local health agencies is very limited. Though a majority of the interviewees indicated that they were increasingly concerned about the impact climate changes may have on their agency or department, none mentioned any specific steps they were taking to mitigate these concerns—likely as a result of a lack of training and funding to initiate programs. Fortunately, a wide variety of organizations (federal, state, local, multilateral, private and nongovernmental) have recently begun to initiate efforts

The Northeast/Mid-Atlantic Profile of Environmental Public Health Practice 37
to address the implications of global climate change. The CDC recently issued a request for proposals to improve public health practice through translation research, particularly in the field of climate change adaptation.128 The EPA is also involved in many climate change initiatives including ENERGY STAR, Climate Leaders, and the Methane Voluntary Programs, which “encourage emission reductions from large corporations, consumers, industrial and commercial buildings, and many major industrial sectors.”129 Non-profit organizations are also beginning to address this issue. For example, NACCHO established a Global Climate Change workgroup that developed a policy statement outlining the local public health role in addressing climate change.130 Furthermore, a NACCHO survey was distributed to local health departments in June 2007 to assess the overall knowledge and interest of local health departments in climate change initiatives. Climate changes have the potential to place unprecedented demands upon the public health infrastructure. Recent climate related challenges, from extreme weather events to changing communicable disease patterns, have demonstrated the critical need to improve EPH capacity to identify, prevent, and respond to climate related threats. On-Going EPH Challenges One of the most impressive aspects of EPH practice is the ability of practitioners to continually change and adapt to new and emerging threats. These threats continue to evolve and can come from a variety of sources including rising epidemics, such as West Nile Virus. The increasing globalization of society has led to EPH challenges in assuring the safety of food and other consumer product imports, reflected in the recent findings of high lead levels in toys imported from China. The expansion of large-scale food production and distribution operations has increased risks for far-reaching food-borne illness outbreaks, such as the multi-state e-coli and salmonella outbreaks over the past few years. Furthermore, advancing scientific knowledge about environmental contaminants and potential health impacts raises challenges with regards to responding to concerns, such as the safety of perfluorochemicals used in Teflon coatings. These on-going EPH threats and challenges reinforce the need for a strong EPH infrastructure and a flexible, dynamic, highly trained workforce. Furthermore, an adequate surge capacity is needed to adequately address EPH threats and ensure safe and healthy communities. The Road Ahead
Ensuring a healthful environment is critical to the future well being of the Region. The 21st century holds many exciting opportunities and challenges for EPH. Despite tremendous progress in communicable disease prevention and environmental quality, traditional food, water and sanitation protections will remain a cornerstone of our efforts to protect the future health of the Region. Furthermore, modern realities such as terrorism, growth and development, and new pollutants present new and increasingly complex EPH challenges. From drinking water safety to natural disasters, food borne

The Northeast/Mid-Atlantic Profile of Environmental Public Health Practice 38
illness outbreaks to air quality alerts, local and state EPH professionals are essential to ensuring a safe and healthy future for the Region.
Findings from this study have led to the development of a Call to Action. This Call to Action will assure an EPH workforce that can provide adequate EPH protections. Now is the time to answer the Call to Action. Acting now will ensure the Region’s future generations have the safe food and water, healthy air, and protection from EPH threats they deserve. These actions now are a critical investment to preserve the health and well being of the Region for present and future generations. Summary of Findings & Call to Action Varied Leadership, Structure & Authority Finding: The EPH system is a complex, diverse web of agencies, institutions and legislative bodies at all levels of government. Although this disparate system provides opportunities for multi-disciplinary approaches and collaborative efforts, it has created an EPH leadership void and uncoordinated EPH approaches. Call to Action: Establish a designated EPH leadership structure at each level of government (federal, state and local) with defined roles and responsibilities.
Aging Workforce Finding: Current EPH leadership is dedicated and committed; however, nearly 25% will be eligible to retire within the next 5-10 years.131, 132 An aging workforce along with recruitment and retention challenges threaten the ability to maintain adequate EPH protections.
Call to Action: Employ the dedication, commitment and institutional knowledge of current EPH professionals to prepare the next generation of leaders. Strengthen recruitment, retention, and enumeration efforts to ensure an adequate EPH workforce.

The Northeast/Mid-Atlantic Profile of Environmental Public Health Practice 39
Training Gaps Finding: EPH training opportunities are available, particularly in preparedness. Moreover, collaborative efforts with academic institutions are on the rise. However, as the field of EPH continues to evolve and new threats emerge, training must be available to enable EPH professionals to learn new skills and work in new environments.
Call to Action: Expand existing partnerships with academic institutions and other EPH organizations to ensure relevant education and training is available to anticipate, respond to, and prevent future EPH threats. Technological Challenges Finding: Many technological advances have enhanced EPH programs and data access. Yet, the majority of these advances have been implemented within individual agencies, curtailing the ability to coordinate efforts and share information with other EPH partners. Additionally, adequate information technology training and technical support remains a challenge. Call to Action: Develop EPH technology protocols, data standards and collection procedures to allow for compatibility and comparability across jurisdictions and agencies. Provide adequate funding not only to purchase, but also to maintain and utilize technology effectively. Funding Needs Finding: Since 2002, additional federal preparedness dollars have greatly enhanced the EPH infrastructure. It is critical to sustain this level of federal support and make certain that state and local governments uphold their financial commitments to ensure adequate EPH protections
Call to Action: Establish mechanisms to maintain federal EPH support and ensure that state and local governments uphold their EPH financial commitments.

The Northeast/Mid-Atlantic Profile of Environmental Public Health Practice 40
On-Going EPH Challenges Finding: EPH practitioners must be prepared to handle both existing and emerging EPH challenges. Effective tools and services must be available to anticipate, respond, and prevent these EPH threats. Call to Action: Develop a strategic plan for EPH that allows for flexibility, continuing education, partnerships, and adequate surge capacity to address unanticipated EPH emergencies and emerging threats.

The Northeast/Mid-Atlantic Profile of Environmental Public Health Practice 41
References 1. Carroll, James B., Moss, David A. “State Employee Worker Shortage: The
Impending Crisis.” Washington, DC: The Council of State Governments, October 2002. Accessed 9.15.07 at http://www.csg.org/pubs/Documents/TA0210WorkShortage.pdf.
2. National Association of City and County Health Officials. “2005 National Profile of Local Health Departments.” NACCHO: Washington, D.C., 2006. Pg. 35.
3. U.S. Department of Health and Human Services. Healthy People 2010. 2nd ed. With Understanding and Improving Health and Objectives for Improving Health. 2 vols. Chapter 23: Infrastructure. Washington, DC: U.S. Government Printing Office, November 2000. Accessed 3.19.07 at www.healthypeople.gov/Document/HTML/Volume2/23PHI.htm.
4. Institute of Medicine. The Future of Public Health. Washington, D.C.: National Academy Press, January 1, 1988. Pg. 13.
5. National Environmental Health Association. The Future of Environmental Health. Denver: NEHA, 1992.
6. The Pew Environmental Health Commission. “America’s Health Gap: Why the Country Needs a Nationwide Health Tracking Network.” Baltimore, MD: Johns Hopkins School of Public Health, 2000. page 6
7. Johns Hopkins Bloomberg School of Public Health. Center for Excellence in Community Environmental Health Practice. “The Profile of Maryland Environmental Public Health Practice.” Baltimore, MD: Johns Hopkins School of Public Health, February 2005
8. Ibid. 9. The Pew Environmental Health Commission, supra note 6. Pg. 6 10. Trochim, WMK. “Nonprobability Sampling. Snowball Sampling.” October 20th, 2006.
Accessed 8.25.07 at http://www.socialresearchmethods.net/kb/sampnon.htm. 11. Burke, TA, Shalauta NM, Tran NL, Stern BS. “The Environmental Web: a
National Profile of the State Infrastructure for Environmental Health and Protection.” Journal of Public Health Management and Practice. 1997 Mar;3(2):1-12.
12. Environmental Protection Agency. “An Agency For The Environment.” Accessed 9.17.07 at http://www.epa.gov/history/publications/origins6.htm.
13. Frey, Betram C., “Environmental Enforcement: An Overview, Minnesota Bar Association.” November 1999. Accessed on 9.15.07 at http://www.epa.gov/Region5/orc/articles/minnesota%20bar%20speech%2011-17- 99.spe.pdf. 14. Environmental Council of the States. “States: Overview.” Accessed on 10.10.07 at http://www.ecos.org/section/states. 15. National Governor’s Association. “Reorganizing State Health Agencies to Meet Changing Needs: State Restructuring Efforts in 2003-2003.” Washington, D.C: National Governor’s Association, 2004. Accessed October 10, 2007 at http://www.nga.org/Files/pdf/0411HEALTHAGENCIES.pdf. Pg. 1 16. Ibid. 17. State of Maine. Office of the Governor. “Governor Nominates Jack Nicholas to Lead DHS and Unveils Merger Legislation.” Press Release. February 26, 2004. Accessed on 11.7.07 at http://www.maine.gov/tools/whatsnew/index.php?topic=Gov+News&id=175 2&v=Article-2006. 18. Mays, GP. “Organization of the Public Health Delivery System.” Public Health Administration: Principles for Population-Based Management. 2nd edition Ed. Lloyd Novick, Cynthia Morrow and Glen Mays. Boston: Jones and Bartlett Publishing, 2008. Pg. 79

The Northeast/Mid-Atlantic Profile of Environmental Public Health Practice 42
19. Gordon, L. “Embracing Environmental Health: In Whole, or by Parts?” EH Seminar 101. California Conference of Directors of Environmental Health, San Francisco, California. September 2007. 20. United States Constitution. Accessed on 9/16/07 at http://www.usconstitution.net/const.txt. 21. Association of State and Territorial Health Officials. “Organization of Preparedness in the States: A Public Health Case Study, Issue Report.” ASTHO: Washington, D.C., February 2006. Accessed 3.20.08 at http://www.astho.org/pubs/PreparednessCaseStudy-Organization.pdf. 22. National Association of City and County Health Officials, supra note 2. Pg. 13 23. Mays, GP, supra note 18. Pg. 102 24. National Association of City and County Health Officials, supra note 2. Pg. 12 25. Ibid. Pg. 13 26. Association of State and Territorial Health Officials. “State Health Officer Salary and Agency Infrastructure Survey.” ASTHO, 2005. Page. 21 27. From Revolution to Reconstruction. “An Outline of American History (1954): The Colonial Period.” Accessed 9.18.07 http://odur.let.rug.nl/~usa/H/1954uk/chap1.htm. 28. Commonwealth of Pennsylvania. Code of Pennsylvania. “Chapter 46: The Pennsylvania Food Code.” Accessed on 9.20.07 at http://www.pacode.com/secure/data/007/chapter46/chap46toc.html. 29. Pennsylvania Local Health Administrative Law. “Act 315, August 24, 1951 P.L. 1304 including amendments to May 1, 1995 16 P.S. 12001-12028.” Accessed 9.20.07 at http://www.achd.net/admin/pubs/pdf/ACT315.pdf. 30. Pennsylvania Food Merchants Association. “Pennsylvania Food Regulation Overview.” July 30th, 2004. Accessed 9.21.07 at http://www.pfma.org/pdf_files/PaFoodRegOverview.pdf. 31. The Morning Call. “OPINION: A lack of accountability, transparency in restaurant inspections threatens health” August 3, 2005. Accessed on 9.20.07 at http://www.mcall.com/news/specials/alleditorial1aug03,0,237055.story?coll=all_news_sp ecials_util. 32. Pennsylvania Local Health Administrative Law, supra note 29. 33. Institute of Medicine, supra note 4. 34. Ibid. 35. Pew Commission, supra note 6. 36. Gerzof RB, Brown CK, Baker E. “Full-time employees of U.S. local health departments.” Journal of Public Health Management Practice 1999;5(3):1-9. 37. Health Resources and Services Administration. “The public health workforce: enumeration, 2000.” Washington (DC): Dept. of Health and Human Services (US), HRSA; 2000. 38. National Association of City and County Health Officials, supra note 2. Pg. 34 39. National Environmental Health Association. “State Environmental Health Registration Survey.” Denver, CO: National Environmental Health Association, 2005. 40. National Environmental Health Association. “ 2002 Nationwide Salary & Benefits Survey of Local/County Environmental Health Professionals.” Denver, Colorado: National Environmental Health Association, 2002. Pg. 7 41. The Institute of Medicine. The Future of the Public’s Health in the 21st Century. Washington, D.C: National Academies Press. 2002.

The Northeast/Mid-Atlantic Profile of Environmental Public Health Practice 43
42. National Association of Environmental Health. “Registered Environmental Health Specialist/Registered Sanitarian (REHS/RS) Candidate Information Brochure.” Accessed 9.27.07 at http://www.neha.org/pdf/cred/REHS%20CIB.pdf. 43. Centers for Disease Control and Prevention. “Environmental Health Competencies Project: Recommendations for Core Competencies.” Washington, DC: May 2001. Accessed 10.4.07 at http://www.cdc.gov/nceh/ehs/Corecomp/Core_Competencies_EH_Practice.pdf. 44. National Environmental Health Science Protection & Accreditation Council. “2006 – 2007 Update of Accredited Programs.” Accessed 11.10.07 at http://www.ehacoffice.org/accred-prog/under-prog.php. 45. Ibid. 46. National Environmental Health Association, supra note 40. Pg 39 47. Harford County Public Schools. “Harford County public schools – Salary schedule for certified teachers. “ 2006. Accessed 11.15.06 at http://www.hcps.org/Admin/careeropportunities/SalarySchedules/FY07HCEA 48. Ibid. 49. Maryland Department of Management and Budget. “Fiscal year 2008 budget instructions: State of Maryland standard salary schedule: Annual rates effective July 1, 2006.” June 19, 2006. Accessed11.16.07 at http://dbm.maryland.gov/dbm_publishing/public_content/dbm_search/budget/tocf y2008budgetinstructions/p97_131section2.pdf. Pg. 122. 50. US Department of Labor. Bureau of Labor Statistics. “Job Openings and Labor Turnover Survey.” Accessed on 11.1.07 at http://data.bls.gov/cgi- bin/surveymost?jt. 51. Association of State and Territorial Health Officials. “State Public Health Employee Worker Shortage Report: A Civil Service Recruitment and Retention Crisis.” Washington, DC: Association of State and Territorial Health Officials, 2004. 52. US Department of Labor, supra note 50. 53. Carroll et al, supra note 1. 54. Farrow, Olivia; Baltimore City Environmental Health Director. Personal communication to Beth Resnick. 11.13.06. 55. National Environmental Health Association, supra note 40. 56. Association of State and Territorial Health Officials, supra note 51. Pg. 9 57. Wikipedia. “United States gubernatorial elections, 2006.” Accessed on 10.4.07 at http://en.wikipedia.org/wiki/U.S._gubernatorial_elections, 2006. 58. Environmental Council of the States Membership Rosters (1997- 2007). Obtained from Farhanna Holsey, Database Manager, Environmental Council of the States. September 27, 2007. 59. Fehrenbach, Lacy M., MPH (Senior Specialist, Member Services, Association of State and Territorial Health Officials.) Personal communication with Beth Resnick. 10.10.07. 60. National Association of City and County Health Officials, supra note 2. 61. National Environmental Health Association, supra note 40. Pg. 6 62. National Environmental Health Association, supra note 40. 63. Carroll, supra note 1. 64. National Association of City and County Health Officials, supra note 2. Pg. 35. 65. Resnick et al, “Enhancing the Maryland Environmental Public Health Workforce: A Collaborative Approach.” Journal of Environmental Health. 70(2007); 32-36.

66. Johns Hopkins Bloomberg School of Public Health, supra note 7. Pg. 41 67. Centers for Disease Control and Prevention. “A National Strategy to Revitalize Environmental Public Health Services.” Atlanta, GA: Centers for Disease Control and Prevention, 2002. Accessed 11.1.07 at http://www.cdc.gov/nceh/ehs/Docs/nationalstrategy2003.pdf . Pg. 31 68. Association of State and Territorial Health Officials. “Strategies for Enumerating the Public Health Workforce.” Washington, D.C. Association of State and Territorial Health Officials, 2005. Accessed 11.1.07 at http://www.astho.org/pubs/WorkforceEnumerationReport.pdf . 69. Carroll, supra note 2. 70. Ibid. 71. Institute of Medicine. Who Will Keep the Public Healthy? Educating Public Health Professionals for the 21st Century. Washington, D.C.: National Academy Press, 2003. Pg. 13 72. Bialek RG. “Council on Linkages Between Academia and Public Health Practice: Bridging the Gap Progress Report, July 1 through September 30.” Washington, DC: Public Health Foundation, 2001. 73. Institute of Medicine, supra note 71. Pg. 147 74. University at Albany School of Public Health. “Continuing Education.” September 13, 2007. Accessed 9.26.07 at http://www.albany.edu/sph/coned/index.htm. 75. University at Albany School of Public Health. “Center for Public Health Preparedness.” Accessed 9.27.07 at http://www.ualbanycphp.org/. 76. University at Albany School of Public Health . “Northeast Regional Public Health Leadership Institute.” April 11th, 2007. Accessed 9.27.07 at http://www.albany.edu/sph/nephli/whatis.htm. 77. University at Albany School of Public Health. “Wadsworth Center. NYS Department of Health.” Accessed 9.27.07 at http://www.wadsworth.org/sph/ehs/index.html. 78. National Environmental Health Association, supra note 39. Pg. 9 79. Mays, GP. supra note 18. Pg. 73 80. United States Environmental Protection Agency. “Drinking Water Costs and Federal Funding Factsheet.“ June 2004. Accessed on 10.7.07 at http://www.epa.gov/safewater/sdwa/30th/factsheets/pdfs/fs_30ann_dwsrf_web.pdf. 81. New York State Department of Health. “Preventive Health and Health Services Block Grant.” April 2005. Accessed on 10.7.07 at http://www.health.state.ny.us/funding/grants/block_grant.htm. 82. Centers for Disease Control and Prevention. “Profiles of CDC Funding to States.” December 4, 2007. Accessed 12.5.07 at http://www.cdc.gov/washington/state/programs.html. 83. Ibid. 84. Brown, Steven K., Kiefer, Michael J. “ECOS Budget Survey: Budgets are Bruised, but Still Strong.” Environmental Council of the States. Summer 2003. Accessed 11.15.07 at http://www.ecos.org/files/892_file_2003BudgetsArticle.pdf . Pg. 10 85. Leviss, PS. “Financing the Public’s Health.” Public Health Administration: Principles for Population-Based Management. 2nd edition Ed. Lloyd Novick, Cynthia Morrow and Glen Mays. Boston: Jones and Bartlett Publishing, 2008. Pg. 208-209 86. National Association of City and County Health Officials, supra note 2. Pg. 22 87. Ibid
The Northeast/Mid-Atlantic Profile of Environmental Public Health Practice 44
The Northeast/Mid-Atlantic Profile of Environmental Public Health Practice 45
88. Brown, R. Steven, D. Morgan, M. Kiefer, and S. Korac. “ECOS Environmental Permit Fees Report 2003-2004.” Washington: Environmental Council of the States, 2004. 89. National Association of City and County Health Officials, supra note 2. Pg. 20 90. Ibid. Pg. 22 91. Johns Hopkins Bloomberg School of Public Health, supra note 7. Pg. 10. 92. Ibid. Pg. 28 93. Department of Health and Human Services. “HHS Announces $1.3 Billion in Funding to States for Bioterrorism Preparedness,” May 13, 2005. Accessed 12.5.07 at http://www.hhs.gov/news/press/2005pres/20050513.html. 94. Association of State and Territorial Health Officials, supra note 21. 95. Ibid. 96. National Association of City and County Health Officials, supra note 2. Pg. 41 97. Association of State and Territorial Health Officials, supra note 21. 98. Hebert, K., N. Henderson, Gursky, E.A. “Building preparedness by improving fiscal accountability.” Journal of. Public Health Management and Practice. 13(2007): 200-201. 99. Trust for America’s Health. “TFAH Response to President's FY08 Budget.” February 5, 2007. Accessed 8.3.07 at http://healthyamericans.org/reports/budget07/. 100. United States Government Accountability Office. Information Technology: Federal Agencies Face Challenges in Implementing Initiatives to Improve Public Health Infrastructure. June 2005. Accessed on October 21, 2007 at http://www.gao.gov/new.items/d05308.pdf. Pg. 6. 101. US Environmental Protection Agency. “Safe Drinking Water Information System (SDWIS).” December 5th, 2006. Accessed 9.15.07 at http://www.epa.gov/enviro/html/sdwis/sdwis_query.html. 102. National Association of City and County Health Officials, supra note 2. 103. Vermont State Health Department. “Food & Lodging Program Inspection Report.” Accessed 8.30.07 at http://healthvermont.gov/apps/restaurant_scores/RestaurantScores.aspx. 104. United States Government Accountability Office, supra note 100. 105. National Association of City and County Health Officials, supra note 2. 106. Centers for Disease Control and Prevention, supra note 67. 107. United States Department of Agriculture. Natural Resources Conservation Service. 1997 National Resources Inventory: Highlights. January 2001. Accessed 10.30.07 at http://www.nrcs.usda.gov/technical/land/pubs/97highlights.html. 108. Brookings Institution. Center on Urban & Metropolitan Policy. “Who Sprawls Most? How Growth Patterns Differ Across the U.S.” July 2001. Accessed 9.14.07 at http://www.brookings.edu/es/urban/publications/fulton.pdf. 109. Chesapeake Bay Commission. “Year 2020 Panel Report. Population growth and development in the Chesapeake Bay Watershed to the year 2020. A Report to the Chesapeake Executive Council.” Annapolis, MD, 1988. Pg. 52 110. National Association of Home Builders. “Housing Facts, Figures, and Trends.” May 2007. Accessed on 11.7.07 at http://www.nahb.org/publication_details.aspx?publicationID=2028§ionID=15 4. Pg. 13 111. National Association of Home Builders. “Single Family Square Footage by Location Excel Worksheet.” July 15, 2007. Accessed 11.7.07 at http://www.nahb.org/page.aspx/category/sectionID=130.

The Northeast/Mid-Atlantic Profile of Environmental Public Health Practice 46
112. Jackson, Richard J., Kochtitzky, Chris. “Creating A Healthy Environment The Impact of the Built Environment on Public Health.” Atlanta, GA: Centers for Disease Control and Prevention. Accessed 11.7.07 at http://www.cdc.gov/healthyplaces/articles/Creating%20A%20Healthy%20Environment.p df. 113. US Environmental Protection Agency. Almanac of Policy Issues. “Urban Sprawl.” August 2003. Accessed 9.3.07 at http://www.policyalmanac.org/environment/archive/urban_sprawl.shtml 114. US Environmental Protection Agency. “EPA Announces Action Plan for Combating Sprawl in New England.” February 2, 1999. Accessed 9.10.07 at http://www.epa.gov/region1/pr/1999/020299.html 115. US Environmental Protection Agency. “Brownfields and Land Revitalization.” August 30th, 2007. Accessed 9.25.07 at http://www.epa.gov/brownfields/. 116. US Environmental Protection Agency, supra note 113. 117. Conservation Law Forum. “Community Rules: A New England Guide to Smart Growth Strategies.” 2002. Accessed 9.3.07 at http://www.clf.org/uploadedFiles/CLF/General/Publications/community_rules_chapter_1. pdf. 118. US Environmental Protection Agency, supra note 114. 119. Johns Hopkins Bloomberg School of Public Health, supra note 7. 120. The Sierra Club. “Sprawl Fact Sheet.” Accessed 9.12.07 at http://www.sierraclub.org/sprawl/factsheet.asp 121. US Environmental Protection Agency. “National Pollutant Discharge Elimination System (NPDES): Combined Sewer Overflows.” July 13, 2007. Accessed 9.12.07 at http://cfpub2.epa.gov/npdes/home.cfm?program_id=5 122. US Environmental Protection Agency, supra note 114. 123. National Association of City and County Health Officials, supra note 2. Pg. 68-69 124. National Oceanic and Atmospheric Administration. National Climatic Data Center 2006 State of the Climate Report. June 21, 2007. Accessed 11.7.07 at http://www.ncdc.noaa.gov/oa/climate/research/2006/ann/ann06.html 125. Intergovernmental Panel on Climate Change. Contribution of Working Group I to the Fourth Assessment Report of the IPCC . “Climate Change The Physical Science Basis.” New York: Cambridge University Press, 2007. 126. Centers for Disease Control and Prevention. “CDC Policy on Climate Change and Public Health.” Accessed 11.13.07 at http://www.cdc.gov/nceh/climatechange/. 127. Intergovernmental Panel on Climate Change. Contribution of Working Group II to the Third Assessment Report of the Intergovernmental Panel on Climate Change. “Climate Change 2007: Impacts, Adaptation and Vulnerability.” New York: Cambridge University Press, 2001. Pg. 1032. 128. Centers for Disease Control and Prevention. “Grant: Improving Public Health Practice through Translation Research (R18).” February 16, 2007. Accessed 8.23.07 at http://grants.nih.gov/grants/guide/rfa-files/RFA-CD-07-005.html 129. US Environmental Protection Agency. “Climate Change.” May 4th, 2007. Accessed 9.25.07 at http://www.epa.gov/climatechange/basicinfo.html. 130. National Association of County and City Health Officials. “Policy Statement: Local Public Health Role in Addressing Climate Change.” July 2007. Accessed on 10.7.07 at http://www.naccho.org/advocacy/Resolutions/documents/07-09Climatechange.pdf. 131. Carroll et al, supra note 1. 132. National Association of City and County Health Officials, supra note 2.