The North American Economies After NAFTAauapps.american.edu/blecker/www/research/01Blecker.pdf ·...
23
5 Int’l. Journal of Political Economy, vol. 33, no. 3, Fall 2003, pp. 5–27. © 2005 M.E. Sharpe, Inc. All rights reserved. ISSN 0891–1916 / 2005 $9.50 + 0.00. ROBERT A. BLECKER The North American Economies After NAFTA A Critical Appraisal The North American Free Trade Agreement (NAFTA) went into effect on January 1, 1994, amid conflicting predictions that it would either propel the Mexican economy into the ranks of “first world” developed nations or create a “giant sucking sound” of jobs leaving the United States (and, to a lesser extent, Canada). To a large extent, these hyped predictions by supporters and opponents alike were mirror images of each other, because they both rested on the presumption that NAFTA would create large numbers of jobs in Mexico. Ten years later, the reality has been much more mixed than the more extreme advocates or critics of NAFTA anticipated. Some of the most important economic changes among the three member countries, such as the wide swings in exchange rates and the continued large influx of Mexican immi- grants into the United States, pertain to issues that were ignored in NAFTA. In spite of NAFTA, there has been little, if any, net job creation in the tradable goods-producing sectors of the Mexican economy (agri- culture and manufacturing). Fundamentally, what NAFTA did was to accelerate and codify a pro- cess of economic integration that was already taking place in North America in a way that maximally promoted the interests of large multi- national corporations (MNCs) and financial institutions. In spite of its name, NAFTA was not a pure free trade agreement. On the one hand, Robert A. Blecker is a professor of economics at American University. He thanks Jeff Faux, Bob Pastor, and Mario Seccareccia for helpful comments on an earlier draft.
Transcript of The North American Economies After NAFTAauapps.american.edu/blecker/www/research/01Blecker.pdf ·...
5
Int’l. Journal of Political Economy, vol. 33, no. 3, Fall 2003, pp. 5–27.© 2005 M.E. Sharpe, Inc. All rights reserved.ISSN 0891–1916 / 2005 $9.50 + 0.00.
ROBERT A. BLECKER
The North American EconomiesAfter NAFTAA Critical Appraisal
The North American Free Trade Agreement (NAFTA) went into effecton January 1, 1994, amid conflicting predictions that it would eitherpropel the Mexican economy into the ranks of “first world” developednations or create a “giant sucking sound” of jobs leaving the UnitedStates (and, to a lesser extent, Canada). To a large extent, these hypedpredictions by supporters and opponents alike were mirror images ofeach other, because they both rested on the presumption that NAFTAwould create large numbers of jobs in Mexico. Ten years later, thereality has been much more mixed than the more extreme advocatesor critics of NAFTA anticipated. Some of the most important economicchanges among the three member countries, such as the wide swingsin exchange rates and the continued large influx of Mexican immi-grants into the United States, pertain to issues that were ignored inNAFTA. In spite of NAFTA, there has been little, if any, net job creationin the tradable goods-producing sectors of the Mexican economy (agri-culture and manufacturing).
Fundamentally, what NAFTA did was to accelerate and codify a pro-cess of economic integration that was already taking place in NorthAmerica in a way that maximally promoted the interests of large multi-national corporations (MNCs) and financial institutions. In spite of itsname, NAFTA was not a pure free trade agreement. On the one hand,
Robert A. Blecker is a professor of economics at American University. He thanksJeff Faux, Bob Pastor, and Mario Seccareccia for helpful comments on an earlierdraft.
6 INTERNATIONAL JOURNAL OF POLITICAL ECONOMY
although it reduced trade barriers and opened up many markets, it alsocontained numerous sectoral exclusions and mercantilist “rules of ori-gin” that benefited various special interests. Contrary to Canadian andMexican hopes, it did not abolish antidumping and countervailing du-ties for member countries, although it did provide for special disputeresolution procedures. On the other hand, NAFTA contained strong pro-tections for private investors’ rights (both pecuniary and intellectual)that, in some respects, went beyond anything in existing law in anymember country and that exceeded the prerequisites for free trade in thetraditional sense. The Mexican government was convinced that it had toaccept such provisions to attract more foreign investment,1 while theU.S. and Canadian governments were eager to promote the agendas oftheir big business and financial interests. When the investors’ rights pro-visions were combined with the liberalization of financial services, theresult was a “trade agreement” that effectively created a much moreintegrated capital market for North America.
NAFTA did not explicitly address labor market issues to any signifi-cant extent. The agreement did not liberalize U.S. immigration rules forMexican workers (except for highly educated professionals) or do any-thing to ameliorate the situation of the millions of illegal Mexican im-migrants in the United States. The agreement did not do anything toincrease adherence to internationally accepted labor rights and standardsin the three nations, despite a symbolic and ineffectual “side agreement”that merely exhorted each country to enforce its own existing labor laws.
Nevertheless, labor markets in North America have continued to be-come more integrated de facto, even if NAFTA did not integrate themde jure. As recognized in the Heckscher–Ohlin model of trade, interna-tional trade in goods substitutes for international movements of “factorsof production” by altering the relative demand for different factor in-puts and thereby creating both winners and losers, depending on whetherthose factors are employed more intensively in export-oriented or im-port-competing activities. When capital mobility is combined with tradeliberalization, and when production becomes more integrated acrossnational borders, the employment and earnings prospects for workers indifferent countries become increasingly interdependent. The labor mar-ket effects of trade and capital flows, however, are felt much more onthe side of wages and income distribution, as well as in the sectoral andregional distribution of employment, rather than in the total number ofjobs.

FALL 2003 7
NAFTA was only one of the factors that affected North Americaneconomies in the past decade, however, and it was not necessarily themost important. As Nora Lustig predicted:
In the three countries, however, the extent of labor dislocation and itseffect on unemployment and real wages will be more affected by theperformance of the economies than by the impact of liberalizing theirmutual trade. The evolution of fiscal and monetary policies, and the ex-change rate in particular, could have a far greater impact on aggregateemployment and wage levels than changes caused by the removal of tar-iff and nontariff trade barriers. The impact of domestic macroeconomicpolicies, particularly those of the United States, is felt well beyond theborder. (Lustig 1992: 139)
On the one hand, as Lustig anticipated, macroeconomic factors andexchange rate fluctuations have been quantitatively more important thanNAFTA-related reductions in trade barriers in driving the changes intrade flows and their attendant impact on employment. On the otherhand, NAFTA accelerated and deepened the integration of the threemember economies and, to this extent, has tied their economic futuresmore closely together—including by making the two smaller econo-mies more dependent than ever on U.S. economic growth and their com-petitiveness in the U.S. market. Thus, the trade and investment liberalizingprovisions of NAFTA interact with other factors, making it difficult toseparate the effects of NAFTA and those other factors.
The difficulties in disentangling how much the North American econo-mies have been affected by NAFTA’s specific provisions as comparedwith other causes are the motive for the word “after” in the title of thisarticle. That is, the following discussion is concerned with identifyingwhat has happened since NAFTA went into effect, without necessarilyattributing causality to NAFTA. Nevertheless, the tenth anniversary ofNAFTA in 2004 is a propitious time for assessing how the three membernations’ economies have fared since they joined together in this eco-nomic integration effort.
Trends in Trade and Investment Flows
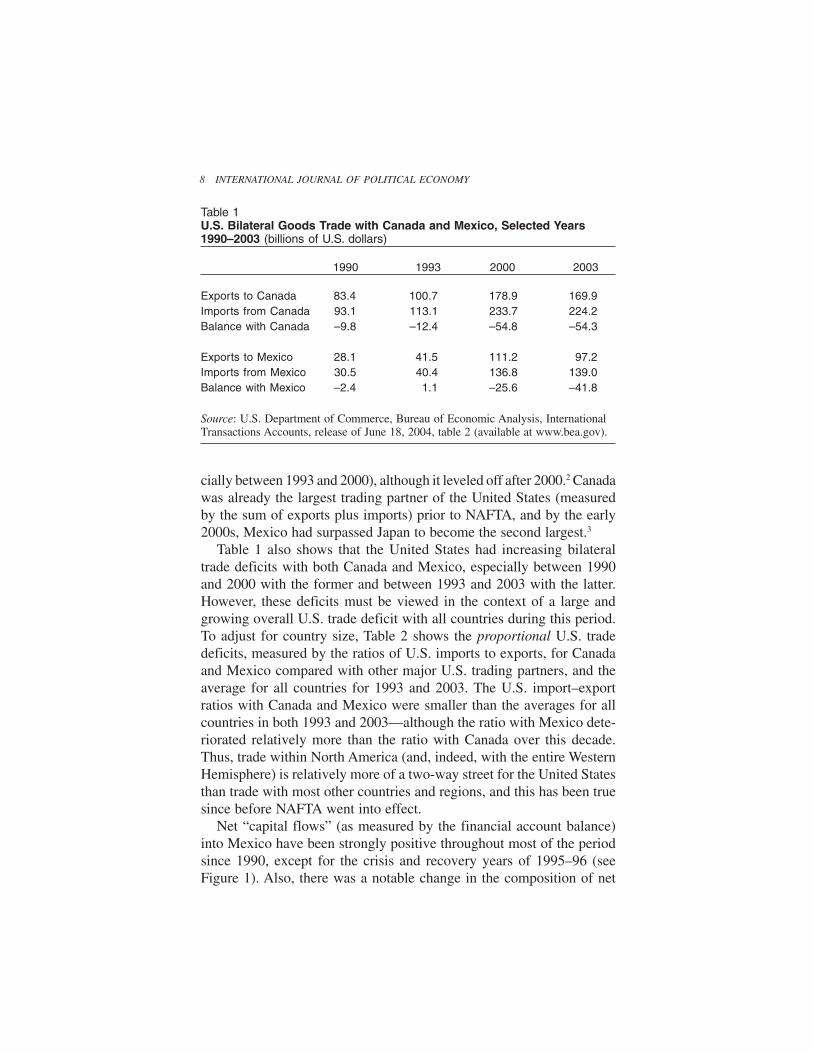
At first blush, NAFTA appears to be a stunning success in the areas itwas most directly concerned with, namely, international trade and for-eign investment. As Table 1 shows, the bilateral trade of the UnitedStates with both Canada and Mexico grew rapidly in the 1990s (espe-
8 INTERNATIONAL JOURNAL OF POLITICAL ECONOMY
cially between 1993 and 2000), although it leveled off after 2000.2 Canadawas already the largest trading partner of the United States (measuredby the sum of exports plus imports) prior to NAFTA, and by the early2000s, Mexico had surpassed Japan to become the second largest.3
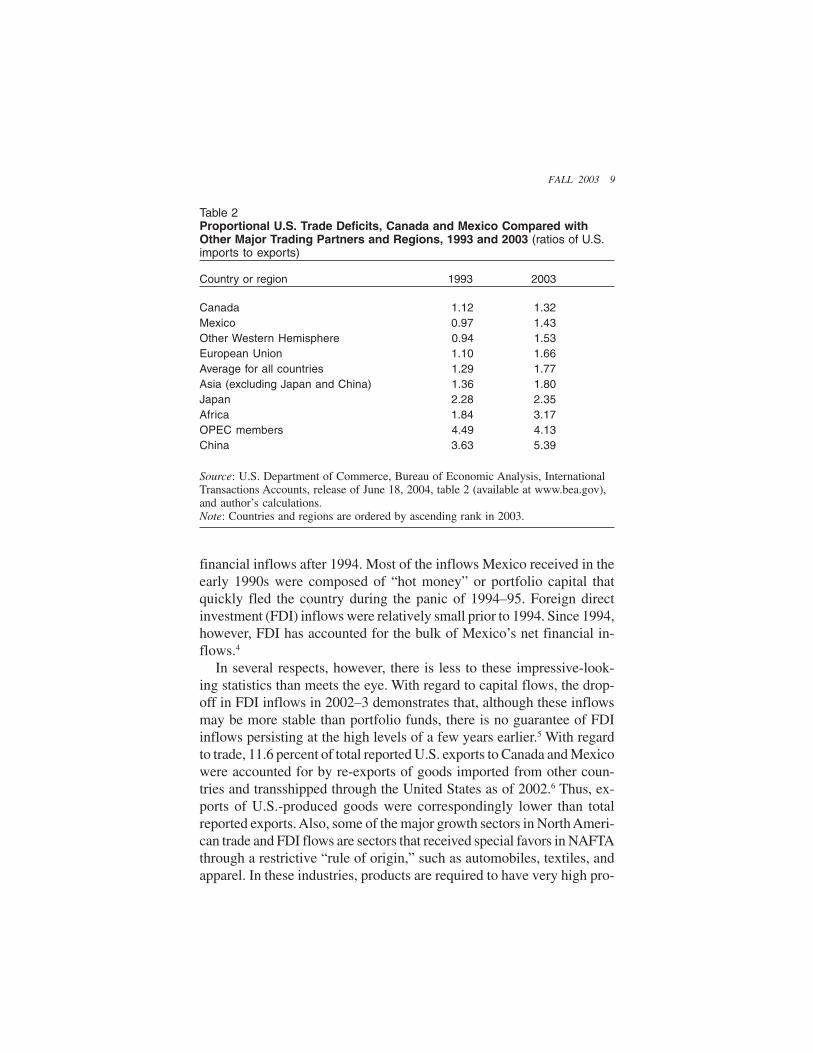
Table 1 also shows that the United States had increasing bilateraltrade deficits with both Canada and Mexico, especially between 1990and 2000 with the former and between 1993 and 2003 with the latter.However, these deficits must be viewed in the context of a large andgrowing overall U.S. trade deficit with all countries during this period.To adjust for country size, Table 2 shows the proportional U.S. tradedeficits, measured by the ratios of U.S. imports to exports, for Canadaand Mexico compared with other major U.S. trading partners, and theaverage for all countries for 1993 and 2003. The U.S. import–exportratios with Canada and Mexico were smaller than the averages for allcountries in both 1993 and 2003—although the ratio with Mexico dete-riorated relatively more than the ratio with Canada over this decade.Thus, trade within North America (and, indeed, with the entire WesternHemisphere) is relatively more of a two-way street for the United Statesthan trade with most other countries and regions, and this has been truesince before NAFTA went into effect.
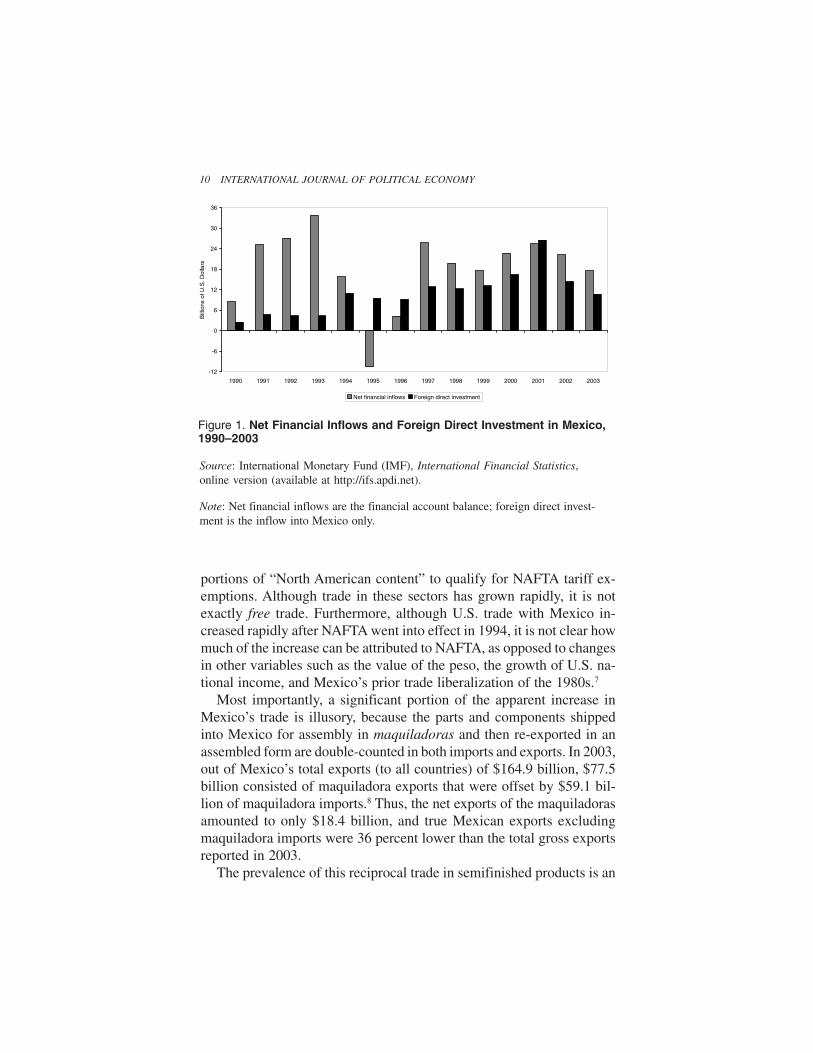
Net “capital flows” (as measured by the financial account balance)into Mexico have been strongly positive throughout most of the periodsince 1990, except for the crisis and recovery years of 1995–96 (seeFigure 1). Also, there was a notable change in the composition of net
Table 1U.S. Bilateral Goods Trade with Canada and Mexico, Selected Years1990–2003 (billions of U.S. dollars)
1990 1993 2000 2003
Exports to Canada 83.4 100.7 178.9 169.9Imports from Canada 93.1 113.1 233.7 224.2Balance with Canada –9.8 –12.4 –54.8 –54.3
Exports to Mexico 28.1 41.5 111.2 97.2Imports from Mexico 30.5 40.4 136.8 139.0Balance with Mexico –2.4 1.1 –25.6 –41.8
Source: U.S. Department of Commerce, Bureau of Economic Analysis, InternationalTransactions Accounts, release of June 18, 2004, table 2 (available at www.bea.gov).
FALL 2003 9
financial inflows after 1994. Most of the inflows Mexico received in theearly 1990s were composed of “hot money” or portfolio capital thatquickly fled the country during the panic of 1994–95. Foreign directinvestment (FDI) inflows were relatively small prior to 1994. Since 1994,however, FDI has accounted for the bulk of Mexico’s net financial in-flows.4
In several respects, however, there is less to these impressive-look-ing statistics than meets the eye. With regard to capital flows, the drop-off in FDI inflows in 2002–3 demonstrates that, although these inflowsmay be more stable than portfolio funds, there is no guarantee of FDIinflows persisting at the high levels of a few years earlier.5 With regardto trade, 11.6 percent of total reported U.S. exports to Canada and Mexicowere accounted for by re-exports of goods imported from other coun-tries and transshipped through the United States as of 2002.6 Thus, ex-ports of U.S.-produced goods were correspondingly lower than totalreported exports. Also, some of the major growth sectors in North Ameri-can trade and FDI flows are sectors that received special favors in NAFTAthrough a restrictive “rule of origin,” such as automobiles, textiles, andapparel. In these industries, products are required to have very high pro-
Table 2Proportional U.S. Trade Deficits, Canada and Mexico Compared withOther Major Trading Partners and Regions, 1993 and 2003 (ratios of U.S.imports to exports)
Country or region 1993 2003
Canada 1.12 1.32Mexico 0.97 1.43Other Western Hemisphere 0.94 1.53European Union 1.10 1.66Average for all countries 1.29 1.77Asia (excluding Japan and China) 1.36 1.80Japan 2.28 2.35Africa 1.84 3.17OPEC members 4.49 4.13China 3.63 5.39
Source: U.S. Department of Commerce, Bureau of Economic Analysis, InternationalTransactions Accounts, release of June 18, 2004, table 2 (available at www.bea.gov),and author’s calculations.Note: Countries and regions are ordered by ascending rank in 2003.
10 INTERNATIONAL JOURNAL OF POLITICAL ECONOMY
portions of “North American content” to qualify for NAFTA tariff ex-emptions. Although trade in these sectors has grown rapidly, it is notexactly free trade. Furthermore, although U.S. trade with Mexico in-creased rapidly after NAFTA went into effect in 1994, it is not clear howmuch of the increase can be attributed to NAFTA, as opposed to changesin other variables such as the value of the peso, the growth of U.S. na-tional income, and Mexico’s prior trade liberalization of the 1980s.7
Most importantly, a significant portion of the apparent increase inMexico’s trade is illusory, because the parts and components shippedinto Mexico for assembly in maquiladoras and then re-exported in anassembled form are double-counted in both imports and exports. In 2003,out of Mexico’s total exports (to all countries) of $164.9 billion, $77.5billion consisted of maquiladora exports that were offset by $59.1 bil-lion of maquiladora imports.8 Thus, the net exports of the maquiladorasamounted to only $18.4 billion, and true Mexican exports excludingmaquiladora imports were 36 percent lower than the total gross exportsreported in 2003.
The prevalence of this reciprocal trade in semifinished products is an
Source: International Monetary Fund (IMF), International Financial Statistics,online version (available at http://ifs.apdi.net).
Note: Net financial inflows are the financial account balance; foreign direct invest-ment is the inflow into Mexico only.
Figure 1. Net Financial Inflows and Foreign Direct Investment in Mexico,1990–2003
-12
-6
0
6
12
18
24
30
36
1990 1991 1992 1993 1994 1995 1996 1997 1998 1999 2000 2001 2002 2003
Bill
ions
of U
.S. D
olla
rs
Net financial inflows Foreign direct investment

FALL 2003 11
important indicator of the degree to which production has become con-tinentally integrated, but it is also a reminder of the limited degree towhich Mexico’s reported exports actually embody Mexican value added.Thanks to the prevalence of maquiladora assembly operations and thehigh import content of all Mexican manufacturing, value added in Mexi-can manufacturing has grown relatively little over the past decade, de-spite the apparently large growth in manufactured exports,9 and manyexport industries have weak or nonexistent linkages to the rest of theMexican economy. However, some parts of the Mexican manufacturingexport sector are technologically dynamic. Mexico’s automotive indus-try has been substantially upgraded by FDI, and its electronics sectorincreasingly produces “more sophisticated . . . products that go beyondmere assembly” (Vega and de la Mora 2003: 175–81). Nevertheless, thegains from these dynamic export activities do not yet appear to have hadsufficient spillover effects to boost the overall growth of the Mexicandomestic economy.
Jobs, Wages, and Income Distribution
From a Mexican perspective, net job creation in tradable goods produc-tion (i.e., manufacturing and agriculture) since NAFTA went into effecthas been extremely disappointing, and possibly negative.10 Unfortunately,comprehensive and consistent data for Mexican employment are notavailable for all of the relevant sectors and years. Nevertheless, oneimportant indicator is the trend in employment in Mexico’s export-ori-ented maquiladora plants. Between 1993 and 2003, such employmentrose by 520,031 workers (from 542,074 to 1,062,105), as an increase of749,158 from 1993–2000 was followed by a loss of 229,127 from 2000–2003 (due to the combined effects of the U.S. recession and increasedU.S. imports from other sources, especially China).11 Although the num-ber of maquiladora workers thus about doubled, this is a relatively smallnumber of jobs created over a ten-year period in a country that needs tocreate nearly 1 million jobs per year just to keep up with the growth ofits labor force.12 The monthly survey of a sample of Mexico’s largest(non-maquiladora) manufacturing firms shows employment falling byroughly 7 percent (from about 1.4 to 1.3 million) over the period 1994–2003, although this survey does not cover all non-maquiladora manu-facturing employment.13 And, although there is not a consistent surveyacross the whole period, the available data indicate a decline in total

12 INTERNATIONAL JOURNAL OF POLITICAL ECONOMY
agricultural employment of at least several hundred thousand and possi-bly as many as a million.14
Although comprehensive statistics are not available, it appears safeto conclude (following Polaski 2003) that the huge job gains that werewidely expected for Mexican manufacturing workers did not material-ize, and that the small gains that occurred in the maquiladoras wereoffset by losses in domestic manufacturing and agriculture. The smallnet job gains in Mexican manufacturing should not be surprising, how-ever, because they were a direct result of the sluggish growth of valueadded (as opposed to gross exports) discussed above. Of course, totalMexican employment has increased since 1993. But, this increase oc-curred mostly due to rising employment in nontradable activities, suchas services (including an increasing amount of nonwage “informal”employment), not because of large job creation in traded goods produc-tion (see Salas and Zepeda 2003).
At the same time, the job losses in the United States that can be at-tributed directly to trade with Mexico are similarly small. For example,Scott (2003) estimates that 879,280 jobs were lost in the United Statesas a result of the worsening of the U.S.–Mexican and U.S.–Canadiantrade balances combined between 1993 and 2002, of which 486,190 canbe attributed to the increased U.S. trade deficit with Mexico and 393,090to the increased deficit with Canada.15 Scott’s precise estimates can becriticized on various grounds,16 and his methodology estimates only theemployment effects of changes in actual trade flows—it does not ac-count for the underlying causes of those changes (such as reductions intrade barriers, fluctuations in exchange rates, or differences in economicgrowth). Nevertheless, Scott’s estimate of the number of jobs that wererelocated from the United States to Mexico after 1993 is plausible, be-cause it is close to the net increase in employment in the Mexicanmaquiladoras, that is, about one-half million jobs. Scott’s estimate ofjobs lost to Canada is also plausible given the falling value of the Cana-dian dollar and its strong effect in reducing Canadian–U.S. relative la-bor costs during the time period he analyzed (1993–2002), as discussedbelow (see also Seccareccia 2005).
How significant are job shifts of this magnitude in the U.S. labormarket? It depends on the perspective one takes. Relative to total U.S.employment, which was about 138 million in 2003, the estimated joblosses due to trade with Mexico and Canada seem very small. Accord-ing to Scott’s estimates, less than 0.7 percent of U.S. workers lost jobs
FALL 2003 13
to the two NAFTA partners combined, and only about 0.4 percent lostjobs to Mexico alone. Relative to manufacturing employment—whichis a more relevant measure of the number of jobs in tradable goods pro-duction—these job losses appear less trivial, however. The estimatedjob losses due to trade with Mexico and Canada combined amount toabout 5 percent of peak U.S. manufacturing employment of about 17.6million in 1998 and to 31 percent of the 2.9 million jobs lost in U.S.manufacturing between 1998 and 2003 (the corresponding figures forMexico alone are 3 percent of peak employment and 17 percent of jobslost).17 Thus, U.S. trade with Canada and Mexico has had a much largerimpact on changes in manufacturing employment “at the margin” thanon total U.S. employment.
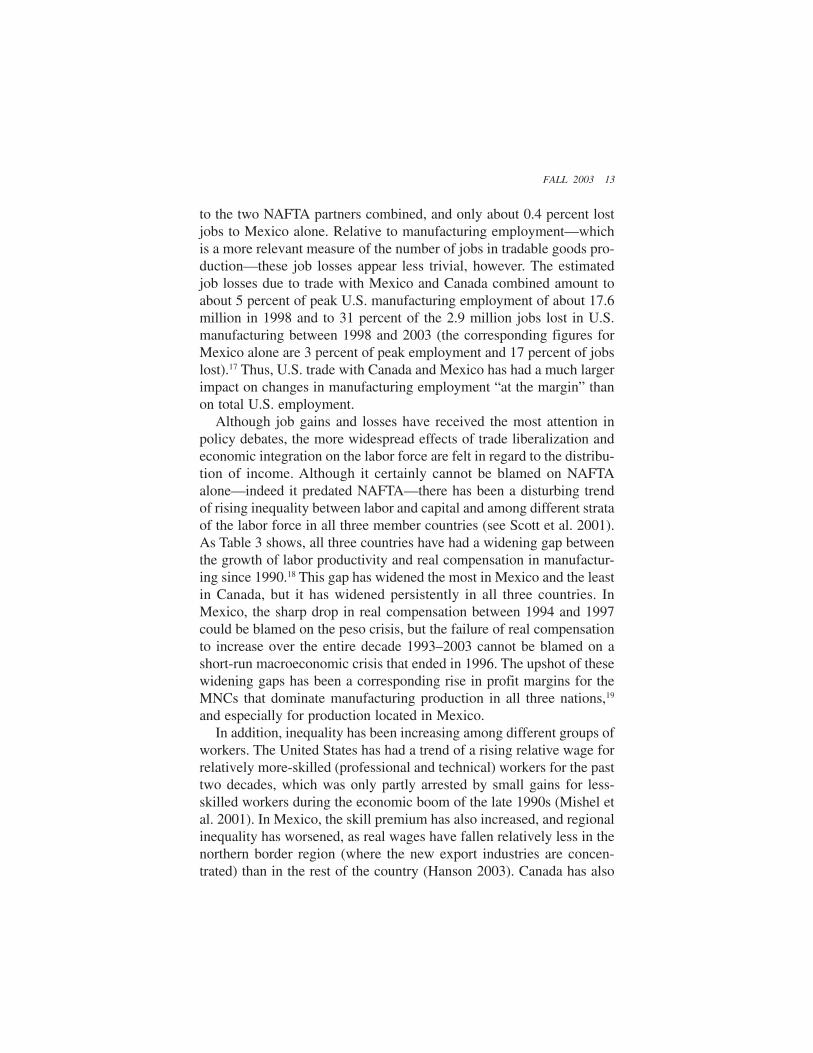
Although job gains and losses have received the most attention inpolicy debates, the more widespread effects of trade liberalization andeconomic integration on the labor force are felt in regard to the distribu-tion of income. Although it certainly cannot be blamed on NAFTAalone—indeed it predated NAFTA—there has been a disturbing trendof rising inequality between labor and capital and among different strataof the labor force in all three member countries (see Scott et al. 2001).As Table 3 shows, all three countries have had a widening gap betweenthe growth of labor productivity and real compensation in manufactur-ing since 1990.18 This gap has widened the most in Mexico and the leastin Canada, but it has widened persistently in all three countries. InMexico, the sharp drop in real compensation between 1994 and 1997could be blamed on the peso crisis, but the failure of real compensationto increase over the entire decade 1993–2003 cannot be blamed on ashort-run macroeconomic crisis that ended in 1996. The upshot of thesewidening gaps has been a corresponding rise in profit margins for theMNCs that dominate manufacturing production in all three nations,19
and especially for production located in Mexico.In addition, inequality has been increasing among different groups of
workers. The United States has had a trend of a rising relative wage forrelatively more-skilled (professional and technical) workers for the pasttwo decades, which was only partly arrested by small gains for less-skilled workers during the economic boom of the late 1990s (Mishel etal. 2001). In Mexico, the skill premium has also increased, and regionalinequality has worsened, as real wages have fallen relatively less in thenorthern border region (where the new export industries are concen-trated) than in the rest of the country (Hanson 2003). Canada has also
14 INTERNATIONAL JOURNAL OF POLITICAL ECONOMY
experienced widening wage inequality, although this has been moreameliorated by government transfer programs in Canada than in the othertwo countries (Jackson 1999; Scott et al. 2001).
Of course, it remains controversial to what extent these trends areaccounted for by the forces of “globalization,” and regional integrationthrough NAFTA is only part of those forces (though an especially im-portant part for Mexico). There has been an extensive debate over thedegree to which changes in income distribution and wage inequality canbe attributed to international trade, capital mobility, labor migration,technological change, and other factors. A full discussion of these issueswould be beyond the scope of this article. Nevertheless, a few pointsmay be made briefly here.
The findings that capital is gaining relative to labor and that more-skilled workers are gaining relative to less-skilled workers in Mexico
Table 3Productivity (output per hour) and Real Hourly Compensation for AllPersons Employed in Manufacturing, 1990–2003 (indexes, 1990 = 100)
United States Canada Mexico
Produc- Compen- Produc- Compen- Produc- Compen-tivity sation tivity sation tivity sation
1990 100.0 100.0 100.0 100.0 100.0 100.01991 101.8 102.4 101.8 101.7 104.9 105.71992 108.0 104.5 106.8 105.6 113.4 114.71993 112.3 104.3 113.2 105.8 122.9 121.31994 117.2 105.4 118.5 107.3 132.2 126.81995 120.8 105.0 120.3 107.4 139.6 112.21996 124.8 104.3 117.4 106.7 149.8 100.11997 130.2 104.2 121.4 107.3 155.9 98.81998 135.0 108.9 121.0 107.1 161.8 101.61999 141.1 111.1 124.2 107.0 166.4 102.52000 146.1 117.3 126.7 105.5 176.1 108.72001 146.1 116.8 124.2 106.5 177.8 116.42002 156.7 119.6 n.a. n.a. 186.3 118.62003 164.5 123.8 n.a. n.a. 190.4 120.2
Sources: U.S. Department of Labor, Bureau of Labor Statistics (available atwww.bea.gov); Statistics Canada (available at www.statcan.ca); Instituto Nacional deEstadística Geográfica e Informática (INEGI), Encuesta Industrial Nacional (availableat www.inegi.gob.mx); and author’s calculations.
FALL 2003 15
are contrary to the predictions of a standard Heckscher–Ohlin model,presuming that Mexico is relatively abundant in labor overall and inless-skilled labor in particular. The rising skill premium in Mexico canbe given a trade-theoretic explanation if one observes that the new, ex-panding export activities in Mexico, although relatively less skilled com-pared to the U.S. industrial job structure, are relatively skill-intensivecompared to the rest of the Mexican economy (Hanson 2003).20 The factthat labor compensation is falling relative to productivity in all threeNAFTA member countries can be explained by Dani Rodrik’s analysisof globalization. Rodrik (1997) argues that when employers have a morecredible threat of relocating jobs abroad, the labor demand curve be-comes more elastic, and hence, it is more difficult for workers to winincreases in wages and benefits.21 Although this may be most visible toAmericans or Canadians in threats to move jobs to developing coun-tries, the same threat is also felt in the latter, where workers fear the lossof their jobs to other developing nations. Mexico, especially, has beennegatively affected by increased U.S. imports from China, a nation withmuch lower wages and an undervalued currency.22
Exchange Rates, Macroeconomic Performance, andIncome Levels
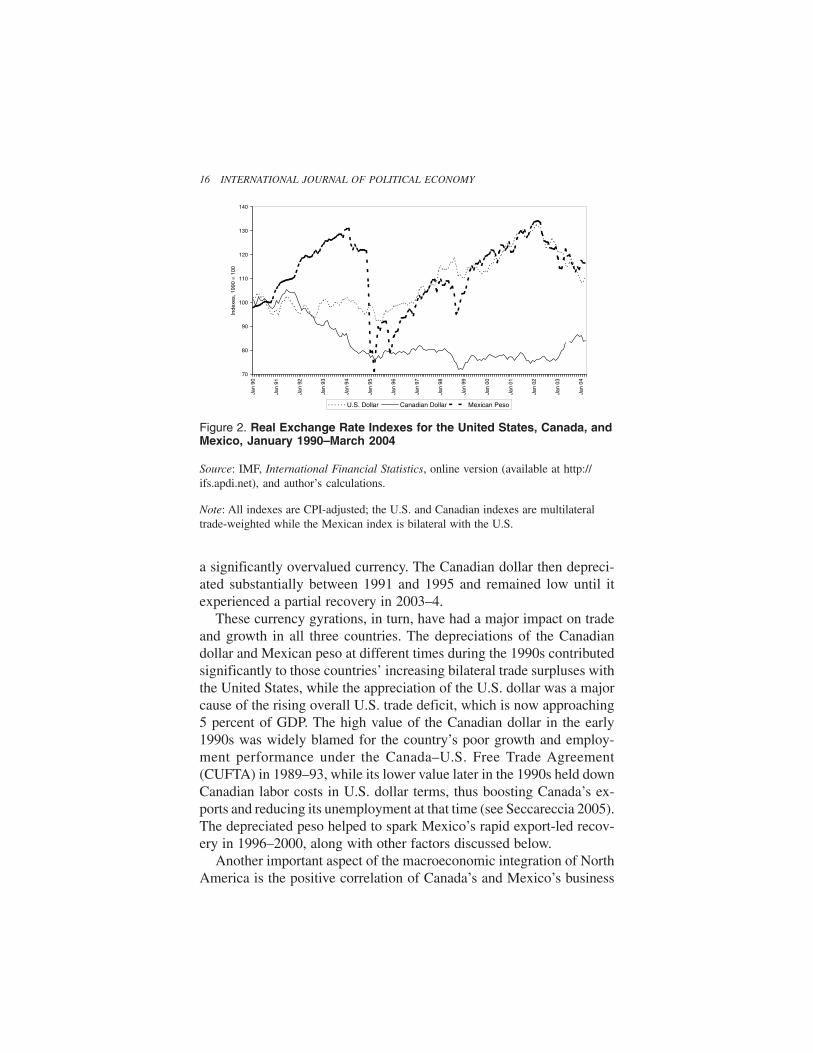
While public attention has focused mainly on NAFTA, real exchangerate fluctuations for the three North American currencies have been anorder of magnitude larger than the tariff reductions enacted by that tradeagreement. The Mexican peso exhibits the most dramatic swings (seeFigure 2), with a strong appreciation during the pre-NAFTA boom infinancial inflows in 1990–93, followed by a stunning collapse duringthe crisis of 1994–95, and then a gradual recovery to a peak in early2002 followed by a more gradual (and partial) depreciation into early2004.23 Meanwhile, the U.S. dollar gradually appreciated by a cumula-tive 43 percent between July 1995 and February 2002, and it subse-quently depreciated by only 17 percent through March 2004. Therelatively small overall decline of the U.S. dollar since February 2002masks divergent behavior relative to two different groups of currencies:a larger decline relative to the euro and a few other floating-rate curren-cies (including the Canadian dollar), and smaller declines or no changerelative to the manipulated currencies of Japan, China, and certain othercountries (see Blecker 2003). Canada, in contrast, began the 1990s with
16 INTERNATIONAL JOURNAL OF POLITICAL ECONOMY
a significantly overvalued currency. The Canadian dollar then depreci-ated substantially between 1991 and 1995 and remained low until itexperienced a partial recovery in 2003–4.
These currency gyrations, in turn, have had a major impact on tradeand growth in all three countries. The depreciations of the Canadiandollar and Mexican peso at different times during the 1990s contributedsignificantly to those countries’ increasing bilateral trade surpluses withthe United States, while the appreciation of the U.S. dollar was a majorcause of the rising overall U.S. trade deficit, which is now approaching5 percent of GDP. The high value of the Canadian dollar in the early1990s was widely blamed for the country’s poor growth and employ-ment performance under the Canada–U.S. Free Trade Agreement(CUFTA) in 1989–93, while its lower value later in the 1990s held downCanadian labor costs in U.S. dollar terms, thus boosting Canada’s ex-ports and reducing its unemployment at that time (see Seccareccia 2005).The depreciated peso helped to spark Mexico’s rapid export-led recov-ery in 1996–2000, along with other factors discussed below.
Another important aspect of the macroeconomic integration of NorthAmerica is the positive correlation of Canada’s and Mexico’s business
Source: IMF, International Financial Statistics, online version (available at http://ifs.apdi.net), and author’s calculations.
Note: All indexes are CPI-adjusted; the U.S. and Canadian indexes are multilateraltrade-weighted while the Mexican index is bilateral with the U.S.
Figure 2. Real Exchange Rate Indexes for the United States, Canada, andMexico, January 1990–March 2004
70
80
90
100
110
120
130
140
Jan
90
Jan
91
Jan
92
Jan
93
Jan
94
Jan
95
Jan
96
Jan
97
Jan
98
Jan
99
Jan
00
Jan
01
Jan
02
Jan
03
Jan
04
Inde
xes,
199
0 =
100
U.S. Dollar Canadian Dollar Mexican Peso
FALL 2003 17
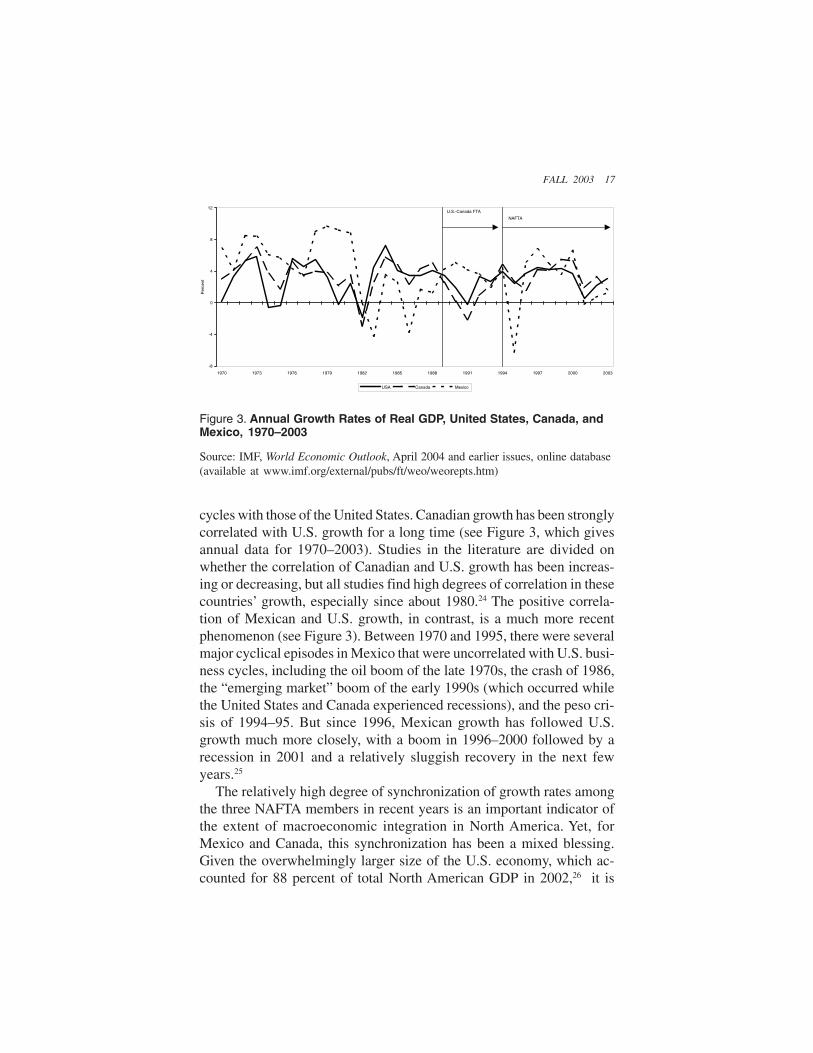
cycles with those of the United States. Canadian growth has been stronglycorrelated with U.S. growth for a long time (see Figure 3, which givesannual data for 1970–2003). Studies in the literature are divided onwhether the correlation of Canadian and U.S. growth has been increas-ing or decreasing, but all studies find high degrees of correlation in thesecountries’ growth, especially since about 1980.24 The positive correla-tion of Mexican and U.S. growth, in contrast, is a much more recentphenomenon (see Figure 3). Between 1970 and 1995, there were severalmajor cyclical episodes in Mexico that were uncorrelated with U.S. busi-ness cycles, including the oil boom of the late 1970s, the crash of 1986,the “emerging market” boom of the early 1990s (which occurred whilethe United States and Canada experienced recessions), and the peso cri-sis of 1994–95. But since 1996, Mexican growth has followed U.S.growth much more closely, with a boom in 1996–2000 followed by arecession in 2001 and a relatively sluggish recovery in the next fewyears.25
The relatively high degree of synchronization of growth rates amongthe three NAFTA members in recent years is an important indicator ofthe extent of macroeconomic integration in North America. Yet, forMexico and Canada, this synchronization has been a mixed blessing.Given the overwhelmingly larger size of the U.S. economy, which ac-counted for 88 percent of total North American GDP in 2002,26 it is
Source: IMF, World Economic Outlook, April 2004 and earlier issues, online database(available at www.imf.org/external/pubs/ft/weo/weorepts.htm)
Figure 3. Annual Growth Rates of Real GDP, United States, Canada, andMexico, 1970–2003
-8
-4
0
4
8
12
1970 1973 1976 1979 1982 1985 1988 1991 1994 1997 2000 2003
Per
cent
USA Canada Mexico
U.S.-Canada FTA
NAFTA

18 INTERNATIONAL JOURNAL OF POLITICAL ECONOMY
clear that the causality runs almost exclusively from U.S. growth toMexican and Canadian growth. Although this looked like a good dealduring the “new economy” boom in the United States in the late 1990s,27
it did not look nearly as beneficial when U.S. growth slowed in 2001–3.Under present circumstances, it is difficult for either Mexico or Canadato sustain an autonomous growth dynamic with the absence of a strongpull from U.S. demand for their exports.
These exchange rate and growth data help to explain two mysteriesin Mexico’s economic performance since the peso crisis of 1994–95.First, why did Mexico’s growth recover so quickly and strongly afterthe crisis? Some commentators have attributed the rapid recovery toNAFTA, which enhanced Mexico’s ability to attract FDI and promoteexports (e.g., Lustig 2001: 98). NAFTA undoubtedly helped, but it wouldnot have helped nearly as much if the peso had stayed as overvalued asit was in 1993–94. Although the peso crisis was exacerbated by finan-cial and macroeconomic mismanagement on the part of the Mexicangovernment, some devaluation of the overvalued peso was inevitableby 1994 (see Blecker 1996), and the depreciation of the peso in the mid-1990s must be counted as another contributing factor in the country’srapid (and export-led) recovery. Furthermore, the U.S. market was grow-ing at the fastest rate in three decades in the late 1990s, just when Mexiconeeded a lift from prosperous export demand. The U.S. economic boomcombined with the depressed value of the peso made Mexico recoverfar more quickly than would have been expected from the tariff reduc-tions and other provisions of NAFTA alone.
Second, by 2001–2, the peso had appreciated in real terms to levelssimilar to those of the precrisis levels of 1993–94 (see Figure 2), yetMexico managed to avoid another currency collapse and financial cri-sis. There are several reasons for the better outcome in the early 2000s.Mexico adopted a managed float exchange rate policy in 1995, and whenthe peso became overvalued in 2001–2, the government was able toease the peso down in value over the next two years without inviting aspeculative attack, as it did when it tried to defend an indefensible pegin 1994. Also, a conventional measure of the real value of the peso (suchas the index shown in Figure 2, which adjusts the nominal exchange rateby relative domestic consumer prices) may not be a good reflection ofthe country’s export competitiveness. Thanks to the strong productivitygrowth and real wage repression noted earlier, Mexico was able to holddown its unit labor costs and prevent export prices from rising as much
FALL 2003 19
Tabl
e 4
Co
mp
arat
ive
Nat
ion
al I
nco
me,
Per
Cap
ita
Inco
me,
an
d R
eal
Wag
e D
ata,
199
3 V
ersu
s 20
02
Can
ada
Mex
ico
Uni
ted
Sta
tes
1993
2002
1993
2002
1993
2002
GD
P (
curr
ent
US
$ bi
llion
s)55
4.7
714.
340
3.2
637.
26,
582.
910
,383
.1G
DP
per
cap
ita (
cons
tant
199
5 U
S$)
18,7
2723
,621
3,32
13,
717
26,5
92 3
1,89
1G
NI
per
capi
ta (
curr
ent
US
$)20
,250
22,3
904,
230
5,92
025
,800
35,
400
GN
I pe
r ca
pita
(P
PP
$)
19,4
8028
,930
6,68
08,
800
25,5
70 3
6,11
0H
ourly
com
pens
atio
n of
man
ufac
turin
gpr
oduc
tion
wor
kers
, in
US
$$1
6.55
$16.
02$2
.41
$2.6
1$1
6.51
$21.
37
Per
cent
ages
of
U.S
. Lev
els
GD
P (
curr
ent
US
$ bi
llion
s) 8
.4 6
.9 6
.1 6
.110
0.0
100.
0G
DP
per
cap
ita (
cons
tant
199
5 U
S$)
70.4
74.1
12.5
11.7
100.
010
0.0
GN
I pe
r ca
pita
(cu
rren
t U
S$)
78.5
63.2
16.4
16.7
100.
010
0.0
GN
I pe
r ca
pita
(P
PP
$)
76.2
80.1
26.1
24.4
100.
010
0.0
Hou
rly c
ompe
nsat
ion
of m
anuf
actu
ring
prod
uctio
n w
orke
rs,
in U
S$
100.
275
.014
.612
.210
0.0
100.
0
Sour
ces:
Wor
ld B
ank,
Wor
ld D
evel
opm
ent
Indi
cato
rs, o
nlin
e ve
rsio
n (a
vaila
ble
at w
ww
.wor
ldba
nk.o
rg/d
ata/
); a
nd U
.S. D
epar
tmen
t of
Lab
or, B
urea
u of
Lab
or S
tatis
tics,
“In
tern
atio
nal
Com
pari
sons
of
Hou
rly
Com
pens
atio
n C
osts
for
Pro
duct
ion
Wor
kers
in
Man
ufac
turi
ng,
Rev
ised
Dat
a fo
r 20
02”
and
“Sup
plem
enta
ry T
able
s, 1
975–
2002
,” r
elea
sed
May
19,
200
4 (a
vaila
ble
at w
ww
.bls
.gov
/fls
/hom
e.ht
m).
20 INTERNATIONAL JOURNAL OF POLITICAL ECONOMY
as they would have otherwise.28 In addition, the switch in the dominantform of financial inflows from “hot money” to FDI helped to stabilizeMexico’s balance of payments, although it did not prevent a drop-off inoverall financial inflows in 2002–3, as noted earlier.
Finally, Mexico’s slower growth since 2001 has curbed the growth ofimport demand and, thereby, has helped to prevent an excessive tradedeficit (in spite of its bilateral surplus with the United States, Mexicoruns an overall deficit with all nations). However, the need to repressdomestic growth in order to prevent growing trade deficits represents aweakness in Mexico’s current policy paradigm. As a result of the tradeliberalizations of the late 1980s and early 1990s, Mexico’s gains in ex-port promotion have been offset by greater openness to imports, whichhas increased the country’s income elasticity of import demand (seeMoreno-Brid 1999; Pacheco-López 2005). Thus, despite rapid exportgrowth, Mexico finds itself chronically needing to use contractionaryfiscal and monetary policies to prevent recurring balance of paymentscrises. This is an important reason why Mexico’s average growth ratehas remained relatively low in the post-reform, post-NAFTA period com-pared with the earlier post–World War II decades (see Huerta González2004; Moreno-Brid and Ros 2004).
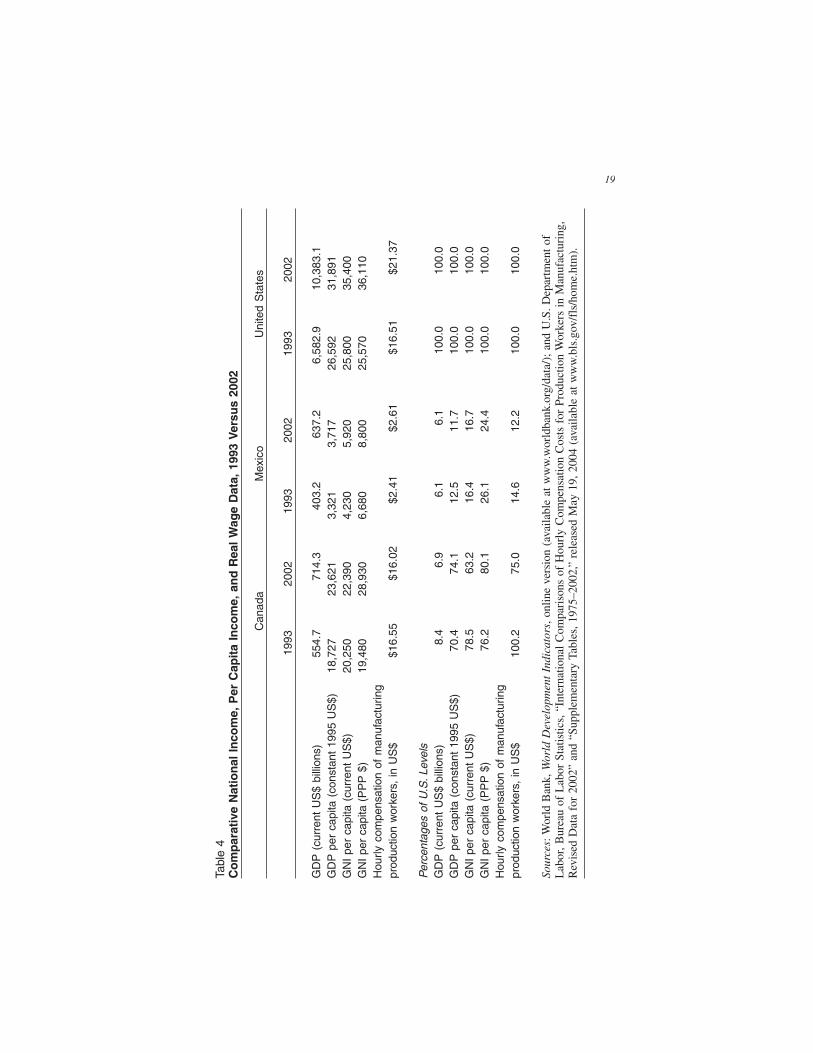
The end result of all of these changes is that Mexico has thus far failedto achieve the convergence of average incomes with the United States andCanada that it hoped for when it joined NAFTA. Table 4 compares totalGDP, three measures of per capita income, and hourly compensation ofmanufacturing production workers in the three NAFTA countries, in theyear before NAFTA took effect (1993) and the most recent year for whichall data were available (2002). By all these measures, Mexico has notgained any ground relative to the United States since 1993, and by some(especially manufacturing compensation in U.S. dollars), it has lost ground.There is no evidence of any catch-up in average Mexican living standardsto U.S. or Canadian levels under NAFTA. Canada fell behind relative tothe United States in all the indicators (total GDP, per capita income, andhourly compensation) measured in current U.S. dollars, but these indica-tors are heavily influenced by the lower value of the Canadian dollar in2002 compared with 1993. When per capita income is measured in realterms or at purchasing power parity (PPP) exchange rates, Canada im-proved slightly relative to the United States. Mexico, in contrast, has com-pletely failed to close the “development gap” with the United States andCanada in the first ten years of NAFTA.

FALL 2003 21
Conclusions
If the objective of NAFTA was to promote intra-North American tradeand investment flows and to improve profitability for large multina-tional corporations, the evidence suggests that it has been successful.But NAFTA was not sold to the publics of the three countries based onthese narrow objectives. NAFTA’s promoters predicted that it wouldgive a tremendous stimulus to the growth and development of the Mexi-can economy and (when not predicting actual job gains) argued that anysacrifices of U.S. and Canadian workers would be minimal prices to payfor boosting the economy of their poorer neighbors to the south. In theprevailing neoliberal ideology of the early 1990s, Mexico could sup-posedly rescue its economy from the lost decade of the 1980s through“trade not aid.”
Although the adjustment costs in the United States and Canada havenot been large (except in specific industries and localities), liberalizedtrade and investment flows have not brought the promised developmen-tal benefits to Mexico or led to its convergence with its richer northernneighbors. Ironically, the most painful adjustment costs have been feltin Mexico, and there is no single greater indicator of the failure of NAFTA(and related free-market reforms in Mexico) to solve that country’s eco-nomic problems than the fact that an estimated 4 to 5 million Mexicansmigrated to the United States during the 1990s.29 NAFTA did not causethis massive migration, but it also did not boost employment or wagesin Mexico enough to prevent it (as many NAFTA promoters claimed itwould, prior to 1994). As long as income and compensation gaps of themagnitude shown in Table 4 persist, the more remunerative U.S. andCanadian job markets will continue to exert an ineluctable pull on Mexi-can workers.
Fundamentally, the overblown expectations for NAFTA were the re-sult of an excessive faith in trade policy and foreign investment as en-gines of growth and development. As two Mexican scholars have written:
In order to achieve balanced and sustained development, Mexico mustfind mechanisms to make its domestic productive structure as dynamicas its export sector. Trade policy can be a powerful instrument to promotedevelopment, but it cannot be the only one. Nor can it be a substitute fordomestic growth. (Vega and de la Mora 2003: 164)
Recognizing the limited ability of trade policy and foreign investmentto stimulate domestic growth and solve development problems is a first
22 INTERNATIONAL JOURNAL OF POLITICAL ECONOMY
step toward constructing a more adequate policy paradigm for NorthAmerica. In the coming years, the continent needs to move in two direc-tions: greater cooperation in policy areas beyond trade and greater focuson domestic development policies inside Mexico.
There are many areas in which more continent-wide cooperation isneeded. Exchange rates should be managed to stabilize real currencyvalues and prevent excessive trade imbalances from arising (an objec-tive that would not be served by fixed nominal exchange rates, formaldollarization, or a monetary union). A trade-off of increased rights andprotections for Mexican migrants in the United States for increased la-bor rights and standards inside Mexico would do much to benefit Mexi-can workers and improve their living standards on both sides of theborder. Most importantly, all three countries need to escape from thezero-sum game of competing over job opportunities through lower wagesor exchange rates. This has to be accomplished by pursuing full-em-ployment policies, instead of repressing domestic demand to placatefinancial investors.30 Given the larger size of the U.S. economy and theimportance of its market for Mexico and Canada, expansionary U.S.macroeconomic policies are especially important for allowing the lattertwo countries to achieve full employment and rapid growth without run-ning into balance of payments constraints. To address all these issuesand other social concerns (e.g., environmental protection), and to counterthe otherwise excessive emphasis on private property rights in NAFTA,the three countries need to create a set of democratic governance insti-tutions to oversee the continental integration process (see Pastor 2001).
It is also time to abandon the free-market ideology that pretends thattrade and investment liberalization alone can propel Mexico’s long-runeconomic development and enable it to converge to the United States.Mexico desperately needs more public investment in infrastructure andeducation, along with internal reforms to combat corruption, strengthenfinancial regulation, and enhance open, democratic institutions. A moreefficient tax system would help Mexico pay for its needs in these areaswithout running large budget deficits (and without so much reliance onoil revenue). But given Mexico’s lower per capita income level, a U.S.–Canadian development assistance fund for Mexico (on the model of theEuropean Union’s regional policy) is also essential to pay for the neededpublic expenditures (see Pastor 2004). Aside from the obvious benefitsto Mexico, such a fund would be in the self-interest of the United Statesand Canada insofar as it would help to ameliorate the social pressures
FALL 2003 23
that lead so many Mexicans to migrate northward and to create a moreprosperous trading partner south of the border.
Finally, Mexico needs to move further up the “industrial ladder” toavoid becoming stuck in low-skill, low-wage assembly activities thatoffer few long-term developmental benefits. Mexico’s labor costs maylook low relative to those of the United States or Canada, but they arenot low relative to most other developing countries, and Mexico willnot win in the long run by trying to play the game of offering cheapwages to attract labor-intensive FDI. By investing more in education,training, and infrastructure, Mexico can attract more skill-intensive in-dustries with greater spillover benefits for the domestic economy—anda greater potential to raise Mexican families’ incomes toward U.S. andCanadian levels.
Notes
1. According to Lustig, Mexico’s primary objective in seeking the NAFTA agree-ment was “to entice the capital inflows required for economic recovery and sus-tained growth” that “did not respond with the expected vigor to the Brady-type debtagreement and the far-reaching [domestic] economic reforms” in Mexico in the early1990s (1992: 134).
2. Bilateral Canadian–Mexican trade remains relatively small, accounting foronly about 2 percent of Mexico’s trade.
3. See U.S. Department of Commerce, Bureau of Economic Analysis, Interna-tional Transactions Accounts, Release of June 18, 2004, table 2 (available at www.bea.gov).
4. This point has also been noted by Pastor and Wise (2003: 186–87).5. See Máttar et al. (2003) on the limited benefits of Mexico’s FDI boom in the
1990s.6. See Scott (2003: 3), who cites U.S. Census Bureau data.7. Krueger (1999), Pacheco-López and Thirlwall (2004), and Pacheco-López
(2005) find no statistically significant effects of NAFTA on Mexican exports, aftercontrolling for other factors. Lederman et al. (2003: 231–40) claim to show thatNAFTA increased Mexico’s global exports by 25–30 percent, but they use a modelthat does not control for the value of the peso (which depreciated significantly rightafter NAFTA went into effect, as discussed below).
8. These data are from the table, “Comercio exterior de maquiladoras y nomaquiladoras, FOB/FOB,” obtained from the Mexican government’s statisticalagency, Instituto Nacional de Estadística, Geografía e Informática (INEGI) (avail-able at www.inegi.gob.mx).
9. See United Nations Conference on Trade and Development (2002: 77–81).10. The following discussion covers the same data presented by Polaski (2003:
14–20), but this discussion is based on the original data series and qualifies someaspects of her presentation.

24 INTERNATIONAL JOURNAL OF POLITICAL ECONOMY
11. Annual averages were calculated by the author based on data from the table,“Industria Maquiladora de Exportación: Total Personal Ocupado,” Monthly Indus-trial Survey (Encuesta Industrial Mensual), from INEGI (available at www.inegi.gob.mx).
12. World Bank, World Development Indicators, online database (available atwww.worldbank.org/data/).
13. Data from before 1994 are from a smaller survey and are not comparable.Smaller firms, possibly including new start-up companies, are not included in thissurvey. The 1999 Mexican Census showed 4.2 million total employed persons inmanufacturing, but the census is not conducted on an annual basis, and the annualSurvey of National Employment (Encuesta Nacional de Empleo) includes manufac-turing in a broader category of “industries of transformation.” All Mexican employ-ment data are from INEGI.
14. Mexico’s new Survey of National Employment (Encuesta Nacional deEmpleo) shows a decrease of 728,630 from 1998–2003, while its previous Surveyshowed a decrease of 372,390 between 1991 and 1998 (both surveys include fishingand related primary activities along with agriculture, but exclude mining). Becausethe two surveys are not consistent, however, it is not possible to compute an exactchange over the entire period.
15. Scott’s estimate includes a correction for goods re-exported by the UnitedStates to Mexico and Canada, which he subtracts from reported U.S. exports, and isbased on the employment multipliers associated with the types of goods traded be-tween the United States and Canada and Mexico. The job losses attributed to the twocountries separately were calculated by this author using the percentages of eachcountry in the increased total trade deficit with both countries as reported by Scott.
16. One problem is the implicit assumption that all increases in U.S. importsfrom its NAFTA partners come at the expense of domestic production instead of atthe expense of imports from other countries. However, Scott’s methodology con-trols for the fact that Canada and Mexico are better customers for U.S. exports thanother countries, as noted above, because the jobs associated with increased U.S.exports to Mexico are subtracted from the jobs lost due to increased imports.
17. Based on U.S. Department of Labor, Bureau of Labor Statistics data, asreported in Economic Report of the President, 2004, table B-46 (available atwww.gpoaccess.gov/eop/tables04.html). “Peak” manufacturing employment heremeans the highest level reached during the late 1990s economic boom.
18. Canadian data ending in 2001 are on a SIC basis, and newer data for 2002–3 based on the NAICS are not yet available. The U.S. data are all on a NAICS basis;the Mexican data are spliced together from two different monthly industrial sur-veys, pre- and post-1993. Similar figures are presented in Jackson (1999) for Canadaand the United States and in Polaski (2003) for Mexico and Canada.
19. Although part of the increasing productivity–compensation gap in the UnitedStates can be attributed to a rise in consumer prices relative to output prices, therehas, nevertheless, been a rising trend of the profit share in the U.S. economy thatdates back to the early 1980s (Wolff 2003).
20. Alternatively, the Heckscher–Ohlin model can be used to explain the fallingreal wages of (unskilled) workers in Mexico if there is a factor intensity reversal, assuggested by Larudee (1998): if agriculture is (unskilled) labor-intensive in Mexicobut capital-intensive in the United States, and if Mexico imports agricultural prod-
FALL 2003 25
ucts (e.g., corn) under free trade, then free trade hurts (unskilled) labor in both coun-tries. Another trade-theoretic explanation, suggested to this author by David Shirk,is that the large supply of unskilled labor in China could be depressing wages ofsuch workers globally, including in Mexico.
21. This argument of Rodrik can be viewed as a simple expression, in supply-and-demand terms, of the idea that heightened capital mobility and liberalized for-eign trade reduce the bargaining power of labor.
22. See Thompson (2001) and Shatz and López-Calva (2004) on Mexican lossesof FDI and jobs to China.
23. Although the real exchange rate shown for Mexico in Figure 2 is a bilateralindex with the U.S. dollar only, because the vast majority of Mexico’s trade is withthe United States, this index reflects the predominant direction of change in thepeso’s value. Because the peso and U.S. dollar were both appreciating between1996 and 2002, a real effective (trade-weighted) exchange rate index for the pesowould show an even greater appreciation in the late 1990s and early 2000s than thisbilateral real exchange rate with the U.S. dollar.
24. Chen and Curtis (2004) find that the correlation of U.S. and Canadian growthrates of real GDP increased between 1950–79 and 1980–99, while Lederman et al.(2003: 46) find that this correlation was lower in 1994–2001 than in the longerperiod 1981–2001. However, both of these studies find the correlation to be consis-tently over 60 percent in the years after 1980. The reasons for variations betweenCanadian and U.S. economic performance, such as exchange rate fluctuations, arediscussed elsewhere in this paper.
25. Authers (2004) demonstrates a strong correlation of the U.S. and Mexicanmonthly indexes of industrial production from December 1997 through May 2004.
26. See the data in Table 4.27. For an analysis of why the U.S. boom in the late 1990s was not sustainable,
see Pollin (2003).28. The Banco de México’s index of export prices in U.S. dollars (available at
www.banxico.gob.mx) was much more stable in the 1990s than one would expectfrom the large swings in the value of the peso. Although to some extent this prob-ably reflects pricing-to-market and transfer-pricing behaviors, it also suggests that aconventional real exchange rate measure may exaggerate the harm to Mexico’s ex-port competitiveness caused by domestic consumer price inflation.
29. For a range of estimates, see Martin (2003) and Papademetriou (2003).30. See Stanford (1999) and Seccareccia (2005) on repressive domestic demand
policies in the Canadian economy and Huerta González (2004) on the Mexicaneconomy.
References
Authers, J. 2004. “Mexico Gets Grace Period via US Link.” Financial Times, July19.
Blecker, R.A. 1996. “NAFTA, the Peso Crisis, and the Contradictions of theMexican Economic Growth Strategy.” CEPA Working Paper 1996-04, Centerfor Economic Policy Analysis, New School University (available atwww.newschool.edu/cepa/papers/index.htm).

26 INTERNATIONAL JOURNAL OF POLITICAL ECONOMY
———. 2003. “Why the Dollar Needs to Fall Further.” Challenge 46, no. 5(September/October): 15–36.
Chen, S., and J.M. Curtis. 2004. “How Does International Trade Affect BusinessCycle Synchronization in North America.” Horizons 7, no. 1 (June): 64–68(available at www.policyresearch.gc.ca).
Hanson, G.H. 2003. “What Has Happened to Wages in Mexico Since NAFTA?Implications for Hemispheric Free Trade.” NBER Working Paper No. 9563.National Bureau of Economic Research, Cambridge, MA.
Huerta González, A. 2004. La Economía Política del Estancamiento [ThePolitical Economy of Stagnation]. Mexico City: Editorial Diana.
Jackson, A. 1999. “The Free Trade Agreement—A Decade Later.” Studies inPolitical Economy 58 (Spring): 141–60.
Krueger, A. 1999. “Trade Creation and Trade Diversion under NAFTA.” NBERWorking Paper No. 7429. National Bureau of Economic Research, Cambridge,MA.
Larudee, M. 1998. “Integration and Income Distribution Under the NorthAmerican Free Trade Agreement: The Experience of Mexico.” InGlobalization and Progressive Economic Policy, ed. D. Baker, G. Epstein, andR. Pollin, 273–92. Cambridge: Cambridge University Press.
Lederman, D., W.F. Mahoney, and L. Serven. 2003. Lessons from NAFTA forLatin America and the Caribbean Countries: A Summary of ResearchFindings. Washington, DC: World Bank.
Lustig, N. 1992. Mexico: The Remaking of an Economy. Washington, DC:Brookings Institution Press.
———. 2001. “Life Is Not Easy: Mexico’s Quest for Stability and Growth.”Journal of Economic Perspectives 15, no. 1 (Winter): 85–106.
Martin, P. 2003. “Mexico–US Migration.” Working Paper. Institute forInternational Economics, Washington, DC.
Máttar, J., J.C. Moreno-Brid, and W. Peres. 2003. “Foreign Investment in Mexicoafter Economic Reform.” In Confronting Development: Assessing Mexico’sEconomic and Social Policy Challenges, ed. K. J. Middlebrook and E. Zepeda,123–60. Stanford: Stanford University Press.
Mishel, L., J. Bernstein, and J. Schmitt. 2001. The State of Working America,2000/01. Ithaca: Cornell University Press.
Moreno-Brid, J.C. 1999. “Mexico’s Economic Growth and the Balance ofPayments Constraint: A Cointegration Analysis.” International Review ofApplied Economics 13, no. 2: 149–59.
Moreno-Brid, J.C., and J. Ros. 2004. “Mexico’s Market Reforms in HistoricalPerspective.” Revised version of paper presented at the LACEA meeting inCholula, Puebla, Mexico (January).
Pacheco-López, P. 2005. “The Impact of Trade Liberalisation on Exports, Imports,the Balance of Payments, and Growth: The Case of Mexico.” Journal of PostKeynesian Economics 27, no. 4 (summer).
Pacheco-López, P., and A.P. Thirlwall. 2004. “Trade Liberalisation in Mexico:Rhetoric and Reality.” Banca Nazionale del Lavoro Quarterly Review, no. 229(June): 141–67.
Papademetriou, D.G. 2003. “The Shifting Expectations of Free Trade andMigration.” In NAFTA’s Promise and Reality: Lessons from Mexico for the

FALL 2003 27
Hemisphere, ed. J.J. Audley et al., 39–59. Washington, DC: CarnegieEndowment for International Peace.
Pastor, M., and C. Wise. 2003. “A Long View of Mexico’s Political Economy:What’s Changed? What Are the Challenges?” In Mexico’s Politics and Societyin Transition, ed. J.S. Tulchin and A.D. Sele, 179–213. Boulder, CO: LynneRienner.
Pastor, R.A. 2001. Toward a North American Community: Lessons from the OldWorld for the New. Washington, DC: Institute for International Economics.
———. 2004. “North America’s Second Decade.” Foreign Affairs 83, no. 1(January–February): 124–35.
Polaski, S. 2003. “Jobs, Wages, and Household Income.” In NAFTA’s Promiseand Reality: Lessons from Mexico for the Hemisphere, ed. J.J. Audley et al.,11–37. Washington, DC: Carnegie Endowment for International Peace.
Pollin, R. 2003. Contours of Descent: U.S. Economic Fractures and theLandscape of Global Austerity. London: Verso.
Rodrik, D. 1997. Has Globalization Gone Too Far? Washington, DC: Institute forInternational Economics.
Salas, C., and E. Zepeda. 2003. “Employment and Wages: Enduring the Costs ofLiberalization and Economic Reform.” In Confronting Development: AssessingMexico’s Economic and Social Policy Challenges, ed. K. J. Middlebrook and E.Zepeda, 522–58. Stanford: Stanford University Press.
Scott, R.E. 2003. The High Price of “Free” Trade. Washington, DC: EconomicPolicy Institute.
Scott, R.E., C. Salas, and B. Campbell. 2001. NAFTA at Seven: Its Impact onWorkers in All Three Nations. Washington, DC: Economic Policy Institute.
Seccareccia, Mario. 2005. “Some Critical Macroeconomic Aspects of DeepeningNorth American Economic Integration.” In The Slippery Slope: Canada, FreeTrade and Deep Integration in North America, ed. R. Grinspun and Y.Shamsie. Montreal: McGill-Queen’s University Press, forthcoming.
Shatz, H.J., and L.F. López-Calva. 2004. The Emerging Integration of the California–Mexico Economies. San Francisco: Public Policy Institute of California.
Stanford, J. 1999. Paper Boom: Why Real Prosperity Requires a New Approach toCanada’s Economy. Toronto: Lorimer, and Ottawa: Canadian Centre for PolicyAlternatives.
Thompson, G. 2001. “Fallout of U.S. Recession Drifts South into Mexico.” NewYork Times, December 26.
United Nations Conference on Trade and Development. 2002. Trade andDevelopment Report, 2002. Geneva: United Nations.
Vega, G., and L.M. de la Mora. 2003. “Mexico’s Trade Policy: Financial Crisis andEconomic Recovery.” In Confronting Development: Assessing Mexico’sEconomic and Social Policy Challenges, ed. K.J. Middlebrook and E. Zepeda,163–94. Stanford: Stanford University Press.
Wolff, E.N. 2003. “What’s Behind the Rise in Profitability in the US in the 1980sand 1990s?” Cambridge Journal of Economics 27, no. 4 (July): 479–99.
To order reprints, call 1-800-352-2210; outside the United States, call 717-632-3535.