The NHS Pay Review Body (NHSPRB) Review for 2018 · The review body will be updated of progress in...
78
January 2018 The NHS Pay Review Body (NHSPRB) Review for 2018 Written Evidence from the Department of Health and Social Care for England
Transcript of The NHS Pay Review Body (NHSPRB) Review for 2018 · The review body will be updated of progress in...

January 2018
The NHS Pay Review Body (NHSPRB) Review for 2018 Written Evidence from the Department of Health
and Social Care for England

2
DH ID box
Title: The NHS Pay Review Body (NHSPRB) Review for 2018: Written Evidence from the Department for Health
and Social Care for England
Author: Acute Care and Workforce/ Workforce/Pay, Pensions & Employment Services /13710
Document Purpose:
Policy
Publication date: 25/01/2018
Target audience:
Pay Review Bodies
Public
NHS Organisations
Contact details:
nhs_pp&[email protected]
You may re-use the text of this document (not including logos) free of charge in any format or medium, under the terms of the Open Government Licence. To view this licence, visit www.nationalarchives.gov.uk/doc/open-government-licence/
© Crown copyright 2018
Published to gov.uk, in PDF format only.
www.gov.uk/dh

3
Contents
Contents .................................................................................................................................... 3
Executive summary .................................................................................................................... 5
1. Strategy and Introduction .................................................................................................. 8
Workforce................................................................................................................................. 9
Staff engagement .................................................................................................................... 9
Government Pay Policy and our approach to contract reform .............................................. 9
2. Evidence on the General Economic Outlook ................................................................... 11
Introduction ........................................................................................................................... 11
Public Finances....................................................................................................................... 11
Labour market ........................................................................................................................ 12
Public sector pay and pensions ............................................................................................. 14
3. NHS Finances ................................................................................................................... 16
Funding Growth ..................................................................................................................... 16
Share of Resource Going to Pay ........................................................................................... 16
Demand Pressures ................................................................................................................. 18
Efficiency Savings ................................................................................................................... 22
Conclusion.............................................................................................................................. 23
4. Hospital and Community Health Services (HCHS) Agenda for Change Staff Earnings .. 24
Summary ................................................................................................................................ 24
HCHS Earnings & Earnings Growth Analysis ......................................................................... 24
Changes in Earnings .............................................................................................................. 26
Current pay levels vs comparator groups in the wider economy ........................................ 28
Why has the NHS paybill per FTE grown? ............................................................................ 28
Recruitment & Retention Premia .......................................................................................... 30
Regional Variation.................................................................................................................. 31
5. State of the NHS labour market for non-medical staff .................................................. 32
Background ............................................................................................................................ 32
Workforce Information .......................................................................................................... 33
Numbers in work ................................................................................................................... 34
Funding Reform for Student Nurses and Allied Health Professions .................................... 34
Skill Mix .................................................................................................................................. 35
Return to Practice .................................................................................................................. 37
Retention ................................................................................................................................ 38
Non-medical staff reasons for leaving .................................................................................. 39

The NHS Pay Review Body (NHSPRB) Review for 2018
4
Staff Group Leaver rates by region. ...................................................................................... 41
............................................................................................................................................... 42
Advertised vacancies (FTE) data ............................................................................................ 48
Agency (all HCHS staff) and Bank (non-medical staff only) ................................................. 49
Bank Staff ............................................................................................................................... 51
Apprenticeships ..................................................................................................................... 51
Staff experience - Introduction.............................................................................................. 52
Staff Motivation ..................................................................................................................... 54
Staff satisfaction ..................................................................................................................... 55
Staff Engagement .................................................................................................................. 59
Staff Health and Wellbeing ................................................................................................... 61
Sickness Absence ................................................................................................................... 62
6. AfC and contract reform .................................................................................................. 66
National Living Wage ............................................................................................................ 67
7. Pensions & Total Reward ................................................................................................. 68
Introduction ........................................................................................................................... 68
NHS Pension Scheme contributions ...................................................................................... 68
NHS Pension Scheme membership levels ............................................................................. 70
Total Reward .......................................................................................................................... 71
Comparative analysis with private sector occupations ......................................................... 73
NHS Trend analysis ................................................................................................................ 74
Total Reward Statements ....................................................................................................... 74
8. Annex 1: NHS Pension Scheme membership rate and trends ........................................ 76

5
Executive summary
This evidence is provided in the context of the strategic direction set out by the government for public sector pay: a pay policy designed to ensure that public sector pay packages continue to recognise workers’ vital contributions, while also being affordable and fair to taxpayers as a whole. The aim for the wider public sector as well as the NHS is to reform and modernise terms and conditions, developing more affordable, sustainable pay systems.
The government has confirmed that the across-the-board 1% public sector pay policy will no longer apply to pay awards for 2018-19. This is due to recognition that in some parts of the
public sector, particularly in areas of skills shortage, flexibility to go above the one per cent may be required to ensure continued delivery of world class public services, including in return for improvements to public sector productivity.
The recent lower forecast by the Office for Budgetary Responsibility (OBE) for productivity growth together with the government’s drive to reduce debt and borrowing provides the context for informing the affordability of specific pay awards and the importance of pay bill spending to deliver maximum value for money
We recognise that the NHS continues to face significant challenge with increasing demand for health services due to an ageing, growing population and the requirement to recover the provider net deficit position. In the spending review of 2015 the Government committed to backing the NHS with an additional £8 billion in real terms by 2020/21. The pay bill continues to grow largely as a result of rising on-costs and an expansion of the work force and there has been very limited growth as a result of additional earnings, pay drift or the use recruitment and retention premia.
At Budget 2017 the Government committed a further £2.8 billion of revenue funding by 2019/20, and an additional £3.5 billion of new capital investment by 2022/23 to transform the NHS estate and drive further efficiency savings.
Whilst this is a generous settlement, demands on the health and social care system continue to increase and meeting this demand whilst simultaneously improving quality of service in an affordable way is increasingly challenging. Meeting that challenge requires a focus on efficiency and transformational change.
Pay Policy
The remit letter from the Secretary of State confirmed that the Government has adopted a more flexible approach to public sector pay to address areas of skills shortages and in return for improvements in public sector productivity. It also confirmed that additional funding has been made available for Agenda for Change Staff provided that the awards are part of an agreement with Agenda for Change trades unions about reforms to boost productivity.

The NHS Pay Review Body (NHSPRB) Review for 2018
6
NHS trades unions agreed to Agenda for Change reform as part of the 2015/2016 pay settlement and NHS Employers, in partnership with DH, are continuing exploratory talks with AfC trades unions with a view to obtaining mandates to negotiate a multi-year agreement from 2018/19. The review body will be updated of progress in supplementary evidence.
NHS workforce policy
Effective workforce policy is critical to the delivery of affordable, high quality care. Securing the people with the values, skills, experience and expertise which the NHS needs, is central to the future of England’s Health and Care system.
The total workforce continues to grow (6.2% since 2012) but we also know that the rate of retention for some groups of clinical staff has declined over the past decade. Although staff engagement has increased slightly over the same time period, the fact that fewer members of staff are choosing to remain in the NHS is a significant concern.
The Department continues to take action to increase the supply of trained staff available to work in the NHS and wider health and care system (“workforce supply”). In conjunction with Health Education England (HEE) and NHS England, the Department has taken a range of actions to boost the supply of domestically trained staff and to increase the efficiency and productivity of the existing workforce through better use of technology and changing the skill mix. In order to ensure all of the organisations involved are working together as effectively as possible we have introduced a new group, chaired by the Minister of State for Health, to steer our strategic programme and Health Education England has published a consultation document on a draft health and care workforce strategy to 2027.
There has been an increase of over 32,000 professionally qualified clinical staff since 2010 .HEE has increased the number of key professional groups being trained. For example a 25% increase in nurse training places and up to a further 5000 Nursing Associates in 2018 and 7,500 in 2019 .The use of Medical Associate Professionals aims to meet changing demands of multi-disciplinary teams and address the skills gap. The reforms to funding of training for nurses and allied health professionals aim to further boost supply however, whilst the workforce continues to grow there is still a significant challenge to fill training places with the recent fall in number of nurse applications.
The Department continues to develop more robust data on staff vacancies, turnover and agency spend in order to better understand the costs that drive the pay bill. Vacancy information is limited to ‘advertised vacancies’ and although the data is relatively new the trend is upwards. The vast majority of vacancies are filled by bank and agency staff and consequently progress is being made on reducing agency spend and a more strategic approach to the use of ‘bank’ staff is being developed.
Pay is not the only motivator and understanding the staff experience is key to key to addressing motivation and retention. The staff experience has remained broadly stable but there remain significant challenges in staff engagement and motivation. A better work/life balance is the

Strategy and Introduction
7
largest growing reason for voluntary resignations however there are no particularly strong, clear regional patterns in leaver rates.
Furthermore it is important to explore how the entire NHS employment offer, a “Total Reward” approach to pay and non-pay benefits which, as described in Chapter 7, can help employers to use the increasing NHS pay bill in the best way to secure, retain and motivate the skilled workforce they need.
As in recent years - and reflecting the roles of the Department, its' Arms-Length Bodies and other organisations - the Review Body will be invited to consider, alongside evidence from the trades unions, professional bodies and other stakeholders:
high-level evidence from the Department, including the strategic policy objectives and the
economic and financial (NHS funding) context;
evidence from NHS England on affordability and funding and the Five Year Forward View;
evidence from NHS Employers and NHS Providers on reformed contracts, total reward,
recruitment, retention and motivation;
evidence from HEE on education, training, workforce capacity and supply; and
evidence from NHS Improvement on how they support the Department and NHS
organisations on a range of issues, for example to restore and maintain financial balance,
delivering on the clinical standards, workforce planning and bearing down on Agency spend.

8
1. Strategy and Introduction
1.1. The government committed to backing the NHS with an additional £8 billion in real terms, by 2020/21 in the spending review of 2015. At Budget 2017 we have now committed to backing the NHS in England further so that by 2019/20 it will have received an additional £2.8 billion of revenue funding for frontline services than previously planned over the period. This includes £335 million this winter to help trusts to increase capacity. We have also committed £3.5 billion of new capital investment by 2022/23 to transform its estate and drive further efficiency savings.
1.2. Whilst this is a generous settlement compared to other Government Departments, the health and social care system faces increasing demand for its services, driven by an increasingly aged and frail population, and meeting this demand and driving up quality in an affordable way is incredibly challenging.
1.3. The Department’s Shared Delivery Plan 2015-2021i is informed by the NHS’s own improvement plan - the Five Year Forward Viewii. NHS England’s report Delivering the Forward View: NHS planning guidance 2016/17 – 2020/21iii makes clear that providers cannot choose to either improve care for patients or balance their books - they must do both: “The Spending Review provided the NHS in England with a credible basis on which to accomplish three interdependent and essential tasks: first, to implement the Five Year Forward View; second, to restore and maintain financial balance; and third, to deliver core access and quality standards for patients”.
1.4. Transformational change is needed to reduce the long-term costs pressures on the NHS. Chapter 3 sets out the work that is being undertaken by the Department with the health service, partners and patients to deliver key elements of the programme required to achieve the efficiency savings recently reinforced in Next Steps on the Five Year Forward Viewiv.
1.5. In December 2015, the NHS shared planning guidance 16/17 – 2020/21v outlined a new approach to help ensure that health and care services are built around the needs of local populations. As part of this, local health and care systems in England came together in January 2016 to form 44 Sustainability and Transformation Partnerships (STP)vi and developed local proposals to help meet the 'triple challenge' set out in the Five Year Forward View, of better health, transformed quality of care delivery, and sustainable financesvii. A number of the partnerships have now evolved into integrated or ‘accountable’ care systems (ACSs). In July 2017, NHS England published a dashboard of STP progress which tracks the combined achievements of local services through 17 performance indicators across nine priority areas, each falling into three core themes of hospital performance, patient-focused change and transformationviii.

Strategy and Introduction
9
Workforce
1.6. Ensuring that the NHS has access to the right mix and number of staff who have the skills, values and experience to deliver high quality, affordable care is a fundamental aspect of the Department of Health’s overarching strategic programme for the health and care system. A new group has been set up to steer the strategic programme for workforce, chaired by the Minister of State for Health and involving all the organisations involved in delivering the programme and a draft workforce strategy was published, for consultation, by Health Education England on 13 December 2017ix.
Staff engagement
1.7. Staff engagement is crucial to securing and retaining the workforce that the NHS needs, as is making the most effective use of the entire NHS employment offer - pay and non-pay benefits. We strongly believe that recruitment and retention is not just about pay, it is about creating a culture and environment in the NHS where staff want to work, where staff feel safe to raise concerns and to learn from mistakes; where employers listen to and empower staff, and work hard to keep them safe and ensure bullying and harassment is not tolerated.
1.8. The Developing People, Improving Care frameworkx, published in December 2016, set out - for the first time – a jointly agreed aspiration to support leaders so that they can implement cultures of continuous improvement and ensure they create a positive working environment for their staff. Under the aegis of this programme and, separately, through the Social Partnership Forum, we have led work to improve organisational culturesxi and reduce the rate of bullying and harassmentxii. These programmes, which address entrenched cultural issues, take time to come to fruition but the Department is committed to supporting them over the long term, so that they make a long lasting,
noticeable difference.
Government Pay Policy and our approach to contract reform
1.9. NHS staff do a fantastic job in delivering world-class care, we want to recognise their hard work and make sure that the overall pay package is fair and also affordable to hard working taxpayers.
1.10. Government confirmed that the across-the-board 1% public sector pay policy will no longer apply to pay awards for 2018-19. It recognises that for some public sector workforces greater pay flexibility in return for improved productivity may be needed to address recruitment and retention problems.

The NHS Pay Review Body (NHSPRB) Review for 2018
10
1.11. At Autumn Budget the Chancellor confirmed that, in order to protect patient services he is committing to providing additional funding for a multi-year pay deal above the one percent per annum if ongoing discussions between NHS trades unions, NHS Employers and the Department on reforming the Agenda for Change contract bear fruit. Any multi- year pay deal will only apply to staff employed under Agenda for Change e.g. porters, domestic staff, nurses, midwives, paramedics.
1.12. The Department’s letter to the NHS Pay Review body makes clear that any agreement will be on the condition that the pay award enables improved productivity in the NHS, and is justified on recruitment and retention grounds. The intention is that discussions on contract reform will take place in parallel with the NHS Pay Review Body’s own consideration about the appropriate level of pay award.
1.13. We want to help ensure that the NHS can continue to deliver world-class patient care, putting patients first and keeping them safe whilst providing the high quality care we all expect. Patients, and their experience of care, must be at the heart of everything that the system does and the pay review bodies for the NHS are asked, as part of their standing remits, to give regard to that. Putting patients at the heart includes ensuring the right balance between pay and staff numbers through systems of reward that are affordable and fit for purpose. We continue to focus on public sector pay reform to ensure that terms and conditions are fit for purpose, affordable and sustainable.

Evidence on the General Economic Outlook
11
2. Evidence on the General Economic Outlook
Introduction
2.1. The economic and fiscal context in which the Pay Review Bodies (PRBs) will make their recommendations was set out in detail in the November 2017 Budget. However, as in previous years, this chapter summarises points that may be of particular relevance to
the pay review process, notably the latest Office for Budget Responsibility (OBR) projections for the economy, and recent trends in the labour market, both in the public and the private sector. This should be considered alongside the rest of this Department of Health and Social Care evidence when making recommendations.
2.2. In 2017 the Government adopted a more flexible approach to public sector pay, to address areas of skills shortages and in return for improvements to public sector productivity. The Government will continue to ensure that the overall package for public sector workers is fair to them and ensures that we can deliver world class public services, while also being affordable within the public finances and fair to taxpayers as a whole. This makes it all the more important that Pay Review Bodies continue to consider affordability, alongside wider economic circumstances, when making their recommendations.
Public Finances
2.3. As usual, it is important that the PRBs take into account the wider fiscal context when making their recommendations. As set out in the November Budget, the UK economy has demonstrated its resilience. Gross Domestic Product (GDP) has grown continuously for 19 quarters and employment has risen by 3 million since 2010 to a near record high.
However, over the last year business investment has been affected by uncertainty, and productivity - the ultimate driver of wage growth - has been subdued. Productivity growth has slowed across all advanced economies since the financial crisis, but it has slowed more in the UK than elsewhere. The OBR has revised down expectations for productivity growth over the forecast period compared to Spring Budget 2017.
2.4. The government has made significant progress since 2010 in restoring the public finances to health. The deficit has been reduced by three quarters from a post war high of 9.9% of GDP in 2009 10 to 2.3% in 2016 17, its lowest level since before the financial crisis. Despite these improvements, borrowing and debt remain too high. The OBR forecast debt will peak at 86.5 % of GDP in 2017 18, the highest it has been in 50 years. In order to ensure the UK’s economic resilience, improve fiscal sustainability, and lessen the burden on future generations, borrowing needs to be reduced further.

The NHS Pay Review Body (NHSPRB) Review for 2018
12
2.5. The fiscal rules approved by Parliament in January 2017 commit the government to reducing the cyclically adjusted deficit to below 2% of GDP by 2020 21 and having debt as a share of GDP falling in 2020 21. These rules will guide the UK towards a balanced budget by the middle of the next decade. The OBR forecasts that the government will meet both its fiscal targets, and that borrowing will reach its lowest level since 2001 02 by the end of the forecast period. Debt as a share of GDP is forecast to fall next year and in every year of the forecast. These targets will require ongoing discipline in public spending.
2.6. Public Sector pay currently accounts for around £1 in every £4 spent by the government and the public sector pay bill figure for 2016/17 is £179.41bn, up from £173.19bn in
2015/16. Public sector pay policy necessarily plays an important role in controlling public spending.
2.7. Departments are also facing longer-term pressures. The OBR’s Fiscal Sustainability report highlighted the significant impact that demographic changes are likely to have on the public finances. Discipline in public spending remains central to achieving the government’s fiscal targets. The last Spending Review budgeted for one per cent average basic pay awards, in addition to progression pay for specific workforces, and there will still be a need for pay discipline over the coming years to ensure the affordability of the public service and the sustainability of public sector employment.
2.8. This makes it ever more important to ensure that our pay bill spending delivers maximum value for money. Between 2010 and 2016, public service productivity increased by 3%, an average of 0.5% per year. But although public service productivity has improved, further improvements are vital in order to deliver government objectives and meet rising demand. In its response to the PRBs Government will consider where pay awards can be agreed in return for improvements to public sector productivity, which also plays an important role in the UK’s productivity growth overall.
Labour market
2.9. The UK labour market necessarily forms an important backdrop to the PRB process. The OBR forecast that the number of people in employment will continue to increase to 32.7 million in 2022. The unemployment rate is forecast to increase slightly over the forecast horizon as it returns to the OBR’s new estimate of its equilibrium rate, remaining at 4.6% from 2020 onwards.
2.10. Despite the continued strength of the labour market, weak growth in labour productivity has been weighing down on wages and, ultimately, the public finances. As set out in the November 2017 Economic and Fiscal Outlook, the OBR expects productivity to remain flat in 2017, before increasing 0.9% in 2018 and 1.0% in 2019. Productivity growth is then forecast to increase to 1.3% in later years. This compares to the Spring Budget 2017 forecast of 1.7% on average over the forecast period.

Evidence on the General Economic Outlook
13
Fig 2.1: Real output per hour and real compensation per hour, year on year growth (ONS November 2017)
2.11. With a lower forecast for productivity growth the OBR expects average earnings growth of 2.3% in 2017, 2018 and 2019. It then increases to 2.6% in 2020, 3.0% in 2021 and 3.1% in 2022. A pickup in productivity is vital for the recovery of cross-economy wage growth rates to pre-recession levels. Public and private sector wages tend to move in similar directions, both because of pay expectations and the implications of tax receipts on public sector budgets. The £31 billion National Productivity Investment Fund and our Industrial Strategy will help to boost productivity and earning power throughout the UK.
2.12. We recognise that higher inflation is putting pressure on all households as well as our hardworking public servants. But historically the relationship between pay and inflation has been a weak one, in part due to the temporary nature of many inflation fluctuations.
Most forecasters expect this period of above target inflation to be temporary, as inflation has been pushed above the target by the boost to import prices that had resulted from the past depreciation of sterling. The OBR and the Bank of England both expect inflation to peak at the end of this year and then fall again over 2018 and 2019. The appropriate level of public sector pay award is complex and determined by a variety of factors, notably retention and recruitment. Rates of price inflation are important, but not the only consideration.

The NHS Pay Review Body (NHSPRB) Review for 2018
14
-3%
-2%
-1%
0%
1%
2%
3%
4%
5%
6%
2008 2009 2010 2011 2012 2013 2014 2015 2016 2017
% G
row
th R
ate
(Q
uart
erly Y
ear
on Y
ear
Gro
wth
Ra
tes)
CPI Inflation Total Pay (incl bonuses)
Fig 2.2: Whole economy average earnings growth and inflation (ONS November 2017)
Public sector pay and pensions
2.13. Specific evidence on the pay of the NHS workforce is presented elsewhere in this document. However, wider trends in pay and remuneration are also relevant. Following the last recession, public sector wages did not undergo the sharp fall seen in the private sector, and have since grown at a slower pace than private sector wages: for the three months to October 2017 private sector total pay grew by 2.7% on the same period the previous year, compared to 1.8% in the public sector (excluding financial services). However, the overall remuneration of public sector employees when taking employer pension contributions into account remains at a significant premium, as seen in Figure 2.3.
Fig 2.3: Percentage public sector pay premium, hourly pay for all employees, controlling for personal
characteristics (ONS ASHE)
-5
0
5
10
15
20
2005 2006 2007 2008 2009 2010 2011 2012 2013 2014 2015 2016pay pay and employer pension contribution
% D
iffe
ren
ce

Evidence on the General Economic Outlook
15
2.14. When considering changes to remuneration, PRBs should take account of the total reward package. Public service pension schemes continue to be amongst the best available and significantly above the average value of pension provision in the private sector. Around 17% of active occupational pensions scheme membership in the private sector is in defined benefit (DB) schemes, with the vast majority in defined contribution (DC) schemes. In contrast, over 95% of active members in the public sector are in DB arrangements.
2.15. In April 2016, the National Living Wage was introduced at £7.20 for workers aged 25 and over (increased to £7.50 an hour in April 2017, and will increase to £7.83 in April 2018). The introduction of the NLW marked an increase in pay for over a million workers across the UK labour market, including in the public sector. Estimates indicate that approximately 53,000 public sector workers were paid the NLW in 2017. In 2018-19, 1.2 million people on low incomes across the economy will have been taken out of income tax altogether (compared to 2015-16), and a typical taxpayer will pay £1,075 less income tax, compared to 2010-11. Overall, since 2015, we have cut income tax for 31 million people, while freezing fuel and alcohol duty.
Conclusion
2.16. This chapter summarises the economic and fiscal evidence which is likely to be relevant to the recommendations of the PRBs. This is intended to inform their usual consideration of the affordability of specific pay awards, on top of the workforce specific evidence presented elsewhere in this document.
2.17. Much of the evidence presented here will feed into retention and recruitment across public sector workforces. Retention and recruitment will vary considerably across geographies, specialisms and grades, where public sector workers face different labour market structures. We would welcome specific comment and analysis from the PRBs on any trends and how pay systems could help address these issues.

The NHS Pay Review Body (NHSPRB) Review for 2018
16
3. NHS Finances
Funding Growth
3.1. This chapter sets out the financial context for the NHS.
3.2. Figure 3.1 below gives the NHS England Mandate from 2013/14 to 2018/19
Figure 3.1 NHS England TDEL (£billion)
TDEL is the total departmental expenditure limit which covers both capital and revenue spend.
NHS England TDEL (£bn)
Cash growth
Real Terms Growth
2013-14 94.7
2014-15 97.3 2.8% 1.3%
2015-16 100.5 3.2% 2.6%
2016-17 106.0 5.4% 3.1%
2017-18 109.7 3.6% 2.0%
2018-19 113.5 3.4% 1.9%
These figures take into account the £800m transferred to DfE for 0-5 year olds, out of the NHSE budget, in 2014-15.
This assumes NHS England receive the entire £337m (2017-18) and £1.6bn (2018-19) revenue funding added to DH's DEL in the 2017 Autumn Budget.
Share of Resource Going to Pay
3.3. Fig 3.2 shows the proportion of funding consumed by NHS provider permanent staff spend over the last four years. Note that NHS provider permanent staff spend only covers staff

NHS Finances
17
working within hospital and community health settings, and so excludes General Practitioners, GP practice staff and General Dental Practitioners.
Fig 3.2 Increases in Revenue Expenditure and the Proportion Consumed by Paybill
NHS England TDEL (£bn)
NHS Provider Permanent Staff Expenditure (£bn)
% of spend on staff
Increase in revenue expenditure
Increase in permanent staff spend
2013/14 94.7 43.0 45.3%
2014/15 97.3 43.9 45.1% 2.8% 2.3%
2015/16 100.5 45.2 44.9% 3.2% 2.8%
2016/17 106.0 47.6 44.9% 5.4% 5.4%
(1) Excludes ALB and DH core staff expenditure.
(2) Excludes GPs.
(3) The 16/17 increase in permanent staff spend growth includes 1.75% for the change in employer national insurance contributions.
(4) Figures may not sum due to rounding.
3.4. On average, between 2011/12 and 2016/17, increases to the HCHS paybill accounted for
30% (£6.0bn out of £20.1bn) of the increases in revenue expenditure.
3.5. This shows that despite many competing pressures (e.g. drugs bill growth and service developments), the NHS has managed to increase its permanent staff spend and largely maintain the proportion of expenditure spent on permanent staff.

The NHS Pay Review Body (NHSPRB) Review for 2018
18
Demand Pressures
3.6. In recent years the NHS has continued to manage rising demands on its services.
3.7. The number of emergency admissions (an indicator of emergency demand) has grown
continuously over the last 5 years.
Source: Provisional Monthly Hospital Episode Statistics for Admitted Patient Care, Outpatients
and Accident and Emergency Data

NHS Finances
19
3.8. The number of elective (i.e. non-emergency) patients treated has increased over the last five years.
Source: NHS England Consultant Led Referral to Treatment Statistics
3.9. Labour productivity is calculated by dividing total NHS output by an appropriate measure of labour input (usually some form of weighted sum of staff numbers and hours worked). It measures the amount of output generated per 'unit' of labour, and as such is an important component of efficiency.
3.10. The measure of labour productivity we use for the NHS in England is the one developed by the University of York (Centre for Health Economics, CHE). The York measure uses a range of NHS data sources to assess outputs and inputs and also adjusts the output measure to take some account of quality change, including change in waiting times and death rates. Their figures show that in 2014/15 NHS outputs were 93% higher than in their base year of 1998/99, while volume of labour input was 45% higher. This suggests an average growth in labour productivity of ~2% per annum.

The NHS Pay Review Body (NHSPRB) Review for 2018
20
Fig 3.3 Labour Productivity Data from York University (CHE)
Total Output
Growth
Labour
Input
Growth
Labour
Productivity
Growth
Output
Index
Labour
Index
Productivity
Index
100.0 100.0 100.0
1999/00 2.2% 1.6% 0.6% 102.2 101.6 100.6
2000/01 2.3% 1.1% 1.2% 104.5 102.7 101.8
2001/02 3.7% 5.4% -1.6% 108.4 108.3 100.2
2002/03 5.8% 4.7% 1.0% 114.7 113.4 101.3
2003/04 4.9% 4.5% 0.4% 120.4 118.5 101.7
2004/05 6.4% 4.8% 1.6% 128.1 124.1 103.3
2005/06 7.1% 3.4% 3.6% 137.2 128.4 107.0
2006/07 6.5% 0.6% 5.8% 146.1 129.2 113.2
2007/08 3.7% 0.6% 3.0% 151.5 130.1 116.6
2008/09 5.7% 4.2% 1.5% 160.2 135.5 118.3
2009/10 4.1% 4.6% -0.4% 166.8 141.7 117.8
2010/11 4.6% 1.3% 3.2% 174.4 143.5 121.6
2011/12 3.2% -0.2% 3.4% 179.9 143.2 125.8
2012/13 2.3% -2.0% 4.4% 184.1 140.4 131.3
2013/14 2.6% 0.4% 2.1% 188.9 140.9 134.1
2014/15 2.5% 2.8% -0.3% 193.6 144.8 133.7
Average
Annual Growth
4.2% 2.3% 1.8%
3.11. Labour productivity is an important component of efficiency, but labour inputs account for only around half of the total cost of the NHS. A broader measure of productivity divides total output by an appropriate measure of all inputs, for example including drugs.

NHS Finances
21
This is called total factor productivity and York University also produce figures on this basis. Their figures show, as before, that in 2014/15 NHS output were 94% higher than in the base year of 1998/99. However, the total volume of factor inputs increased by 85% over the same period, resulting in a moderate growth of 0.2% per annum in total factor productivity.
3.12. More generally productivity, as formally defined here, does not take into account the costs of inputs, including changes in staff pay. A full measure of technical efficiency would, in addition, factor in changes in pay and the cost of inputs relative to a suitable deflator. If pay increases more quickly than GDP deflator, this would have a negative effect on technical efficiency.
Fig 3.4 Total Factor Productivity Data from York University (CHE)
Total Output
Growth
Total
Factor Input
Growth
Total Factor
Productivity
Growth
Output
Index
Total Input
Index
TFP Productivity
Index
100.0 100.0 100.0
1999/00 2.2% 5.1% -2.7% 102.2 105.1 97.3
2000/01 2.3% 1.6% 0.7% 104.5 106.7 98.0
2001/02 3.7% 6.1% -2.2% 108.4 113.2 95.8
2002/03 5.8% 7.1% -1.2% 114.7 121.2 94.6
2003/04 4.9% 7.6% -2.5% 120.4 130.4 92.3
2004/05 6.4% 6.5% -0.4% 128.1 138.9 91.9
2005/06 7.1% 7.2% -0.1% 137.2 148.9 91.8
2006/07 6.5% 1.9% 4.5% 146.1 151.8 96.0
2007/08 3.7% 3.9% -0.2% 151.5 157.6 95.7
2008/09 5.7% 4.2% 1.4% 160.2 164.3 97.1
2009/10 4.1% 5.4% -1.3% 166.8 173.2 95.9
2010/11 4.6% 1.3% 3.2% 174.4 175.5 99.0
2011/12 3.2% 1.0% 2.1% 179.9 177.3 101.1
2012/13 2.3% 2.0% 0.4% 184.1 180.8 101.5
2013/14 2.6% 0.4% 2.2% 188.9 181.6 103.7

The NHS Pay Review Body (NHSPRB) Review for 2018
22
2014/15 2.5% 1.9% 0.6% 193.6 184.9 103.8
Average
Annual Growth
4.3% 3.9% 0.3%
Efficiency Savings
3.13. The NHS Five Year Forward View plan, anticipated in 2014 a gap between resources
and patient needs of nearly £30 billion a year by 2020/21, if the NHS received flat real terms funding increases and no further efficiencies are delivered. To fill this gap, the NHS will deliver £22 billion of efficiency savings (equivalent to 2%-3% per year). The majority of these are not cost reductions per se, but actions to moderate the rate of spending growth. Alongside this, the Government is providing the £10 billion of additional funding a year that the NHS said it needed to deliver its Five Year Forward View plan.
3.14. The Department of Health is working with the health service, partners and patients to deliver key elements of the programme required to achieve the efficiency savings recently reinforced in the Next Steps on the Five Year Forward View, by:
reducing demand for NHS care by improving the public’s overall health, introducing new models and places to care for patients that mean they don’t always need to go to hospital and reducing unwarranted variation in care;
making better use of NHS providers’ resources – money, technology, estates and people;
reducing NHS costs by improving purchasing;
increasing income to the NHS through charges and commercial opportunities; and
reducing system overheads by reducing NHS management costs.
3.15. NHS Improvement has also made substantial progress in delivering efficiencies in NHS providers identified in Lord Carter’s 2016 independent report Operational Productivity and performance in English NHS acute hospitals: Unwarranted variations through their Operational Productivity programme. This programme is supporting providers to deliver at least £5bn efficiency savings to 2020/21. Some examples where the NHS is implementing the recommendations and delivered savings in 2016-17 include:
3.16. Promoting uptake of better value generic medicines in hospital pharmacies;
Promoting uptake of better value generic medicines in hospital pharmacies;
Reducing the number of days that medicines supplies are held in stock by non-specialist acute hospitals across England;
Development of the NHS procurement price comparison tool to help providers to secure better prices for the equipment and tools that they purchase;
Increasing provider buying power of everyday hospital consumables through the Nationally Contracted Products programme;
Improving efficiencies and patient outcomes in trauma and orthopaedics through the Getting it right first time (GIRFT) programme;

NHS Finances
23
3.17. Going forward, increasing focus will be on moderating activity growth through programmes such as the new care models and right care, and delivering improved workforce productivity by continuing work for non-specialist acute trusts to implement the 15 recommendations to optimise clinical and non-clinical resources as part of their business as usual.
Conclusion
3.18. The NHS Five Year Forward View plan anticipated in 2014 a gap between resources and patient needs of nearly £30 billion a year by 2020/21, if the NHS received flat real terms funding increases and no further efficiencies were delivered. To fill this gap we are investing the additional £10 billion that the NHS has said it needs to implement its plan, alongside the NHS delivering the £22 billion of efficiency savings that it has committed to.
3.19. Meeting this efficiency challenge is likely to require shifting the focus from centrally driven savings to transformational changes, which will reduce the long-term cost pressures on NHS services.

The NHS Pay Review Body (NHSPRB) Review for 2018
24
4. Hospital and Community Health Services (HCHS) Agenda for Change Staff Earnings
Summary
4.1. This chapter sets out how pay for NHS non-medical staff has changed over the last 5 years, and how this compares to workers in the private sector. It starts by setting out the bands of pay, and goes on to consider average earnings, how these have changed over
time and what has driven the change.
4.2. Average earnings per FTE has not grown as swiftly as in the private sector over the last 5 years. However, as highlighted in “Earnings change for Agenda for Change contracted employees 2010-2015 – a longitudinal study” (referenced in last year’s evidence) the total earnings of those Agenda for Change contracted employees who were employed in the NHS in 2010 and also in 2015 increased by an average of between 1.7% and 2.9% per year, depending on staff group. Please note that this study has not been updated. Overall, public sector pay remains, on average, comparable to private sector pay and public sector defined benefit pensions are amongst the best available. HM Treasury analysis, as well as independent studies, show public sector pay at a premium for most of the last Parliament, and a significant continued premium when pensions are taken into account.
4.3. The cost of the paybill per FTE has grown in the last year. Headline pay award and pay reform have contributed to a certain extent to the increase of the paybill per FTE. There is also an increase in on-costs related to the rise in national insurance contributions from ending the contracting out of the state second pension.
4.4. There is a continued reduction in the number of AfC staff in receipt of Recruitment and Retention Premium payments.
4.5. Economy wide earnings growth has varied regionally; highest in the South West and North East and lowest in the East and East Midlands.
4.6. However, the overall remuneration of public sector employees when taking employer pension contributions into account remains at a significant premium
HCHS Earnings & Earnings Growth Analysis
4.7. NHS staff paid under the Agenda for Change contracts cover a range of professions and occupations including: Hotel, Property and Estates staff; Support staff; nurses and midwives; Scientific, therapeutic and technical staff and Senior Managers. Staff are

Hospital and Community Health Services (HCHS) Agenda for Change Staff Earnings
25
paid according to earning bands with these ranging from around £15,000 to £100,000 depending upon experience and occupation/profession.
4.8. The table below shows how the pay bands have increased in recent years and the percentage of staff at the top of their pay band. Generally, individuals that are not at the top of their pay band will progress to the top of the pay band by gaining an increment each year. The value of increments is typically around 3 to 4 percent of salary with 2017/18 basic pay figures are included for reference.
Fig 4.1: Non-medical staff AfC pay band analysis
Source: NHS Employers and NHS Digital
4.9. NHS Employers publishes the Agenda for Change pay scales from which we look at the lowest band in England. The annual wage is based on a person working a 37.5 hour week. Figure 4.2 compares the AfC pay rate against the national living wage for people 25 years of age and over. It shows the AfC minimum hourly wage exceeds the National Living Wage across England.

The NHS Pay Review Body (NHSPRB) Review for 2018
26
Inner London Outer London London Fringe Rest of England
Band 1 (annual) £19,604.00 £18,957.00 £16,375.00 £15,404.00
AfC minimum hourly wage £10.03 £9.69 £8.37 £7.88
National living hourly wage £7.50 £7.50 £7.50 £7.50
Fig 4.2: 2017 AfC minimum hourly rate vs National Living wage – 2017/18
Changes in Earnings
Fig 4.3: Yearly % total earnings growth Private sector and All AfC staff
Source: ONS Annual Survey of Hours and Earnings, Department of Health Headline HCHS Pay
bill Metric Estimates
4.10. A comparison of year on year growth of earnings shows that the pay growth in the private sector (yearly average of +1.6%) have been consistently higher than that experienced by HCHS non-medical staff (yearly average of +0.4%). The total earnings for the non-medical staff includes the basic salary staff and other additional earnings depending on hours worked (different rates are paid for working certain hours of the day, or week), as well as payments for retention etc. On average for the period October 2015 to September 2016, pay for HCHS non-medical staff ranges from £17,720 for Hotel, Property and Estates staff to £78,758 for Senior Managers
4.11. Overall averages can obscure differences for certain professions and pay ranges. This chapter sets out how pay compares to others, whether there are any indications of labour market issues overall, or for specific groups (professions, pay range or geography), and whether these issues/comparisons have changed over time.

Hospital and Community Health Services (HCHS) Agenda for Change Staff Earnings
27
1st
Quartile
(2012/13)
1st
Quartile
(2016/17)
1st
Quartile
Growth
Median
(2012/13)
Median
(2016/17)
Median
growth
3rd
Quartile
(2012/13)
3rd
Quartile
(2016/17)
3rd
Quartile
Growth
Mean
(2012/13)
Mean
(2016/17)
Mean
growth
All Employees £12,974 £14,111 8.8% £21,500 £23,099 7.4% £33,076 £35,218 6.5% £26,756 £28,296 5.8%
Hotel, property and
Estates £11,250 £12,250 8.9% £16,250 £17,250 6.2% £21,250 £21,750 2.4% £23,552 £24,241 2.9%
Support to ST&T staff £13,250 £14,250 7.5% £17,250 £18,250 5.8% £21,250 £21,750 2.4% £17,389 £17,992 3.5%
Support to doctors,
nurses & midwives £13,750 £14,750 7.3% £17,750 £18,750 5.6% £21,750 £22,250 2.3% £17,590 £18,277 3.9%
Central Functions £17,250 £17,750 2.9% £21,750 £22,250 2.3% £28,750 £29,500 2.6% £16,950 £17,513 3.3%
Support to ambulance
staff £18,750 £19,750 5.3% £22,750 £23,750 4.4% £27,250 £27,750 1.8% £22,719 £23,397 3.0%
Scientific, therapeutic &
technical staff £24,250 £24,750 2.1% £31,250 £31,750 1.6% £40,250 £40,250 0.0% £32,255 £32,373 0.4%
Ambulance staff £31,250 £30,750 -1.6% £36,250 £36,750 1.4% £41,750 £42,750 2.4% £36,264 £35,925 -0.9%
Nurses midwives and
health visitors £25,250 £26,250 4.0% £30,750 £31,750 3.3% £36,750 £37,250 1.4% £31,365 £32,286 2.9%
Managers and Senior
Managers[1] *n/a *n/a *n/a *n/a *n/a *n/a *n/a *n/a *n/a £55,107 £56,578 2.7%
[1] Comparison of the mean of basic earnings considered most suitable to objectively assess earnings growth.
4.12. The table below shows how earnings have grown for the overall economy at various points in the earnings distribution compared to earnings growth for occupations in the NHS by points in their respective earnings distributions.
Fig 4.4: Earnings for all staff by occupation, and distribution in 2012/13 and growth to 2016/17, comparing
non-medic NHS staff to all employees from Annual Survey of Hours and Earnings.
Source: ONS Annual Survey of Hours and Earnings, NHS Digital Quarterly Publication on
Earnings
*n/a – earnings publication changes prevents meaningful comparison being made over period in consideration
4.13. Over the last 5 years the average earnings growth across the economy is 6%. Average growth for most staff groups in the NHS tend to be lower, but can show very different patterns, ranging from a -1% change for Ambulance staff to +4% growth for Support to doctors, nurses and midwives.
4.14. Earnings growth across the overall earnings distribution has been higher for those with lower earnings. And this pattern is also evident in the NHS occupations where earnings comparable to the 25th percentile overall has shown a similar increase. Earnings comparable to the median overall economy have increased at a slower rate, and earnings comparable to the 75th percentile have increased at a much lower rate.

The NHS Pay Review Body (NHSPRB) Review for 2018
28
Current pay levels vs comparator groups in the wider economy
4.15. An alternative comparison of earnings growth can be achieved by seeking to understand how earnings have grown for similar workers based on a range of factors such as:
qualifications, training and experience
responsibilities and risks
skill and competencies
professional standing and status
leadership and management
4.16. The table below shows that the mean annual earnings growth for NHS staff has been lower than comparators across the wider economy in the last five years.
Fig 4.5: HCHS Staff Groups vs Comparator groups
Source: NHS Digital Mean annual earnings per person by Staff Group, in NHS Trusts and CCGs in England and ONS Gross Annual Pay Data
Why has the NHS pay bill per FTE grown? 4.17. There are multiple factors which influence a change in paybill per FTE from year to year.
It can be broken down into the below drivers:
Headline pay awards & Pay Reform – this is the in year pay settlement applied to basic pay values and any know impacts from pay reform that have been implemented.
Changes in band mix – This is caused by a change in the distribution of staff across the different pay bands, and impacts the basic pay per FTE.

Hospital and Community Health Services (HCHS) Agenda for Change Staff Earnings
29
Non-medical 2011-12 2012-13 2013-14 2014-15 2015-16 2016-17
Paybill per FTE growth 1.4% 1.1% 0.4% 0.0% 0.4% 2.4%
Headline pay award and pay reform 0.3% 0.3% 1.0% 0.4% 0.5% 1.0%
Basic pay per FTE 1.1% 0.6% -0.1% -0.5% 0.4% -0.1%
Additional Earnings per FTE -0.1% 0.2% -0.6% 0.4% -0.6% -0.3%
Staff group mix 0.0% 0.0% -0.1% -0.1% -0.2% -0.2%
Total on-costs per FTE 0.0% 0.0% 0.2% -0.1% 0.2% 2.0%
Changes in point mix – This is caused by changes in the distribution of staff across pay points within bands (e.g. high recruitment may weight the distribution towards lower points in the band), and impacts the basic pay per FTE.
Changes in staff group mix – This is caused by changes in the proportion of staff in specific professions which may be down to high recruitment of a specific staff group e.g. consultants.
Additional earnings effects – can be caused by changes in other earnings at a different rate to basic pay (this may include the use of bonuses, geographical allowances, medical awards, recruitment and retention premium etc.)
On-costs effects – these can be caused by changes in the rules that govern employer pension contribution, or employer national insurance contribution requirements (recent effects here have been caused by introduction of the Single Tier State Pension and Apprenticeship Levy).
Fig 4.6: HCHS Non-medical staff Pay bill per FTE year on year changes
Source: Department of Health Headline HCHS Pay bill Metric Estimates
4.18. The pay bill per FTE for HCHS non-medical staff rose from £35,389 in 2010/11 to £37,443 in 2016/17. On average, the pay bill per FTE increased by 0.94% every year. The headline pay award has contributed to the growth in pay over the period as a whole. Basic pay change which can arise as a result of staff moving between the spine points (usually upwards) or to changes to total FTE employed made most impact in the first 2 years of the period. In the last year, pay bill per FTE increased by 2.38% with the largest increase coming from the total on-costs per FTE (this was 1.95 percentage points of the 2.38% increase) driven by the impact of Single Tier State Pension introduction.

The NHS Pay Review Body (NHSPRB) Review for 2018
30
4.19. Figure 4.7 illustrates the movements of each component part over the period from 2010.
Fig. 4.7: Graphical illustrations of movements in non-medical staff pay bill components
Source: Department of Health Headline HCHS Pay bill Metric Estimates
Recruitment & Retention Premia
4.20. The data from NHS Digital shows a continuation of the downward trend in the proportion of staff receiving an RRP payment. This is in keeping with that seen in previous years where many of the payments made were pay protection for staff that received the Cost of Living Supplement (COLS) but did not receive HCAS, because their employing
organisation is in a location which received COLS but does not qualify for HCAS. This suggests no evidence of an increase in the use of RRPs to address R&R problems. For example, in 2012/13, 5610 nurses, midwives and health visitors received an average RRP payment of £594 while in 2016/17, 3057 nurses, midwives and health visitors received an average RRP payment of £1,179.
4.21. Although employers are free to use the local pay flexibilities available to them such as RRPs to address short or long term issues, anecdotally we understand that they may be reluctant to do so because of the risk that use of RRPs by, for example, neighbouring trusts could lead to pay escalation as they compete for staff. We recognise that this may also be due to lack of or limited HR capacity to develop the business case for making additional RRP payments in a way that ensures any equal pay risks are properly managed.

Hospital and Community Health Services (HCHS) Agenda for Change Staff Earnings
31
Regional Variation
4.22. The regional time series of average earnings per person published by the Office for National statistics from its Annual Survey of Hours and Earnings is useful to consider differences between regions. Latest data shows that the largest percentage increases from 2012 to 2016 have been in the South West and North East (8%) and the lowest was in the East and East Midlands (4%).
Fig 4.8: Whole Economy Median Earnings per Person Growth, by Region, 2012 to 2016. Indices: 2012 = 100
Source: ONS Annual Survey of Hours and Earnings Data

The NHS Pay Review Body (NHSPRB) Review for 2018
32
5. State of the NHS labour market for non-medical staff
Background
5.1. Effective workforce policy is critical to the delivery of affordable, high quality care. Securing the people with the values, skills, experience and expertise which the NHS needs is central to the future of England’s health and care system. Health Education
England's draft workforce strategy, out for consultation, describes an approach to shaping the face of the NHS and social care workforce for the next ten years.
5.2. The Department is responsible for leading, shaping and funding healthcare in England. The Department works with system partners to ensure there is a highly engaged and motivated medical and non-medical workforce delivering NHS services to patients. The Department works through its Arms-Length Bodies (ALBs) on the delivery and implementation of workforce policy with Heath Education England being the lead ALB responsible for workforce.
5.3. The move to loan funded pre-registration clinical education presents the opportunity to ensure future supply, and the introduction of the apprenticeship levy ensures a dedicated financial resource is available for employers to invest in the training of new and existing staff through the greater use of apprenticeships at all levels, including at degree and postgraduate levels, changing the skill mix across employers.
5.4. HEE has a clear remit to lead workforce planning across the health system to secure the future supply of workforce, based on local plans which are affordable and take full account of national policy requirements and will assess the extent to which further new posts might be created.
5.5. Effective workforce planning requires reliable and accurate workforce information at both national and local level. HEE’s national workforce planning for England is underpinned by national data collected by NHS Digital and a comprehensive local workforce planning process. This process includes working with Sustainable Transformation Plans and Local Workforce Advisory Boards, to ensure delivery plans for the future reflect the needs of local service users.
5.6. HEE is best placed to address any questions that the review body may have about the quality of workforce planning or the evidence base that underpins its decisions on future workforce investment.

State of the NHS labour market for non-medical staff
33
Workforce Information
5.7. Reliable and accurate workforce information is required to support national policy making and public and parliamentary accountability as well as to underpin workforce planning. The Department works closely with NHS Digital (and ALBs) to support the improvement of the quality and coverage of published workforce information. Last year the DDRB and the NHSPRB asked for more consistent evidence and data covering vacancies, attrition/turnover by staff group and geographical areas, as well as more detailed data on agency spend and the impact of the agency cap.. The Department’s analytical team is working closely with the Review Body secretariat to bring together data and information
from a range of sources that will provide a reliable single source for all parties and address some of these issues.
5.8. Chapter 4 has shown how pay has changed over time with some comparisons to the private sector. By examining key statistics in the NHS labour market we can understand whether the pay changes are also correlated with issues for the NHS in terms of recruitment and retention of key staff groups. However, reasons for working in the NHS will not be solely determined by change in earnings.

The NHS Pay Review Body (NHSPRB) Review for 2018
34
Numbers in work
5.9. The overall NHS workforce has increased between March 2012 and March 2017 by 54,350 FTEs (6.2%). All areas apart from infrastructure support staff have seen increases. Increases vary from 3.9% growth in nurses and health visitors to 20.4% increase in support for ambulance staff
Fig 5.1: Non-medical staff FTE March 2012 to March 2017
Source: NHS Digital HCHS monthly workforce publication
Funding Reform for Student Nurses and Allied Health Professions
5.10. On August 1st the government changed the funding system for nursing students. The move to bring the funding of pre-registration nursing degrees and Allied Health courses into line with other undergraduate courses through the student support system removed the "cap" of centrally imposed number controls and financial limitations which a fixed envelope of Government funding for fees and bursaries represented.
5.11. This presents an opportunity to further increase the future supply of registered nurses, as well as that of other clinical professionals. HEE and the wider system will need to continue to work closely with Higher Education Institutions (HEIs) and partners, through continuing to attract high calibre applicants, and ensuring the provision of high quality clinical placements to support expansion.
Staff Groups Mar-12 Mar-17 % change
Nurses & health visitors 275,114 285,893 3.9%
Midwives 20,342 21,597 6.2%
Ambulance staff 17,727 19,772 11.5%
Scientific, therapeutic & technical staff 122,009 132,673 8.7%
Support to clinical staff 275,836 313,115 13.5%
Support to doctors, nurses & midwives 214,478 242,428 13.0%
Support to ambulance staff 12,479 15,018 20.4%
Support to ST&T staff 48,879 55,669 13.9%
NHS infrastructure support 171,517 163,845 -4.5%
Central functions 84,959 80,871 -4.8%
Hotel, property & estates 54,904 51,862 -5.5%
Senior managers 9,921 9,974 0.5%
Managers 21,733 21,139 -2.7%
Total 882,545 936,895 6.2%

State of the NHS labour market for non-medical staff
35
5.12. To facilitate expansion, additional Clinical Placement funding was announced by the Department of Health in August and October 2017. This enables around 5,000 more nursing students to enter training each year to 2020/21, representing a 25% increase over the number of nursing students in 2016/17. HEE are working with HEIs and NHS providers to safely increase the number of clinical placements and ensure their compliance with Quality Frameworks.
5.13. Although the 2017 application cycle has not yet closed, data available on the numbers of placed students by mid-September show:
Placed applicants to nursing courses at English HEIs, by applicants domiciled in England, have decreased by 5% since A-level results day last year.
Placed applicants on Nursing Courses in England from all domiciles have decreased by 6%.
5.14. Further context should be taken from the drop in applications to nursing courses; this dip in applications is consistent with the performance of other higher education courses when tuition fees were introduced historically, and is similar to the numbers of applications at the same stage in 2014 and 2015. The table below shows the number of nursing student acceptances over the last five years.
Fig 5.2: Number of nursing student acceptances
Providers in England
2013 2014 2015 2016 2017
England 18,330 20,370 20,350 21,660 20,510
Northern Ireland 170 160 180 220 180
Scotland 30 40 30 30 20
Wales 330 350 370 350 320
EU 340 310 340 370 230
Non EU 50 50 60 50 80
Total 19,250 21,280 21,330 22,680 21,340
Source: Universities and Colleges Admissions Service (UCAS)
Skill Mix
5.15. The Department continues to work with NHS England and HEE to consider how skill mix changes can help address workforce shortages.

The NHS Pay Review Body (NHSPRB) Review for 2018
36
5.16. The new Nursing Associate role will be a valuable contribution to the health and care workforce, providing a new professional group to support employers to meet workforce challenges.
5.17. Nursing Associates create a bridge between senior healthcare support workers and registered nurses by delivering hands on care, allowing registered nurses to spend more time using their specialist training to focus on clinical duties and take more of a lead in decisions on patient care.
5.18. There are currently 2000 nursing associates in training within HEE Pilots, due to complete and become qualified Nursing Associates in 2019. The training sites bring together a wide range of organisations including education institutions, care homes, acute, community and mental health trusts and hospices; representing where Nursing Associates will provide care. In October 2017 the Government committed to introducing a further 5,000 Nursing Associate in 2018, and 7,500 in 2019 through the apprentice route allowing health and care providers to grown their own workforce and reduce reliance on expensive agency staff.
5.19. As well as the changes within the nursing workforce, the NHS Five-Year Forward View highlighted that the increasing need for medical treatment and advances in clinical care requires coordinated approaches and a greater skill mix within healthcare teams, including the enhancement of existing roles and the introduction of new roles.
5.20. As a result, the NHS has seen the emergence and increased use of new professional roles within multi-disciplinary teams as part of a continuing drive to provide safe, accessible and high quality care for patients. Four of these professional roles can be grouped under the Medical Associate Professionals (MAPs) heading as they share some similarities in their career framework and education and training. The four roles are:
Physician associates (PAs)
Physicians’ assistants (anaesthesia) (PA(A))
Surgical care practitioner (SCP)
Advanced critical care practitioner (ACCP)
5.21. The increased use of MAP roles could contribute to this improved skills mix and facilitate high quality patient care in both primary and secondary care settings.
5.22. The further growth of the Physicians’ Associate role (there are no Government plans at present to expand any of the other 3 MAP roles) is a key part of the Government's policy to develop a more effective, strong and expanding general practice to meet future need. HEE has been working with experts in the field to commission additional Physician Associate training courses in England.

State of the NHS labour market for non-medical staff
37
Return to Practice
5.23. There is now widespread recognition that greater attention is needed to better support and retain the current NHS workforce and increase the number of registered nurses returning to practice. The Department is keen to explore all avenues to recruit new staff and retain those who are considering their options or who have left their profession. For example, NHS Employers and Skills for Care support employers with extensive information on good retention practice.
5.24. Health Education England (HEE) is also engaged in schemes to encourage health
professionals to return to practice. For example, from September 2014 HEE’s work has focused on those nurses who have left the profession for a variety of reasons but would come back if the right training and support was available. Since the programme began 3,596 nurses have completed their re-training and are now available for employment) on the front line to provide care and support for patients. There is a total of more than 3,441 (Attrition rate at the moment is less than 10%) registered on return-to-practice programmes. (March 2017). Individuals can take between 3 and 12 months to complete, depending on circumstances and training requirements. It has been very encouraging to see the enthusiasm among these returning nurses who now also have the opportunity to return to General Practice or Social Care sector nursing via new pilot schemes through further investment this year. This is good news for returning staff and good news for patients, but is also a quick and efficient way of boosting the current workforce.
5.25. Return to practice programmes are key to ensuring the NHS makes it as simple and flexible as possible for those that have left the workforce for a range of reasons, such as family and caring responsibilities or career breaks, to return to the workforce when the time is right for them.
5.26. In addition, working with the Department for Education (Government Equalities Office) we have just launched an initiative to provide opportunities for a minimum of 300 Allied Health Professionals who have taken a break from the workforce to return to the NHS.
This will be a national campaign run over the next 18 months providing vital support to the wide range of the Allied Health Professionals helping them back in to the workforce. Initiatives such as this will provide support, not only to employers but the individual themselves.
5.27. NHS Digital continues to investigate other sources for vacancy information to build on the information extracted from NHS Jobs, potentially including data derived from the Electronic Staff Records (ESR) system even though not all organisations use ESR to record establishment and vacancies. The intention being to both help define what more meaningful data may be possible to extract from different systems, and improve the quality and completeness of data in those systems, including both in ESR and in NHS Jobs.

The NHS Pay Review Body (NHSPRB) Review for 2018
38
Retention
5.28. Improving retention is a vital part of the Government’s workforce supply strategy both at a national and local level to ensure we keep more of the trained workforce for longer; it takes a minimum of 3 years to train nurses and Allied Health Professionals and up to 12 to 15 years to fully train a Doctor. Working in the health service is a tough job and getting staff trained to the high quality standards is both expensive for the NHS and also for the individual. There is no single solution to this and it requires a multi-dimensional approach to retain staff; for example, we need to ensure that staff are empowered to do their job and engaged in their work, that there is flexibility around the work ‘offer’,
creating open and supportive environments to work in, investing in Continuing Professional Development alongside offering clear and achievable career development pathways. However, this will not be an overnight fix; it is going to take a number of years and sustained effort to ensure we get it right.
5.29. NHS Improvement are rightly at the forefront of this work and are directly supporting 53 mental health providers and over 50 acute and community providers in the development of improvement measures to support nurse retention and participation rates through the application of guidance and good practice and have launched a national programme on retention to strengthen the support available to Trusts. Initially this work was focused on a clinically-led, nursing retention Direct Support Programme targeted at trusts with high turnover rates with the aim to increase the focus on retention for Trusts with higher leaver rates and reduce variation across Trusts through targeted intervention. In addition NHS Improvement’s Directors of Nursing are working with Trusts to develop rapid improvement plans on retention.
5.30. To increase retention within Mental Health, NHS Improvement are focusing on a Mental Health retention programme, in which all Mental Health trusts will be set targets in Full Time Equivalent (FTE) as savings based on their current clinical leaver rates to achieve the 6,000 FTE savings that NHS Improvement have committed to by 2020. Those with the highest leaver rates will receive targeted support following the same methodology as
the nursing NHSI Retention Direct Support Programme.
5.31. Alongside direct intervention, NHS Improvement will develop and publish a wide suite of resources which will describe Trusts' innovative approaches to retention including webinars and case studies and alongside this run masterclasses to ensure that all trusts have access to the tools to improve retention.
5.32. We use the stability index to measure how well the NHS is doing in retaining the workforce it has. NHS Digital data shows retention continues to fall slightly for most NHSPRB remit groups in recent years. Retention of ambulance staff is better than other staff groups.

State of the NHS labour market for non-medical staff
39
Fig 5.3: Stability index for non-medical staff in last five years
Source: NHS Digital
Non-medical staff reasons for leaving
5.33. Using ESR data on recorded reasons for leaving we are able to undertake some analysis on leavers. The stated reasons for leaving must be treated with caution as this is clerically completed and there are many for whom no reason is given. The picture over the last five years (2012/13 – 2016/17) is that over half leave as a result of voluntary resignations.
5.34. Analysis of voluntary resignations, excluding those resigning for reasons unknown, show the proportion leaving for work-life balance has increased from 11% to around 16% and the percentage of those leaving for better reward package remains broadly stable around 5%, in this period.
Staff groups 2012-13 2013-14 2014-15 2015-16 2016-17
Nurses &Health Visitors 89.9% 90.3% 89.7% 89.5% 89.1%
Midwives 91.5% 91.0% 90.2% 89.7% 89.2%
Ambulance 94.0% 93.2% 92.6% 92.4% 92.7%
STT 88.7% 89.4% 88.5% 88.3% 88.6%
Support to Clinical 88.9% 89.1% 88.4% 88.4% 87.6%
Infrastructure 88.2% 81.1% 87.9% 88.3% 88.4%

The NHS Pay Review Body (NHSPRB) Review for 2018
40
Reason For Leaving 2012/13 2013/14 2014/15 2015/16 2016/17 2012/13 2013/14 2014/15 2015/16 2016/17
Voluntary Resignation - Relocation 14073 15885 18297 19303 20387 18.9% 18.8% 18.6% 18.4% 18.8%
Voluntary Resignation - Work Life Balance 8201 10163 13771 16193 17273 11.0% 12.0% 14.0% 15.5% 15.9%
Voluntary Resignation - Promotion 8016 10587 12347 13525 14146 10.7% 12.5% 12.5% 12.9% 13.0%
Absolute Figures Percentage of voluntary resignations
Reason For Leaving 2012/13 2013/14 2014/15 2015/16 2016/17 2012/13 2013/14 2014/15 2015/16 2016/17
Voluntary Resignation - Relocation 5888 6552 7520 8123 8370 25.0% 24.2% 24.2% 25.1% 26.3%
Voluntary Resignation - Work Life Balance 3170 3945 5215 5888 6049 13.4% 14.6% 16.8% 18.2% 19.0%
Voluntary Resignation - Promotion 2141 2662 3137 3402 3372 9.1% 9.8% 10.1% 10.5% 10.6%
Reason For Leaving 2012/13 2013/14 2014/15 2015/16 2016/17 2012/13 2013/14 2014/15 2015/16 2016/17
Voluntary Resignation - Relocation 480 566 569 598 618 32.6% 33.9% 33.0% 32.4% 34.1%
Voluntary Resignation - Work Life Balance 177 227 288 347 356 12.0% 13.6% 16.7% 18.8% 19.6%
Voluntary Resignation - To undertake
further education or training 71 86 72 71 44 4.8% 5.1% 4.2% 3.9% 2.4%
Percentage of voluntary resignations Absolute Figures
5.35. The proportion of Nurses and Health Visitors and Midwives leaving for work-life balance reasons is higher than the average for all non-medical staff. The numbers within these staff groups leaving for work-life balance reasons increased year on year over the period.
Fig 5.4; Top 3 reasons for leaving - all non-medical staff
5.36. We can also look at the most commonly given reasons during voluntary resignations (excluding unknowns/other) for some staff groups within the NHSPRB remit.
Fig 5.5: Voluntary Resignations – all non-medical staff
Source: NHS Electronic Staff Records
Fig 5.6: Voluntary Resignations – Nurses & Health Visitors
Source: NHS Electronic Staff Records
Fig 5.7: Voluntary Resignations - Midwives
Source: NHS Electronic Staff Records
Reason For Leaving 2012/13 2013/14 2014/15 2015/16 2016/17 2012/13 2013/14 2014/15 2015/16 2016/17
Voluntary Resignation 74598 84678 98418 104804 108722 44.7% 58.0% 60.6% 62.1% 63.0%
Retirement 21814 22394 26007 25732 25875 13.1% 15.3% 16.0% 15.2% 15.0%
Dismissal 5422 5374 5464 5986 5860 3.2% 3.7% 3.4% 3.5% 3.4%
Absolute Figures Percentage of all leavers

State of the NHS labour market for non-medical staff
41
Reason For Leaving 2012/13 2013/14 2014/15 2015/16 2016/17 2012/13 2013/14 2014/15 2015/16 2016/17
Voluntary Resignation - Relocation 2888 3300 3994 4314 4765 13.2% 13.5% 13.2% 13.1% 13.1%
Voluntary Resignation - Work Life Balance 2454 2867 4071 5067 5705 11.2% 11.7% 13.4% 15.4% 15.7%
Voluntary Resignation - To undertake
further education or training 1347 1640 2129 2391 3012 6.2% 6.7% 7.0% 7.3% 8.3%
Absolute Figures Percentage of voluntary resignations
Reason For Leaving 2012/13 2013/14 2014/15 2015/16 2016/17 2012/13 2013/14 2014/15 2015/16 2016/17
Voluntary Resignation - Promotion 440 680 711 752 768 22.5% 30.9% 29.1% 28.0% 29.1%
Voluntary Resignation - Relocation 211 207 252 277 253 10.8% 9.4% 10.3% 10.3% 9.6%
Voluntary Resignation - Work Life Balance 115 193 248 273 272 5.9% 8.8% 10.2% 10.2% 10.3%
PercentagesAbsolute Figures
Fig 5.8: Voluntary Resignations – Support Staff
Source: NHS Electronic Staff Records
Fig 5.9: Voluntary Resignations - Managers
Source: NHS Electronic Staff Records
Staff Group Leaver rates by region.
5.37. A look at leaver rates for staff groups across the regions show the following:
Nurses and health visitors; Midwives; and Ambulance Staff – increases in leaver rates in most regions.
Scientific, Therapeutic and Technical Staff; and Support to Clinical Staff –increases in leaver rates in some regions, but these are not clustered in one part of England.
Infrastructure Support Staff – The leaver rate peak in 2013-14 coincided with transformation of the health system, when Primary Care Trusts and Strategic Health Authorities closed, and Social Enterprises were created. Some staff left the NHS, and some moved with their jobs into Social Enterprises. This makes it difficult to identify possible trends.
5.38. Leaver rates by region over time show few clear patterns and therefore does not provide sufficient evidence for additional regional pay targeting. Indeed, the key focus is on increasing staff numbers via more effective recruitment and retention to reduce the work-life balance pressures on the workforce.

The NHS Pay Review Body (NHSPRB) Review for 2018
42
Nurses & Health Visitors 12-month leaver rate
Region 2010-11 2011-12 2012-13 2013-14 2014-15 2015-16 2016-17
E Mids 8.3% 8.5% 10.1% 8.9% 9.5% 9.7% 10.3%
E of Eng 9.0% 12.2% 11.7% 10.0% 11.0% 11.1% 10.7%
Yorks & H 7.5% 9.8% 8.2% 10.1% 9.2% 9.7% 10.4%
Wessex 9.7% 9.6% 9.1% 9.6% 10.5% 10.3% 10.9%
Thames V 9.8% 10.7% 11.1% 10.2% 12.4% 11.7% 12.4%
NW Lon 10.3% 9.8% 11.1% 10.5% 11.6% 12.2% 12.1%
S Lon 10.2% 9.5% 11.4% 10.7% 11.4% 11.8% 12.1%
NCE Lon 10.3% 10.1% 10.7% 10.6% 11.7% 11.8% 12.0%
Kent, S&S 8.7% 10.0% 14.0% 9.6% 10.5% 10.7% 11.6%
N East 7.2% 7.7% 6.7% 7.6% 7.7% 8.4% 8.5%
N West 7.9% 7.8% 7.7% 8.0% 8.7% 9.1% 9.4%
W Mids 8.0% 7.6% 8.0% 8.9% 9.3% 10.1% 10.3%
S West 8.9% 20.9% 11.0% 11.3% 11.7% 11.6% 12.3%
England 8.6% 10.1% 9.7% 9.5% 10.1% 10.4% 10.7%
5.39. Below are tables and graphs for staff groups in different regions based on NHS Digital
Fig 5.10: Leaver rates by region - Nurses and Health Visitors
Source: NHS Digital

State of the NHS labour market for non-medical staff
43
Midwives 12-month leaver rate
Region 2010-11 2011-12 2012-13 2013-14 2014-15 2015-16 2016-17
E Mids 6.8% 7.6% 7.9% 7.6% 9.1% 9.1% 8.7%
E of Eng 8.4% 8.0% 9.1% 9.5% 10.7% 10.7% 12.0%
Yorks & H 5.3% 7.2% 8.3% 8.9% 8.5% 8.8% 9.4%
Wessex 7.8% 8.4% 7.7% 8.7% 9.9% 10.3% 10.7%
Thames V 9.3% 11.4% 9.5% 10.7% 12.5% 13.5% 12.7%
NW Lon 10.5% 10.8% 10.2% 10.2% 13.4% 11.6% 11.8%
S Lon 9.4% 10.1% 9.8% 11.9% 10.7% 13.4% 11.8%
NCE Lon 8.7% 9.8% 8.9% 8.7% 9.6% 11.2% 11.8%
Kent, S&S 7.0% 9.2% 9.3% 7.9% 10.8% 10.0% 12.3%
N East 6.3% 5.9% 7.1% 8.2% 7.5% 8.1% 8.2%
N West 6.5% 6.5% 7.0% 6.5% 7.5% 9.1% 9.6%
W Mids 6.3% 6.8% 7.2% 8.3% 8.4% 8.6% 9.2%
S West 8.1% 7.3% 8.9% 9.4% 9.8% 9.8% 11.2%
England 7.4% 8.0% 8.3% 8.7% 9.5% 10.0% 10.6%
Fig 5.11: Leaver rates by region - Midwives
Source: NHS Digital

The NHS Pay Review Body (NHSPRB) Review for 2018
44
Ambulance Staff 12-month leaver rate
Region 2010-11 2011-12 2012-13 2013-14 2014-15 2015-16 2016-17
E Mids 4.9% 5.2% 7.0% 6.5% 6.0% 7.9% 7.1%
E of Eng 4.9% 5.9% 7.0% 7.0% 8.5% 8.7% 6.7%
Yorks & H 4.1% 4.8% 5.0% 7.1% 6.6% 7.6% 6.6%
Wessex 7.2% 6.0% 6.1% 4.5% 11.9% 11.9% 9.8%
Thames V 5.1% 5.8% 5.3% 8.8% 8.9% 9.4% 8.1%
NW Lon 5.7% 4.6% 7.3% 8.0% 9.8% 7.9% 6.6%
Kent, S&S 4.6% 4.3% 6.3% 7.7% 8.5% 7.3% 11.1%
N East 4.5% 6.4% 6.9% 6.9% 7.7% 6.1% 4.8%
N West 4.6% 4.7% 4.7% 6.4% 5.1% 6.2% 6.2%
W Mids 3.1% 4.5% 5.0% 4.8% 5.7% 6.5% 6.6%
S West 5.3% 5.7% 6.1% 5.8% 8.5% 8.8% 9.0%
England 4.8% 5.0% 6.0% 6.8% 7.4% 7.6% 7.3%
Fig 5.12: Leaver rates by region - Ambulance Staff
Source: NHS Digital

State of the NHS labour market for non-medical staff
45
Scientific, Therapeutic & Technical 12-month leaver rate
Region 2010-11 2011-12 2012-13 2013-14 2014-15 2015-16 2016-17
E Mids 8.5% 9.0% 9.3% 9.3% 9.5% 9.3% 9.9%
E of Eng 9.7% 11.9% 12.8% 11.8% 13.8% 11.6% 11.7%
Yorks & H 8.4% 9.9% 8.9% 9.8% 9.7% 10.1% 9.2%
Wessex 10.1% 10.6% 9.7% 10.7% 12.0% 11.6% 10.7%
Thames V 11.0% 11.2% 13.2% 11.9% 12.7% 12.1% 12.0%
NW Lon 11.9% 11.8% 13.7% 12.4% 12.9% 13.7% 13.9%
S Lon 11.6% 12.7% 13.4% 12.1% 16.1% 13.5% 14.3%
NCE Lon 11.1% 12.4% 11.6% 11.9% 12.6% 15.4% 13.4%
Kent, S&S 9.6% 11.3% 15.1% 10.4% 11.3% 11.3% 11.5%
N East 8.6% 7.9% 8.1% 8.5% 9.2% 9.4% 9.4%
N West 8.4% 8.5% 8.3% 9.0% 9.4% 9.8% 9.5%
W Mids 7.4% 9.5% 8.5% 9.2% 9.2% 10.0% 10.2%
S West 8.8% 20.9% 12.6% 10.7% 11.2% 12.3% 12.0%
England 9.3% 11.2% 10.7% 10.3% 11.1% 11.2% 11.0%
Fig 5.13: Leaver rates by region - Scientific, Therapeutic & Technical
Source: NHS Digital

The NHS Pay Review Body (NHSPRB) Review for 2018
46
Support to Clinical 12-month leaver rate
Region 2010-11 2011-12 2012-13 2013-14 2014-15 2015-16 2016-17
E Mids 11.5% 10.0% 12.6% 9.9% 10.3% 10.6% 11.0%
E of Eng 11.7% 15.1% 12.7% 11.7% 13.4% 12.9% 12.1%
Yorks & H 9.7% 13.4% 9.1% 10.5% 9.1% 9.9% 10.3%
Wessex 12.2% 12.2% 11.0% 11.0% 14.1% 12.6% 16.4%
Thames V 12.6% 12.9% 12.1% 13.3% 15.0% 14.3% 16.3%
NW Lon 11.0% 10.9% 11.4% 10.0% 11.2% 12.6% 12.7%
S Lon 13.1% 11.7% 11.6% 11.4% 12.3% 12.4% 13.1%
NCE Lon 11.3% 11.9% 11.2% 11.3% 12.1% 12.8% 11.9%
Kent, S&S 11.5% 13.9% 14.4% 12.1% 12.2% 11.9% 13.7%
N East 7.9% 8.8% 7.1% 8.5% 9.3% 8.3% 8.8%
N West 9.2% 9.0% 8.0% 8.9% 9.3% 9.3% 10.2%
W Mids 10.1% 11.1% 8.9% 9.0% 9.7% 10.4% 11.3%
S West 11.2% 20.0% 12.9% 12.6% 13.1% 13.2% 13.9%
England 10.6% 12.3% 10.6% 10.5% 11.1% 11.2% 11.9%
Fig 5.14: Leaver rates by region - Support to Clinical Staff
Source: NHS Digital

State of the NHS labour market for non-medical staff
47
Infrastructure Support 12-month leaver rate
Region 2010-11 2011-12 2012-13 2013-14 2014-15 2015-16 2016-17
E Mids 11.6% 12.2% 15.4% 19.9% 19.7% 10.6% 10.4%
E of Eng 12.3% 14.3% 15.6% 19.1% 12.7% 13.9% 11.5%
Yorks & H 10.3% 12.2% 9.7% 18.5% 9.0% 10.3% 9.6%
Wessex 18.5% 11.4% 11.6% 20.0% 12.0% 13.5% 11.9%
Thames V 12.8% 15.1% 11.3% 19.3% 13.3% 12.6% 12.0%
NW Lon 12.8% 13.4% 10.8% 21.1% 11.6% 14.5% 12.5%
S Lon 12.7% 14.5% 11.4% 21.5% 11.3% 12.7% 12.9%
NCE Lon 13.2% 17.5% 12.4% 24.6% 12.3% 12.7% 11.2%
Kent, S&S 11.0% 13.5% 13.1% 22.7% 11.2% 11.9% 12.5%
N East 11.9% 8.9% 6.9% 17.2% 8.7% 10.5% 14.6%
N West 10.5% 10.8% 8.8% 18.9% 8.5% 9.9% 9.6%
W Mids 11.5% 11.7% 11.8% 17.6% 10.0% 10.1% 11.5%
S West 10.7% 18.7% 12.0% 18.4% 13.4% 11.8% 11.7%
England 11.7% 13.0% 11.4% 19.5% 11.3% 11.4% 11.3%
Fig 5.15: Leaver rates by region - Infrastructure Support
Source: NHS Digital

The NHS Pay Review Body (NHSPRB) Review for 2018
48
Staff Group Q1 2015/16 Q2 2015/16 Q3 2015/16 Q4 2015/16 Q1 2016/17 Q2 2016/17
Additional Clinical Services 7,936 8,304 7,707 7,121 7,796 8,886
Additional Professional Scientific and Technical 3,040 2,995 2,720 2,917 3,484 3,429
Administrative and Clerical 19,365 20,141 17,954 17,510 19,407 19,647
Allied Health Professionals 7,733 8,422 7,763 8,396 9,083 9,508
Estates and Ancillary 1,909 2,139 1,915 1,843 2,179 2,500
Healthcare Scientists 1,606 1,720 1,503 1,606 1,802 1,902
Nursing and Midwifery Registered 27,558 28,860 28,713 29,251 30,262 31,634
Students 217 59 36 99 163 55
Total 69,364 72,639 68,312 68,743 74,175 77,561
Staff Group Q1 2015/16 to Q1 2016/17 Q2 2015/16 to Q2 2016/17
Additional Clinical Services -1.8% 7.0%
Additional Professional Scientific and Technical 14.6% 14.5%
Administrative and Clerical 0.2% -2.5%
Allied Health Professionals 17.5% 12.9%
Estates and Ancillary 14.2% 16.9%
Healthcare Scientists 12.2% 10.6%
Nursing and Midwifery Registered 9.8% 9.6%
Students -24.9% -6.4%
Total 6.9% 6.8%
Advertised vacancies (FTE) data
5.40. There is limited consistent and robust information on vacancies across the NHS and how this changes over time. NHS Digital has established a working group with DH, HEE, NHSI and NHSE to better establish a robust series.
5.41. It is possible to achieve some indicative understanding of the NHS labour market demand and supply pressures by analysing the NHS Digital series of advertised vacancy full-time equivalents. This data is derived from the NHS Jobs website.
5.42. The table below shows how many job adverts were issued each quarter for different staff groups. Nursing and midwifery job adverts formed a little under half of all advertised posts.
Fig 5.16: HCHS Non-medical staff advertised vacancies
Source: NHS Digital Vacancy Publication
5.43. The job advert series is relatively new and there is limited data to establish trends. However over the last year the number of job adverts has increased by almost 7%. Nursing and midwifery adverts have increased by almost 10%, but other staff groups have experienced higher growth rates.
Fig 5.17: % changes in job adverts (yearly quarters)
Source: NHS Digital Publication

State of the NHS labour market for non-medical staff
49
5.44. NHS Improvement (NHSI) have also investigated the number of vacancies in the NHS and estimates around 36,000 Nurse Vacancies of which 33,000 (92%) were covered by Bank and Agency staff. This continues to be work in progress.
Agency (all HCHS staff) and Bank (non-medical staff only)
5.45. The use of Agency and Bank staffing may also provide some indication of the NHS labour market. The available national expenditure figures do not separate NHSPRB Remit from medical and dental staff. They include all expenditure on off-payroll staffing, including agency, self-employed contractors and externally-managed banks.
5.46. Spending on agency staff rose by 40% between 2013/14 and 2015/16 (£2.6bn to £3.7bn), but due to NHSI introduced agency controls, expenditure on Agency reduced to £2.9bn in 2016/17 (a fall of 22% or £800 million across the total workforce in 2016/17).
5.47. We have continued to see a significant reduction in agency expenditure in the first quarter of 2017/18. Overall agency spend was £169 million lower (22%) than Q1 last year and £282 million (32%) than Q1 2015/16. A national ‘bank’ strategy is being developed, to increase bank staff utilisation across trusts and decrease spending even further.
5.48. At a regional level, the expenditure rate (agency as a percentage of total staff costs) is generally higher than average in the East of England, London and Kent. The level of change in the last three years has not followed a clear geographical pattern. During last year there have been decreases in all regions; the largest decreases were in East of England, Thames Valley and NW London.
5.49. Agency expenditure is highly variable between Trusts. Variation between Trusts within regions is far greater than variation in the average between regions. In 2016-17 the
regional median average varied between 2.4% and 9.2%, and the Trust rate ranged from 0.1% to 20% of staff costs. This might suggests that agency expenditure is driven principally by individual Trust-specific factors.

The NHS Pay Review Body (NHSPRB) Review for 2018
50
Fig 5.18: Agency Expenditure Rate by Region, 2013/14 to 2016/17
Source: NHS Improvement
Fig 5.19 Variation in Agency Expenditure Rate, by Region: 2016/17
Source: NHS Improvement – Trust Financial Accounts
Note: The chart shows the 4 quartile Trust agency values for each region For example, in East Midlands, the lowest agency expenditure by a Trust was 0.9% of staff costs, the highest was 15.3%, and the median average was 5.6%. The upper and lower limits of the box are the 25% and 75% points: 25% of Trusts had agency expenditure more than 8.7% and 75% spent more than 3.8% of staffing expenditure on agency.

State of the NHS labour market for non-medical staff
51
Jun-16 Jun-17 % change
Nurses & health visitors 8,942 10,158 13.6%
Midwives 387 462 19.3%
Ambulance staff 245 219 -10.5%
Scientific, therapeutic & technical staff 1,272 1,351 6.3%
Support to doctors, nurses & midwives 17,163 18,435 7.4%
Support to ambulance staff 348 415 19.2%
Support to ST&T staff 873 896 2.6%
Central functions 4,936 5,102 3.4%
Hotel, property & estates 2,662 2,791 4.9%
Senior managers 27 53 93.2%
Managers 101 103 1.5%
Bank Staff 5.50. NHS Digital has started publishing some data in relation to bank staff in the NHS. As this
version is relatively new, there is limited dataset available. A year on year comparison shows an increase in the use of all staff groups except for ambulance staff where a decrease is observed. It is possible that this apparent growth in Bank staff use is a consequence of bearing down on more expensive Agency spending.
Fig 5.20: Non-medical bank staff usage (FTE)
Source – NHS Digital
Apprenticeships
5.51. In April 2017 the Government introduced an Apprenticeship Levy to support the growth in the number of apprentices across the UK. The impact of the levy amounts to some
£200m a year across the NHS. This will provide a significant financial resource which enables employers to invest in the training of new and existing staff through the greater use of apprenticeships at all levels. Employers will be required to co-invest through the payment of apprentices' salaries and other costs and through the release of the apprentices for the mandatory "off the job" training.
5.52. The apprenticeship agenda is an important part of the overall plans for the NHS workforce to become more self-sufficient. The Department’s policy aims to develop career pathways through the apprentice route into the regulated healthcare professions.
5.53. Entry level apprentice standards will support employers to attract employees they can train to meet their business needs. They provide opportunities for people from all backgrounds to enter a career in the NHS. Mid-level and higher and degree level apprentice standards act as an incentive to retain workforce, especially for some health and care employers who typically struggle to retain that workforce. They widen

The NHS Pay Review Body (NHSPRB) Review for 2018
52
opportunities for some people who would ordinarily struggle to access a career in regulated healthcare professions – making the NHS more representative of the populations it serves.
5.54. NHS employers have comprehensive advice on pay for apprentices, in addition to the national guidance on the Minimum Apprentice Wage the NHS Staff Council have engaged with employers and unions to develop principles for apprentice pay.
5.55. This guidancexiii has been agreed by the NHS Staff Council to support employers and local partnerships in considering the options available to them in relation to pay and conditions of apprentices in the NHS and provides general advice on the employment of apprentices in the NHS.
5.56. The Government recognises the value of the apprentice route in opening up opportunities for people from all backgrounds to enter a career in the NHS. Apprenticeships provide opportunities for employers to grow their own workforce and for employees to earn while they learn. The Health Secretary announced on 3 October 2017 plans to train thousands of Nursing Associates through the apprentice route from 2018. The planned expansion is designed to support employers to grow the domestic nursing supply and reduce reliance on overseas trained staff and expensive agency staff. The Department is working with HEE, the NMC and Higher Education Institutions to ensure a progression pathway between Nursing Associates and the Registered Nurse.
5.57. As at October 2017, there a large number of apprenticeship standards in development for NHS roles; ranging from paramedics, occupational therapists, physiotherapists as well as apprentice standards which are already approved and being used in healthcare science, assistant practitioners and nursing. The Department also expects non-healthcare apprenticeships to be used widely across the NHS in roles such as business and administration, leadership and management and digital roles.
Staff experience - Introduction
5.58. Overall, the evidence suggests that staff experience in the NHS has remained broadly stable since last year. This, however, when considered alongside some negative media reports and union surveys on staff morale emphasises the need to continue developing new ways to support the NHS in retaining and motivating staff. Last year's evidence showed that engagement scores improved but there was no room for complacency with variation across the NHS and challenges for some staff groups, for example, operational ambulance staff whose engagement score deteriorated but motivation improved. In respect of staff health and wellbeing, overall, staff reported working extra hours including Allied Health Professionals and registered nurses although it had fallen for ambulance staff; the percentage suffering work related stress had also fallen overall as it had for those feeling pressure to attend work despite feeling unwell. The rate of sickness absence last year had improved slightly with ambulance staff continuing to experience the highest rate although they had also seen the biggest reduction.

State of the NHS labour market for non-medical staff
53
5.59. Employers across the NHS are responsible for improving their staff experience. The Department is working in partnership with Arms-Length Bodies, NHS England, the Care Quality Commission, NHS Employers and NHS trades unions to improve staff retention through, for example, more opportunities for flexible working, tackling bullying of NHS staff, reducing the levels of violence and abuse against staff and improving the support trusts provide to help staff health and wellbeing e.g. quicker access to musculo-skeletal, mental health and weight loss therapies. These initiatives should help trusts become employers of choice through excellence employment practice. Work continues to explore how trusts can be supported and how progress can be measured through the Care Quality Commission’s (CQC) inspection programme via its "Well Led Domain"xiv.
5.60. Evidence available to the Department to inform policy development on staff experience continues to improve as our ability to monitor trends becomes easier with more data year on year collected via the NHS Staff Survey and the Staff Friends and Family test (staff FFT) so we can gain a better understanding of how staff feel about working in the NHS.
5.61. NHS Digital is working with stakeholders to improve sickness absence data which may, for example, include information on length of sickness absence and number of episodes with the aim of introducing any agreed changes to the publication from April 2018. NHS organisations continue to have access to high quality data sources to help benchmark progress they are making in improving staff experience. They can use evidence from the Staff Survey, staff FFT, sickness absence data and CQC inspection reports to complement local intelligence to help their plans. The NHS Constitution provides the framework for what employers should expect of their staff and vice versa.
5.62. Trusts can also assess their progress using NHS Improvement's “Staff Experience and Outcomes Explorer” (introduced in May 2017) which bridges the gap between the NHS Staff Survey website's on line tool and the research evidence on the impact of staff experience and outcomes for patients. This can be found at NHS Improvement’s Hub and includes a national summary to help trusts answer how they are doing compared to
peers or others across their region. Summary data shows a high level view of the Staff Survey key findings in terms of which trusts have more or fewer in the top or bottom quintile, or where there have been the most significant changes from the previous survey.
5.63. It has been shown by the CQC that there is a strong relationship between outcomes of their inspections and the experience of staff and for that reason the “Explorer” can be used to highlight the relationship between CQC inspections and NHS Staff Survey key factors using CQC ratings based on inspection reports for all trust types The “Explorer” covers: Appraisals; Discrimination; Team working; Engagement; Health Wellbeing; Safety and 'Freedom To Speak'
5.64. The Department has also changed its commission of NHS Employers, bringing together staff engagement; health and well-being; organisational development and tackling bullying into one programme for the provision of advice, guidance and good practice to

The NHS Pay Review Body (NHSPRB) Review for 2018
54
help NHS organisations improve NHS staff experience. NHS Employers will provide detailed evidence on progress.
Staff Motivation
5.65. This year, we have used terminology defined by NHSPRB to provide our evidence as follows:
Definition: “the intrinsic motivation of NHS staff and the underlying reasons why people do the job that they do and want to put effort into their work such as the desire to provide care, to earn money or to achieve promotion. Measures of this might include whether staff look forward to
going to work and if they are enthusiastic about their job”.
5.66. As set out in the graph below, most remit staff groups have improved motivation scores since 2012, albeit with slight dips in 2016 for Scientific, Technical and Therapeutic (ST&T), Public Health/Health Improvement (PH/HI) and “all staff”. The need for regularly refreshed support for the NHS in improving motivation is demonstrated by variation in question 2a “I look forward to going to work” for clinical remit groups from 45% of ambulance staff working in community trusts to 70% for PH/HI staff working in combined mental health/learning disability and community trusts. Our work to improve staff retention includes considering issues facing specific staff groups and potential solutions for those. This is initially considering an improved employment offer for nurses.
Fig 5.21: Motivation Score by Staff Group: 2012 to 2016
Source: NHS Staff Survey

State of the NHS labour market for non-medical staff
55
Staff satisfaction
5.67. Definition: "whether NHS staff are happy with their experience of work and achieve what they set out to. Measures of this might include whether staff feel their work is valued, their satisfaction with the work environment and issues such as workload, and whether they feel able to give the care they aspire to".
5.68. Trends for this are difficult to assess at this stage as the graph below shows just two years of data for inclusion (data before then cannot be compared).
Fig 5.22: Staff satisfaction with the quality of work and care they are able to deliver
5.69. Overall, there is a small improvement when all staff groups are considered but there are
slight drops in three of the six remit staff groups with lowest scores for nurses and midwives.
5.70. As with other measures, there is wide variation in scores for underpinning questions. For example, in respect of those who agree/strongly agree with “I am able to do my job to a standard I am personally pleased with” ranges from 43% of midwives in acute specialist trusts to 100% of ambulance staff working in mental health/learning disability trusts although, overall for most staff groups in all types of trusts, scores are reasonably strong for this question ranging from 70% to 90%.
5.71. Midwives scored lower in all types of trusts where they were included than nurses and midwives overall so our plan to improve flexible working through, for example, better use of approved e-rostering systems and making better use of existing mechanisms available for staff may help resolve workload issues the NHSPRB identified affected midwives.

The NHS Pay Review Body (NHSPRB) Review for 2018
56
5.72. In respect of e-rostering, the Department is working across Government, with health leaders and trusts, on improving procurement arrangements for e-rostering solutions. This may include evidence to encourage use of e-rostering, easier access to the market for providers, better interaction with other systems e.g. ESR/payroll, more user training, better access to data etc.
5.73. Workload challenges for midwives seem to be confirmed by the graphs below in respect of extra hours (highest for midwives) and satisfaction with flexible working (lowest for midwives).
Fig 5.23: Percentage of all staff working extra hours (%): 2012 to 2016
Source: NHS Staff Survey

State of the NHS labour market for non-medical staff
57
Fig 5.24: Percentage of staff satisfied with the opportunities for flexible working patterns (%) (Measured
from 2015* onwards)
Source: NHS Staff Survey
* Comparable data only available for 2015 and 2016
5.74. An analysis of midwives paid and unpaid extra hours worked (see graphs below) shows an increase in both of the numbers working 0-5 additional hours, but this is largely offset by an apparent reduction in the number working an additional 11 or more hours unpaid work. Paid extra work may be planned and agreed, unpaid may be unplanned e.g. completing treatment of patients running over the end of a shift etc.
Fig 5.25: Midwives (Extra hours worked per week – paid)
Source: NHS Staff Survey

The NHS Pay Review Body (NHSPRB) Review for 2018
58
Fig 5.26: Midwives (extra hours per week unpaid)
Source: NHS Staff Survey
5.75. NHS Staff Survey data for all staff groups show an increase in the proportion of respondents reporting they get paid overtime relative to unpaid extra hours which showed a slight dip in 2016. This may suggest the NHS is increasingly acknowledging the additional work of staff required to meet patient needs although a far higher proportion of staff continue to work unpaid extra hours. This emphasises the need for excellent staff rostering as part of local workforce planning.
Fig 5.27: All staff (Extra hours worked per week – paid)
Source: NHS Staff Survey

State of the NHS labour market for non-medical staff
59
Fig 5.28: All staff (Extra hours worked – unpaid)
Source: NHS Staff Survey
Staff Engagement
5.76. Definition: "how committed staff are to their organisation (affiliation) and whether they will put extra work in to e.g. engage with initiatives aimed at reforming healthcare delivery to improve efficiency (effort)”.
5.77. The NHS Staff Survey key finding over the last five years show some staff groups are broadly the same or slightly improved but there is a small drop for nurses and midwives whilst operational ambulance staff have improved engagement. This suggests the need for trusts to ensure their staff engagement plans remain high on their agenda supported by available advice, guidance and good practice to enhance local engagement activity.
We continue to use staff engagement scores as a proxy for NHS staff morale but NHS England, which is responsible for the NHS Staff Survey, is working with Professor Michael West - Professor of Work and Organisational Psychology at Lancaster University and Head of Thought Leadership at the King’s Fund - to assess whether there might be a better way to measure staff morale through the NHS Staff Survey given the indications that it may be deteriorating as suggested by some media coverage, union surveys and the PRBs.

The NHS Pay Review Body (NHSPRB) Review for 2018
60
Fig 5.29: Engagement Score by Staff Group: 2012 to 2016
Source: NHS Staff Survey
5.78. While, according to the NHS Staff Survey, staff engagement scores have improved since 2012, the Care Quality Commission highlights that “Engaging and empowering staff is key to driving improvement in hospital care” and their recently published report “Driving Improvement: Case Studies from eight NHS trusts” demonstrates this. (http://www.cqc.org.uk/news/releases/engaging-empowering-staff-key-driving-improvement-hospital-care).
5.79. Sustainability and Transformation Partnerships use staff engagement as the basis for refreshing local services for patients. Last year, NHS Confederation, NHS Clinical Commissioners, NHS Providers and the Local Government Association published a guide to the work vanguards are doing to engage their staff in the design and delivery of new care models. The report – New Care Models and Staff Engagement: All Aboard
(https://www.england.nhs.uk/2016/06/all-aboard) aimed to help spread the learning from the vanguard programme across the health and care sector including:
Enabling different groups of staff across organisations to ‘break down the barriers’ so people can break out of old working patterns and think differently.
Recognising that those on the front line of care have the best ideas about how to improve it – but need to feel empowered to do so.
Recognising that if staff feel that their contribution is valued, they will want to do all they can to make new care models a success.
5.80. Also supporting improved staff engagement, NHS Improvement’s Culture and Leadership Programme continues to evolve. Phase 1 (of 3) is complete including a revised toolkit https://improvement.nhs.uk/resources/culture-and-leadership/ along with

State of the NHS labour market for non-medical staff
61
two short guides. NHSI continue to share learning at events and networks, gather learning from trusts working on culture and are exploring use of the toolkit with trusts in special measures. Two trusts have used the tools to support a merger. Phase 2, completed in September 2017 includes an evidence base prepared by Professor Michael West and reviewed by participating trusts with seven case studies prepared for phase 2 tools.
5.81. In addition, NHSI working with the CQC has revised the Well Led Framework and NHSI has issued new guidance https://improvement.nhs.uk/uploads/documents/Well-led_guidance_June_2017.pdf on developmental reviews of leadership and governance which should identify areas of organisational leadership and governance that would
benefit from further targeted development work to secure and sustain future performance. NHSI is encouraging organisations to carry out, every three to five years, externally facilitated, developmental reviews of their leadership and governance using the well led framework.
5.82. The Staff FFT enables assessment of the extent to which an employee would advocate their trust as a place to work or receive treatment, is undertaken in three quarters each year by NHS England (it is not published during the same period as the NHS Staff Survey). The latest data available, quarter 4 2016/17, shows 64% of staff say they would recommend their organisation as a place to work (up 2% from last year) and 79% would recommend their trust as a place to receive treatment (the same as last year). Its limitation is that it does not separate out staff groups. While direct comparisons between the staff FFT and the NHS staff survey should be resisted, in response to Question 21c, “I would recommend my organisation as a place to work”, all the NHSPRB remit clinical staff groups were between 59% and 63% (midwives and operational ambulance staff both being 59%), general managers were the highest at 66%.
Staff Health and Wellbeing
5.83. There is an increased emphasis on improving NHS staff health and wellbeing led by NHS England’s campaign launched in 2015xv. The Department commissions NHS Employers to provide advice, guidance and good practice to the Service and they are working with NHS England and Public Health England to help embed NHS England’s programme across the NHS. NHS England’s “Commissioning for Quality and Innovation” (CQUIN) £150m incentive scheme is encouraging NHS organisations to invest in services to support staff health and wellbeing with their aim that CQUIN payments will be triggered in 2018/19 for trusts improving NHS staff survey scores for health and wellbeing by 5% from 2015/16 scores. The CQUIN scheme includes incentivising quicker access for staff to musculoskeletal, mental health and weight management services
5.84. The NHS Staff Survey 2016 shows some improvement for many of the PRB’s remit groups over the previous year which may indicate, to an extent, the impact of NHS England’s programme and the CQUIN incentive payments. In respect of the percentage

The NHS Pay Review Body (NHSPRB) Review for 2018
62
of staff feeling unwell due to work related stress over the previous 12 months, they range from 34% (ambulance staff (down 2% from 2015), public health/health improvement (down 2%) and general managers (the same)) to 48% for midwives (up 2% from 2015).
5.85. The percentage of staff attending work in last three months despite feeling unwell because they felt pressure from their manager, colleagues or themselves has dropped for all staff groups from 2015 with scores ranging from 52% (AHPs (down 4% from 2015), general managers (down 1%) to midwives at 64% (down 4%).
5.86. Organisational and management interest in and action on health and wellbeing also improved since 2015 for all staff groups except nursing and healthcare assistants (down to 3.66/5 from 3.67) ranging from 3.39/5 for midwives (up from 3.38) to 3.87 (general managers up from 3.83) with the highest clinical group being public health/health improvement at 3.76 up from 3.75.
Sickness Absence
5.87. Ongoing initiatives to improve NHS staff health and wellbeing and tackle sickness absence have been described previously.
5.88. NHS Digital publishes sickness absence statistics based on information recorded locally in the NHS Electronic Staff Record. The absence rate is calculated as the number of recorded days of absence as a proportion of the total number of calendar days. Sickness absence is subject to month-to-month variation, and some of this is seasonal. The chart shows the 12-month average, which removes seasonal variation. There is variation in rates between occupation groups. These rates have not changed materially since 2010, though the historically high rate for ambulance staff appears to have continually improved. The nursing, Scientific Therapeutic and Technical (ST and T) and
ambulance groups include clinical support staff. All Hospital and Community Health Services (HCHS) figures include medical and dental staff.

State of the NHS labour market for non-medical staff
63
0.0%
0.5%
1.0%
1.5%
2.0%
2.5%
3.0%
3.5%
4.0%
4.5%
5.0%
5.5%
6.0%
Mar2010
Mar2011
Mar2012
Mar2013
Mar2014
Mar2015
Mar2016
Mar2017
April 2009 to March 2017NHS Staff Sickness Absence Rate - Time Series
Monthly rate Seasonally adjusted
Fig 5.30: NHS Sickness Absence Rate - April 2009 to March 2017
5.89. The 12-month average is an alternative mechanism to smooth the effects of seasonal and also other variation. The latest 12 months' average is 4.16% for the year ending 31 March 2017. This compares to 4.15% for the 12 months' average to 31 March 2016. This is a small increase of 0.01 percentage points. At regional level, NHS sickness absence rates are generally higher in the north than in the south.
5.90. For five of the thirteen Health Education England regions, the most recent 12 month average rate has decreased compared to that over the preceding 12 months. The greatest decrease was in North West London at 0.11 percentage points. The largest
increases in the other 8 regions were in East of England, at 0.10 percentage points, and Wessex, at 0.11 percentage points.

The NHS Pay Review Body (NHSPRB) Review for 2018
64
4.82%
4.65%
4.58%
4.35%
4.32%
4.22%
4.16%
4.08%
3.95%
3.83%
3.80%
3.55%
3.34%
3.25%
0% 1% 2% 3% 4% 5%
North West
North East
Yorks & Humber
East Midlands
West Midlands
South West
ENGLAND
East of England
Wessex
Kent, Surrey, Sussex
Thames Valley
South London
N, Central, E London
North West London
NHS Sickness Absence Rates by Region, Average for 12 months to March 2017
0.11%
0.10%
0.06%
0.04%
0.03%
0.03%
0.03%
0.02%
0.01%
-0.04%
-0.04%
-0.04%
-0.06%
-0.11%
-0.2% -0.1% 0.0% 0.1% 0.2%
Wessex
East of England
Yorks & Humber
South West
South London
East Midlands
North West
North East
ENGLAND
West Midlands
N, Central, E London
Thames Valley
Kent, Surrey, Sussex
North West London
Average for 12 months to March 2017 minus avg for 12 months to March 2016
Recent Changes in NHS Sickness Rates, by Region
Fig 5.31: NHS Sickness Absence Rates by Region - 12 months to March 2017
5.91. By staff group, rates are highest for nursing and Healthcare assistants (and other support) and ambulance staff, and lowest, in respect of this staff remit group, for nurse learners.
Fig 5.32: Recent changes in NHS Sickness Rates, by Region

State of the NHS labour market for non-medical staff
65
6.31%
5.50%
4.83%
4.16%
3.73%
3.50%
3.40%
1.25%
1.03%
0% 1% 2% 3% 4% 5% 6% 7%
HCAs & other support
Ambulance Staff
Nurses & Midwives
ALL STAFF GROUPS
Admin & Estates
Healthcare Scientists
S,T & T
Doctors
Nurse learners
NHS Sickness Absence Rates by Staff Group, Average for 12 months to March 2017
0.11%
0.06%
0.02%
0.02%
0.01%
0.01%
0.00%
-0.05%
-0.19%
-0.4% -0.2% 0.0% 0.2%
Healthcare Scientists
S,T & T
Admin & Estates
Doctors
ALL STAFF GROUPS
HCAs & other support
Nurses & Midwives
Nurse learners
Ambulance Staff
Recent Changes in NHS Sickness Rates, by Staff Group Average for 12 months to March 2017 minus average for 12 months to March 2016
Fig 5.33: Sickness Absence rates by staff group - 12 months to March 2017
5.92. There has been an increase to the most recent 12 months’ average from the corresponding average a year ago for healthcare scientists (0.11 percentage points) and smaller increases in 4 other groups. The 12 months’ average rates have decreased for ambulance staff, by 0.19 percentage points. The rate for ambulance staff, at 5.50% is 1.20 percentage points lower than at its peak in the 12 months to January 2015, when it was 6.69%.
Fig 5.34: Recent changes in NHS sickness rates by staff group
5.93. NHS Digital publishes NHS sickness absence statistics monthly, at the following link: http://content.digital.nhs.uk/searchcatalogue?topics=2%2fWorkforce%2fStaff+management%2fSickness+absence&sort=Relevance&size=10&page=1

The NHS Pay Review Body (NHSPRB) Review for 2018
66
6. AfC and contract reform
6.1. NHS trades unions agreed to Agenda for Change reform as part of the 2015/2016 pay settlement. The Government’s offer letter of 27 January 2015 accepted by trades unions said that:
6.2. “As part of the offer Government asks trades unions to commit to talks on further reforming Agenda for Change. The Government recognises that Agenda for Change pay system has successfully created a framework for equal pay in the NHS and a framework for rewarding staff fairly. However after nearly 10 years we believe the time is now right to
review the agreement to ensure it can continue to deliver flexibility, capacity, fairness and value.
6.3. The talks would support NHS organisations to maximise the contribution of NHS employed staff and reduce reliance on Agency staffing, strengthen the AfC agreement on progression and review more generally the need for wider reform of the pay scales with the aim of maximising value for patients and fairness for all staff including those in Bands 8 and 9.”
6.4. NHS Employers, in partnership with DH, are continuing exploratory talks with AfC trades unions. Government made clear at the Autumn budget on 22 November that it was prepared to make additional funding available in order to protect patient services if a pay deal can be reached. Our remit letter reiterates that commitment - government is prepared to make pay investment above one percent available if collective agreement can be reached.
6.5. Any negotiations will review affordable options for investing in contract reform and annual pay uplifts in a way which helps to improve productivity. You are aware that the government’s long standing pay policy is to remove automatic incremental pay from public sector pay systems. In the NHS, although the 2013 AfC national agreement gave employers locally the flexibility to develop their own criteria for linking incremental pay to performance, we understand that most employers continue to operate virtually automatic incremental pay systems. Incremental pay creates an inbuilt pressure of £600m every year on top of annual pay awards. Our ambition is to ensure that employers pay close attention to the support and development staff need in order to deliver the very best care patients and their families rightly expect.
6.6. It is too early to set out the detail of any reform proposals that may be explored and agreed with trades union colleagues. There is, however, consensus that the priority should be reforming the incremental pay system to remove overlapping points, shortening pay scales, and reforming the bottom pay bands in anticipation of the impact of the National Living Wage. The work will also consider the career journey (where the number of pay points are reduced) and how the performance and competence frameworks might be developed and or strengthened. Wider consideration may also need to be given to other terms and conditions to deliver a balanced package of reform as you have recommended or observed in your previous reports.

AfC and contract reform
67
6.7. If AfC trades unions agree to negotiations and we are able to reach agreement we will provide details of any proposals as part of the supplementary evidence process.
6.8. If agreement is not possible each party will submit supplementary evidence in the normal way.
6.9. We believe that contract reform is not an end in itself but when developed and implemented well is an important lever in helping the NHS to attract and keep the skilled and compassionate staff it needs.
National Living Wage
6.10. No NHS staff are currently paid below the NLW, which will not impact staff until 2019/2020 at the earliest, when it is forecast to add an extra 0.05 percent (£20m) to the pay bill and will affect around 75,000 full time equivalent (FTE) staff, around 93,000 headcount. The NLW will compress pay bands and generate knock on consequences for maintaining pay differentials between pay bands.
6.11. The estimated costs relate to minimum statutory compliance and will increase subject to any design proposals for maintaining appropriate pay differentials across the pay scale. By 2020/21 or 2021/22 the NLW could see Agenda for Change pay band1 (currently £15,404 - £15,671) and pay band 2 (currently £15,404 - £18,157) overlap with the bottom of Band 3 (£16,968 - £19,852).
6.12. It will be important to ensure pay differentials at the bottom of the pay structure are maintained as to do otherwise could mean that some staff are paid the same for doing jobs which are of different value. To avoid compression at the bottom of the pay
structure, the partners are considering how the pay bands should be re-structured
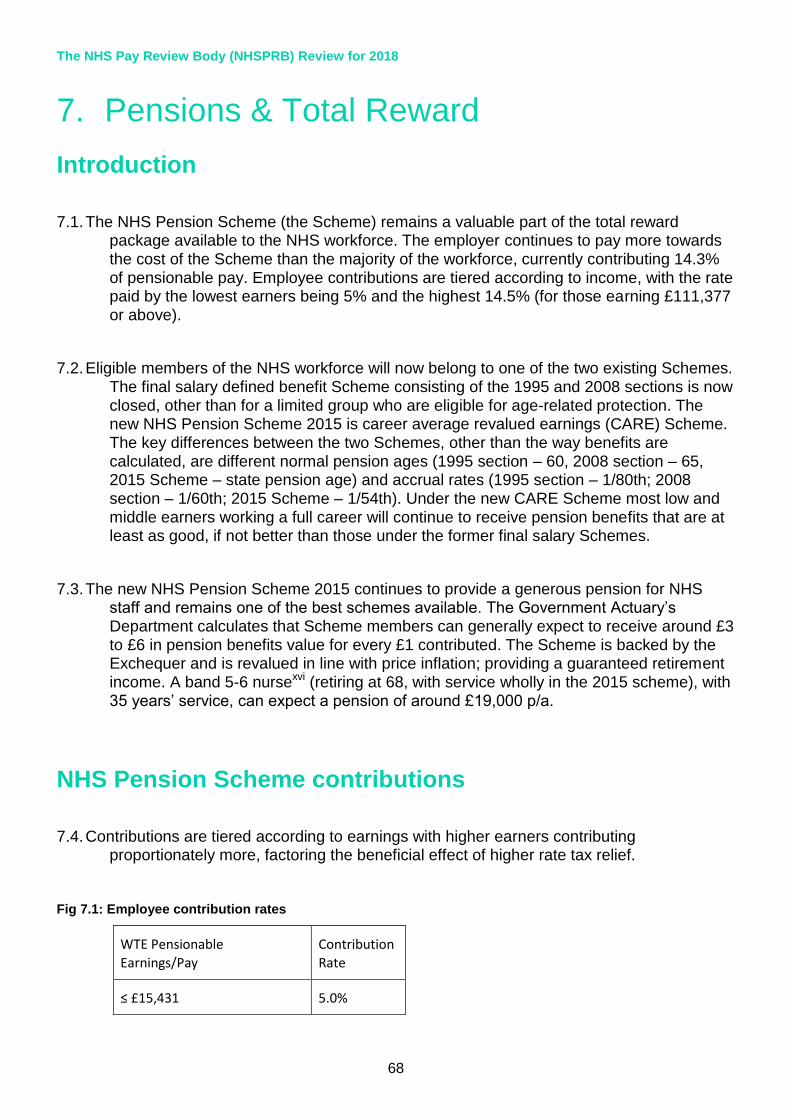
The NHS Pay Review Body (NHSPRB) Review for 2018
68
7. Pensions & Total Reward
Introduction
7.1. The NHS Pension Scheme (the Scheme) remains a valuable part of the total reward package available to the NHS workforce. The employer continues to pay more towards the cost of the Scheme than the majority of the workforce, currently contributing 14.3% of pensionable pay. Employee contributions are tiered according to income, with the rate paid by the lowest earners being 5% and the highest 14.5% (for those earning £111,377
or above).
7.2. Eligible members of the NHS workforce will now belong to one of the two existing Schemes. The final salary defined benefit Scheme consisting of the 1995 and 2008 sections is now closed, other than for a limited group who are eligible for age-related protection. The new NHS Pension Scheme 2015 is career average revalued earnings (CARE) Scheme. The key differences between the two Schemes, other than the way benefits are calculated, are different normal pension ages (1995 section – 60, 2008 section – 65, 2015 Scheme – state pension age) and accrual rates (1995 section – 1/80th; 2008 section – 1/60th; 2015 Scheme – 1/54th). Under the new CARE Scheme most low and middle earners working a full career will continue to receive pension benefits that are at least as good, if not better than those under the former final salary Schemes.
7.3. The new NHS Pension Scheme 2015 continues to provide a generous pension for NHS staff and remains one of the best schemes available. The Government Actuary’s Department calculates that Scheme members can generally expect to receive around £3 to £6 in pension benefits value for every £1 contributed. The Scheme is backed by the Exchequer and is revalued in line with price inflation; providing a guaranteed retirement income. A band 5-6 nursexvi (retiring at 68, with service wholly in the 2015 scheme), with 35 years’ service, can expect a pension of around £19,000 p/a.
NHS Pension Scheme contributions
7.4. Contributions are tiered according to earnings with higher earners contributing proportionately more, factoring the beneficial effect of higher rate tax relief.
Fig 7.1: Employee contribution rates
WTE Pensionable
Earnings/Pay
Contribution
Rate
≤ £15,431 5.0%

Pensions & Total Reward
69
£15,432 - £21,477 5.6%
£21,478 - £26,823 7.1%
£26,824 - £47,845 9.3%
£47,846 - £70,630 12.5%
£70,631 - £111,376 13.5%
≥ £111,377 14.5%
7.5. Employee contribution rates remained the same in 2016-17 as they were in 2015-2016, and have been set until 31 March 2019. It is expected that around 10% of members will see their contribution rate increase (by between 0.6% and 3.2% of pensionable pay, depending where they are in the pay range) at some point during the four years 2015-2019. A proportion of members are expected to progress to higher contribution tiers year to year through pay progression.
7.6. In their 2017 report, the NHS Pay Review Body noted that this approach had in some cases led to significant reductions in take home pay for individuals whose pay award meant that a higher contribution tier appliedxvii. A recommendation was made for the Health Departments to ensure that annual pay awards do not have unintended consequences in reducing the take-home pay of staff whose pay award causes them to cross pension contribution thresholds.
7.7. In a Written Ministerial Statementxviii to the House of Commons on 28 March 2017, the Secretary of State for Health confirmed that this recommendation will be considered as part of the four yearly valuation of the NHS Pension Scheme. This is a process that determines the appropriate level of employer and employee pension contributions from 1 April 2019.
7.8. The Department has asked the NHS Pension Scheme's Scheme Advisory Boardxix to review the approach to member contributions with a view to reaching agreement on new rates for implementation from 1 April 2019. A number of design aspects will be explored, including the range and number of tiers, whether the rate payable should be determined using whole-time equivalent or actual earnings, and providing for tier boundaries to increase in line with general pay uplifts
7.9. The introduction of the new State Pension from 6 April 2016 has led to an increase in National Insurance contributions payable by members of the NHS Pension Scheme and their employers. This is due to the withdrawal of the ‘contracting-out’ rebate. Contracting-out is where an individual contributed to an occupational pension scheme (e.g. the NHS pension scheme) instead of building up second state pension rights. A lower national insurance rate was paid as a result. The new state pension abolished the

The NHS Pay Review Body (NHSPRB) Review for 2018
70
second state pension (and therefore contracting-out) meaning that employers and employees pay 'full rate' National Insurance contributions from April 2016.
7.10. This additional cost relates to the accrual of new state pension rights, and not the NHS Pension Scheme. It is effectively an increase in the cost of employment and a small reduction in take home pay for individuals who were contracted-out:
3.4% increase in employer NI on individual’s earnings between £8,000 and £40,000; and
1.4% increase in employee NI for earnings between £8,000 and £40,000.
7.11. The increase in National Insurance contributions is however a one-off impact on take-home pay, the effect of which would have been felt in 2016-17.
NHS Pension Scheme membership levels
7.12. The Department has continued to monitor changes in scheme membership using data from ESR. Annex 1 presents membership rates by AfC band, as requested by the NHS Pay Review Body in their 2017 reportxx. It shows the position as of August 2017 and the percentage point change over the previous month, the last 12 months and from October 2011.
7.13. Scheme membership remains high across all staff groups, with typically around 9 in 10 participating. Between October 2011 and August 2017 the proportion of NHS staff who were members of the pension scheme increased by 4.2 percentage points. Membership rates continue to grow within lower paid bands. There was a reduction over the 12 months to August 2017 in participation by doctors, nurses, ambulance staff and managers, albeit by less than a percentage point. Participation by ambulance staff reduced by 1.6 percentage points over the same period. Overall scheme membership reduced by 0.4 percentage points in the 12 months to August 2017.
7.14. It is unclear from the participation rate data how far the one-off increase in National Insurance resulting from the abolition of contracting-out has led to significant numbers leaving the scheme. In the lowest earning bands, the participation rate has continued to climb over the last 12 months
7.15. Amongst the highest paid Agenda for Change bands, particularly management roles, the opt-out trend noted last year appears to have continued. For higher earners, the impact of changes in April 2016 to the Lifetime and Annual Allowance limits may reduce the attractiveness of continuing scheme membership.
7.16. From 6 April 2016, the lifetime allowance is £1m (reduced from £1.25m). It will increase annually by CPI. The annual allowance now tapers from the standard £40,000 down to

Pensions & Total Reward
71
£10,000 at a rate of £1 less allowance per £2 of relevant earnings above £150,000. HMRC calculates relevant earnings to include the value of pension growth over the year.
7.17. Placing these tax measures in context of the 1995 final salary section of the NHS Pension Scheme, individuals who use up the full £40,000 annual allowance would see their annual pension increase by around £2,500. Those who reach the £1m lifetime allowance limit will have built up a pension of around £44,000 a year plus a tax free lump sum of £132,000.
7.18. Where individuals have breached either the annual or lifetime allowance, but not both, it is likely to still be a sound financial decision to continue building up pension, but address the tax liability by using HMRC’s ‘scheme pays’ facility. Over the course of an average 25 year retirement, an individual can expect the benefit from receiving more pension to outstrip the tax cost of that extra pension.
Total Reward
7.19. The Department continues to consider total reward; the tangible and intangible benefits that an employer offers an employee, as central to the ability of NHS employers to recruit and retain staff. There is some evidence that more employers across the NHS are developing a strategic approach to reward which may be a response to: staff demand as access to and use of total reward statements continues to evolve; trusts recognising they may need to do more to recruit and retain staff in an increasingly competitive employment market; employers working to reduce staff sickness and other staff absences by ensuring they are offering the support staff need e.g. for physical and mental health and wellbeing; financial health and wellbeing; trusts recognising the need to promote their overall reward offer in an environment of continued pay restraint.
7.20. The Department’s ambitions for the NHS Reward strategy remains that employers should develop their capacity and capability to: utilise the NHS employment package to recruit, retain and motivate the staff they need to deliver excellent services to patients,
develop and implement local reward strategies that meet organisational objectives and workforce needs; improve staff understanding of their reward package and what options they may have to change aspects of it; strengthen staff experience of working for the NHS; contribute to improvements in workforce productivity and efficiencies in use of the NHS workforce pay bill; continue to be at the leading edge of innovation in public sector reward; improve NHS staff satisfaction with pay. For NHSPRB remit groups, satisfaction with pay has increased since 2015 for ambulance staff to 35% from 30%, Public Health/Health Improvement staff to 41% from 36%, remained the same for Allied Health Professionals at 43% and registered nurses and midwives at 42% but deteriorated for midwives from 39% to 36%, for nursing/healthcare assistants from 27% to 25% and for general managers from 60% to 58%. The Department commissions NHS Employers to provide advice, guidance and good practice to the NHS on developing a strategic approach to reward based on the Hay Model (next page).

The NHS Pay Review Body (NHSPRB) Review for 2018
72
7.21. NHS Employers will, therefore, provide updates on: their work to ensure the strategic context for total reward in the NHS remains “fit for purpose”, and aligned with their other work programmes; how their engagement with employers is improving NHS understanding of total reward and why they should be developing their own local reward strategies; their promotion of existing and new tools to support trusts in using strategic reward to deliver local workforce priorities; the continuing development of their total reward engagement network to gain and share intelligence about total reward in the NHS; their promotion of better uptake and understanding of Total Reward Statements.
7.22. The value of reward packages for this remit group is shown in the graph below and includes: basic pay, employers pension contributions, other pay e.g. unsocial hours, overtime, other allowances, higher cost area supplements (for London based staff), difference between NHS sick pay and statutory sick pay, difference between NHS paid holiday and statutory paid holiday, difference between NHS maternity leave and statutory maternity leave, difference between NHS redundancy pay and statutory
redundancy pay.
0
10000
20000
30000
40000
50000
60000
Average Nurse OutsideLondon
Average MidwifeOutside London
Average Nurse InnerLondon
Average Midwife InnerLondon
To
tal P
ackag
e V
alu
e
Comparison of Total Reward Package
Pensions & Total Reward
73
Comparative analysis with private sector occupations
7.23. The Department commissioned the Government Actuary’s Department (GAD) to analyse total rewards across various private sector occupations, based on Office for National Statistics (ONS)xxi data for salary and pension benefits and compared them against pay rewards for various NHS staff (based on previous GAD analysis) for 2012 and 2016. Total Rewards is Basic Salary plus Non Basic Pay, the latter including all other pay elements such as Overtime, Incentives/Other elements of pay, Employer Pension Contributions. The graph shows the split of basic and non-basic pay
for each of the occupations, at 2012 and 2016, and is based on: 2012 Basic / 2012 non-basic = 2012 pension/salary data (private sector occupations), 2011/12 Pay Bands (NHS); 2016 Basic / 2016 non-basic= 2016 pension/salary data (private sector occupations), 2015/16 Pay Bands (NHS).
7.24. Overall, each of the roles analysed in both the private sector and NHS experienced an increase in total pay rewards between 2012 and 2016, with Nurses Band 6 experiencing the greatest overall increase of 17%. However, Midwives had an increase of less than 1% between 2012 and 2016, with the main driver for the small increase being a fall of 3% in non-basic pay.
7.25. All roles analysed showed an increase in basic pay but a decrease in non-basic pay (aside from Band 6 nurses, who had an increase in non-basic pay). This may indicate less availability of overtime and other rewards across the occupations.
7.26. Non-basic pay makes up a much larger proportion of NHS total rewards across all roles relative to private sector occupations. One factor behind this may be higher employer pension contributions available to NHS staff, relative to those in the private sector.

The NHS Pay Review Body (NHSPRB) Review for 2018
74
NHS Trend analysis
7.27. GAD also carried out a trend analysis for different NHS staff, based on the previous total rewards analysis that have been carried out at 2011/12 by DH, 2015/16 and 2017/18 carried out by GAD.
7.28. Band 6 Nurses have seen a large increase (about 20%) in total rewards over the period from 2011/12 to 2017/18. This was largely driven by an increase to pay bands between 2011/12 and 2016/17, with the total reward remaining largely stable between 2016/17 and 2017/18. In contrast, midwives and band 5 nurses have had their total rewards remain largely stable overall, with an increase of about 2% for midwives and about 3% for Band 5 nurses between 2011/12 and 2017/18
Total Reward Statements
7.29. Total Reward Statements (TRS) provide NHS staff with a better understanding of the benefits they have or may have access to as an employee of the NHS. TRS provide personalised information about the value of staff employment packages, including remuneration details and benefits provided locally by your employer. For example, local reward offers by NHS organisations might include: recommend a friend scheme, affordable accommodation, childcare and carer support, counselling and support, various salary sacrifice schemes, discounts, education and learning support, financial wellbeing, physical and mental health and wellbeing etc. For members of the NHS Pension Scheme, TRS may also include an annual pension benefit statement.

Pensions & Total Reward
75
7.30. Since last year, the NHS Business Services Authority (BSA) which is responsible for TRS, have held Stakeholder Engagement Events across the country, tailored to cater for different types of employers with a workshop on TRS so employers understand the role they play in promoting TRS in their organisations and how they can access BSA promotional materials. The workshop also explains the difference between a TRS and an ABS and how BSA creates the TRS. These events continue. BSA has prepared supporting posters sharing with employers the number of TRS accessed nationally and by region and shared these at regional pension groups to promote uptake. BSA has completed introduction emails to over 1 million staff on the Electronic Staff Record aimed at promoting access to TRS in the run up to the TRS refresh.
7.31. The latest access total for this year’s TRS is 448,741 compared to 353,220 at the same time last year. Currently there are 2,307,974 TRS available. Refreshed ones were published in August.
7.32. TRS improvements continue including changes to the embedded links following the introduction of BSA’s new look website and an update to branding in line with the rest of the NHS. Work continues to put in place alternative arrangements for those who access their TRS via the Government Gateway which ends in 2018 and BSA is also planning to increase the number of TRS available.

The NHS Pay Review Body (NHSPRB) Review for 2018
76
8. Annex 1: NHS Pension Scheme membership rate and trends

Annex 1: NHS Pension Scheme membership rate and trends
77
Notes
Please be aware that these figures are based on data from the Electronic Staff Record (ESR) Data Warehouse. This is the HR and payroll system that covers all NHS employees other than those working in General Practice, two NHS Foundation Trusts that have chosen not to use the system, and organisations to which functions have been transferred, such as local authorities. ESR data is not centrally validated and its reliability is subject to local coding practice
The measure of pension membership rates is based on the proportion of records where the employer made a pension contribution.
The percentage rates are based on headcount data.

The NHS Pay Review Body (NHSPRB) Review for 2018
78
i https://www.gov.uk/government/publications/department-of-health-shared-delivery-plan-2015-to-2020/shared-delivery-
plan-2015-to-2020 ii https://www.england.nhs.uk/wp-content/uploads/2014/10/5yfv-web.pdf
iii https://www.england.nhs.uk/wp-content/uploads/2015/12/planning-guid-16-17-20-21.pdf
iv https://www.england.nhs.uk/publication/next-steps-on-the-nhs-five-year-forward-view/
v https://www.england.nhs.uk/ourwork/futurenhs/deliver-forward-view/
vi https://www.england.nhs.uk/2016/03/footprint-areas/
vii https://www.england.nhs.uk/stps/view-stps/
viii https://www.england.nhs.uk/stps/sustainability-and-transformation-partnerships-progress-dashboard-baseline-view/
ix https://www.hee.nhs.uk/our-work/planning-commissioning/workforce-strategy
x https://improvement.nhs.uk/resources/developing-people-improving-care/
xi https://improvement.nhs.uk/resources/culture/
xii https://www.socialpartnershipforum.org/4573
xiii http://www.nhsemployers.org/news/2017/07/apprenticeships-in-the-nhs-staff-council-guidance
xiv http://www.cqc.org.uk/keywords/well-led-0
xv https://www.england.nhs.uk/2015/09/improving-staff-health
xvi Nurse joins in band 5 at 24, works full time to age 31, takes 2 short career breaks then part time 50%, full time again from
age 47 onwards. Promoted to band 6 at age 33 xvii
https://www.gov.uk/government/publications/national-health-service-pay-review-body-30th-report-2017 xviii
http://www.parliament.uk/business/publications/written-questions-answers-statements/written-statement/Commons/2017-03-28/HCWS565/
xix The Scheme Advisory Board is a statutory board that advises the Secretary of State on the merits of making changes to the
scheme. It comprises representatives from NHS trade unions and employers. xx
p.161, https://www.gov.uk/government/publications/national-health-service-pay-review-body-30th-report-2017 xxi
ONS Salary data found here: https://www.ons.gov.uk/employmentandlabourmarket/peopleinwork/earningsandworkinghours/datasets/agegroupbyoccupation2digitsocashetable20
Pension data found here: https://www.ons.gov.uk/employmentandlabourmarket/peopleinwork/workplacepensions/datasets/annualsurveyofhoursandearningspensiontablesemployercontributionbandsbyoccupationandbypensiontypep11