The Nexus of Financial Inclusion and Financial...
45
Policy Research Working Paper 7722 e Nexus of Financial Inclusion and Financial Stability A Study of Trade-Offs and Synergies Martin Čihák Davide S. Mare Martin Melecky Europe and Central Asia Region Office of the Chief Economist & South Asia Region Office of the Chief Economist June 2016 WPS7722 Public Disclosure Authorized Public Disclosure Authorized Public Disclosure Authorized Public Disclosure Authorized
Transcript of The Nexus of Financial Inclusion and Financial...
Policy Research Working Paper 7722
The Nexus of Financial Inclusion and Financial Stability
A Study of Trade-Offs and Synergies
Martin ČihákDavide S. MareMartin Melecky
Europe and Central Asia RegionOffice of the Chief Economist &South Asia RegionOffice of the Chief EconomistJune 2016
WPS7722P
ublic
Dis
clos
ure
Aut
horiz
edP
ublic
Dis
clos
ure
Aut
horiz
edP
ublic
Dis
clos
ure
Aut
horiz
edP
ublic
Dis
clos
ure
Aut
horiz
ed
Produced by the Research Support Team
Abstract
The Policy Research Working Paper Series disseminates the findings of work in progress to encourage the exchange of ideas about development issues. An objective of the series is to get the findings out quickly, even if the presentations are less than fully polished. The papers carry the names of the authors and should be cited accordingly. The findings, interpretations, and conclusions expressed in this paper are entirely those of the authors. They do not necessarily represent the views of the International Bank for Reconstruction and Development/World Bank and its affiliated organizations, or those of the Executive Directors of the World Bank or the governments they represent.
Policy Research Working Paper 7722
This paper is a joint product of the Office of the Chief Economist, Europe and Central Asia Region and the Office of the Chief Economist, South Asia Region. It is part of a larger effort by the World Bank to provide open access to its research and make a contribution to development policy discussions around the world. Policy Research Working Papers are also posted on the Web at http://econ.worldbank.org. The authors may be contacted at [email protected].
Policy makers and regulators have devoted much effort to reforms aimed at improving financial stability in response to lessons from the 2007–09 crisis. At the same time, much effort has also been directed to promoting greater financial inclusion as an enabler of equal opportunity. To some extent, these endeavors have been exerted in silos, neglecting the possibility that financial inclusion and financial stability could be significantly intertwined, positively or negatively.
If there are synergies or trade-offs between inclusion and stability, policy decisions must be informed, and the policy setting, design, and implementation adjusted accordingly. This paper (i) discusses the relationship between financial inclusion and stability, (ii) illustrates empirically interac-tions between the two financial sector outcomes, and (iii) outlines policy challenges stemming from these interactions.
The Nexus of Financial Inclusion and Financial Stability:
A Study of Trade-Offs and Synergies
Martin Čihák
Davide S. Mare
Martin Melecky#
Keywords: Financial Inclusion; Financial Stability; Policy Tradeoffs and Synergies; Cross-country Data Analysis; Advanced, Emerging, and Developing Countries.
JEL Classification: G21, G22, G23, D14, O24
# Martin Čihák is Advisor and Unit Chief at the International Monetary Fund; Davide S. Mare is visiting researcher at the World Bank and Assistant Professor at the University of Edinburgh; Martin Melecky is Lead Economist at the World Bank. We are grateful to Thorsten Beck, Robert J. Cull, Ross Levine, David Gould, Maria Soledad Martinez Peria, Ugo Panizza, Ceyla Pazarbasioglu and Bill Shaw for helpful comments on the earlier drafts of the paper.
2
1 Introduction
Both financial inclusion and financial stability are high on international policy makers’ agenda. For instance, the G-20 has called for global commitments to both advancing financial inclusion (the Maya Declaration and the Global Partnership for Financial Inclusion) and enhancing financial stability (the Financial Stability Board, Basel III Implementation, and other regulatory reforms). One challenge is that there can be important policy trade-offs between the two objectives. For instance, a rapid increase in financial inclusion in credit can impair financial stability, because not everyone is creditworthy or can handle credit responsibly—as illustrated in the last decade by the subprime mortgage crisis in the United States and the Andhra Pradesh microfinance crisis in India. In addition, trade-offs between inclusion and stability could arise as an unintended consequence of bad or badly implemented polices. At the same time, advancing financial inclusion in the use of electronic payments, deposits, or insurance may not directly impair financial stability. Moreover, there may be important synergies between inclusion and stability. For example, a broader use of financial services could help financial institutions diversify risks and aid stability. Similarly, financial stability can enhance trust in financial systems and the use of financial services. It follows that understanding the synergies and trade-offs is paramount for policy makers who strive to advance financial inclusion and stability in tandem.
Ignoring interlinkages in advancing financial inclusion and stability could result in suboptimal outcomes, namely costly financial crises or continued financial exclusion. Central bankers and other policy makers are especially interested in the trade-offs and synergies in advancing financial inclusion and stability. Policy makers have increasingly taken on mandates, tasks, and public commitments on financial stability (Bank for International Settlements, 2011; Čihák et al, 2012). At the same time, countries increasingly prepare and implement financial inclusion strategies (Pearce and Ortega, 2012; World Bank 2014), and central bankers are often asked to lead these efforts. For these reasons, new evidence is needed on the nexus between financial inclusion and stability, and the trade-offs and synergies that could characterize it.
Does advancing financial inclusion always endanger financial stability? Does this relationship differ between inclusion of firms versus households, and across different measures of stability? How does the overall country context and policy framework affect the trade-off between financial inclusion and stability? We answer these questions by providing a conceptual framework for studying the nexus between the two policy objectives and estimating empirically the association between financial inclusion and stability. We select a range of empirical indicators that measure the two concepts of interest: financial stability and financial inclusion. We use correlations and other (non-parametric) tools to study the dependence between the measures of financial inclusion and stability. We find that on average, financial inclusion and financial stability are negatively correlated, and thus linked more through trade-offs than synergies. However, the distribution around this average correlation is dispersed and bimodal, and it has fat tails. These findings suggest that while trade-offs could dominate the inclusion-stability nexus, synergies could arise with almost equally high probability.
When disaggregating the inclusion-stability nexus by type of financial service, economic agent, and stability dimension, we find that financial inclusion could produce synergies and mitigate medium instability and expected losses of the financial sector—such as help reduce the ratio of NPLs to total loans, and the volatility of deposit growth and deposit rate. We also show that financial inclusion, in particular
3
extensive use of credit by individuals, can create tail risks, be more correlated with unexpected losses of the financial system (diminished capital and liquidity buffers), and ultimately be associated with banking crises. From the various country characteristics considered, the inclusion-stability nexus is most influenced by financial openness, fiscal freedom, education, and the depth of credit information systems. While financial openness introduces or increases trade-offs between inclusion and stability, fiscal freedom, education, and credit information depth help generate synergies between the two outcomes. Particularly if financial policy aims to advance the financial inclusion of individuals, complementary policies to deepen credit information systems could help mitigate the estimated trade-offs with financial stability.
The remainder of the paper proceeds as follows. Section 2 briefly summarizes the relevant literature. Section 3 defines the concepts and specifies the measures used in the analysis. Section 4 presents the conceptual framework and the analytical approach. Section 5 discusses the results and Section 6 concludes.
2 Literature Review
The literature on the nexus between financial inclusion and financial stability is relatively thin, and provides contradicting views on how these outcomes are related. One view sees financial inclusion as having limited importance for systemic risk, as greater inclusion entails numerous exposures of limited amounts that are fairly manageable with existing prudential tools (Hannig and Jansen, 2010). Nevertheless, financial inclusion may generate issues for central banks, as it affects the transmission of monetary policy and has an impact on financial stability (Mehrotra and Yetman, 2015). Another view is that greater financial inclusion through irresponsibly rapid credit growth poses risks for financial stability (Mehrotra and Yetman, 2015). The quick expansion of unregulated parts of the financial system might also impair the stability of regulated financial intermediaries. The benefits of participation in good times can turn into negative externalities in bad times (De la Torre et al., 2013).
There is also a view that financial inclusion can enhance stability directly (Hawkins, 2006; Han and Melecky, 2013) and indirectly (Claessens, 2006). Hawkins (2006) argues that promoting access to finance enhances financial stability both in the short and in the long run. For instance, to improve access and stability at the same time, the author suggests a tiered banking system where different types of banks perform a restricted number of services (e.g., deposit banks). Prasad (2010) posits that higher financial inclusion in savings enhances the financing of domestic investments by decreasing reliance on foreign financing, thus leading to greater stability. Han and Melecky (2013) find that a 10 percent increase in the use of deposits can reduce the withdrawal rate for deposits in stress times on average from 20 percent to about 15 percent. For credit, Adasme et al. (2006) and Morgan and Pontines (2014) argue that lending to small and medium-sized enterprises lowers nonperforming loans (NPLs) and the probability of default of credit institutions, as diversified loans to small and medium-sized enterprises pose less systemic risk than concentrated large loans. By the same token, Mehrotra and Yetman (2014) suggest the presence of an indirect positive effect, as access to better risk management tools indirectly boosts the resilience of financial institutions (i.e., more resilient borrowers imply more resilient banks). In line with this argument, Bachas et al. (2016) show that other important indirect channels may enhance financial stability. Specifically, the use of debit card prompts a mechanism to monitor bank account balances increasing both trust in financial institutions and overall savings.
4
Another line of argument is that excessive or increased emphasis on financial stability may prolong or increase involuntary financial exclusion. An inappropriate calibration of the regulatory framework for basic financial services according to their contribution to risks for the entire financial system can become a cause for exclusion. Financial institutions may limit access to financial services for low-income groups, especially in times of regulatory tightening, in an attempt to boost profits and cut off risky customer segments. This response can negatively affect households’ welfare because financial services ease consumption smoothing, expand investment opportunities, reduce poverty, and reduce income inequality (Claessens, 2006). Nevertheless, Dittus and Klein (2011) point to the need to design regulation of financial innovations in terms of the nature and risks of each different financial service/innovation. Excessive emphasis on financial stability can prolong involuntary financial exclusion by preventing innovation (BIS, 2015). Conversely, financial stability can enhance trust in the financial system, improving financial inclusion (Mehrotra and Yetman, 2014) and the likelihood that households save formally (Beckmann and Mare, 2016). Small denomination instruments allow households to hold diversified portfolios. The pooling of these resources facilitates financing projects on a bigger scale. Moreover, financial inclusion enables more effective adjustment in savings and investment decisions, thereby insulating households’ consumption from output volatility (Mehrotra and Yetman, 2014). Dabla-Norris et al. (2015) use a calibrated theoretical model to illustrate the importance of country-specific characteristics for assessing the implications of financial policies on access to credit, depth of credit markets and intermediation efficiency for GDP and inequality in developing countries.
In a recent contribution to this debate, Sahay et al (2015) use selected cross-country data, relying mostly on the IMF’s Financial Access Survey, to illustrate that financial stability risks increase when access to credit is expanded without proper supervision. Financial buffers tend to decline when access to credit expands; they decline faster in countries with weaker banking supervision. In contrast, countries with strong supervision could see some financial stability gains from higher inclusion. The paper points to large differences in the effectiveness of supervision across countries, signaling the potential risks to financial stability from an unchecked broadening of access to credit. Sahay et al. (2015) also suggest that increasing access to financial services other than credit does not affect financial stability adversely.
Our contribution to the existing literature is three-fold. First, we propose a framework where we identify concepts and measures for financial inclusion and financial stability. Second, we provide empirical evidence on the synergies and trade-offs between financial inclusion and financial stability at different levels of aggregation. Third, we condition the covariance between financial stability and financial inclusion on several country characteristics that are likely to affect the linear relationship between the two outcomes.
3 Concepts and Measures
We define financial inclusion as the use of a range of financial services by individuals and firms (consistent with definitions in Beck et al., 2007; Demirgüç-Kunt and Klapper, 2012; Allen et al., 2012; World Bank, 2014; BIS, 2015; Demirgüç-Kunt et al., 2015; and Sahay et al, 2015). We focus on the use of financial services (account ownership, payments, savings, credit, and insurance) rather than access to those services, because access by itself does not mean that individuals and firms will actually take up financial services, use them responsibly, and benefit from them. For example, individuals may not take up financial services because of their low financial literacy and capability (Cole, Sampson, and Zia, 2011), or because of their preference for informality due to poor quality of public services and general governance problems.
5
In the latter case, to change incentives for financial inclusion, reforms outside of the purview of financial policy must be implemented.
At the theoretical level, we thus distinguish between the lack of access (supply side constraint) and voluntary financial exclusion (demand side constraint). We focus on the market clearing outcome of financial inclusion—that is the use of financial services (account ownership, payments, savings, credit, and insurance). Using several distinct dimensions of the financial inclusion concept enables us to capture the possible different purposes for which each financial service is used, and separate the behavior of individuals from firms. Individuals can use financial services, for instance, to finance consumption, make payments, invest in education, and insure against the loss of income in old age (World Bank, 2014). Moreover, their use of financial services can affect an occupational choice between being an entrepreneur versus wage earner. Firms can use financial services, for instance, to finance the working capital, expand production, invest in facilities and equipment, and insure against business risks.
Financial stability is defined in a broad sense to capture (i) resilience of the financial system; (ii) volatility in key segments of financial intermediation; and (iii) negative, low probability events associated with financial crises. Given the dominant role of banks in most of the world’s financial systems, and given data availability, our measures focus on banks. Conceptually, however, we are aiming to approximate stability of the broader financial system. The first dimension, resilience, is important because it indicates the degree to which the system can withstand future shocks. The second dimension, volatility, is important because greater uncertainty, risk, and dispersion in outcomes are intrinsic to unstable financial development. Even relatively resilient financial systems can under-deliver due to spillover and contagion effects reflected in market volatility. Third, to properly account for low probability risks in our analysis, we explicitly cover financial crises, which are extreme events when the financial sector fails to perform its core functions. Figure 1 exemplifies these concepts of financial inclusion and financial stability, along with the measures used in this study.
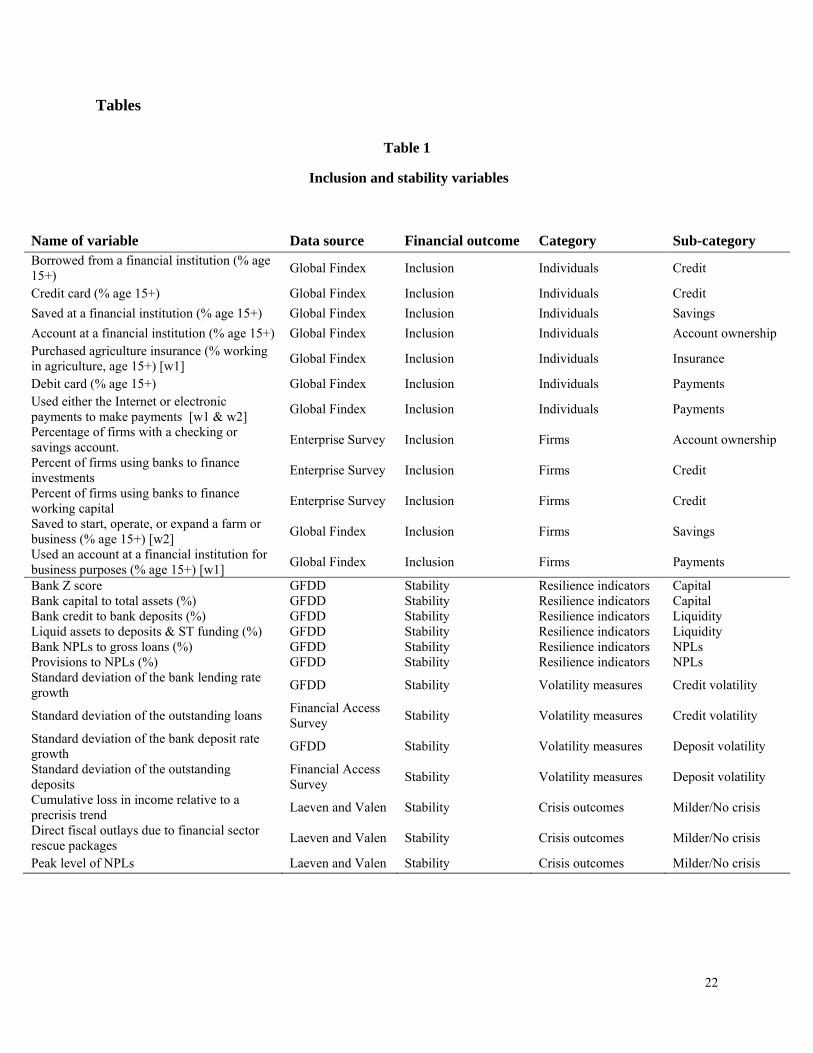
The complete list of variables used in the analysis, along with the description and data sources, appears in Table 1. The set of empirical indicators is described in the next two sub-sections.
3.1 Financial inclusion: Measures
We measure the use of financial services primarily with data from the Global Findex1 and Enterprise Surveys.2 We distinguish between individuals and firms,3 and classify our variables according to the type of financial services. We choose a parsimonious set of indicators that consistently measure our definition
1 http://www.worldbank.org/en/programs/globalfindex. The World Bank partners with the Bill & Melinda Gates Foundation and the Gallup World Poll to produce the data set. 2 http://www.enterprisesurveys.org/data. The World Bank partners with other institutions to conduct the survey in different parts of the World, such as the European Bank for Reconstruction and Development (EBRD), Inter-American Development Bank (IDB), COMPETE Caribbean, the European Investment Bank (EIB), and the UK's Department for International Development (DFID). 3 The distinction between firms and individuals can become blurry at the micro-enterprise level, but for practical purposes, we refer to firms when financial services are used for business purpose.
6
of financial inclusion. The variables are selected on the basis of past research4 and available country coverage.
For individuals, the provision of credit is measured using the indicators “has a credit card” and “borrowed in past 12 months from a financial institution” from the Global Findex. Both indicators capture formal borrowing. Savings are quantified using the variable “adults saving at a financial institution in the past year”. Account ownership is captured using the variable “account at a financial institution”. Insurance is measured with the variable “purchased agriculture insurance”. As a robustness measure for insurance, we also use data from the International Monetary Fund’s Financial Access Survey (FAS)5 and include “life insurance policy holders” and “non-life insurance policy holders”. Payments is accounted for by the indicator “has a debit card” and a combined measure computed using information on the two waves of Global Findex to compute an indicator for the usage of the Internet or other electronic means to make payments.
Financial inclusion of firms is measured using information from the Enterprise Survey and Global Findex. The use of credit is captured through “percent of firms with a checking or savings account” and “percent of firms using banks to finance investments”. Savings for business purposes are captured by the variable “saved in past 12 months: for farm/business purposes”. Account ownership is measured using the “percentage of firms with a checking or savings account”. Payments are quantified with the variable “used an account at a financial institution for business purposes”.
Figure 2 reports the distribution of the indicators employed in the analysis, arranged by country income-group. It also highlights the median, the minimum and the maximum of the distribution by income group.
The distributions of the financial inclusion indicators show that credit cards, account ownership, debit card, and electronic payments are used more in high income countries. For these indicators, the median value for high income countries is higher or very close to the maximum value for upper middle income countries and significantly higher than the remaining groups. Firm financing by banks appears to be the highest in some upper middle income countries, probably denoting a financial development pattern where capital markets complement banks for firm financing in the most financially developed countries (De la Torre et al., 2013). Data on agricultural insurance is available only for less developed countries.
3.2 Financial stability: Measures
To measure financial stability along the three dimensions discussed earlier—financial resilience, volatility and crisis outcomes—we retrieve data from the World Bank’s Global Financial Development Database (GFDD),6 the IMF’s FAS, and Laeven and Valencia (2013). We choose a parsimonious set of indicators that consistently measure our definition of financial stability. Our selection of the variables
4 See for instance Beck et al. (2008), Čihák et al. (2012), and the World Development Report 2014 (2013). 5 http://fas.imf.org/Default.aspx. 6 http://data.worldbank.org/data-catalog/global-financial-development.
7
reflects the findings of existing research and policy practice7 as well as an effort to achieve broad country coverage.
The first dimension, financial resilience, is measured using proxies for solvency of financial institutions, their liquidity positions, and exposure to credit risk. The first sub-category is quantified by using the capital ratio (percentage of capital in total assets) and the Z-Score. Both measures gauge the solvency of national banking systems. The capital ratio is a well-known measure that, as suggested for example by the Basel Committee on Banking Supervision (2010) is linked negatively to the probability of occurrence and the severity of distress. The Z-Score is a more comprehensive measure that combines information on leverage (equity to assets) with performance (return on assets) and risk (standard deviation of return on assets) to more fully approximate the likelihood of insolvency in the banking sector (Mare et al., 2015).8 Liquidity standards are also associated with the reduction in the probability of crises (Basel Committee on Banking Supervision, 2010). Therefore, in the second sub-category, we quantify the exposure to liquidity risk by examining the risks associated with a mismatch between assets and liabilities. Specifically, to capture the liquidity risk exposure, we use the ratio of credit provisioning to bank deposits and the ratio of the most liquid assets to short term funding (Bologna, 2015). The third sub-category of nonperforming loans (NPLs) accounts for two different aspects. The ratio of nonperforming loans to total loans is widely used as a (lagging) measure of credit risk exposure (Delis et al., 2014). The ratio of provisions to nonperforming loans gives an indication on adequate provisioning taking into account past performance and expected losses (Abedifar et al., 2013).
The second dimension, volatility, is quantified through the standard deviation in credit growth and deposits growth at the country level. We consider both price and volume growth. We first compute the year on year growth rate at the country level in bank lending rate, commercial banks outstanding loans, deposit interest rate and commercial banks outstanding deposits. We then compute the standard deviation of the growth rate at the country level. In this way we are able to quantify the uncertainty and risk deriving by both the variability in the cost and provisioning of credit, and the cost and volume of funding.
The third dimension captures the cost of crises, calculated using data from Laeven and Valencia (2013). We consider measures of banking crises including the output loss (the cumulative loss in income relative to pre-crisis trends), the costs of government intervention to mitigate and resolve the crises (direct fiscal outlays due to financial sector rescue packages), and the peak level of realized credit risk (the peak ratio of NPLs to total loans).
Figure 3 reports the distribution of the various indicators used to measure financial stability arranged by country income-group. It also highlights the median, the minimum and the maximum of the distribution by income group.
The distributions of the financial stability indicators show that the most advanced countries score relatively worse than the other countries in some indicators. For instance, the median value of high income countries appears the lowest for capital ratios and the highest for the variability in the deposit rate growth.
7 See for instance, Lowe (2002) for a discussion of macroeconomic consideration for risk measurement, Danielsson et al. (2015) for the link between volatility and financial crises, and Acharya et al. (2010) for the importance of measuring tail risks. 8 While the Z-score contains equity to assets, which is very similar to the capital ratio, the two indicators deliver statistically different information. They are uncorrelated based on the computed correlation matrix (Annex 2).
8
Moreover, there is a wide range of the distributions per level of income, meaning that within each group there is a stark difference between best and worst performers. Overall, the effects of the recent financial crisis are visible, especially for many advanced economies, in terms of lower resilience and high volatility in the banking sector fundamentals.
4 Conceptual Framework and Empirical Approach
This section proposes a framework illustrating the interactions between financial inclusion and financial stability. The framework aims to: (i) demonstrate the policy relevance of interactions between inclusion and stability, and (ii) motivate our empirical analysis of these interactions using cross-country data.
In the framework, we assume that financial stability and financial inclusion are both important outcomes for financial policy makers. 9 When considering and discussing expected financial sector outcomes, and when prioritizing design and implementation of alternative financial policies, policy makers could miss important aspects by ignoring the interactions between these two outcomes. To illustrate this point, it is useful to consider the following equation:
∙ , , (1)
where ∙ is expectation operator and ∙ captures the (linear) dependency between the two outcomes, financial inclusion and financial stability.10 To inform policy aim at developing financial systems that are jointly stable and inclusive (the right hand side of equation (1)), the empirical research typically focuses on achieving the expected outcomes of stable or inclusive financial systems separately. But limited attention has been paid to the covariance term.
This paper focuses on the covariance term, , and its practical relevance. Note that if financial inclusion and stability were independent outcomes, the covariance term would be zero. However, if the two outcomes are linearly co-dependent, the covariance will be significantly greater than zero in absolute value. It can be significantly negative when achieving the two outcomes involves a trade-off for policy makers—for instance, taking more systemic risk in the pursuit of increasing financial inclusion in credit. Conversely, it can be significantly positive when achieving the two outcomes leads to synergies—for instance, greater financial stability improves trust in the financial sector and increases the likelihood of using bank deposit accounts.
9 Note that the other important outcome for financial policy makers could be financial efficiency. The proposed framework can be readily extended to three outcomes. Here, we focus on inclusion and stability. 10 It is worth noting that we are not suggesting that greater inclusion is always necessarily better (or that stability is always better) from the policymaker’s viewpoint. To derive the optimal policy rules for these two variables, one would need to solve a policy model with: (i) a policy objective function, (ii) an equation describing the effect of a policy tool that affects financial stability, (iii) an equation describing the effect of another policy tool that drives inclusion, (iv) and equation (1) above that describes the interaction between the outcomes. Solving this system would provide the two optimal policy rules for the two policy tools.
9
We estimate the relationship between the concepts of financial inclusion and stability by using the best available cross-country data. For the inclusion measures, , we assume that they comprise of four orthogonal components: , the aggregate component ; , the component specific to economic agent (firms or individuals) ; , the component specific to the type of financial service (payments, savings, credit, insurance),,; and , the measurement error that comes with any empirical data.
, (2)
On aggregate, the component will prevail and capture the systematic variation across all financial inclusion indicators. When dissecting the empirical measures by type of economic agent, will prevail with the possibility that dominates. Recall that and are orthogonal so that disappears in aggregation across economic agents. Similarly, when dissecting the empirical measures by type of financial service, the components will prevail with the possibility that could dominate . In the latter case, the service-specific results (the covariance between inclusion in savings and stability) will be different from the aggregate results. In all cases, there is the possibility that the measurement errors (a white-noise process) associated with the empirical measures could be so large that they will prevent identification of any relationship whether it exists or not.
For the stability measures, , we assume that they comprise of three orthogonal components: , the aggregate component ; , the component specific to each dimension of financial stability considered, ; and , a white-noise measurement error.
, (3)
Again on aggregate, will dominate the data. But when dissecting the stability measures by the considered dimensions of financial stability (resilience, volatility, and crises), will prevail in the data with the possibility that dominates in which case the results by dimension of financial stability will be different from the aggregate results. The measurement error could be again so large that it will prevent drawing any inference on the underlying relationship be it zero or otherwise.
Using these component assumptions, we study the linear interdependence between stability and inclusion at different levels of aggregation, following equations (2) and (3), to gain deeper insights into the microstructure of the relationship between financial inclusion and stability. To avoid issues of possible endogeneity, we use a non-parametric approach, emphasizing that our estimates are indicative of an association, which does not necessarily imply causality between inclusion and stability.
The analysis is conducted at four levels. First, we compute the Spearman’s rank correlation between individual measures of inclusion organized by type of product/service and agent (individuals and firms), and stability dimensions. Using these results, we explore the distribution of the pairwise correlation coefficients for all considered measures of financial stability and inclusion, to broadly characterize the shape of their association. We examine the modes, central tendency, dispersion, as well as skewness of this distribution. Moreover, to gain a better understanding of this association by type of economic agent, we examine separately the distributions for the inclusion of individuals and firms.
Second, we examine how the correlations between inclusion and stability vary across types of economic agent (individuals and firms), financial services (account, e-payments, deposits, credit, and
10
insurance), and dimensions of financial stability (financial soundness indicator, ex-post volatility indicator, and crisis indicator), by averaging the correlation coefficients for the relevant pair. For instance, the use of credit could be positively correlated with financial crises, but the use of savings could be negatively correlated with financial volatility. In doing so, we are interested in determining whether promoting financial inclusion in certain financial services could be associated with higher volatility or more systemic risk (World Bank, 2014). Similarly, we are interested in observing whether greater stability could have negative associations with certain dimensions of financial inclusion, and which ones in particular. Moreover, we are interested in finding out whether financial inclusion in some services could help generate synergies with financial stability and vice versa (World Bank, 2014).
Third, we compute the correlation between aggregate indexes measuring financial inclusion and financial stability. Our baseline approach is to calculate each index using an equally-weighted average of all indicators (rescaled to lie between 0 and 1) included in a specific sub-category—for instance, the average of all the stability indicators for the overall stability index. Moreover, using the aggregate indexes, we calculate the average correlation for different levels of financial stability (by deciles). For robustness, we also examine two alternative approaches: a) standardizing each indicator before computing the indexes; and b) using the principal components and the factor weights associated with each individual variable included in a specific index.11
Fourth, given that individual country characteristics may be important for shaping the interaction between financial inclusion and stability, we condition the aggregate correlation12 between the overall stability index and inclusion index on individual country characteristics, including the conditions of different financial sector architectures (Allen et al., 2012). This can be expressed as follows:
; | , (4)
where X is a set of country characteristics that affect how inclusion and stability interplay with each other.13 We perform the conditioning one country characteristic at the time, separately for the conditional correlation between overall financial stability and respectively overall financial inclusion, financial inclusion for firms, and financial inclusion for individuals. This univariate conditioning is employed to maximize the number of available observations for our conditional estimations. Later, we also condition the correlation between inclusion and stability on a multivariate set of country characteristics. We select a parsimonious subset of the most pertinent country characteristics in the multivariate conditioning using forward-stepwise selection (Berk, 1978). For the multivariate conditioning, we fit the following regression (parametric) model. We use the cov(.) notation to refer back to Equation (1) in more general terms:
; ∑ , (5)
11 For the sake of space, we do not present the findings using the first principal component and the normalization using the standard deviation of each variable. The results are available from the authors upon request. 12 Recall that, from the literature review, we do not have any strong priors on how inclusion in individual financial services affects stability and vice versa. Estimating the covariance of aggregated inclusion and stability across different measures of inclusion and stability can help wash away arbitrary idiosyncrasies due to measurement errors in individual data series and be more representative of the underlying relationship between inclusion and stability at the country level. 13 See Annex 3 for a description of the conditioning variables.
11
where the subscript i denotes the country, w = 1, …, W is the number of conditioning variables that potentially affect the covariance between inclusion and stability. The covariance is approximated by the product of the deviations from the cross-sectional mean for inclusion and stability:
; , (6)
We construct three measures of covariance between financial stability and respectively overall financial inclusion, financial inclusion for firms, and financial inclusion for individuals.14 The next section discusses the results from applying the four pieces of analysis.
5 Results
We analyze the distribution of pairwise correlation coefficients for the measures of financial stability and inclusion to gain an understanding of the overall association between the two concepts. The discussion is grouped into four subsections. The first subsection analyzes the empirical distribution of the computed correlations overall and by the type of economic agent. The second reports the average correlations by economic agent, financial service, and dimension of financial stability. The third section shows the aggregate correlations between inclusion and stability using constructed indexes from measures of inclusion and, separately, stability for each country. The final subsection presents the results of the regression analyses to identify country characteristics that explain the variation of the aggregate correlations across countries.
5.1 Empirical distributions of correlations
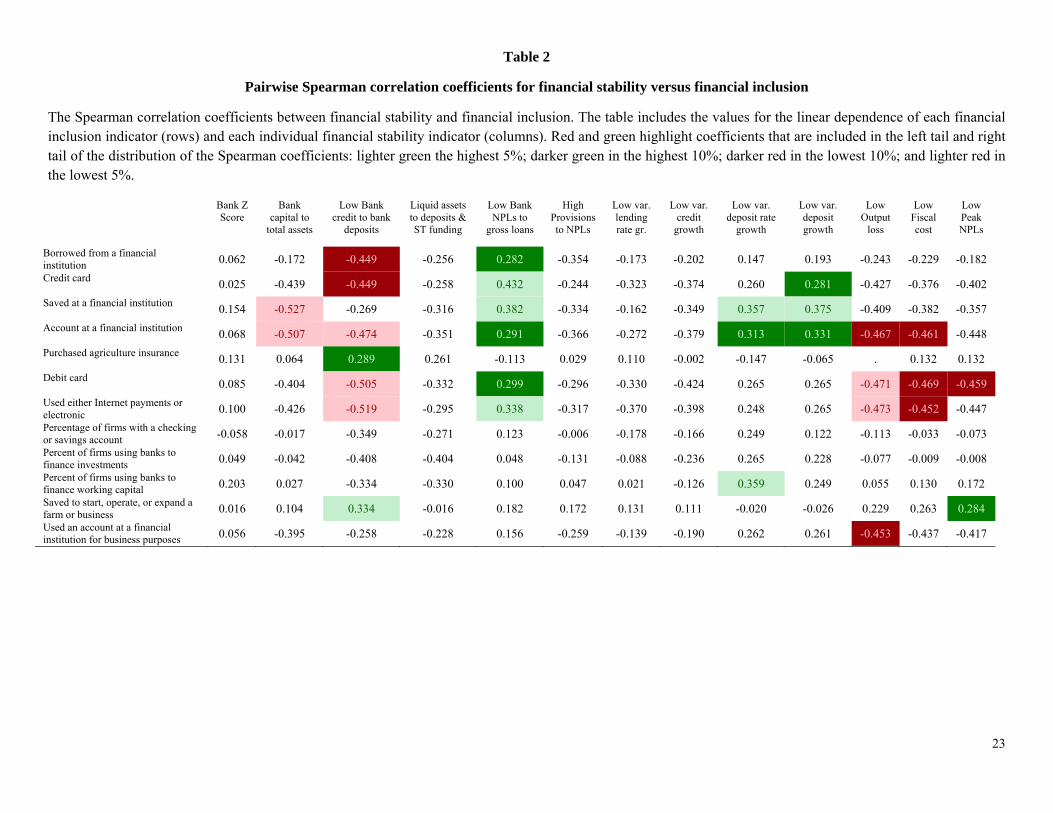
We compute the pairwise correlation between the measures of financial inclusion and financial stability. The variables measuring the two concepts are first transformed to ensure that an increase in a variable measures improvement in financial inclusion (or financial stability). A positive correlation coefficient thus denotes the presence of potential synergy between inclusion and stability, as improving (worsening) financial inclusion is associated with improving (worsening) financial stability. A negative correlation then indicates the presence of a trade-off, as the increase (decrease) in a variable measuring one concept is associated with a decrease (increase) in a variable measuring the other concept. Table 2 reports the results for the pairwise coefficients across the two financial outcomes.
Our results suggest that there is a negative association (trade-off) between some indicators of resilience and financial inclusion variables. Higher bank solvency ratios are negatively correlated with the use of financial services, particularly for individuals (Table 2). Moreover, there is a trade-off between several inclusion indicators and the costs of banking crises. Greater financial inclusion (increase in account ownership or debit card penetration) is associated with more costly financial crises (output and fiscal costs, as well as the peak NPL ratio). Nonetheless, financial systems more inclusive of individuals are generally associated with lower average NPLs. Looking at the histogram of the empirical correlations (Figure 4), we find a greater likelihood of negative association between inclusion and stability, including between banking
14 Note that there is no need to standardize the FI and FS indicators at this point, as they have been standardized during their construction.
12
crises and the various uses of credit).15 However, statistical tests suggest the presence of more than one mode in the distribution of pairwise correlations between inclusion and stability, which could indicate that both trade-offs and synergies are likely between inclusion and stability (Figure 4).16
An interesting question arises of whether this distribution could be different for the inclusion of firms compared with that of individuals. We thus investigate further whether there are systematic differences between the inclusion of firms and individuals in relation to financial stability. The results for firms (Figure 5) and individuals (Figure 6) differ somewhat. The distribution of correlation coefficients between financial inclusion and stability for firms indicates the possibility of trade-offs between inclusion and stability in extreme circumstances. However, extreme events are less likely (the tails of the distribution are shorter than for the whole sample).17 Overall, financial inclusion of firms appears to be less interlinked with stability than for individuals, so that policy makers could do no harm by implementing polices on the inclusion of firms independent from those on financial stability. By contrast, the distribution of correlation coefficients for individuals indicates that policy makers will be confronted with significant trade-offs and synergies (depending on type of financial services, economic agent, the degree of financial stability or inclusion, and country characteristics) when implementing policies on inclusion and stability. 18 Implementing these two sets of policies independently and ignoring interlinkages could result in suboptimal financial sector outcomes (future crises or continued financial exclusion) and unintended consequences. Note that financial inclusion for individuals can also complement stability. Therefore, appropriate policies, such as greater use of saving instruments (Han and Melecky, 2013), could yield progress in both inclusion and stability.
5.2 Average correlations by economic agent, financial service, and dimension of stability
The average correlations between financial inclusion and financial stability based on economic agent (firms and individuals), financial services (account, payments, savings, credit, and insurance) and dimension of financial stability (resilience, volatility, and crises) provide further information (Table 3).
Overall, high resilience and low volatility—the first two dimensions of financial stability—do not seem to be significantly associated with financial inclusion of individuals or firms for any financial service.
15 This calculation assumes that all the estimated pairwise correlations are drawn from the same distribution characterizing the association between financial inclusion and stability. The distribution ranges from -0.53 to 0.43, and it is not normal as suggested by a formal test (D’Agostino et al., 1990; Royston, 1991). Moreover, it is left-skewed and leptokurtic, meaning that we observe longer and fatter lower tails. 16 This conclusion is based on the shape of the estimated kernel density for the distribution. The null hypothesis of the formal test of unimodality cannot be rejected. 17 The support of the distribution is narrower than the one for the overall financial inclusion. The distribution is significantly left skewed, but we do not find a significant evidence of kurtosis, meaning that we observe a long lower tail that is not significantly different from the tail of the normal distribution. Statistical tests also indicate that the distribution of correlations for firms’ inclusion is characterized by only one mode. This finding is also reflected in the shape of the estimated kernel density for the distribution. 18 The support of the distribution is about as wide as the one of the correlations for the overall financial inclusion. The distribution is not significantly skewed but it is leptokurtic, meaning that we observe fatter tails (positive and negative) than in the normal distribution. The null hypothesis of the formal test for unimodality cannot be rejected at the 10% level. The kernel density indicates two visible modes of which the left one (the peaking negative values) has higher probability.
13
In contrast, milder crises or the absence of crises—the third dimension of financial stability—is significantly negatively correlated with payments of individuals and firms, as well as account ownership, savings and credit of individuals.19 However, as shown in Table 3, more stability (lower cost of crises) is significantly positively correlated with the inclusion of firms in savings. In contrast, increasing account ownership among individuals, use of electronic payments (including for internet purchases), and drawing on consumer credit are associated with greater probability, and higher cost of crises.
Disaggregating the resilience dimension of financial stability into bank capital, liquidity, and NPL ratios indeed reveals a number of significant correlations, both negative and positive, and suggests that there are more nuanced interlinkages between inclusion and the sub-dimensions of financial resilience. While capital and liquidity ratios show similar interlinkages to those estimated for crises overall, low NPL ratios show significant positive correlations with greater inclusion in account ownership, electronic payments and credit—more so for individuals than firms.
Disaggregating the volatility dimension of financial stability into the variability of lending rate, credit growth, deposit rate, and deposit growth also reveals rich interlinkages between financial inclusion and the sub-dimensions of financial volatility. The volatility of lending rate and credit growth both show significant negative correlation (trade-offs) with financial inclusion, in particular with account ownership, electronic payments, savings, and credit. We also find one negative association of life insurance with credit, which could reflect the link between required insurance of mortgages and the borrower’s repayment capacity in higher income countries.20 These estimated interlinkages are thus consistent with those for crises, capital and liquidity. However, they are very different from the interlinkages estimated for the volatility of deposit rate and deposit growth. With the latter, financial inclusion shows significantly positive association for accounts, payments, savings, and credit—again more so for individuals than firms, which could reflect differences in the quality of the measures of inclusion for individuals (Findex) and firms (Enterprise Surveys). For instance, our finding of a significant correlation (of about 0.4) between the volatility of deposit growth and the use of deposits by individuals is consistent with the finding of Han and Melecky (2013) that a 10 percent increase in the use of deposits can reduce deposit withdrawal rates in stress times by about 5 percentage points.
We do not detect any significant positive effect of insurance on volatility and financial stability at large. Although non-life insurance appears to be associated with decreasing volatility of credit, relatively noisy data and limited country coverage prevent us from drawing a clear inference.
Overall, the results suggest that in normal times, financial inclusion aids financial stability, especially by decreasing through-the-cycle expected losses and costs of business for banks (recall the results for NPLs), and by lowering the volatility of deposit growth and deposit rates. However, for the volatility of credit, capital, and liquidity buffers, as well as for outright crises, financial inclusion could endanger financial stability because of its potentially negative implications for unexpected losses.
19 Note that account ownership and credit are related, as getting credit from an institution often requires the prospective borrower to open an account with the prospective lender. Use of electronic payments with such account then follows. Indeed, account ownership, the use of debit cards, and the use of Internet or electronic payments are highly positively correlated (Annex 1). 20 Note that the insurance sample is much smaller than for other services, and mainly includes higher income countries reporting to the IMF’s Financial Access Survey.
14
5.3 Aggregate correlations based on indexes summarizing measures of inclusion or stability
The overall rank correlation between summary indexes of inclusion and stability, including both firms and individuals, is -0.455 (which is significantly different from zero), suggesting that the macroeconomic interlinkages between inclusion and stability could create trade-offs for policy making (Table 4). These trade-offs are significant and must be duly considered in policy prioritization, design, and implementation. Interestingly, the correlation between inclusion of individuals and financial stability is of greater magnitude (-0.501) than the correlation for both firms and individuals, as also indicated by the results for the distribution of the pairwise correlations. Conversely, the correlation between the inclusion of firms and stability is not significantly different from zero. These results do not appear to vary significantly at different levels of financial stability. Overall, this analysis suggests that it may be safe to ignore linkages between inclusion and stability when designing and implementing policies on the inclusion of firms. But policy makers have to be vigilant when prioritizing and designing policies for the inclusion of individuals.
We further dissect the aggregate correlation and the correlations for firms and individuals by inspecting the values of the inclusion index along different deciles of financial stability. We aim to see whether the relationship is monotonous and can be summarized by the mean correlation. We compute the quantile conditional mean of financial inclusion for each decile of the distribution of the financial stability index. The results of this analysis are shown in Figure 7 which reports the quantile conditional mean indexes for overall inclusion (Panel A), individuals (Panel B) and firms (Panel C).
The conditional mean values of overall inclusion per decile of stability suggest a fairly monotonous (linear) negative relationship, where increases in overall stability are associated with decreases in overall inclusion—confirming the earlier finding of a potential trade-off between inclusion and stability at all levels. As revealed by Figures 7 - Panel B and C, the negative monotonous relationship derives from the inclusion of individuals. The latter relationship shows a stronger negative slope than the slope for the overall inclusion index. In contrast, the mean value of inclusion of firms per decile of the stability index is fairly flat, suggesting no significant correlation across the entire range of the stability deciles.21
5.4 Correlations conditional on country characteristics
To examine in more depth what shapes the inclusion-stability nexus at the macro level, we compute the correlations between financial inclusion and financial stability conditional on country characteristics. First, we calculate the correlations conditional on one country characteristic at a time, to maximize the number of available observations. We divide the sample into two groups according to the median value of a given country characteristic, and then compare the difference between the computed correlations using an appropriate statistical test. Second, we use regression analysis to gain complementary inference while conditioning on all relevant country characteristics at the same time. Table 5 reports the results for the univariate conditioning.
21 If anything, the chart suggests a hump-shaped relationship indicating that an optimal level of financial stability could exist to maximize inclusion for firms. The hump-shaped relationship is more visible for the aggregate indexes constructed using alternative methods, in particular using the weights of inverse standard deviation.
15
We discuss the statistically significant results only for the conditional correlations between overall financial stability and overall financial inclusion (Table 5 under the heading Overall). Countries with higher informality, as measured by the number of years firms operated without formal registration (results for other indicators of informality are not significant), experience a lower trade-off between financial inclusion and stability. A plausible explanation is that previously informal firms that enter the formal sector are relatively greater risk-takers, because informal credit is more expensive and required them to take more risk. 22 Because risk appetites are unlikely to change fast, rapid increases in credit to previously informal firms that enter the formal sector should be monitored for potential threats to financial stability. High financial openness and unobstructed inflow of capital could impose a higher trade-off between inclusion and stability. To manage this trade-off, financial account liberalization may need to be accompanied by adequate prudential supervision to ensure that only responsible financial inclusion takes place.
Limited restrictions on investment appear to increase the trade-off between inclusion and stability, perhaps because such policies allow for greater risk-taking. In contrast, low marginal tax rates and tax burden23 may mitigate potential trade-offs by lowering the magnitude of the negative correlation between inclusion and stability. Low taxes and smaller social safety nets may stimulate greater precautionary savings by individual and firms that could decrease financial volatility. Also, increases in the strength of the governance structure could significantly reduce the overall negative correlation between inclusion and stability and mitigate the trade-off for policy makers.
When disaggregating financial inclusion to that of firms and that of individuals we can observe some results that are specific to each economic agent. Inclusion of firms can generate smaller trade-offs or even synergies with financial stability in deeper financial system (greater credit to GDP ratio), in countries with higher education attainment, lower percentage of working age population, and greater adoption of mobile phone technology. Highly significant is also the association of stronger public governance with smaller trade-offs and possibly higher synergies between the inclusion of firms and financial stability. Also the inclusion of individuals correlates more positively with stability in countries that show sustained financial deepening (higher through-the-cycle growth of credit), higher education attainment (secondary enrollment rates), and greater informality—similar to the aggregate results. In contrast to the aggregate results and the results for firms, greater share of domestic private ownership in firms significantly mitigates the trade-off between inclusion and stability. However, greater foreign ownership amplifies the trade-off between the inclusion of individuals and stability. In addition to financial openness, fiscal freedom and investment freedom that proved important also on aggregate, financial sector liberalization (financial freedom) increases the trade-off between the inclusion of individuals and stability.
The multivariate conditioning on country characteristics (reported in Table 6) provides results that are broadly consistent with the univariate conditioning but the estimation sample is more representative of developing countries.24 Financial openness can introduce or increase the trade-off between advancing
22 To support our conjecture, Annex 5 provides estimates of the difference between the risk-taking appetite between self-employed in the formal and informal sectors using the Life in Transition Survey II for countries with available data. We thank Hernan Winkler for providing us with the estimates. 23 This is the ‘fiscal freedom’ indicator in the Heritage Foundation’s Index of Economic Freedom. 24 Note that this exercise is done on a much smaller sample than the univariate conditioning. We see it as delivering complementary inference on the country characteristics influencing the covariance between inclusion and stability, rather than a superior source of inference. To partially address the influence of the different sample sizes, we run two regressions constraining the sample size to 99 observations (Table 6, Column 1, 3 and 5) and 144 observations (Table
16
financial inclusion and fostering financial stability. In contrast, low tax rates are estimated to have a significant positive effect on the covariance between inclusion and stability—that is, generate or increase synergies between the two outcomes. Greater formalization of the economy—increase in the percentage of firms that formally registered when they started operations in the country—is estimated to introduce or significantly increase the trade-off (this variable is more significant than in the univariate conditioning exercise). Education—enrollment rates in secondary education—is estimated to generate synergies between financial inclusion and stability (although this effect was insignificant in the univariate conditioning). Perhaps the transmission from education could work through improved financial literacy that ensures responsible financial inclusion, with positive implications for financial stability (Klapper, Lusardi, and Panos 2013).
The results are somewhat different when the maximum number of countries are included (Table 6, Column 2), which includes many high-income countries that were excluded in the first exercise immediately above. Here financial openness is insignificant, probably because more high income countries with greater capacity to manage capital flows are included. Low tax rates retain their positive effect, at the 5 percent significance level (a stronger result than the 10 percent level in Column 1). Population density is estimated to have a significant, positive effect on the covariance, and can thus introduce or increase synergies between inclusion and stability (at the 10 percent level)—even though population density was not significant in our univariate conditioning. More densely populated countries may benefit from more intensive social networks that ease screening and monitoring of financial customers, as well as ease the emergence of self-monitoring groups—for instance, credit cooperatives and private guarantee schemes. Other things equal, finance could thus be more responsible in densely populated countries and generate synergies with financial stability by increasing the scale of the market and diversifying exposures of banks. Finally, the depth of the credit information index (the coverage and richness of credit reporting systems) is significant in generating or enhancing synergies between inclusion and stability at the 5 percent level.
The covariance between stability and financial inclusion of firms (Table 6, Column 3 and 4) is significantly influenced by financial openness and education in the smaller sample (column 3) consistently with the aggregate results and the results for the inclusion of individuals. In the larger sample, all country characteristics appear insignificant. This finding is not surprising given that the evidence we obtained from the empirical distributions and the aggregate correlations. Recall that the distribution of the covariances (correlations) between the indicators of stability and of the inclusion of firms is centered at zero and has a normal shape. One interpretation of this could be that the inclusion of firms and stability are uncorrelated and that the normal distribution is due to the white noise disturbances that cannot be explained by country characteristics. This is what we find in our multivariate regression when using the maximum number of countries. Perhaps when even better data on firm inclusion than those from the Enterprise Survey are gathered consistently across countries we will be able to probe the finding in more detail through further research.
The country characteristics explaining the covariance between stability and financial inclusion of individuals (Table 6, Column 5 and 6) show several similarities with the aggregate results but also some differences. As for the aggregate results, the covariance of stability with inclusion of firms is significantly influenced by financial openness fiscal freedom, population density, education, and the depth of credit
6, column 2, 4 and 6, which drops indicators for which coverage is insufficient). It was mostly high-income countries that dropped out in the smaller sample (Annex 4).
17
information systems. In addition, greater trade-offs between the inclusion of individuals and stability are associated with greater investment freedom—including less regulated domestic and foreign capital flows and labor markets—and deeper financial systems as measured by credit to GDP. It appears that the trade-offs in the country context of greater financial openness, investment freedom, and financial depth, can be mitigated or even reversed when financial policy to advance financial inclusion of individuals is accompanied by deepening of credit information systems. While fiscal freedom and population density have to be treated exogenous to financial policy, coordination with fiscal and urbanization policies could help as well.
6 Conclusion
Understanding the interrelationship between financial inclusion and stability is paramount for policy makers. This paper confirms that there is indeed much to gain from coordinated policies that take into account synergies and trade-offs between financial inclusion and financial stability. On average, there appears to be a trade-off between financial inclusion and stability that should be considered by policy makers. However, both trade-offs and synergies are found in cross-country experience depending on the indicator of stability and inclusion one is examining. This implies that while trade-offs can dominate the relationship between inclusion and stability, synergies can occur with almost equally high probability. Excluding periods of crisis, we find that greater financial inclusion is associated with greater stability and may mitigate expected losses of the financial sector. But greater financial inclusion, particularly associated with extensive borrowing by individuals, may also increase the risk of extreme events, unexpected losses of the financial system, and ultimately more frequent banking crises.
The relationship between inclusion and stability is systematically influenced by country characteristics, such as financial openness, tax rates, education, and the depth of credit information systems. While financial openness increases trade-offs between inclusion and stability, low tax rates, education, and credit information depth help generate synergies between the two goals. Greater financial openness and movement of capital is particularly challenging in middle and low income countries that tend to have a limited capacity to manage capital flows and ensure prudent and efficient allocation of the funding to creditworthy firms and individuals. Low tax rates may generate synergies by stimulating precautionary savings due to smaller social safety nets and greater probability of unexpected increases in taxes. Education can generate a positive relationship between inclusion and stability by improving financial literary and responsible financial inclusion that helps the financial system reap the benefits of economic scale and risk diversification. The depth of credit information systems generates synergies by improving screening of creditworthy customers, including new users of credit, and aids stability by, for example, improving the accuracy of estimations of expected losses. Finally, greater information depth also promotes competition in oligopolistic markets, decreases the cost of finance, and encourages more firms and people to start using a financial service or use more than one financial service. Particularly if financial policy focuses on advancing the financial inclusion of individuals, complementary policies to deepen credit information systems could help mitigate the estimated trade-offs with financial stability.
Our findings have important policy implications. Because trade-offs and synergies between financial inclusion and financial stability are significant, they need to be addressed in policy making. Because
18
covering policy on both financial inclusion and financial stability involves multiple government agencies (in many countries the central bank and other financial supervisors) and ministries (in many countries the ministry of finance, economic development, or strategic planning), the trade-offs and synergies must be addressed at a high enough policy-making level. One important tool to formulate high-level policy for the financial sector is the financial sector strategy (Maimbo and Melecky, 2015; Melecky and Podpiera, 2016). So far financial sector strategies around the world tend to pay little attention to trade-offs, but some good examples exist, such as Malaysia and Switzerland (Bank Negara Malaysia, 2001; Swiss Federal Council, 2009). The findings in our paper can thus be interpreted as a call for greater use of financial sector strategies to explicitly mitigate trade-offs and promote synergies between financial inclusion and financial stability.
19
References
Abedifar, P., Molyneux, P., & Tarazi, A. (2013). Risk in Islamic banking. Review of Finance, 17(6), 2035–2096.
Acharya, V. V., Pedersen, L. H., Philippon, T., & Richardson, M. P. (2010). Measuring systemic risk. Working Paper.
Adasme, O., Majnoni, G. & Uribe, M. (2006). Access and risk: friends or foes? Lessons from Chile. World Bank Policy Research Working Paper, 4003. The World Bank, Washington DC, USA.
Allen, F., Demirgüç-Kunt, A., Klapper, L. F., & Martinez Peria, M. S. (2012). The foundations of financial inclusion: Understanding ownership and use of formal accounts. World Bank Policy Research Working Paper, 6290, The World Bank, Washington DC, USA.
Bachas, P., Gertler, P., Higgins, S., & Seira, E. (2016). Banking on trust: how debit cards help the poor to save more. Working Paper.
Bank for International Settlements (2011). Central bank governance and financial stability. A report by a Study Group (Chair: Stefan Ingves, Governor, Sveriges Riksbank), May, Bank for International Settlements, Basel, Switzerland.
Bank Negara Malaysia (2001). Financial Sector Masterplan 2001-2010. Kuala Lumpur, Malaysia
Basel Committee on Banking Supervision (2010). An assessment of the long-term economic impact of stronger capital and liquidity requirements. Bank for International Settlements, Basel, Switzerland.
Basel Committee on Banking Supervision (2015). Range of practice in the regulation and supervision of institutions relevant to financial inclusion. Bank for International Settlements, Basel, Switzerland.
Beck, T., Degryse, H., De Haas, R., & Van Horen, N. (2014). When arm's length is too far. Relationship banking over the business cycle. Discussion Paper 2014-042, Tilburg University, Center for Economic Research.
Beck, T., Demirgüç-Kunt, A., & Peria, M. S. M. (2007). Reaching out: Access to and use of banking services across countries. Journal of Financial Economics, 85(1), 234–266.
Beck, T., Feyen, E., Ize, A., & Moizeszowicz, F. (2008). Benchmarking financial development. World Bank Policy Research Working Paper Series, 4638. The World Bank, Washington DC, USA.
Beckmann, E., Mare, D.S. (2016). Household savings and trust in the financial system. Working Paper.
Berk, K. N. (1978). Comparing subset regression procedures. Technometrics, 20(1), 1–6.
Bologna, P. (2015). Structural Funding and Bank Failures. Journal of Financial Services Research, 47(1), 81–113.
Čihák, M., Muñoz, S., Sharifuddin, S., and Tintchev, K. (2012), Financial Stability Reports: What Are They Good For? IMF Working Paper 12/1, Washington, DC, USA.
20
Čihák, M., Demirgüç-Kunt, A., Feyen, E. and Levine, R. (2012). Benchmarking financial systems around the world. World Bank Policy Research Working Paper, 6175. The World Bank, Washington DC, USA.
Claessens, S. (2006). Access to financial services: A review of the issues and public policy objectives. The World Bank Research Observer, 21(2), 207–240. The World Bank, Washington DC, USA.
Cole, S., T. Sampson, and B. Zia. 2011. “Prices or Knowledge? What Drives Demand for Financial Services in Emerging Markets?” Journal of Finance, 66(6), 1933–67.
Dabla-Norris, E., Ji, Y., Townsend, R. M., & Unsal, D. F. (2015). Distinguishing Constraints on Financial Inclusion and Their Impact on GDP, TFP, and Inequality. NBER Working Paper, 20821. National Bureau of Economic Research, Cambridge, USA.
Danielsson, J., Valenzuela, M., & Zer, I. (2015). Learning from History: Volatility and Financial Crises. Working Paper.
D’Agostino, R. B., A. J. Belanger, and R. B. D’Agostino, Jr. 1990. A suggestion for using powerful and informative tests of normality. American Statistician 44: 316–321.
De la Torre, A., Feyen, E., & Ize, A. (2013). Financial development: structure and dynamics. The World Bank Economic Review, 27(3), 514–541. The World Bank, Washington DC, USA.
Delis, M. D., Hasan, I., & Tsionas, E. G. (2014). The risk of financial intermediaries. Journal of Banking & Finance, 44, 1-12.
Demirgüç-Kunt, A., Beck, T. & Honohan P., (2008). Finance for All? Policies and Pitfalls in Expanding Access. World Bank Policy Research Report. The World Bank, Washington DC, USA.
Demirgüç-Kunt, A., & Klapper, L. (2012). Measuring Financial Inclusion. The Global Findex Database. World Bank Policy Research Working Paper, 6025, The World Bank, Washington DC, USA.
Demirgüç-Kunt, A., Klapper, L., Singer, D., & Van Oudheusden, P. (2015). The Global Findex Database 2014. Measuring financial inclusion around the World. World Bank Policy Research Working Paper, 7255. The World Bank, Washington DC, USA.
Dittus, P. & Klein, M. (2011). On harnessing the potential of financial inclusion. The case of “mobile payments”. BIS Working Papers, 347. Bank for International Settlements, Basel, Switzerland.
Han, R., & Melecky, M. (2013). Financial Inclusion for Stability: Access to Bank Deposits and the Deposit Growth during the Global Financial Crisis. Policy Research Working Paper, 6577. Washington: World Bank
Hannig, A., & Jansen, S. (2010). Financial inclusion and financial stability: current policy issues. ADBI Working Paper, 259. Asian Development Bank Institute, Tokyo, Japan.
Hawkins, P. (2006). Financial access and financial stability. in Central banks and the challenge of development, 65–79. Bank for International Settlements, Basel, Switzerland.
21
Klapper, L., Lusardi, A., & Panos, G. A. (2013). Financial literacy and its consequences: Evidence from Russia during the financial crisis. Journal of Banking & Finance, 37(10), 3904–3923.
Laeven, L., & Valencia, F. (2013). Systemic banking crises database. IMF Economic Review, 61(2), 225–270. International Monetary Fund, Washington, DC.
Lowe, P. (2002). Credit risk measurement and procyclicality. BIS Working Papers, 116. Bank for International Settlements, Basel, Switzerland.
Mare, D. S., Moreira, F., & Rossi, R. (2015). Nonstationary Z-score measures. Working Paper.
Mehrotra A. N. & Yetman J. (2014). Financial inclusion and optimal monetary policy. BIS Working Papers, 476. Bank for International Settlements, Basel, Switzerland.
Mehrotra A. N. & Yetman J. (2015). Financial Inclusion: Issues for Central Banks. BIS Quarterly Review, March 2015, pp 83–96. Bank for International Settlements, Basel, Switzerland.
Melecky, M. & Popdiera, A. (2016). Financial Sector Strategies and Financial Sector Outcomes: Do the Strategies Perform?. Working Paper
Morgan, P.J., & Pontines, V. (2014). Financial stability and financial inclusion. ADBI Working Paper, 488. Asian Development Bank Institute, Tokyo, Japan.
Pearce, D., Ortega, C.R. (2012). Financial inclusion strategies: reference framework. Working Paper No. 78761, The World bank, Washington DC, USA.
Popov, A., & Udell, G. F. (2012). Cross-border banking, credit access, and the financial crisis. Journal of International Economics, 87(1), 147-161.
Prasad, E.S. (2010). Financial sector regulation and reforms in emerging markets: an overview. IZA Discussion Paper, 5233. Institute for the Study of Labor, Bonn, Germany.
Royston, P. (1991). Comment on sg3.4 and an improved D’Agostino test. Stata Technical Bulletin 3: 23–24. Reprinted in Stata Technical Bulletin Reprints, vol. 1, pp. 110–112. College Station, TX: Stata Press
Sahay, R., Čihák, M., N’Diaye, P., Barajas, A., Mitra, S., Kyobe, A., Mooi, Y. & Yousefi, S. R. (2015). Financial inclusion: can it meet multiple macroeconomic goals? IMF Staff Discussion Note, 15/17. International Monetary Fund, Washington, DC.
Swiss Federal Council (2009). Strategic directions for Switzerland’s financial market policy. Report in response to the Graber postulate. Bern, Switzerland.
The World Bank (2013). World development report 2014: Risk and opportunity. Managing risk for development. The World Bank, Washington DC, USA.
The World Bank (2014). Global Financial Development report 2014: Financial Inclusion. The World Bank, Washington DC, USA.
22
Tables
Table 1
Inclusion and stability variables
Name of variable Data source Financial outcome Category Sub-category Borrowed from a financial institution (% age 15+)
Global Findex Inclusion Individuals Credit
Credit card (% age 15+) Global Findex Inclusion Individuals Credit
Saved at a financial institution (% age 15+) Global Findex Inclusion Individuals Savings
Account at a financial institution (% age 15+) Global Findex Inclusion Individuals Account ownership Purchased agriculture insurance (% working in agriculture, age 15+) [w1]
Global Findex Inclusion Individuals Insurance
Debit card (% age 15+) Global Findex Inclusion Individuals Payments Used either the Internet or electronic payments to make payments [w1 & w2]
Global Findex Inclusion Individuals Payments
Percentage of firms with a checking or savings account.
Enterprise Survey Inclusion Firms Account ownership
Percent of firms using banks to finance investments
Enterprise Survey Inclusion Firms Credit
Percent of firms using banks to finance working capital
Enterprise Survey Inclusion Firms Credit
Saved to start, operate, or expand a farm or business (% age 15+) [w2]
Global Findex Inclusion Firms Savings
Used an account at a financial institution for business purposes (% age 15+) [w1]
Global Findex Inclusion Firms Payments
Bank Z score GFDD Stability Resilience indicators Capital Bank capital to total assets (%) GFDD Stability Resilience indicators Capital Bank credit to bank deposits (%) GFDD Stability Resilience indicators Liquidity Liquid assets to deposits & ST funding (%) GFDD Stability Resilience indicators Liquidity Bank NPLs to gross loans (%) GFDD Stability Resilience indicators NPLs Provisions to NPLs (%) GFDD Stability Resilience indicators NPLs Standard deviation of the bank lending rate growth
GFDD Stability Volatility measures Credit volatility
Standard deviation of the outstanding loans Financial Access Survey
Stability Volatility measures Credit volatility
Standard deviation of the bank deposit rate growth
GFDD Stability Volatility measures Deposit volatility
Standard deviation of the outstanding deposits
Financial Access Survey
Stability Volatility measures Deposit volatility
Cumulative loss in income relative to a precrisis trend
Laeven and Valen Stability Crisis outcomes Milder/No crisis
Direct fiscal outlays due to financial sector rescue packages
Laeven and Valen Stability Crisis outcomes Milder/No crisis
Peak level of NPLs Laeven and Valen Stability Crisis outcomes Milder/No crisis
23
Table 2
Pairwise Spearman correlation coefficients for financial stability versus financial inclusion
The Spearman correlation coefficients between financial stability and financial inclusion. The table includes the values for the linear dependence of each financial inclusion indicator (rows) and each individual financial stability indicator (columns). Red and green highlight coefficients that are included in the left tail and right tail of the distribution of the Spearman coefficients: lighter green the highest 5%; darker green in the highest 10%; darker red in the lowest 10%; and lighter red in the lowest 5%.
Bank Z Score
Bank capital to
total assets
Low Bank credit to bank
deposits
Liquid assets to deposits & ST funding
Low Bank NPLs to
gross loans
High Provisions to NPLs
Low var. lending rate gr.
Low var. credit
growth
Low var. deposit rate
growth
Low var. deposit growth
Low Output
loss
Low Fiscal cost
Low Peak NPLs
Borrowed from a financial institution 0.062 -0.172 -0.449 -0.256 0.282 -0.354 -0.173 -0.202 0.147 0.193 -0.243 -0.229 -0.182
Credit card 0.025 -0.439 -0.449 -0.258 0.432 -0.244 -0.323 -0.374 0.260 0.281 -0.427 -0.376 -0.402
Saved at a financial institution 0.154 -0.527 -0.269 -0.316 0.382 -0.334 -0.162 -0.349 0.357 0.375 -0.409 -0.382 -0.357
Account at a financial institution 0.068 -0.507 -0.474 -0.351 0.291 -0.366 -0.272 -0.379 0.313 0.331 -0.467 -0.461 -0.448
Purchased agriculture insurance 0.131 0.064 0.289 0.261 -0.113 0.029 0.110 -0.002 -0.147 -0.065 . 0.132 0.132
Debit card 0.085 -0.404 -0.505 -0.332 0.299 -0.296 -0.330 -0.424 0.265 0.265 -0.471 -0.469 -0.459
Used either Internet payments or electronic 0.100 -0.426 -0.519 -0.295 0.338 -0.317 -0.370 -0.398 0.248 0.265 -0.473 -0.452 -0.447
Percentage of firms with a checking or savings account -0.058 -0.017 -0.349 -0.271 0.123 -0.006 -0.178 -0.166 0.249 0.122 -0.113 -0.033 -0.073
Percent of firms using banks to finance investments 0.049 -0.042 -0.408 -0.404 0.048 -0.131 -0.088 -0.236 0.265 0.228 -0.077 -0.009 -0.008
Percent of firms using banks to finance working capital 0.203 0.027 -0.334 -0.330 0.100 0.047 0.021 -0.126 0.359 0.249 0.055 0.130 0.172
Saved to start, operate, or expand a farm or business 0.016 0.104 0.334 -0.016 0.182 0.172 0.131 0.111 -0.020 -0.026 0.229 0.263 0.284
Used an account at a financial institution for business purposes 0.056 -0.395 -0.258 -0.228 0.156 -0.259 -0.139 -0.190 0.262 0.261 -0.453 -0.437 -0.417
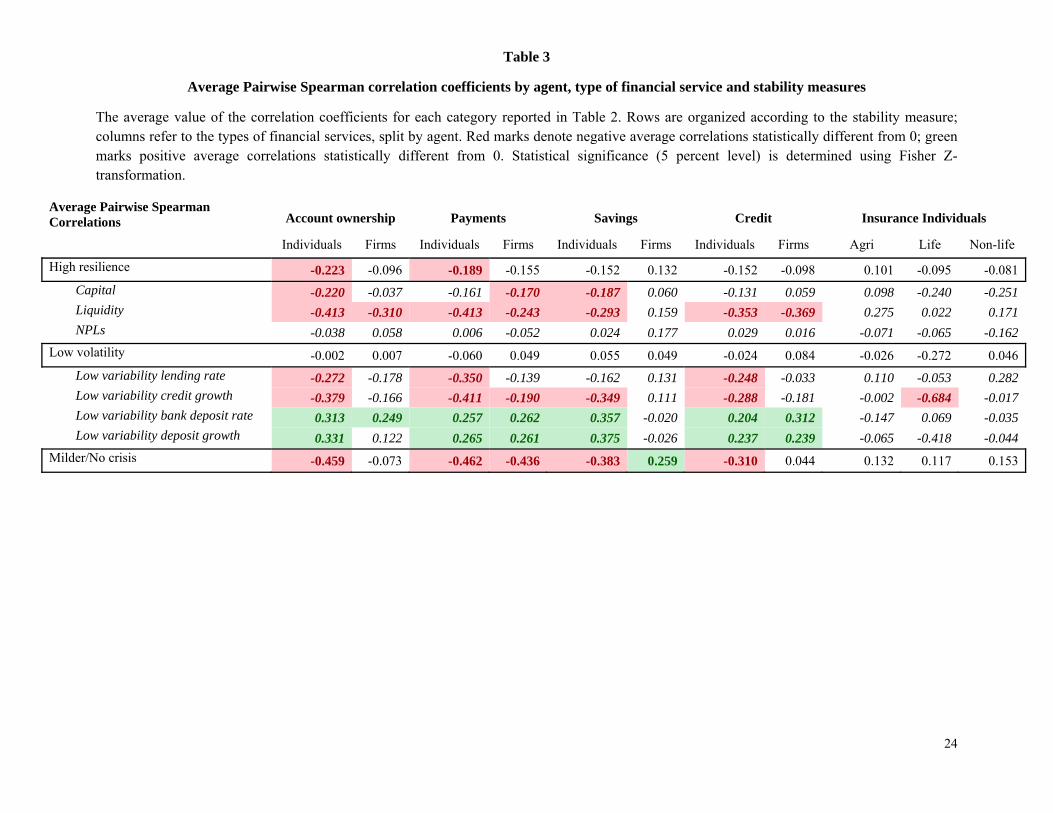
24
Table 3
Average Pairwise Spearman correlation coefficients by agent, type of financial service and stability measures
The average value of the correlation coefficients for each category reported in Table 2. Rows are organized according to the stability measure; columns refer to the types of financial services, split by agent. Red marks denote negative average correlations statistically different from 0; green marks positive average correlations statistically different from 0. Statistical significance (5 percent level) is determined using Fisher Z-transformation.
Average Pairwise Spearman Correlations Account ownership Payments Savings Credit Insurance Individuals
Individuals Firms Individuals Firms Individuals Firms Individuals Firms Agri Life Non-life
High resilience -0.223 -0.096 -0.189 -0.155 -0.152 0.132 -0.152 -0.098 0.101 -0.095 -0.081
Capital -0.220 -0.037 -0.161 -0.170 -0.187 0.060 -0.131 0.059 0.098 -0.240 -0.251 Liquidity -0.413 -0.310 -0.413 -0.243 -0.293 0.159 -0.353 -0.369 0.275 0.022 0.171 NPLs -0.038 0.058 0.006 -0.052 0.024 0.177 0.029 0.016 -0.071 -0.065 -0.162
Low volatility -0.002 0.007 -0.060 0.049 0.055 0.049 -0.024 0.084 -0.026 -0.272 0.046
Low variability lending rate -0.272 -0.178 -0.350 -0.139 -0.162 0.131 -0.248 -0.033 0.110 -0.053 0.282 Low variability credit growth -0.379 -0.166 -0.411 -0.190 -0.349 0.111 -0.288 -0.181 -0.002 -0.684 -0.017 Low variability bank deposit rate 0.313 0.249 0.257 0.262 0.357 -0.020 0.204 0.312 -0.147 0.069 -0.035 Low variability deposit growth 0.331 0.122 0.265 0.261 0.375 -0.026 0.237 0.239 -0.065 -0.418 -0.044
Milder/No crisis -0.459 -0.073 -0.462 -0.436 -0.383 0.259 -0.310 0.044 0.132 0.117 0.153
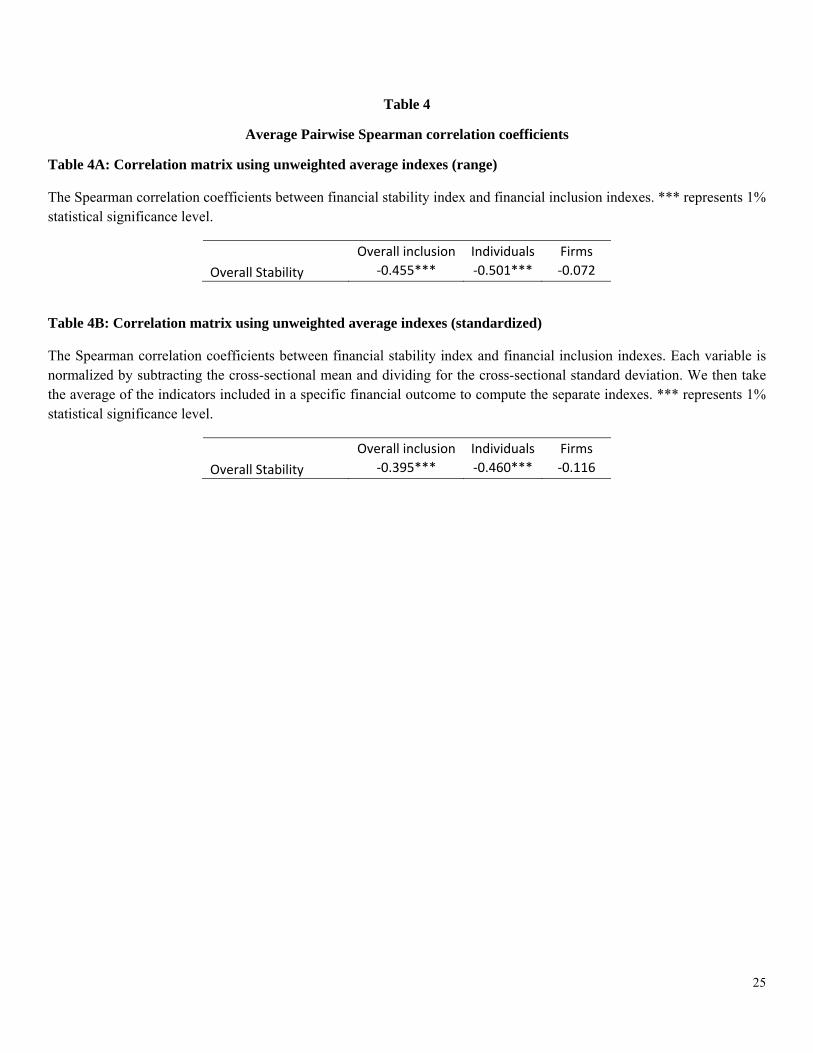
25
Table 4
Average Pairwise Spearman correlation coefficients
Table 4A: Correlation matrix using unweighted average indexes (range)
The Spearman correlation coefficients between financial stability index and financial inclusion indexes. *** represents 1% statistical significance level.
Overall inclusion Individuals Firms
Overall Stability ‐0.455*** ‐0.501*** ‐0.072
Table 4B: Correlation matrix using unweighted average indexes (standardized)
The Spearman correlation coefficients between financial stability index and financial inclusion indexes. Each variable is normalized by subtracting the cross-sectional mean and dividing for the cross-sectional standard deviation. We then take the average of the indicators included in a specific financial outcome to compute the separate indexes. *** represents 1% statistical significance level.
Overall inclusion Individuals Firms
Overall Stability ‐0.395*** ‐0.460*** ‐0.116
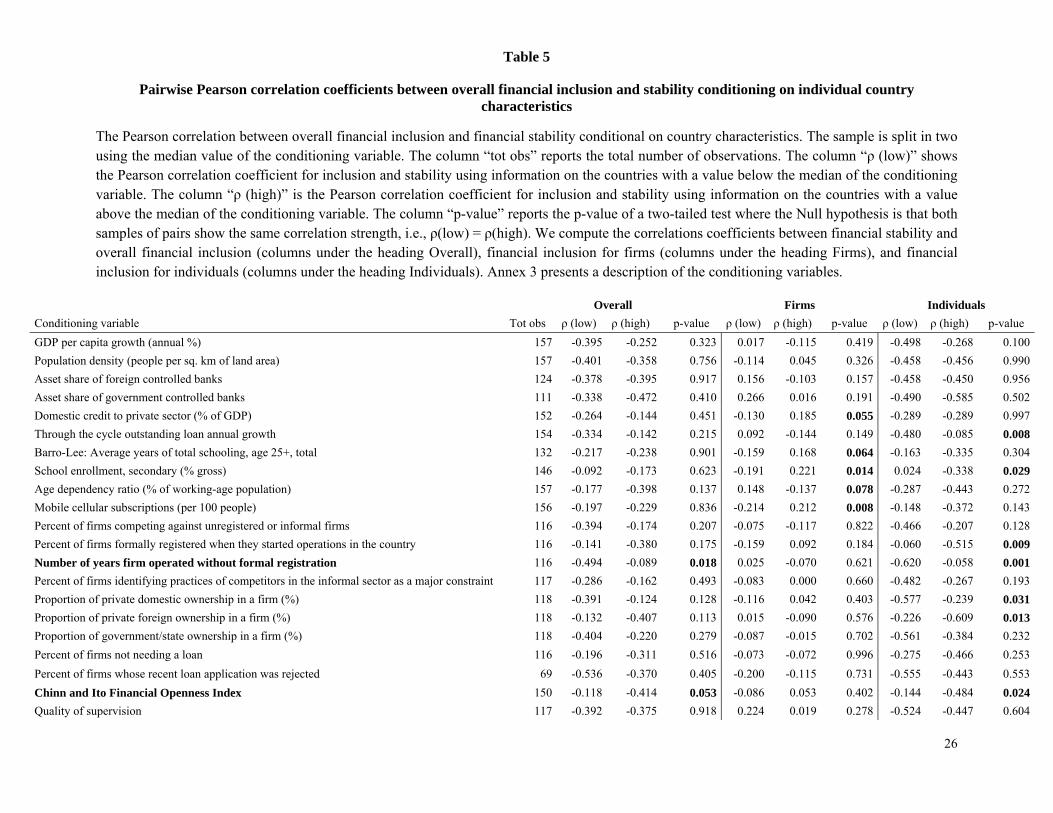
26
Table 5
Pairwise Pearson correlation coefficients between overall financial inclusion and stability conditioning on individual country characteristics
The Pearson correlation between overall financial inclusion and financial stability conditional on country characteristics. The sample is split in two using the median value of the conditioning variable. The column “tot obs” reports the total number of observations. The column “ρ (low)” shows the Pearson correlation coefficient for inclusion and stability using information on the countries with a value below the median of the conditioning variable. The column “ρ (high)” is the Pearson correlation coefficient for inclusion and stability using information on the countries with a value above the median of the conditioning variable. The column “p-value” reports the p-value of a two-tailed test where the Null hypothesis is that both samples of pairs show the same correlation strength, i.e., ρ(low) = ρ(high). We compute the correlations coefficients between financial stability and overall financial inclusion (columns under the heading Overall), financial inclusion for firms (columns under the heading Firms), and financial inclusion for individuals (columns under the heading Individuals). Annex 3 presents a description of the conditioning variables.
Overall Firms Individuals
Conditioning variable Tot obs ρ (low) ρ (high) p-value ρ (low) ρ (high) p-value ρ (low) ρ (high) p-value
GDP per capita growth (annual %) 157 -0.395 -0.252 0.323 0.017 -0.115 0.419 -0.498 -0.268 0.100
Population density (people per sq. km of land area) 157 -0.401 -0.358 0.756 -0.114 0.045 0.326 -0.458 -0.456 0.990
Asset share of foreign controlled banks 124 -0.378 -0.395 0.917 0.156 -0.103 0.157 -0.458 -0.450 0.956
Asset share of government controlled banks 111 -0.338 -0.472 0.410 0.266 0.016 0.191 -0.490 -0.585 0.502
Domestic credit to private sector (% of GDP) 152 -0.264 -0.144 0.451 -0.130 0.185 0.055 -0.289 -0.289 0.997
Through the cycle outstanding loan annual growth 154 -0.334 -0.142 0.215 0.092 -0.144 0.149 -0.480 -0.085 0.008
Barro-Lee: Average years of total schooling, age 25+, total 132 -0.217 -0.238 0.901 -0.159 0.168 0.064 -0.163 -0.335 0.304
School enrollment, secondary (% gross) 146 -0.092 -0.173 0.623 -0.191 0.221 0.014 0.024 -0.338 0.029
Age dependency ratio (% of working-age population) 157 -0.177 -0.398 0.137 0.148 -0.137 0.078 -0.287 -0.443 0.272
Mobile cellular subscriptions (per 100 people) 156 -0.197 -0.229 0.836 -0.214 0.212 0.008 -0.148 -0.372 0.143
Percent of firms competing against unregistered or informal firms 116 -0.394 -0.174 0.207 -0.075 -0.117 0.822 -0.466 -0.207 0.128
Percent of firms formally registered when they started operations in the country 116 -0.141 -0.380 0.175 -0.159 0.092 0.184 -0.060 -0.515 0.009
Number of years firm operated without formal registration 116 -0.494 -0.089 0.018 0.025 -0.070 0.621 -0.620 -0.058 0.001
Percent of firms identifying practices of competitors in the informal sector as a major constraint 117 -0.286 -0.162 0.493 -0.083 0.000 0.660 -0.482 -0.267 0.193
Proportion of private domestic ownership in a firm (%) 118 -0.391 -0.124 0.128 -0.116 0.042 0.403 -0.577 -0.239 0.031
Proportion of private foreign ownership in a firm (%) 118 -0.132 -0.407 0.113 0.015 -0.090 0.576 -0.226 -0.609 0.013
Proportion of government/state ownership in a firm (%) 118 -0.404 -0.220 0.279 -0.087 -0.015 0.702 -0.561 -0.384 0.232
Percent of firms not needing a loan 116 -0.196 -0.311 0.516 -0.073 -0.072 0.996 -0.275 -0.466 0.253
Percent of firms whose recent loan application was rejected 69 -0.536 -0.370 0.405 -0.200 -0.115 0.731 -0.555 -0.443 0.553
Chinn and Ito Financial Openness Index 150 -0.118 -0.414 0.053 -0.086 0.053 0.402 -0.144 -0.484 0.024
Quality of supervision 117 -0.392 -0.375 0.918 0.224 0.019 0.278 -0.524 -0.447 0.604
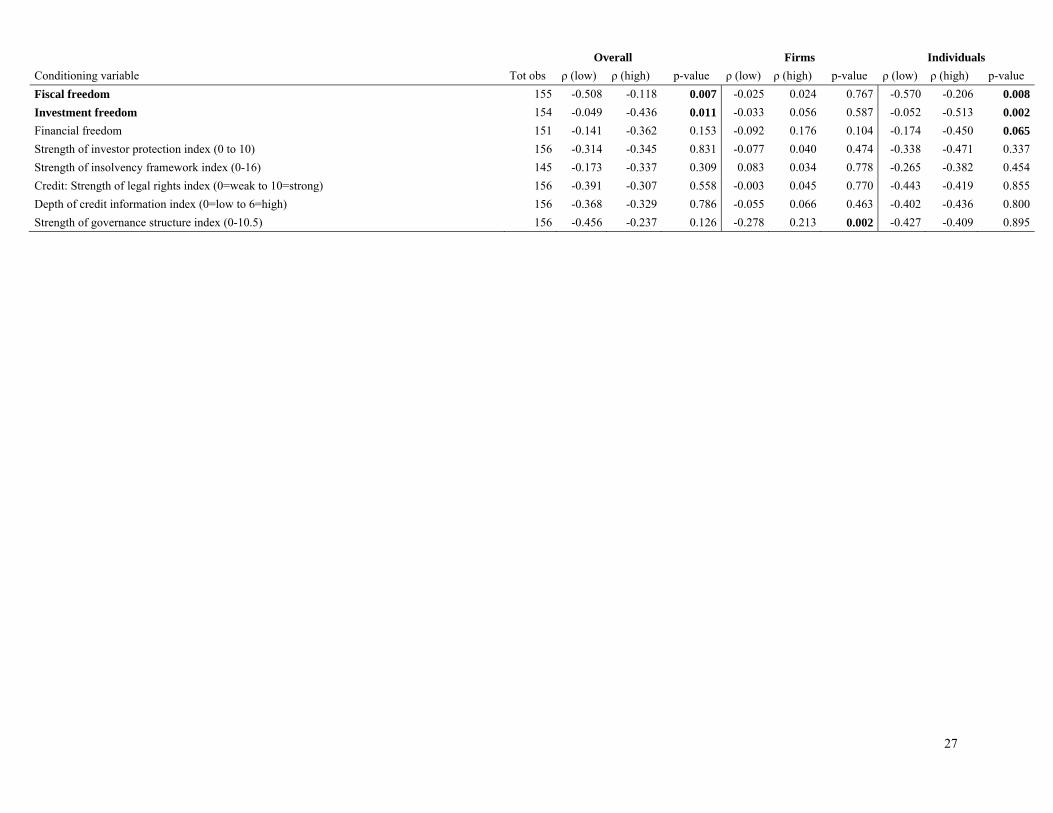
27
Overall Firms Individuals
Conditioning variable Tot obs ρ (low) ρ (high) p-value ρ (low) ρ (high) p-value ρ (low) ρ (high) p-value
Fiscal freedom 155 -0.508 -0.118 0.007 -0.025 0.024 0.767 -0.570 -0.206 0.008
Investment freedom 154 -0.049 -0.436 0.011 -0.033 0.056 0.587 -0.052 -0.513 0.002
Financial freedom 151 -0.141 -0.362 0.153 -0.092 0.176 0.104 -0.174 -0.450 0.065
Strength of investor protection index (0 to 10) 156 -0.314 -0.345 0.831 -0.077 0.040 0.474 -0.338 -0.471 0.337
Strength of insolvency framework index (0-16) 145 -0.173 -0.337 0.309 0.083 0.034 0.778 -0.265 -0.382 0.454
Credit: Strength of legal rights index (0=weak to 10=strong) 156 -0.391 -0.307 0.558 -0.003 0.045 0.770 -0.443 -0.419 0.855
Depth of credit information index (0=low to 6=high) 156 -0.368 -0.329 0.786 -0.055 0.066 0.463 -0.402 -0.436 0.800
Strength of governance structure index (0-10.5) 156 -0.456 -0.237 0.126 -0.278 0.213 0.002 -0.427 -0.409 0.895
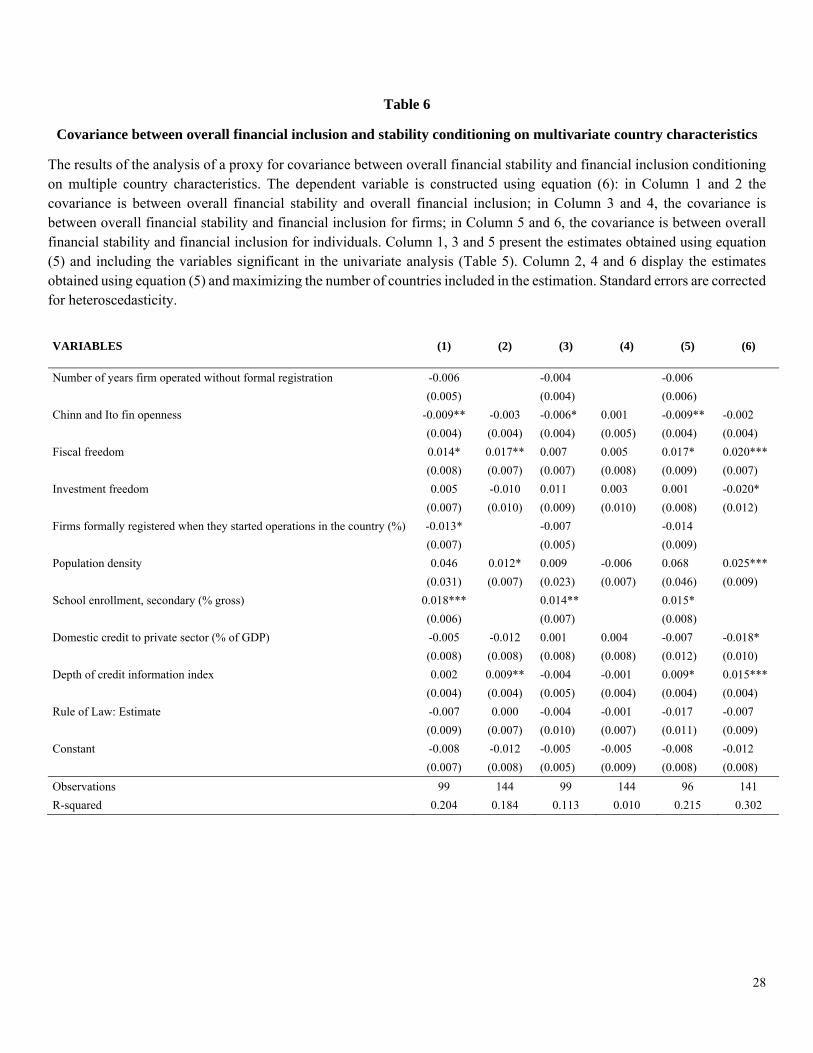
28
Table 6
Covariance between overall financial inclusion and stability conditioning on multivariate country characteristics
The results of the analysis of a proxy for covariance between overall financial stability and financial inclusion conditioning on multiple country characteristics. The dependent variable is constructed using equation (6): in Column 1 and 2 the covariance is between overall financial stability and overall financial inclusion; in Column 3 and 4, the covariance is between overall financial stability and financial inclusion for firms; in Column 5 and 6, the covariance is between overall financial stability and financial inclusion for individuals. Column 1, 3 and 5 present the estimates obtained using equation (5) and including the variables significant in the univariate analysis (Table 5). Column 2, 4 and 6 display the estimates obtained using equation (5) and maximizing the number of countries included in the estimation. Standard errors are corrected for heteroscedasticity.
VARIABLES (1) (2) (3) (4) (5) (6)
Number of years firm operated without formal registration -0.006 -0.004 -0.006
(0.005) (0.004) (0.006)
Chinn and Ito fin openness -0.009** -0.003 -0.006* 0.001 -0.009** -0.002
(0.004) (0.004) (0.004) (0.005) (0.004) (0.004)
Fiscal freedom 0.014* 0.017** 0.007 0.005 0.017* 0.020***
(0.008) (0.007) (0.007) (0.008) (0.009) (0.007)
Investment freedom 0.005 -0.010 0.011 0.003 0.001 -0.020*
(0.007) (0.010) (0.009) (0.010) (0.008) (0.012)
Firms formally registered when they started operations in the country (%) -0.013* -0.007 -0.014
(0.007) (0.005) (0.009)
Population density 0.046 0.012* 0.009 -0.006 0.068 0.025***
(0.031) (0.007) (0.023) (0.007) (0.046) (0.009)
School enrollment, secondary (% gross) 0.018*** 0.014** 0.015*
(0.006) (0.007) (0.008)
Domestic credit to private sector (% of GDP) -0.005 -0.012 0.001 0.004 -0.007 -0.018*
(0.008) (0.008) (0.008) (0.008) (0.012) (0.010)
Depth of credit information index 0.002 0.009** -0.004 -0.001 0.009* 0.015***
(0.004) (0.004) (0.005) (0.004) (0.004) (0.004)
Rule of Law: Estimate -0.007 0.000 -0.004 -0.001 -0.017 -0.007
(0.009) (0.007) (0.010) (0.007) (0.011) (0.009)
Constant -0.008 -0.012 -0.005 -0.005 -0.008 -0.012
(0.007) (0.008) (0.005) (0.009) (0.008) (0.008)
Observations 99 144 99 144 96 141
R-squared 0.204 0.184 0.113 0.010 0.215 0.302
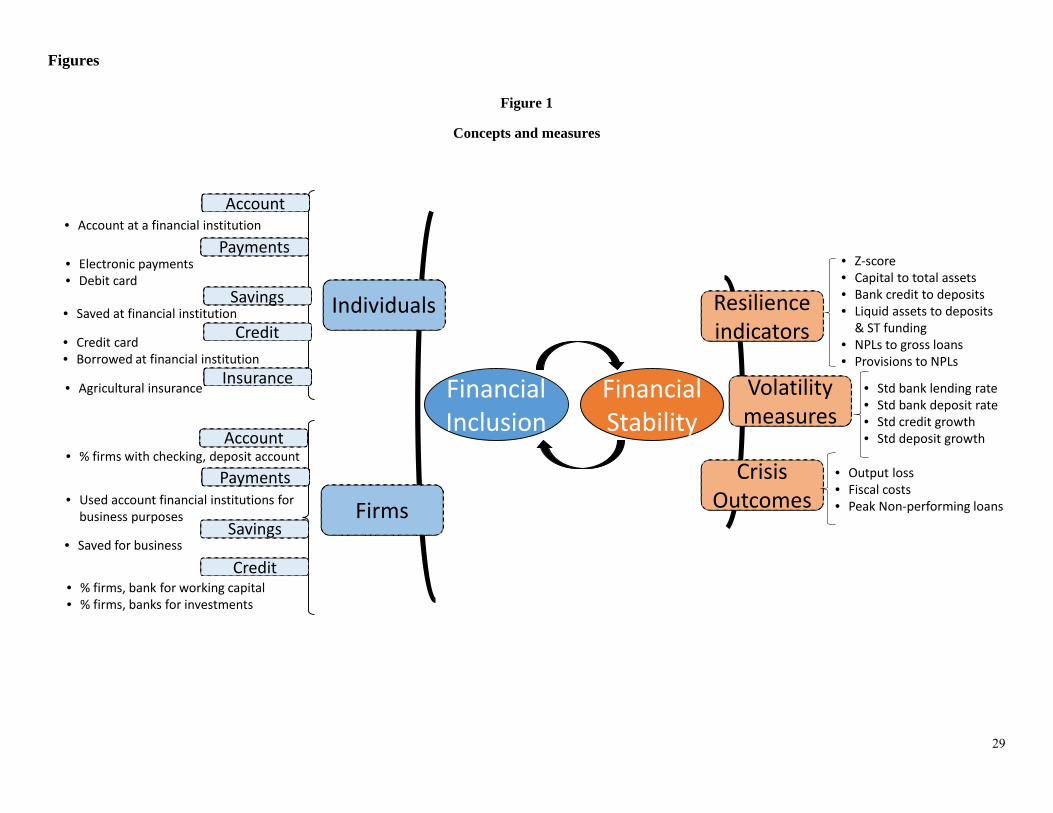
29
Figures
Figure 1
Concepts and measures
Financial Inclusion
Financial Stability
Volatility measures
Resilience indicators
Crisis Outcomes
Individuals
Firms
• Agricultural insurance
• Saved at financial institution
• Credit card• Borrowed at financial institution
• Electronic payments• Debit card
Payments
Insurance
Savings
Credit
• % firms, bank for working capital• % firms, banks for investments
Credit
Savings• Saved for business
Payments• Used account financial institutions for business purposes
• Output loss• Fiscal costs• Peak Non‐performing loans
• Std bank lending rate• Std bank deposit rate• Std credit growth• Std deposit growth
• Z‐score• Capital to total assets• Bank credit to deposits• Liquid assets to deposits & ST funding
• NPLs to gross loans • Provisions to NPLs
Account• Account at a financial institution
Account• % firms with checking, deposit account
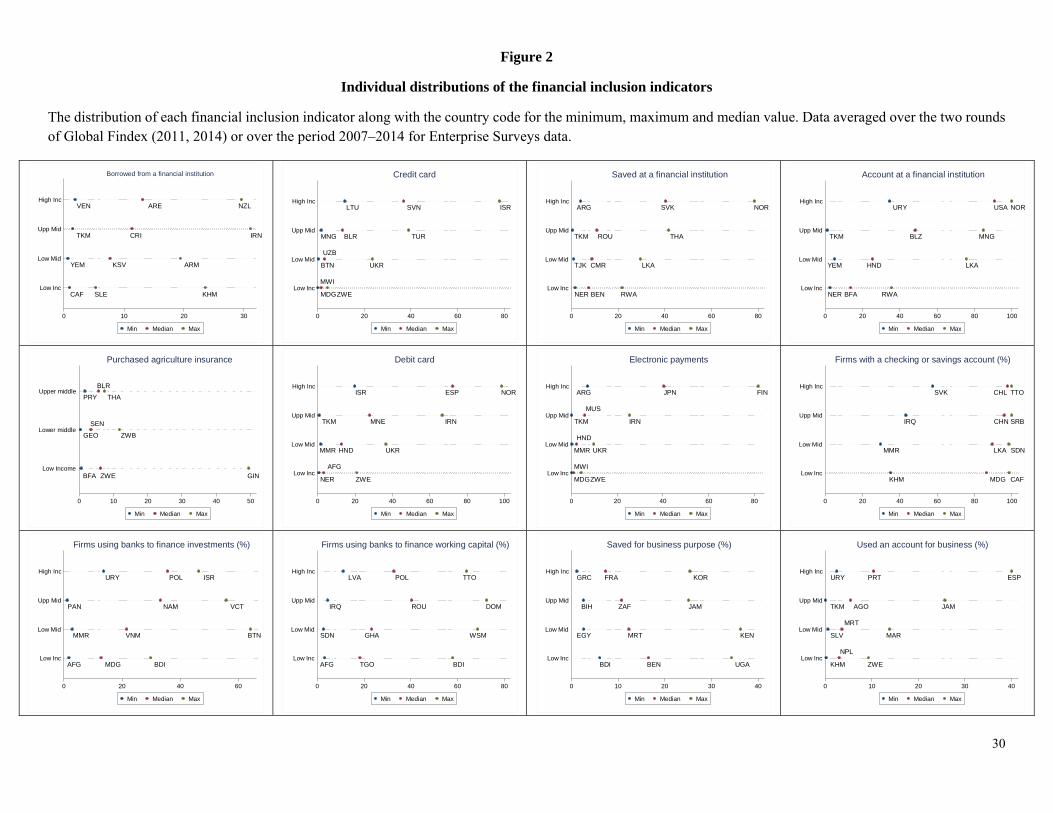
30
Figure 2
Individual distributions of the financial inclusion indicators
The distribution of each financial inclusion indicator along with the country code for the minimum, maximum and median value. Data averaged over the two rounds of Global Findex (2011, 2014) or over the period 2007–2014 for Enterprise Surveys data.
VEN
TKM
YEM
CAF
ARE
CRI
KSV
SLE
NZL
IRN
ARM
KHM
0 10 20 30
Low Inc
Low Mid
Upp Mid
High Inc
Borrowed from a financial institution
Min Median Max
LTU
MNG
BTN
MDG
SVN
BLR
UZB
MWI
ISR
TUR
UKR
ZWE
0 20 40 60 80
Low Inc
Low Mid
Upp Mid
High Inc
Credit card
Min Median Max
ARG
TKM
TJK
NER
SVK
ROU
CMR
BEN
NOR
THA
LKA
RWA
0 20 40 60 80
Low Inc
Low Mid
Upp Mid
High Inc
Saved at a financial institution
Min Median Max
URY
TKM
YEM
NER
USA
BLZ
HND
BFA
NOR
MNG
LKA
RWA
0 20 40 60 80 100
Low Inc
Low Mid
Upp Mid
High Inc
Account at a financial institution
Min Median Max
PRY
GEO
BFA
BLR
SEN
ZWE
THA
ZWB
GIN
0 10 20 30 40 50
Low Income
Lower middle
Upper middle
Purchased agriculture insurance
Min Median Max
ISR
TKM
MMR
NER
ESP
MNE
HND
AFG
NOR
IRN
UKR
ZWE
0 20 40 60 80 100
Low Inc
Low Mid
Upp Mid
High Inc
Debit card
Min Median Max
ARG
TKM
MMR
MDG
JPN
MUS
HND
MWI
FIN
IRN
UKR
ZWE
0 20 40 60 80
Low Inc
Low Mid
Upp Mid
High Inc
Electronic payments
Min Median Max
SVK
IRQ
MMR
KHM
CHL
CHN
LKA
MDG
TTO
SRB
SDN
CAF
0 20 40 60 80 100
Low Inc
Low Mid
Upp Mid
High Inc
Firms with a checking or savings account (%)
Min Median Max
URY
PAN
MMR
AFG
POL
NAM
VNM
MDG
ISR
VCT
BTN
BDI
0 20 40 60
Low Inc
Low Mid
Upp Mid
High Inc
Firms using banks to finance investments (%)
Min Median Max
LVA
IRQ
SDN
AFG
POL
ROU
GHA
TGO
TTO
DOM
WSM
BDI
0 20 40 60 80
Low Inc
Low Mid
Upp Mid
High Inc
Firms using banks to finance working capital (%)
Min Median Max
GRC
BIH
EGY
BDI
FRA
ZAF
MRT
BEN
KOR
JAM
KEN
UGA
0 10 20 30 40
Low Inc
Low Mid
Upp Mid
High Inc
Saved for business purpose (%)
Min Median Max
URY
TKM
SLV
KHM
PRT
AGO
MRT
NPL
ESP
JAM
MAR
ZWE
0 10 20 30 40
Low Inc
Low Mid
Upp Mid
High Inc
Used an account for business (%)
Min Median Max
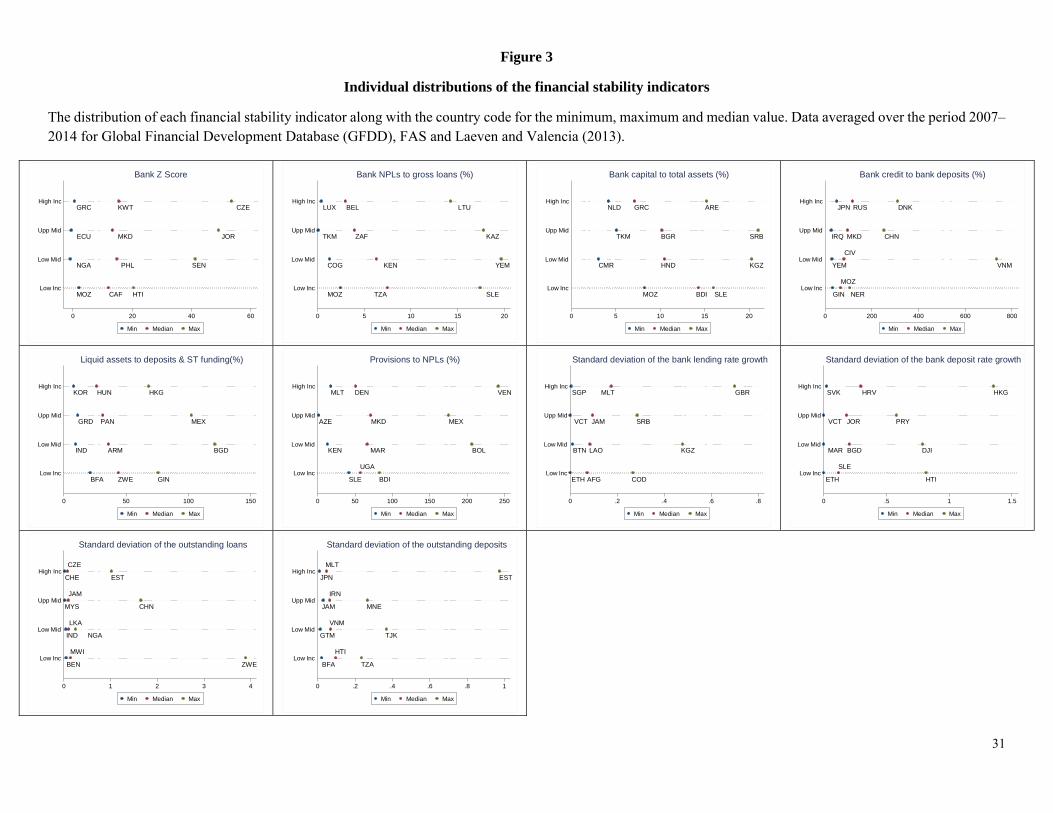
31
Figure 3
Individual distributions of the financial stability indicators
The distribution of each financial stability indicator along with the country code for the minimum, maximum and median value. Data averaged over the period 2007–2014 for Global Financial Development Database (GFDD), FAS and Laeven and Valencia (2013).
GRC
ECU
NGA
MOZ
KWT
MKD
PHL
CAF
CZE
JOR
SEN
HTI
0 20 40 60
Low Inc
Low Mid
Upp Mid
High Inc
Bank Z Score
Min Median Max
LUX
TKM
COG
MOZ
BEL
ZAF
KEN
TZA
LTU
KAZ
YEM
SLE
0 5 10 15 20
Low Inc
Low Mid
Upp Mid
High Inc
Bank NPLs to gross loans (%)
Min Median Max
NLD
TKM
CMR
MOZ
GRC
BGR
HND
BDI
ARE
SRB
KGZ
SLE
0 5 10 15 20
Low Inc
Low Mid
Upp Mid
High Inc
Bank capital to total assets (%)
Min Median Max
JPN
IRQ
YEM
GIN
RUS
MKD
CIV
MOZ
DNK
CHN
VNM
NER
0 200 400 600 800
Low Inc
Low Mid
Upp Mid
High Inc
Bank credit to bank deposits (%)
Min Median Max
KOR
GRD
IND
BFA
HUN
PAN
ARM
ZWE
HKG
MEX
BGD
GIN
0 50 100 150
Low Inc
Low Mid
Upp Mid
High Inc
Liquid assets to deposits & ST funding(%)
Min Median Max
MLT
AZE
KEN
SLE
DEN
MKD
MAR
UGA
VEN
MEX
BOL
BDI
0 50 100 150 200 250
Low Inc
Low Mid
Upp Mid
High Inc
Provisions to NPLs (%)
Min Median Max
SGP
VCT
BTN
ETH
MLT
JAM
LAO
AFG
GBR
SRB
KGZ
COD
0 .2 .4 .6 .8
Low Inc
Low Mid
Upp Mid
High Inc
Standard deviation of the bank lending rate growth
Min Median Max
SVK
VCT
MAR
ETH
HRV
JOR
BGD
SLE
HKG
PRY
DJI
HTI
0 .5 1 1.5
Low Inc
Low Mid
Upp Mid
High Inc
Standard deviation of the bank deposit rate growth
Min Median Max
CHE
MYS
IND
BEN
CZE
JAM
LKA
MWI
EST
CHN
NGA
ZWE
0 1 2 3 4
Low Inc
Low Mid
Upp Mid
High Inc
Standard deviation of the outstanding loans
Min Median Max
JPN
JAM
GTM
BFA
MLT
IRN
VNM
HTI
EST
MNE
TJK
TZA
0 .2 .4 .6 .8 1
Low Inc
Low Mid
Upp Mid
High Inc
Standard deviation of the outstanding deposits
Min Median Max
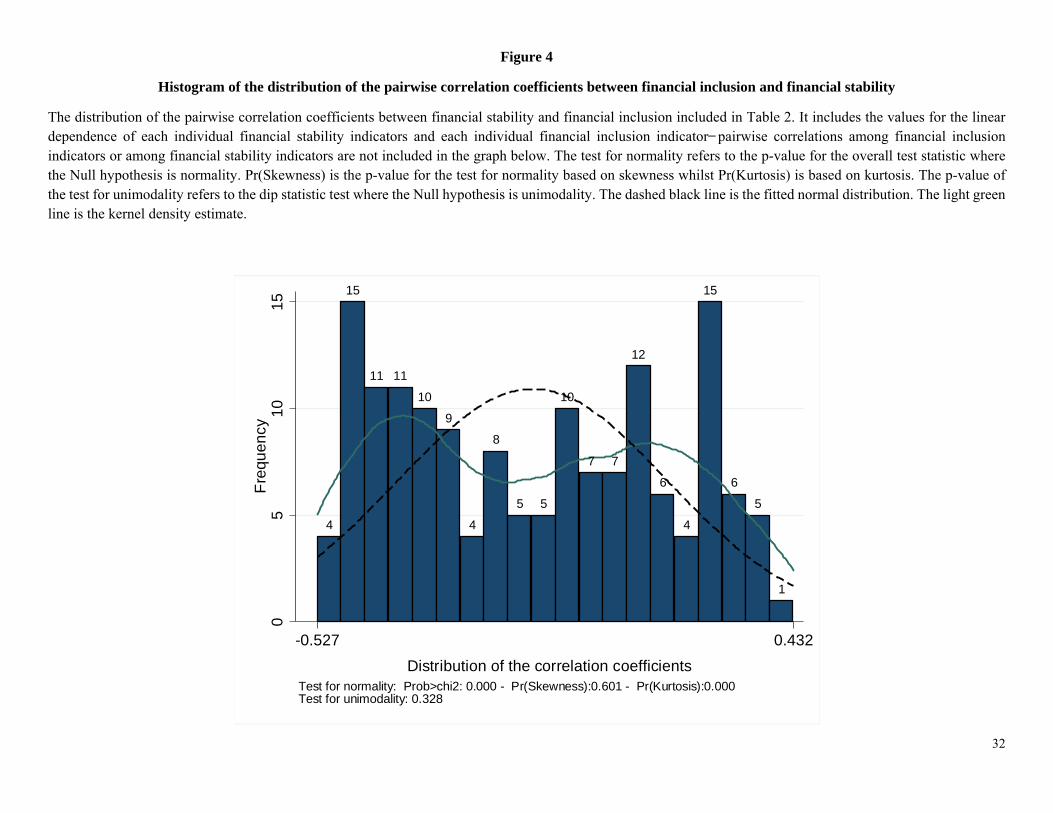
32
Figure 4
Histogram of the distribution of the pairwise correlation coefficients between financial inclusion and financial stability
The distribution of the pairwise correlation coefficients between financial stability and financial inclusion included in Table 2. It includes the values for the linear dependence of each individual financial stability indicators and each individual financial inclusion indicator ̶ pairwise correlations among financial inclusion indicators or among financial stability indicators are not included in the graph below. The test for normality refers to the p-value for the overall test statistic where the Null hypothesis is normality. Pr(Skewness) is the p-value for the test for normality based on skewness whilst Pr(Kurtosis) is based on kurtosis. The p-value of the test for unimodality refers to the dip statistic test where the Null hypothesis is unimodality. The dashed black line is the fitted normal distribution. The light green line is the kernel density estimate.
4
15
11 11
10
9
4
8
5 5
10
7 7
12
6
4
15
6
5
1
05
1015
Freq
uenc
y
-0.527 0.432Distribution of the correlation coefficients
Test for normality: Prob>chi2: 0.000 - Pr(Skewness):0.601 - Pr(Kurtosis):0.000Test for unimodality: 0.328
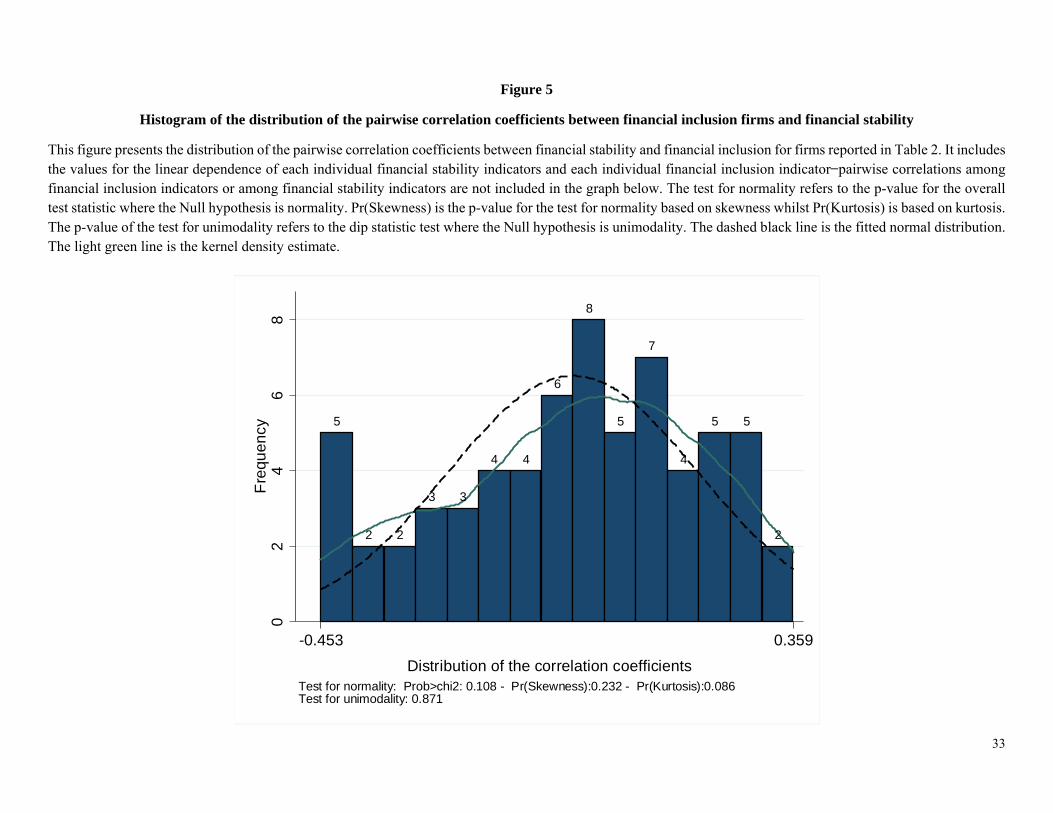
33
Figure 5
Histogram of the distribution of the pairwise correlation coefficients between financial inclusion firms and financial stability
This figure presents the distribution of the pairwise correlation coefficients between financial stability and financial inclusion for firms reported in Table 2. It includes the values for the linear dependence of each individual financial stability indicators and each individual financial inclusion indicator ̶ pairwise correlations among financial inclusion indicators or among financial stability indicators are not included in the graph below. The test for normality refers to the p-value for the overall test statistic where the Null hypothesis is normality. Pr(Skewness) is the p-value for the test for normality based on skewness whilst Pr(Kurtosis) is based on kurtosis. The p-value of the test for unimodality refers to the dip statistic test where the Null hypothesis is unimodality. The dashed black line is the fitted normal distribution. The light green line is the kernel density estimate.
5
2 2
3 3
4 4
6
8
5
7
4
5 5
2
02
46
8Fr
eque
ncy
-0.453 0.359Distribution of the correlation coefficients
Test for normality: Prob>chi2: 0.108 - Pr(Skewness):0.232 - Pr(Kurtosis):0.086Test for unimodality: 0.871
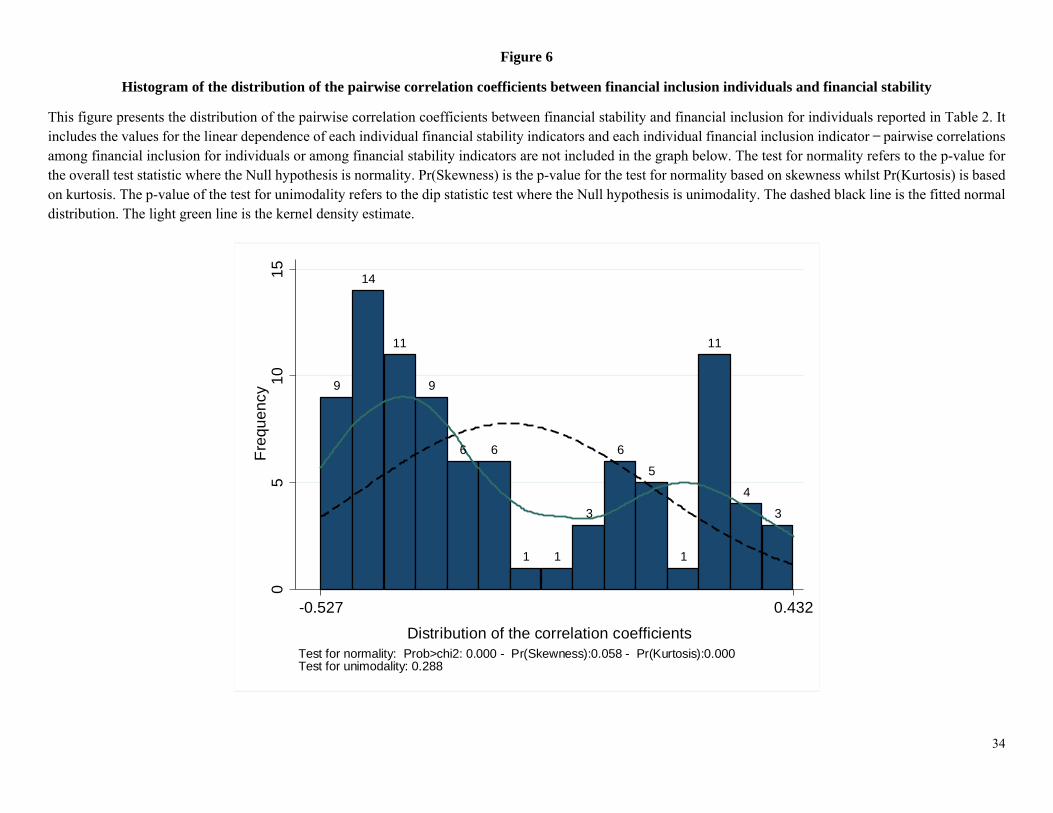
34
Figure 6
Histogram of the distribution of the pairwise correlation coefficients between financial inclusion individuals and financial stability
This figure presents the distribution of the pairwise correlation coefficients between financial stability and financial inclusion for individuals reported in Table 2. It includes the values for the linear dependence of each individual financial stability indicators and each individual financial inclusion indicator ̶ pairwise correlations among financial inclusion for individuals or among financial stability indicators are not included in the graph below. The test for normality refers to the p-value for the overall test statistic where the Null hypothesis is normality. Pr(Skewness) is the p-value for the test for normality based on skewness whilst Pr(Kurtosis) is based on kurtosis. The p-value of the test for unimodality refers to the dip statistic test where the Null hypothesis is unimodality. The dashed black line is the fitted normal distribution. The light green line is the kernel density estimate.
9
14
11
9
6 6
1 1
3
6
5
1
11
4
3
05
1015
Freq
uenc
y
-0.527 0.432Distribution of the correlation coefficients
Test for normality: Prob>chi2: 0.000 - Pr(Skewness):0.058 - Pr(Kurtosis):0.000Test for unimodality: 0.288
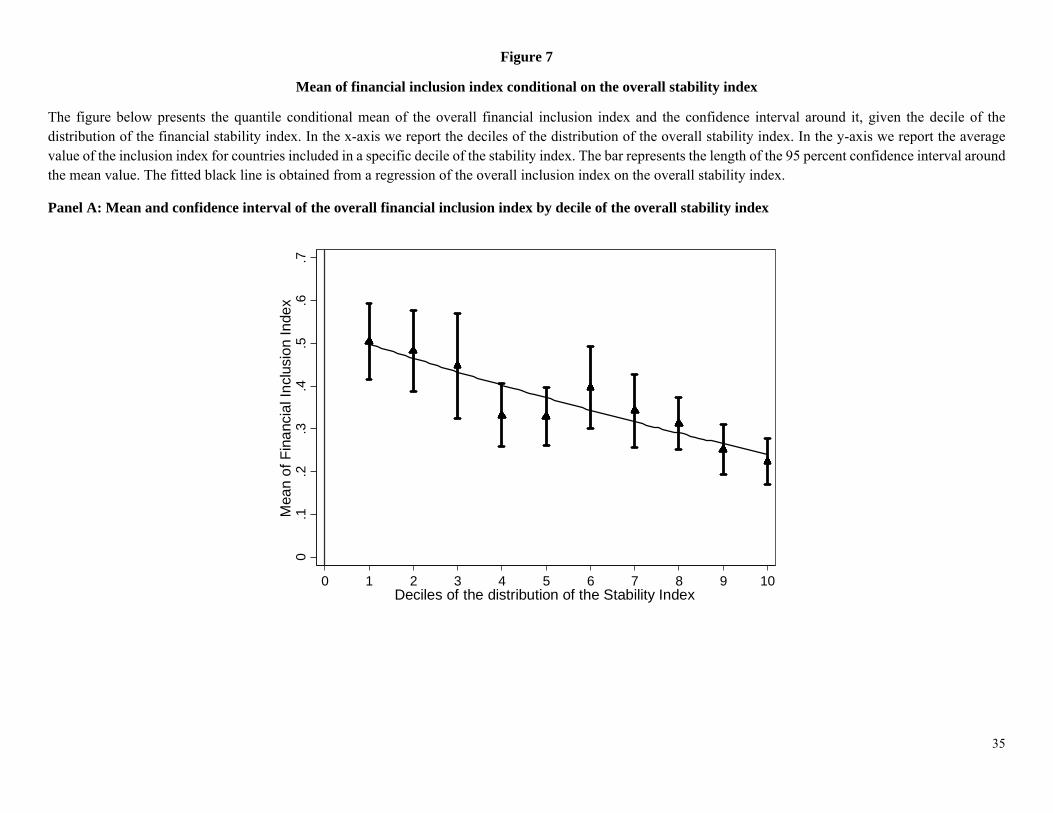
35
Figure 7
Mean of financial inclusion index conditional on the overall stability index
The figure below presents the quantile conditional mean of the overall financial inclusion index and the confidence interval around it, given the decile of the distribution of the financial stability index. In the x-axis we report the deciles of the distribution of the overall stability index. In the y-axis we report the average value of the inclusion index for countries included in a specific decile of the stability index. The bar represents the length of the 95 percent confidence interval around the mean value. The fitted black line is obtained from a regression of the overall inclusion index on the overall stability index.
Panel A: Mean and confidence interval of the overall financial inclusion index by decile of the overall stability index
0.1
.2.3
.4.5
.6.7
Mea
n of
Fin
anci
al In
clus
ion
Inde
x
0 1 2 3 4 5 6 7 8 9 10Deciles of the distribution of the Stability Index
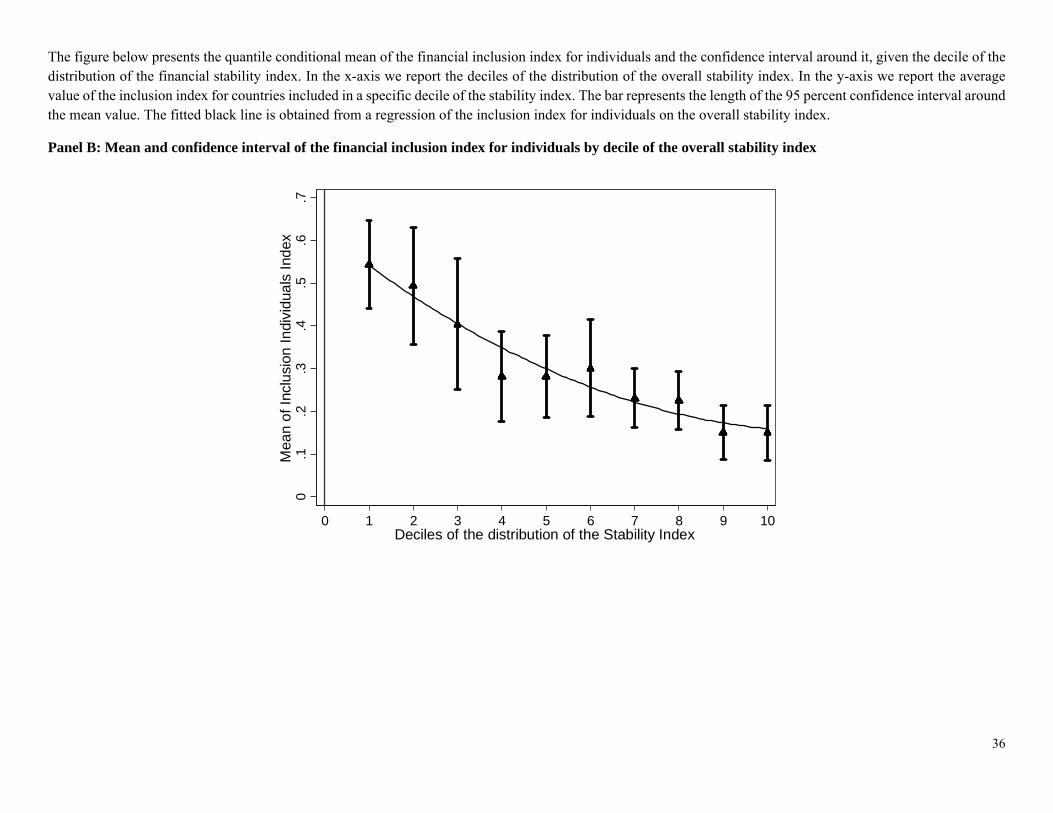
36
The figure below presents the quantile conditional mean of the financial inclusion index for individuals and the confidence interval around it, given the decile of the distribution of the financial stability index. In the x-axis we report the deciles of the distribution of the overall stability index. In the y-axis we report the average value of the inclusion index for countries included in a specific decile of the stability index. The bar represents the length of the 95 percent confidence interval around the mean value. The fitted black line is obtained from a regression of the inclusion index for individuals on the overall stability index.
Panel B: Mean and confidence interval of the financial inclusion index for individuals by decile of the overall stability index
0.1
.2.3
.4.5
.6.7
Mea
n of
Incl
usio
n In
divi
dual
s In
dex
0 1 2 3 4 5 6 7 8 9 10Deciles of the distribution of the Stability Index
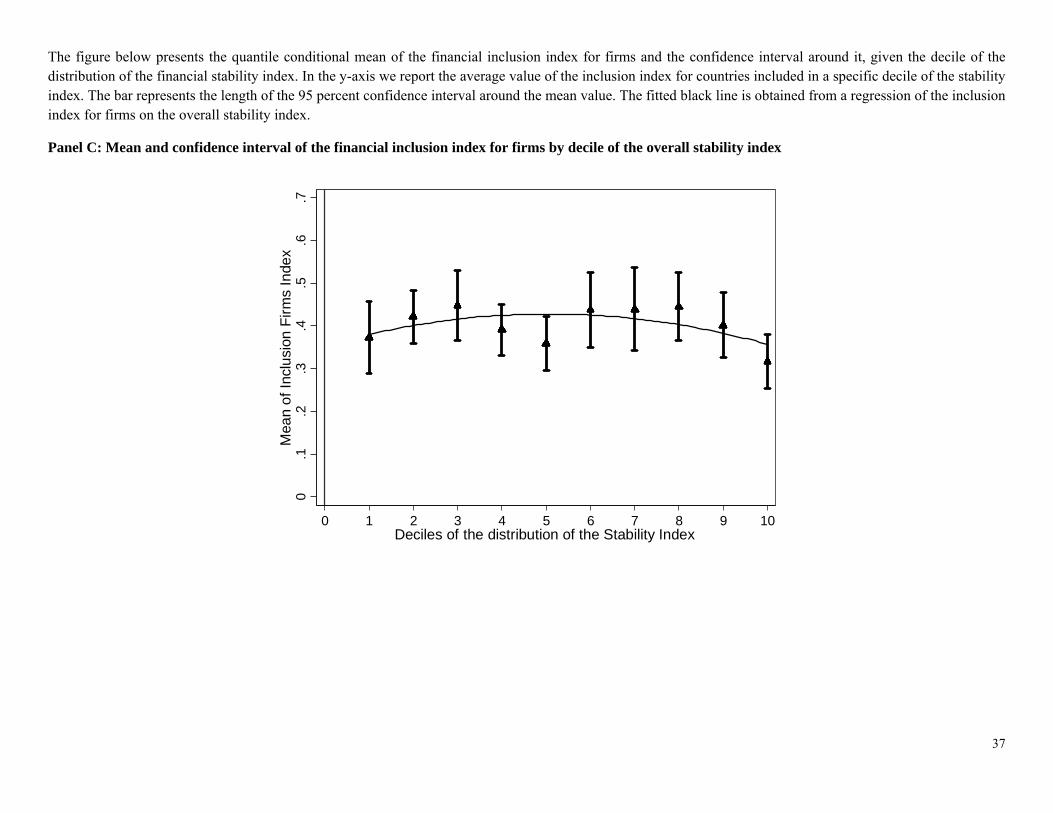
37
The figure below presents the quantile conditional mean of the financial inclusion index for firms and the confidence interval around it, given the decile of the distribution of the financial stability index. In the y-axis we report the average value of the inclusion index for countries included in a specific decile of the stability index. The bar represents the length of the 95 percent confidence interval around the mean value. The fitted black line is obtained from a regression of the inclusion index for firms on the overall stability index.
Panel C: Mean and confidence interval of the financial inclusion index for firms by decile of the overall stability index
0.1
.2.3
.4.5
.6.7
Mea
n of
Incl
usio
n Fi
rms
Inde
x
0 1 2 3 4 5 6 7 8 9 10Deciles of the distribution of the Stability Index
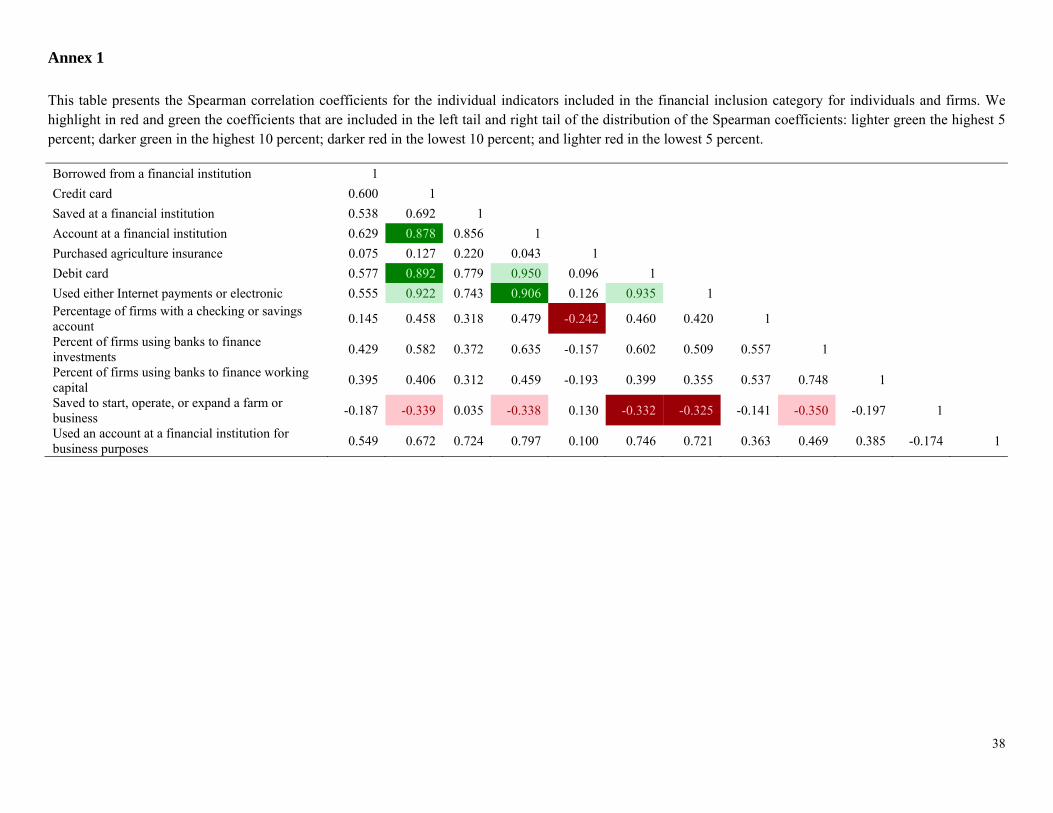
38
Annex 1
This table presents the Spearman correlation coefficients for the individual indicators included in the financial inclusion category for individuals and firms. We highlight in red and green the coefficients that are included in the left tail and right tail of the distribution of the Spearman coefficients: lighter green the highest 5 percent; darker green in the highest 10 percent; darker red in the lowest 10 percent; and lighter red in the lowest 5 percent.
Borrowed from a financial institution 1
Credit card 0.600 1
Saved at a financial institution 0.538 0.692 1
Account at a financial institution 0.629 0.878 0.856 1
Purchased agriculture insurance 0.075 0.127 0.220 0.043 1
Debit card 0.577 0.892 0.779 0.950 0.096 1
Used either Internet payments or electronic 0.555 0.922 0.743 0.906 0.126 0.935 1 Percentage of firms with a checking or savings account
0.145 0.458 0.318 0.479 -0.242 0.460 0.420 1
Percent of firms using banks to finance investments
0.429 0.582 0.372 0.635 -0.157 0.602 0.509 0.557 1
Percent of firms using banks to finance working capital
0.395 0.406 0.312 0.459 -0.193 0.399 0.355 0.537 0.748 1
Saved to start, operate, or expand a farm or business
-0.187 -0.339 0.035 -0.338 0.130 -0.332 -0.325 -0.141 -0.350 -0.197 1
Used an account at a financial institution for business purposes
0.549 0.672 0.724 0.797 0.100 0.746 0.721 0.363 0.469 0.385 -0.174 1
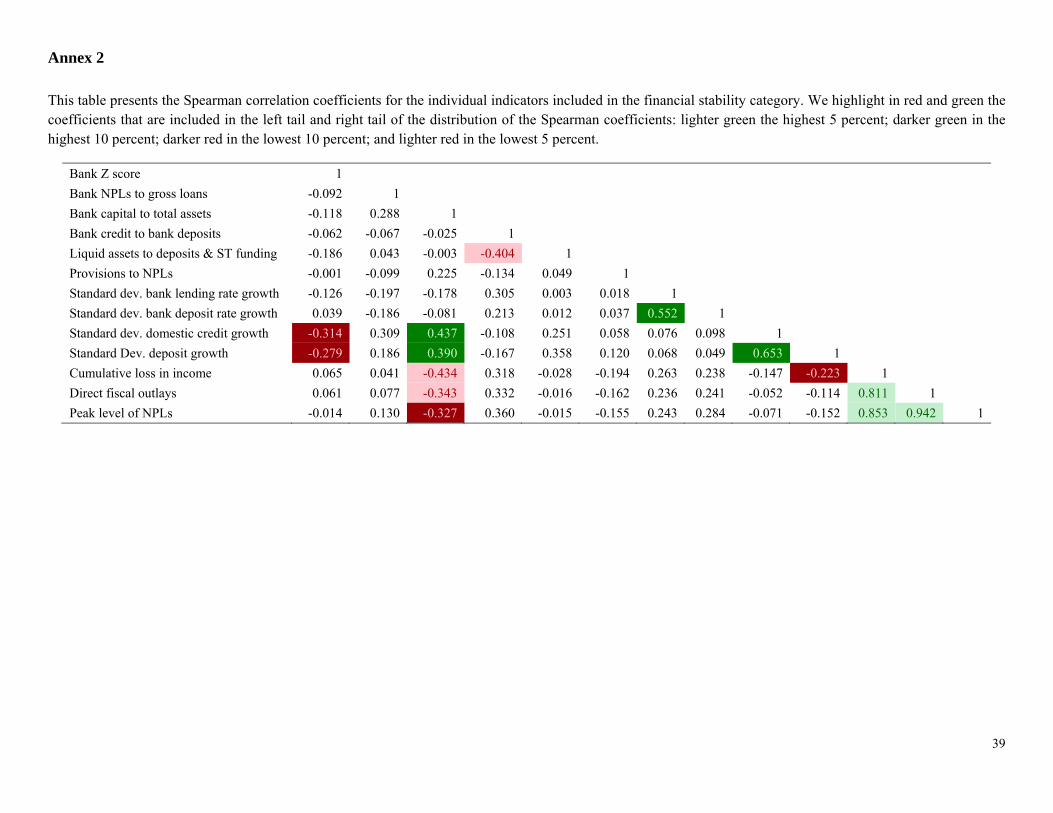
39
Annex 2
This table presents the Spearman correlation coefficients for the individual indicators included in the financial stability category. We highlight in red and green the coefficients that are included in the left tail and right tail of the distribution of the Spearman coefficients: lighter green the highest 5 percent; darker green in the highest 10 percent; darker red in the lowest 10 percent; and lighter red in the lowest 5 percent.
Bank Z score 1
Bank NPLs to gross loans -0.092 1
Bank capital to total assets -0.118 0.288 1
Bank credit to bank deposits -0.062 -0.067 -0.025 1
Liquid assets to deposits & ST funding -0.186 0.043 -0.003 -0.404 1
Provisions to NPLs -0.001 -0.099 0.225 -0.134 0.049 1
Standard dev. bank lending rate growth -0.126 -0.197 -0.178 0.305 0.003 0.018 1
Standard dev. bank deposit rate growth 0.039 -0.186 -0.081 0.213 0.012 0.037 0.552 1
Standard dev. domestic credit growth -0.314 0.309 0.437 -0.108 0.251 0.058 0.076 0.098 1
Standard Dev. deposit growth -0.279 0.186 0.390 -0.167 0.358 0.120 0.068 0.049 0.653 1
Cumulative loss in income 0.065 0.041 -0.434 0.318 -0.028 -0.194 0.263 0.238 -0.147 -0.223 1
Direct fiscal outlays 0.061 0.077 -0.343 0.332 -0.016 -0.162 0.236 0.241 -0.052 -0.114 0.811 1
Peak level of NPLs -0.014 0.130 -0.327 0.360 -0.015 -0.155 0.243 0.284 -0.071 -0.152 0.853 0.942 1
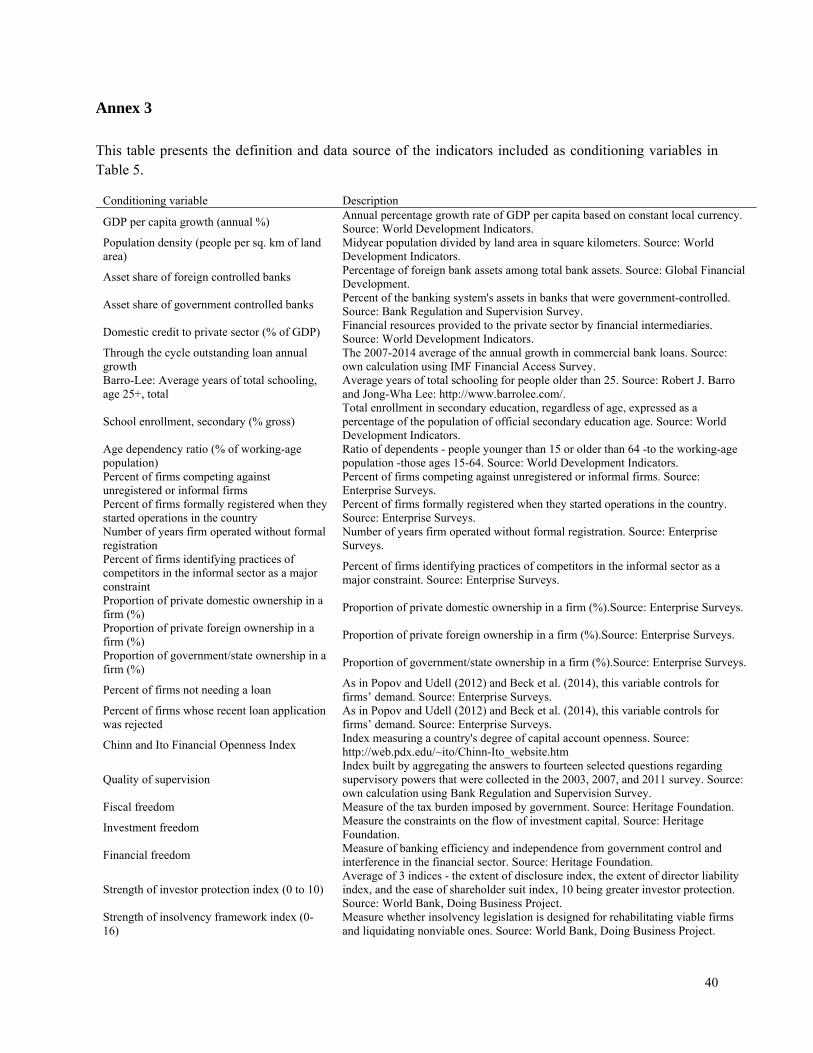
40
Annex 3
This table presents the definition and data source of the indicators included as conditioning variables in Table 5.
Conditioning variable Description
GDP per capita growth (annual %) Annual percentage growth rate of GDP per capita based on constant local currency. Source: World Development Indicators.
Population density (people per sq. km of land area)
Midyear population divided by land area in square kilometers. Source: World Development Indicators.
Asset share of foreign controlled banks Percentage of foreign bank assets among total bank assets. Source: Global Financial Development.
Asset share of government controlled banks Percent of the banking system's assets in banks that were government-controlled. Source: Bank Regulation and Supervision Survey.
Domestic credit to private sector (% of GDP) Financial resources provided to the private sector by financial intermediaries. Source: World Development Indicators.
Through the cycle outstanding loan annual growth
The 2007-2014 average of the annual growth in commercial bank loans. Source: own calculation using IMF Financial Access Survey.
Barro-Lee: Average years of total schooling, age 25+, total
Average years of total schooling for people older than 25. Source: Robert J. Barro and Jong-Wha Lee: http://www.barrolee.com/.
School enrollment, secondary (% gross) Total enrollment in secondary education, regardless of age, expressed as a percentage of the population of official secondary education age. Source: World Development Indicators.
Age dependency ratio (% of working-age population)
Ratio of dependents - people younger than 15 or older than 64 -to the working-age population -those ages 15-64. Source: World Development Indicators.
Percent of firms competing against unregistered or informal firms
Percent of firms competing against unregistered or informal firms. Source: Enterprise Surveys.
Percent of firms formally registered when they started operations in the country
Percent of firms formally registered when they started operations in the country. Source: Enterprise Surveys.
Number of years firm operated without formal registration
Number of years firm operated without formal registration. Source: Enterprise Surveys.
Percent of firms identifying practices of competitors in the informal sector as a major constraint
Percent of firms identifying practices of competitors in the informal sector as a major constraint. Source: Enterprise Surveys.
Proportion of private domestic ownership in a firm (%)
Proportion of private domestic ownership in a firm (%).Source: Enterprise Surveys.
Proportion of private foreign ownership in a firm (%)
Proportion of private foreign ownership in a firm (%).Source: Enterprise Surveys.
Proportion of government/state ownership in a firm (%)
Proportion of government/state ownership in a firm (%).Source: Enterprise Surveys.
Percent of firms not needing a loan As in Popov and Udell (2012) and Beck et al. (2014), this variable controls for firms’ demand. Source: Enterprise Surveys.
Percent of firms whose recent loan application was rejected
As in Popov and Udell (2012) and Beck et al. (2014), this variable controls for firms’ demand. Source: Enterprise Surveys.
Chinn and Ito Financial Openness Index Index measuring a country's degree of capital account openness. Source: http://web.pdx.edu/~ito/Chinn-Ito_website.htm
Quality of supervision Index built by aggregating the answers to fourteen selected questions regarding supervisory powers that were collected in the 2003, 2007, and 2011 survey. Source: own calculation using Bank Regulation and Supervision Survey.
Fiscal freedom Measure of the tax burden imposed by government. Source: Heritage Foundation.
Investment freedom Measure the constraints on the flow of investment capital. Source: Heritage Foundation.
Financial freedom Measure of banking efficiency and independence from government control and interference in the financial sector. Source: Heritage Foundation.
Strength of investor protection index (0 to 10) Average of 3 indices - the extent of disclosure index, the extent of director liability index, and the ease of shareholder suit index, 10 being greater investor protection. Source: World Bank, Doing Business Project.
Strength of insolvency framework index (0-16)
Measure whether insolvency legislation is designed for rehabilitating viable firms and liquidating nonviable ones. Source: World Bank, Doing Business Project.
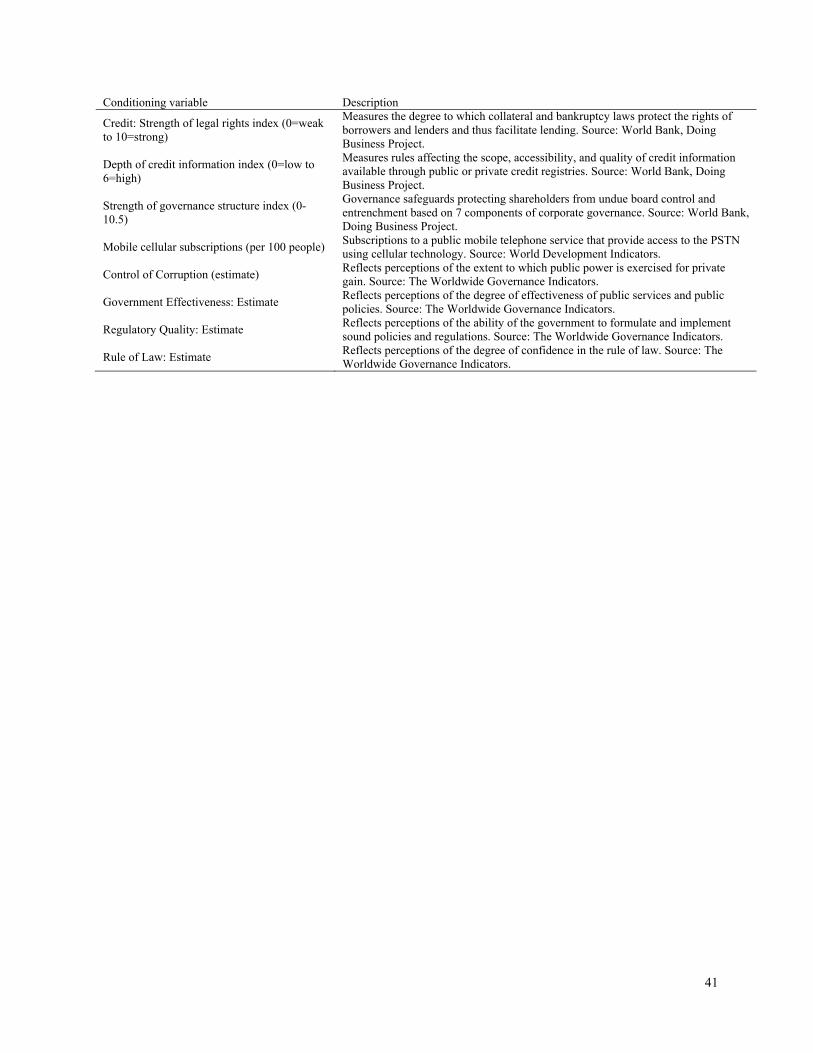
41
Conditioning variable Description
Credit: Strength of legal rights index (0=weak to 10=strong)
Measures the degree to which collateral and bankruptcy laws protect the rights of borrowers and lenders and thus facilitate lending. Source: World Bank, Doing Business Project.
Depth of credit information index (0=low to 6=high)
Measures rules affecting the scope, accessibility, and quality of credit information available through public or private credit registries. Source: World Bank, Doing Business Project.
Strength of governance structure index (0-10.5)
Governance safeguards protecting shareholders from undue board control and entrenchment based on 7 components of corporate governance. Source: World Bank, Doing Business Project.
Mobile cellular subscriptions (per 100 people) Subscriptions to a public mobile telephone service that provide access to the PSTN using cellular technology. Source: World Development Indicators.
Control of Corruption (estimate) Reflects perceptions of the extent to which public power is exercised for private gain. Source: The Worldwide Governance Indicators.
Government Effectiveness: Estimate Reflects perceptions of the degree of effectiveness of public services and public policies. Source: The Worldwide Governance Indicators.
Regulatory Quality: Estimate Reflects perceptions of the ability of the government to formulate and implement sound policies and regulations. Source: The Worldwide Governance Indicators.
Rule of Law: Estimate Reflects perceptions of the degree of confidence in the rule of law. Source: The Worldwide Governance Indicators.
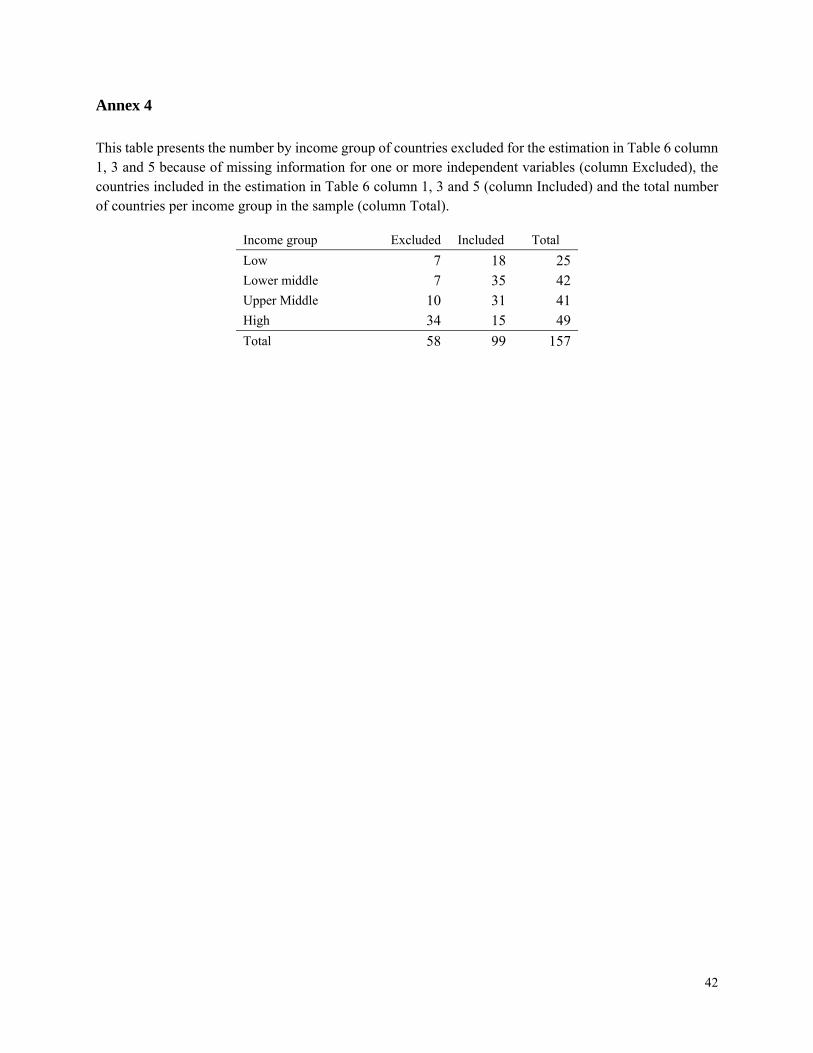
42
Annex 4
This table presents the number by income group of countries excluded for the estimation in Table 6 column 1, 3 and 5 because of missing information for one or more independent variables (column Excluded), the countries included in the estimation in Table 6 column 1, 3 and 5 (column Included) and the total number of countries per income group in the sample (column Total).
Income group Excluded Included Total
Low 7 18 25 Lower middle 7 35 42 Upper Middle 10 31 41 High 34 15 49 Total 58 99 157
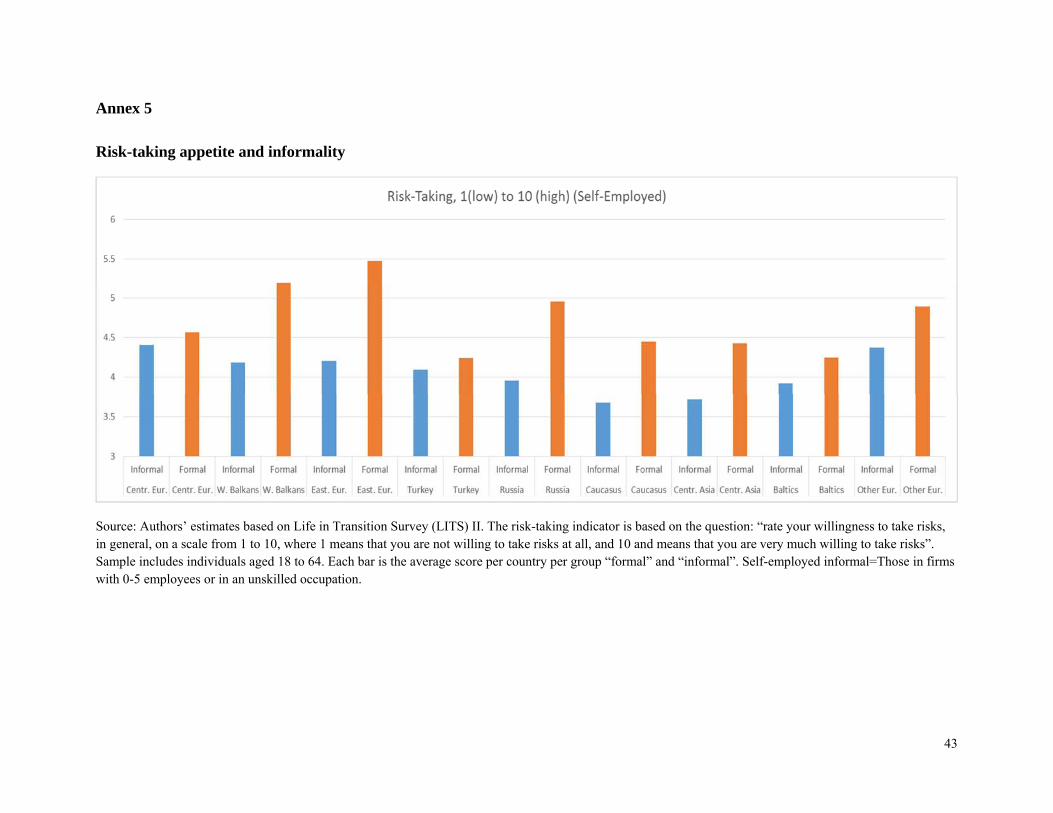
43
Annex 5
Risk-taking appetite and informality
Source: Authors’ estimates based on Life in Transition Survey (LITS) II. The risk-taking indicator is based on the question: “rate your willingness to take risks, in general, on a scale from 1 to 10, where 1 means that you are not willing to take risks at all, and 10 and means that you are very much willing to take risks”. Sample includes individuals aged 18 to 64. Each bar is the average score per country per group “formal” and “informal”. Self-employed informal=Those in firms with 0-5 employees or in an unskilled occupation.