THE NEXT PLATFORM FOR GROWTH IN WEST AFRICA
37
THE NEXT PLATFORM FOR GROWTH IN WEST AFRICA October 2020 Investor Presentation
Transcript of THE NEXT PLATFORM FOR GROWTH IN WEST AFRICA

THE NEXT PLATFORM FOR
GROWTH IN WEST AFRICA
October 2020Investor Presentation

| 1
Disclaimer
This Presentation is for information purposes in connection with African Gold Group Inc.’s known as “AGG” or the “Company”(s) preliminary business plan only. While the information contained herein hasbeen prepared in good faith, neither the Company nor any of its shareholders, directors, officers, agents, employees, consultants or advisers give, have given or have authority to give, any representationsor warranties (express or implied) as to, or in relation to, the accuracy, reliability, completeness or suitability of the information in this Presentation, or any revision thereof, or of any other written or oralinformation made or to be made available to any interested party or its advisers (all such information being referred to as "Information") and liability therefore is expressly disclaimed.
Accordingly, neither the Company nor any of its shareholders, directors, officers, agents, employees, consultants or advisers, take any responsibility for, or will accept any liability whether direct or indirect,express or implied, contractual, tortious, statutory or otherwise, in respect of the accuracy or completeness of the Information or for any of the opinions contained herein or for any errors, omissions ormisstatements or for any loss, howsoever arising or out of or in connection with the use of this Presentation. Each party to whom this Presentation is made available must make its own independentassessment of the Company and the Presentation after making such investigations and taking such advice as may be deemed necessary. Any reliance placed on the Presentation is strictly at the risk ofsuch person relying on such Presentation.
This Presentation may contain forward-looking statements regarding the Company and its subsidiaries. These statements are based on various assumptions made by the Company. Such assumptions aresubject to factors which are beyond our control and which involve known and unknown risks, uncertainties and other factors which may cause our actual results, performance or achievements to bematerially different from any future results, performances or achievements expressed or implied by the forward-looking statements. Forward-looking statements may in some cases be identified byterminology such as “may”, “will”, “could”, “should”, “expect”, “plan”, “intend”, “anticipate”, “believe”, “estimate”, “predict”, “potential” or “continue”, the negative of such terms or other comparableterminology. These forward-looking statements are only predictions. Actual events or results may differ materially, and a number of factors may cause our actual results to differ materially from any suchstatement. Such factors include among others general market conditions, demand for our products, development in reserves and resources, unpredictable changes in regulations affecting our markets,market acceptance of products and such other factors that may be relevant from time to time.
Although we believe that the expectations and assumptions reflected in the statements are reasonable, any person relying on such Information and Presentation are cautioned that we cannot guaranteefuture results, levels of activity, performance or achievement. In preparing this Presentation and except as required by law, we do not undertake or agree to any obligation or responsibility to provide therecipient with access to any additional information or to update this Presentation or Information or to correct any inaccuracies in, or omission from this Presentation or to update publicly any forward-looking statements for any reason after the date of this Presentation to conform these statements to actual results or to changes in our expectations.
This Presentation does not constitute an offer or invitation to sell, or any solicitation of any offer to subscribe for or purchase any securities of the Company and its subsidiaries and nothing contained hereinshall form the basis of any contract or commitment whatsoever. Copies of this Presentation should not be distributed to any affiliates, third parties or indirect recipients in any manner whatsoever. Thedistribution of this Presentation in or to persons subject to other jurisdiction may be restricted by law and persons into whose possession this Presentation comes should inform themselves about, andobserve any such restrictions. Any failure to comply with these restrictions may constitute a violation of the laws of the relevant jurisdictions.
This Presentation is strictly confidential and may not be reproduced, disseminated or used without the express and written consent of the Company. The Information in this Presentation concerning thebusiness and its affairs, shareholders, directors, officers, agents, employees, consultants or advisers or any other matter must be kept confidential at all times. If the Company suffers loss, damage or liabilityof any kind in connection with your breach of the restriction on reproduction or use, you will indemnify the Company from and against such loss, damage or liability.

| 2
OverviewAfrica’s Next Leading Gold Company
African Gold Group is a TSX-V listed gold company with a clear vision to become Africa’s next mid-tier producer. The Company’sKobada Gold Project is a construction ready project located in Southern Mali with a recently completed definitive feasibility studyand a target to produce 100,000 oz per annum of gold by Q2 2022.
Experienced management team and independent board
Proven track record in the financing, construction and operation of mines in Africa01
TSX-V: AGG
Near-term gold producer
Low-cost development and extraction with high margin gold production in a mining friendly jurisdiction
02
Significant exploration upside
Less than 15% of identified shear zones in Kobada property drilled and significant exploration potential in Madougou option
03
Significant upside share price potential for investors
Under-valued to our peers, fully-permitted, ready for construction04
Potential to significantly increase resource in next 9-12 months
Phase 3 exploration drilling commenced in September 2020 – targeting conversion of inferred resources, strike extension and greenfields targets
05
Clear strategy for growth and adding shareholder value
Focus on organic growth from existing assets and disciplined M&A opportunities 06

| 3
Scott Eldridge | Chairman of the BoardAn accomplished executive with international experience in raising project finance debt and equity for mining projects. He co-founded Euroscandic International Group Inc., a private company offering merchant banking and advisory services, and washead of Debt Advisory. Mr. Eldridge has served as VP Finance and CFO of Amarillo Gold Corp, President and CEO of Arctic StarExploration Corp and is CEO of Canarc Resource Corp.
Jan-Erik Back | Vice-ChairmanFormer Chief Investment Officer for Eurasian Resources Group with a specific focus on the financing and development of ERG’sportfolio of copper and cobalt assets in Africa. Mr. Back has extensive experience in financial markets and has served as GlobalHead of Investments and Structured Finance Group at BTG Pactual Commodities and previously spent over 10 years with theHatch Group with a focus on project financing for mining projects.
John Begeman | Lead Independent DirectorCurrent Director and Chairman of Premier Gold Mine and Director of Yamana Gold Inc. Former President and CEO of AvionGold, President, CEO and Director of Valencia Ventures, COO of Zinifex Canada, VP Western Operations for Goldcorp.
Danny Callow | DirectorMining Engineer with 28 years experience of building and operating mines in Africa. Board experience includes Katanga Mining,QuestCap International and Eurosun. Former head of Glencore Copper and Cobalt African division.
Hon. Pierre Pettigrew | DirectorExecutive Advisor, International at Deloitte Canada. Chair of the Board for the Asia Pacific Foundation of Canada (APFC). He wasalso the Government of Canada special envoy for the Canada-European Union Trade Agreement (CETA). Pierre served as aMinister for 10 years, most notably as Minister of Human Resources Development, as Minister for International Trade and ForeignMinister.
Board of DirectorsHighly Experienced and Independent Board
TSX-V: AGG

| 4
Danny Callow | President, Chief Executive Officer and DirectorProfessional mining engineer with over 25 years of experience in building and operating mines in Africa. Mr. Callow was Head ofAfrican Copper Operations for Glencore PLC., Chief Executive Office and Executive Director of Katanga Mining Limited andChief Executive Officer of Mopani Copper Mines PLC. Mr. Callow is a professional mining engineer and holds an MBA fromHenley Management College and a Bachelor (Hons) of Mining Engineering from the Camborne School of Mines as well as non-executive director professional diploma from FT-London. Mr. Callow has overseen more than $2.5bn in greenfield andbrownfield mining projects from conception through to full production and steady state operations.
Ryan Ptolemy | Chief Financial OfficerCPA, CGA, and CFA holder with +15 years of experience in the public and private sector. Has served as CFO on a number ofcompanies in the mining sector, particularly exploration and development stage companies.
Dr. Andreas Rompel | VP ExplorationThree decades of exploration and mining experience in a wide range of roles. Has worked in a variety of commodities, includingprecious metals and base metals as well as coking coal and cobalt. Previously, Dr. Rompel worked in the Birimian as a structuralgeologist with Anglo American in Mali, Senegal and Cote d’Ivoire.
Daniyal Baizak | VP Corporate DevelopmentBusiness consultant with considerable experience providing financial and strategic advice on mergers and acquisitions andmanaging multiple projects for a variety of private and public companies.
Sékou Konate | Country ManagerOver 22 years as a civil servant working for the Malian Ministry of Public Works and Transportation. Over 20 years of experiencefacilitating exploration and mining activities in Mali.
TSX-V: AGG
Key Management Proven Track Record in Financing, Construction and Operation of Mines

| 5
Capital StructureAfrican Gold Group is Undervalued Relative to Peer Group
Source: Broker research as of June 11, 2020
Basic Shares Outstanding 148.9 M
OptionsStrike Price: C$0.23 - C$0.28
12.2 M
WarrantsStrike Price: C$0.25 - C$0.40
64.5 M
Market CapitalizationAs of Aug 12, 2020
~C$33 M
Fully Diluted 225.7 M
Share Structure Shareholder Structure
EV/Total Resources (US$/t) (Emerging Developers)
TSX-V: AGG
Major Shareholders
139130
6856 54
4229 25 23 19 18 17 15 10 8
0
20
40
60
80
100
120
140
160
Pure
Gold
Min
ing
No
vaG
old
Reso
urc
es
Go
ld S
tan
dard
Ve
ntu
res
Sab
ina
Go
ld &
Silv
er
Mara
thon
Go
ld C
orp
We
st K
irkla
nd
Min
ing
Ch
aa
rat
Go
ld H
old
ings
Belo
Sun
Min
ing
Ca
rdin
al R
eso
urc
es
Ore
zo
ne
Go
ld
Ga
bri
el R
eso
urc
es
KE
FI
Min
era
ls
Orc
a G
old
Afr
ican
Go
ld G
roup
Ore
a M
inin
g C
orp
17%
18%
65%
Management & Insiders
Institutional Investors
Other

| 6
TSX-V: AGG
New management team appointed
Phase 1 Drilling Complete – better than expected results
Company announces appointment of new Chairman and Vice-Chairman
BURKINA
FASOAug `19 Sep `19 Oct `19 Nov `19 Dec `19 Jan `20 Feb `20 Mar `20 Apr `20 May `20 Jun `20 Jul `20 Aug `20
SENET appointed to oversee independent DFS
Drilling campaign commences
Intersect 124 g/t Au over 1m and 6.14 g/t Au over 21m
Intersects 3.6 g/t Au over 9.8m
Intersect 2.14 g/t Au over 16m and new discovery at Gosso Target
Canaccord appointed as Financial Advisor
Robust updated 100koz DFS delivered on time and 20% below budget
Company closes oversubscribed private placement for $11.1 mln
NEXT 6 MONTHS – DUAL FOCUS – INCREASE RESOURCE AND RAISE PROJECT CAPITAL
Infill drilling to upgrade resource
London/Europe roadshow (Canaccord)
Extension of strike drilling commences
New shear zone discovery drilling commences
Updated Resource/Reserve statement released
September 2020 October 2020 November 2020 December 2020 January 2021 February 2021 March 2021
Beaver Creek Conference
Mining Journal
Select (Nov 2-3, 2020)London/Europe roadshow (Canaccord)
LAST 12 MONTHS – SIGNIFICANT PROGRESS MADE
Kobada Gold ProjectSignificant Achievements in a Short Period of Time

| 7
Kobada Gold Project | Overview
BURKINA
FASO
BURKINA FASO
Kobada Gold
Project
MAURITANIA
CÔTE
D'IVOIREGHANA
GUINEA
Economically Attractive Project
- Pre-tax IRR of 45.5% and NPV5% of US$284 mln
- Post-tax IRR of 41.1% and NPV5% of US$226 mln
Near Term Gold Producer
- Targeted start of construction in Q4 2020, first gold in Q2 2022
- DFS completed to high engineering standard with firm quotes from equipment providers
- 3 Mtpa plant with annual gold production of 100,000 ounces at an AISC of US$782/oz over LOM
Low construction cost and cost profile
- Simple contractor driven mine plan and Gravity + Carbon-in-Leaching (“CIL”) processing plant with atotal capital cost of US$136 mln (including contingency)
- Predominantly a “free-dig” mining operation with LOM Operating Cost of US$704/oz
Large and Growing Mineral Resource
- Measured & Indicated: 1.2 Moz Au @ 0.86 g/t | Inferred: 1.1 Moz Au @ 1.33 g/t
- Proven & Probable: 754,800 oz Au @ 0.87 g/t
Fully Licensed and Permitted
- Mining license is valid until July 31, 2045
Significant Upside Potential
- Only 4 km within a larger 30 km shear zone has been drilled to date
- Opportunity to quickly convert 575,000oz of inferred oxide resource
Source: AGG Press release as of June 17, 2020
US$782/ozAll-in Sustaining Cost
100,000 ozTargeted Annual Production
10+ yearsTargeted Mine Life
US$408 millionPre-tax Project Cashflows
TSX-V: AGG

| 8
Kobada Gold Project | 2020 Definitive Feasibility Study
LOM Tonnage Ore Processed t (000) 27,134
LOM Feed Grade Processed g/t 0.873
Production Period Years 9.4
LOM Gold Recovery % 95.7%
LOM Gold Production Oz (000) 728.7
Gold Price US$/oz 1,530
Revenue US$mln 1,114
Total Initial Capital Cost (including contingency) US$mln 136.1
LOM Operating Costs US$/oz 704
Discount Rate % 5%
Discounted Payback Period Years 3.82
Project Net Cash US$mln 325.7
AISC US$/oz 782
NPV US$mln 226
IRR % 41.1%
Mine Model Summary (After-tax)
Key Project Metrics Sensitivities to Gold Price
Average Gold Price (US$/oz)
1,301 1,377 1,530 1,683 1,760
NPV @ 5% (After Tax) US$mln 124 158 226 294 329
IRR % 25% 31% 41% 51% 56%
Cash Flow Payback Years 5.17 4.63 3.82 3.38 3.21
Maximum Funding US$mln 138.20 138.02 137.61 137.21 137.01
- The mine plan targets higher grade ore zoneat the early phase of the project to feed intothe process plant in order to produce100,000 oz per annum for the first 5 years,and thereafter lower production output asthe grade drops and stockpiles are treated
- Over the life of the project, 27.13 Mt of orewill be mined and delivered to theprocessing facility
- Stripping ratio of 2.67:1 over LOM
TSX-V: AGG

| 9
Kobada Gold Project | Resource and Reserve Estimate
Reserve ClassificationTonnage 1
(Mt)Grade(g/t)
Contained Gold(kg)
Contained Gold(oz)
Proven 2 11.04 0.95 10,460 336,300Probable 2 16.09 0.81 13,017 418,500
Proven and Probable 2,3,4 27.13 0.87 23,476 754,800
Resource ClassificationTonnage
(Mt)Grade(g/t)
Contained Gold(kg)
Contained Gold(oz)
Measured 24.63 0.79 18,379 590,910Indicated 22.02 0.95 18,673 600,350
Measured & Indicated 46.66 0.86 37,052 1,191,270
Inferred 31.54 1.33 35,421 1,138,810
Notes:1. Numbers may not add due to rounding2. Mineral reserves were estimated using a gold price of US$1,450 per ounce of gold3. The Cut-off Grade used to estimate the Mineral Reserves was 0.37 g/t, with a dilution of 5%4. Only Laterite, Oxide and Transition material from the Measured and Indicated Resource Categories were considered for the Reserve Estimate
Notes:1. Pit constrained mineral resources were estimated at a cut-off grade of 0.35 g/t Au2. Mineral resources were estimated using long-term gold price of US$1,600 per ounce of gold3. Geological losses applied to mineral resource classification of 5% Measured, 10% Indicated and 15% Inferred4. A recovery of 95% for gold was used5. Only resources within the resource pit are declared6. The Mineral resource is inclusive of mineral reserves7. Numbers may not add due to rounding
TSX-V: AGG

| 10
Kobada Gold Project | Low Capital and Operating Costs vs Peers
Source: S&P Intelligence and Company Reports
TSX-V: AGG
MALI
- Kobada is one of the lowest capital and operating costundeveloped projects in West Africa
- Additional exploration upside to increase resource size and lifeof mine
- Kobada is one of the few development projects not currentlyowned by a major or a mid-tier gold producer
Kobada Gold
Project
Singida
Mato Bula
Kobada
Enchi
Nabanga
SegilolaTijirit
Wa-Lawra
Kouroussa
Kalana
Seguela
Bombore
Dugbe 1
Boto
Block 14
Nyanzaga
Massawa
Namdini
$600
$650
$700
$750
$800
$850
$900
$950
0 5 10 15 20 25
AIS
C (
US
$/o
z)
Mine Life (Years)
Capital and Operating Costs v West African Peers
Initial capex <$150m
Initial capex >$150m
All-in-Sustaining Cost (AISC/oz)
981949 943
916
871
821800 789 782 779
702
0
100
200
300
400
500
600
700
800
900
1,000
Pe
rseus
Asanko
Te
ranga
Resolu
te
Centa
min
Gold
en S
tar
Se
mafo
En
deavour
AG
G
B2
Go
ld
Roxgold
- Once in production, AGG will be one of the lowest costproducers in West Africa
- Kobada’s low cost base provides investors with some of thehighest leverage to gold price in the region
- Kobada will act as AGG’s platform for additional growth andconsolidation in West Africa

| 11
A comprehensive 10,000m exploration campaign has been designed by the management of the Company and will target the following:
• Phase 1 - Resource Upgrade – within 9 months - Target conversion of 575,000oz inferred oxides within 4km main shear zone- Inferred ounces are shallow, in a highly prospective gap area- High level of confidence to convert to M&I resource and therefore reserve
• Phase 2 - Strike Extension Main Shear Zone - Next 12 months- Regional exploration (and artisanal workings) indicates further 6-8km potential north of current
resource on main shear zone- 3 “step-out” holes in Feb 2020 indicated strong potential high-grade extension currently not
included in the resourceo 22.20m at 5.25 g/t Au from 78.40m to 100.6mo 23.80m at 1.57 g/t Au from 110.50m to 134.30m
• Phase 3 – Increase resource from new identified shear zones – Next 24 months- Gosso target situated 5km to east of main shear zone- High grade grab samples up to 4.6g/t- Comprehensive RC and DD drill programme to delineate extent of shear zone- Regional exploration indicates potential for a 5-9km new shear zone
• Drill phases will run concurrently – started on 12th September 2020
• Re-run resource/reserves at current gold price (previously done at US$1450/oz)
Geochemical, geophysical or
structural exploration target
0 5 10
Scale in km
Area drilled to date
Phase 1
Phase 2
Phase 3
Faraba
Kobada Est
Kobada
Exploration3 Phase Approach to Rapid Increase in Resource

| 12
TARGET – CONVERSION OF 575,000oz INFERRED OXIDES
- Near-mine resource drilling
- In-fill drilling of oxides in gap areas to convert to M&I
- The drilling of the inferred resources in oxides will concentrate around the highlighted area (blue = inferred, plan view).
- Target high confidence conversion to reserves to increase LOM to 10+ years
- Drilling contractor ready to drill – exploration drill program finalized
- Start date – September 2020
Section view
Plan view
Highly prospective “gap” area
ExplorationPhase 1 - Fast-Tracked Resource Upgrade

| 13
TARGET – EXTEND STRIKE NORTH ALONG CONTINUOUS MINERALISED ZONE
- Last 3 holes of Phase 2 campaign intersected exceptional results to north of Resource shell on Main Shear Zone
- Step out drilling expected to increase strike length of existing resource pit from 4km significantly
- Drill plan will follow the continuity of the Main Shear Zone into Faraba concession
- Historical artisanal workings show the extent of the continuity for many kilometers
Current 2.3Moz
Resource Pit
Drilling plan to
Extend Strike north
+/- 5-6kmAdditional strike
ExplorationPhase 2 – Extension to Main Shear Zone

| 14
TARGET – DEVELOP UNDERSTANDING OF GOSSO POTENTIAL THROUGH DRILLING
- A test pit has been excavated on the Gosso target, located ~5 km to the East of our current resource pit.
- Mineralization at the Gosso target appears to be identical in structure to the main shear zone and reinforces the prospect of multiple mineralized deposits.
- The Gosso target has shown positive gold value assay results from grab samples.
- The Gosso target will be drill tested to estimate the mineralization and its extent along the shear.
- The Company intends to diamond drill to the north and the south, stepping away from the know fault location in the outcrop.
Grab samples from Gosso target:
- Sample #207470 returned 1.10 g/t Au
- Sample #207471 returned 3.16 g/t Au
- Sample #207473 returned 4.60 g/t Au
- Sample #207475 returned 1.87 g/t Au Open Pit outline at Gosso
0 100
Meters
ExplorationPhase 3 – Exciting Early Results

| 15
Resource ClassificationTonnage
(Mt)Grade(g/t)
Contained Gold(kg)
Contained Gold(oz)
Measured 17.07 0.81 13,087 420,750Indicated 15.06 0.98 13,209 424,670
Measured & Indicated 32.13 0.89 26,296 845,420
Inferred 15.81 1.34 17,879 574,850Notes:1. Pit constrained mineral resources were estimated at a cut-off grade of 0.35 g/t Au2. Mineral resources were estimated using long-term gold price of US$1,600 per ounce of gold3. Geological losses applied to mineral resource classification of 5% Measured, 10% Indicated and 15% Inferred4. A recovery of 95% for gold was used5. Only resources within the resource pit are declared6. The Mineral resource is inclusive of mineral reserves7. Numbers may not add due to rounding
Re-calculate RESERVE MODEL at higher gold price to bring in additional marginal ounces (currently at $1450)
GAP AREA
ExplorationRe-run Resource/Reserves at Higher Gold Price

| 16
Kobada Gold Project | Fast-tracked Development Timeline
2020 2021 2022
Key Milestones ScheduleQ4 Q1 Q2 Q3 Q4 Q1 Q2 Q3 Q4
Detailed engineering
Procurement and contracts administration
Earthworks mobilization and completion
Placement of orders for long-lead delivery items
Mobilization and SMPP / E&I construction
Mill delivered to site
TSF construction
Construction of solar plant available for start of production
ROM material ready to feed ROM bin
Construction complete
Commissioning complete
First gold from CIL circuit
Ramp-up to 100 % of nameplate production
TSX-V: AGG

| 17
ESG Commitments | Our Social License to Operate
Environmental and Social Impact Assessment (ESIA)- Environmental permit under Malian rule was granted in 2015 covering mining, process
plant, TSF and infrastructure- Currently undergoing review to extend the permit under new mine parameters
(expected to take no more than 2 months)- ESIA study will be prepared in accordance to the IFC and World Bank guidelines
Environmental and Social Management Plan (ESMP)- Detailed ESMP in development as part of on-the-ground strategy- Communication ongoing with local community Chiefs to align requirements- Initial needs through consultation have been developed- Initial phase during exploration:
• Labor being sourced from local villages where skills are available• Majority of expenditure from suppliers registered in Mali• Procurement of local goods and services• Focus on utilizing local and regional suppliers and contractors• Malaria control, HIV and STIs education will become part of the AGG`s CSR model
ESMP development and implementation will target and include:• Health, hygiene, sanitation• Education• Agriculture• Forestry• Employment and development of local business• Access to safe drinking water• Infrastructure
TSX-V: AGG

| 18
“This will enable the Kobada Gold Projectto significantly reduce its environmentalimpact while ensuring reliable powersupply”
“We take environmental, social andgovernance ‘ESG’ initiatives seriously,and by installing this hybrid plant, wemove closer to operating a sustainableand responsible mining operation at ourflagship Kobada Gold Project”
Danny Callow
Chief Operating Office
Strategic Partnership
- Strategic partnership with DRA NEXUS and SENERGY to build and install a highly efficienthybrid power solution
- Fully financed by strategic partners with an “over-the-fence” power solution for Kobadamine at a low unit rate of power
- Hybrid power plant will combine photovoltaic solar panels, thermal generators and abattery energy storage system (BESS)
Environmental Sustainability
- Significant annual power savings over a conventional thermal power system of more than22% or US$5 million on cost of power• AGG hybrid power cost of ~$0.15/kWh vs average diesel power cost in West Africa
of ~$0.30/kWh
- Significant pollution reduction:• Over 5 million litres of heavy fuel oil (HFO)• Over 14 million kg of carbon dioxide emissions• Over 8,000 kg of carbon monoxide emissions• Over 720 kg of unburned hydrocarbons• Over 34,000 kg of sulfur dioxide• Nearly 62,000 kg of nitrogen oxides
TSX-V: AGG
Hybrid Power Plant | Reducing Our Environmental Footprint

| 19
TSX-V: AGG
ESG Sustainable Investment | And Conformance to Legislation
“This recent multiplication in Environmental, Social and Governance standards and the engagement by investors, customers and other stakeholders represents a step change, but if the responsible production of metals and minerals is to become the new norm, we need to see an acceleration of their uptake and implementation.
This is the only way to both level the ESG playing field and enhance the industry’s contribution to achieving the UN’s Sustainable Development Goals.”
Financial Times
Strategic Partnership with SAFE Ltd, company specialising in:
- providing best in class advice and solutions for companieslooking for provenance and transparency in their supplychains
- advice on current and impending regulations
- and improvement in ESG standards
SAFE Ltd combines expertise
- through legal partners skilled in conflict minerals legislation,
- supply chain and operational personnel with decades ofexperience in logistics of commodities in challengingcountries worldwide,
- technology partners able to put in place “best-in-class”systems that may or may not include blockchain technology.
Legislation and Investment decisions driving behaviour
- EU Conflict Minerals Act, in full force by Jan 2021
- Focus on 3TG minerals (tin, tantalum, tungsten and gold
- Sustainable investing – a mix of traditional investing and a mixof ESG factors for responsible investing
- Step change in targeting the habits of socially consciousinvestors
“The EU’s Conflict Minerals Regulation, which will come into force in 2021, aims to restrict the trade of minerals that are mined via forced labour and used to finance armed conflicts.
…it has global scope (to minimise the effect of stigmatising one region);
…and it focuses on inclusion instead of exclusion (in that companies need to demonstrate measures they have taken to improve the situation rather than declare themselves ‘conflict-free’).”
London School of Economics
Commercial ExpectationsRegulatory Overhauls
“The Company intends to work with SAFE Ltd and itsinternational partners to develop a complete
solution which will provide full oversight of theproduction of gold through to the end-user.”

| 20
Mali | Africa`s 3rd Largest Gold Producer
Well-Established Mining Industry
- Long and successful history of gold production
- Highly developed active mining culture with majorinternational companies operating in the country fordecades (IAMGOLD, AngloGold Ashanti, etc)
- Gold exports accounted for nearly 70% of Mali`s totalexports in 2016
Stable & Mining Friendly Jurisdiction
- Transparent system of mineral & surface title
- Political and social support of mining with stated ambitionsto develop mineral resources
- Mining industry is one of the largest contributors to thecountry`s GDP
Security
- Kobada Gold Project is located in the Sikassoadministrative region near the border with Guinea
- Southern Mali is considered to be a stable environment,with security risk rated at low to medium
Kobada 2.2 Moz
Source: WorldBank, Topicworx
TSX-V: AGG
| 21
Equity raises for gold companies over 2006 - 2016
79Moz
50Moz
42Moz
33Moz27Moz 27Moz
23Moz 22Moz 20Moz 18Moz 16Moz 16Moz 15Moz 13Moz 13Moz 11Moz
WestAfrica
Colombia Chile Canada USA Russia BurkinaFaso
Ecuador Mongolia Mexico Ghana China Australia Mali Coted`Ivoire
SouthAfrica
Discoveries by area over 2006 – 2016
$9.82B
$6.35B$5.89B
$3.66B
$1.69B$1.16B $0.82B
$0.35B
Canada West Africa Australia USA China Mexico Colombia Chile
+79 MozDiscovered over the past 10 years
in West Africa
+6.35 BEquity raised over the past 10 years
Source: SNL Metals & Mining, Endeavour Mining
TSX-V: AGG
West Africa Insights | An Established Mining Region

| 22
Mali | Mining Friendly Jurisdiction with Strong Govt Support
2016 Gold production by region
+81%West African
production growth over past 15 years
15Moz
9Moz 9Moz
8Moz
7Moz
5Moz 5Moz 5Moz
4Moz
3Moz 3Moz 3Moz
0
2
4
6
8
10
12
14
16
China Australia Russia West Africa United States Peru South Africa Canada Mexico Indonesia Brazil Ghana
West Africa operates as an economic union (UEMOA)
- Mali and Burkina Faso are part of the West African Economic and Monetary Union,established to promote economic integration of the member states by enhancing thecompetitiveness of their economies in the framework of an open and competitive market,and a streamlined and harmonized legal environment
- Common central bank and currency (CFA franc) pegged to the Euro for 8 member states
- Customs union between member states and common external tariff
BURKINA
FASO
BURKINA FASO
Kobada
Gold
Project
MAURITANIA
CÔTE
D'IVOIREGHANA
GUINEA
MALI
NIGER
BENIN
TOGO
SENEGAL
GUINEA-
BISSAU
Source: World Gold Council, SNL Metals & Mining
TSX-V: AGG
| 23
StrategyClear Strategy for Growth and Adding Shareholder Value
Early Cashflow
• Advance Kobada Gold Project into production and start generating cash flow
• Targeted start of construction in H2 2020
• 100,000 oz production, with first gold in Q2 2022
Organic Growth
• Continue expanding vastly untapped resource base at Kobada Gold Project to increase production output and mine life
Disciplined M&A
• Disciplined acquisition of additional projects in line with our strategy
• The Company is continuously assessing various exploration licenses and gold projects
TSX-V: AGG

| 24
Financing Committee established by the Board of Directors
- Includes Company Chairman, Vice-Chairman, VP Corporate Development and CEO
Retained Canaccord Genuity as an independent financial advisor
- One of the leading mining focused investment banks with a presence in all key financial markets
- Over US$1.4 bn raised for gold companies in the past 12 months
Funding strategy to encompass the Company’s overall financing requirements for the next 24 months
- Construction financing for Kobada Gold Project
- Financing for continued drilling at Kobada and Madougou
- Corporate working capital requirements
Coordinated process to secure required financing already commenced with discussions underway
- Primary focus on confirmation of debt capacity and terms to maximize shareholder returns
- Discussions include traditional project financing as well as structured debt products (e.g. royalties, prepayments, etc)
- Unsolicited debt funding proposals already received and under review by Financing Committee
Further financing updates to be provided to the market in due course
Financing StrategyProject Construction Financing Discussions Underway

| 25
Investment Case | Robust DFS With Significant Upside
First gold targeted 19 months after construction beginsNear term gold
producer
Compelling economics
Undervalued
Experienced management
Exploration potential
Clear strategy for growth
Pre-tax IRR of 45.5% and NPV5% of US$284 mlnAnnual gold production of 100,000 ounces at an AISC of US$782/oz over LOM
Undervalued relative to peers with significant share price potential
Proven track record in the financing, construction and operation of mines in Africa
Over 46,000 hectares of prospective exploration concessionsLess than 15% of identified shear zones in Kobada property have been drilled
Focus on organic growth from existing assets and disciplined M&A opportunities

Contact InformationDaniyal Baizak, VP Corp. Development 800-65 Queen Street West, Toronto, ON, M5H 2M5
Email: [email protected]: +(1) 647-835-9617www.africangoldgroup.com
TSX-V: AGG | FRA: 3A61 | OTCQX: AGGFF

Appendix | DFS Detailed Information
| 28
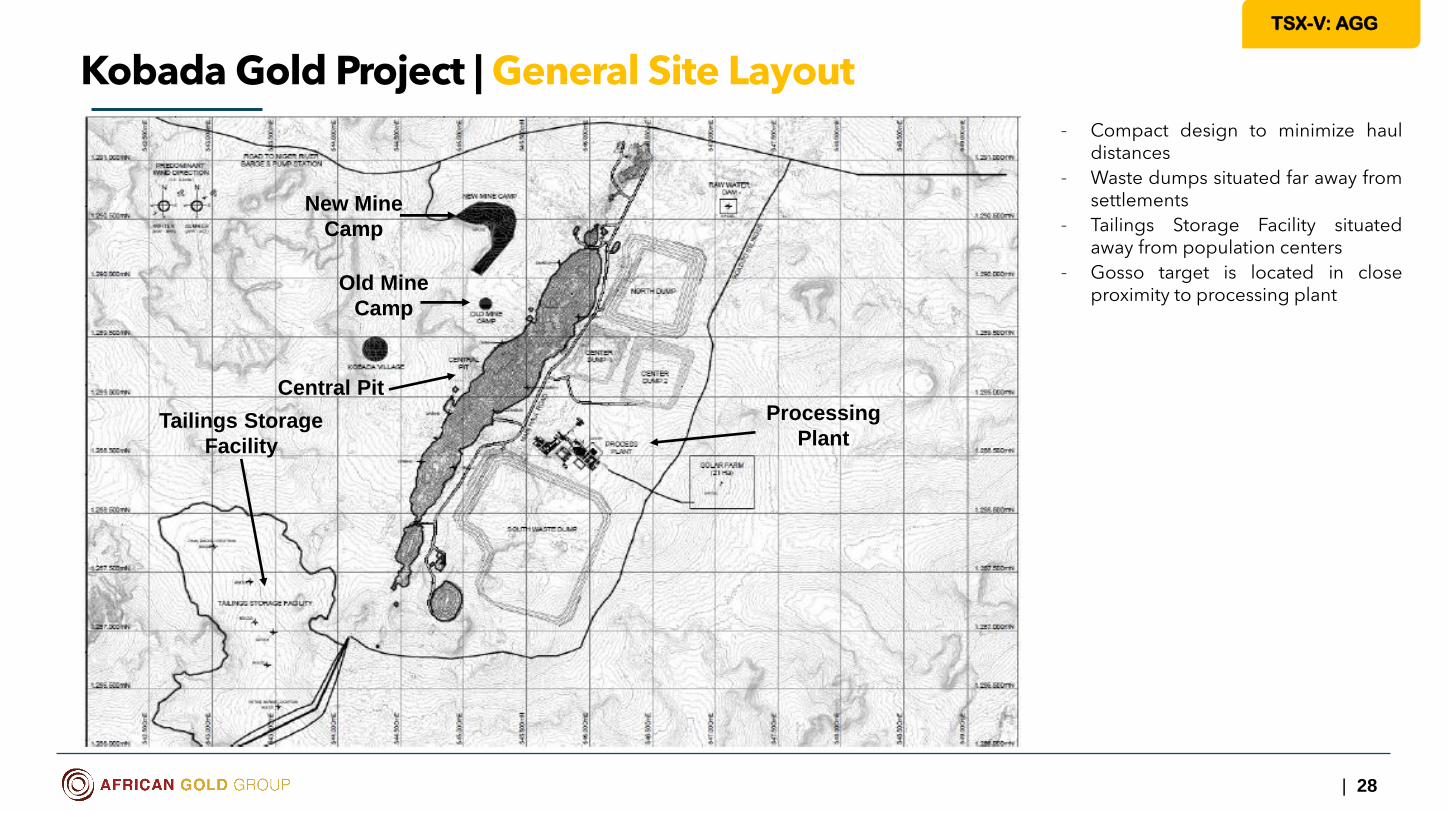
Kobada Gold Project | General Site Layout
- Compact design to minimize hauldistances
- Waste dumps situated far away fromsettlements
- Tailings Storage Facility situatedaway from population centers
- Gosso target is located in closeproximity to processing plant
TSX-V: AGG
Tailings Storage
Facility
Processing
Plant
New Mine
Camp
Old Mine
Camp
Central Pit

| 29
Kobada Gold Project | Mine Optimization
Key Main Open Pit highlights- 2.6 km long
- 500 m wide
- 185 m maximum depth (oxide and transitional)
- 27 Mt of ore mined
- 72 Mt waste mined
- LOM stripping ratio of 2.67:1
- Deposit is planned to be mined with a standardopen-pit mining methods
- Approximately 90% of the raw material to be mined iscontained in the saprolite and laterite ores, and thevast majority will be free dig (>90%)
- The mining operations will be undertaken by aspecialized contractor
Central Pit
South
Satellite Pit
North
Satellite
Pit
TSX-V: AGG
Typical Section Through Kobada Open Pit Pit Layouts

| 30Source: SENET - SP0800 Kobada Process Plant Report
Kobada Gold Project | General Plant Layout
TSX-V: AGG

| 31Source: SENET - SP0800 Kobada Process Plant Report
Kobada Gold Project | Process Plant Design
- The proposed process plant designis based on a proven andestablished gravity/carbon-in-leachtechnology
- The plant will treat 3 Mtpa of ore toproduce 100,000 oz of gold perannum
- The process plant is designed toexceed 100,000 oz per year ofoutput
- Highly flexible process able to treatvarying ore grades and ore types
TSX-V: AGG

| 32Source: SENET - SP0800 Kobada Process Plant Report
Kobada Gold Project | Tailings Storage Facility
Design parameters for construction- International Commission on Large Dams (ICOLD), Tailings Dams Safety
(Draft)
- Canadian Dam Association (CDA), Dam Safety Guidelines (2013);
- Canadian Dam Association (CDA), Application of Dam Safety Guidelines toMining Dams (2014);
- South African National Standard (SANS) 10286:1998, Code of Practice forMine Residue
- South African Institution of Civil Engineering (SAICE) – Geotechnical Division,Site Investigation Code of Practice (2010)
- HDPE lined, fully-contained three phase construction
- Factor of safety between 1.58 – 1.68 throughout the various phases
TSX-V: AGG

| 33Source: SENET - SP0800 Kobada Process Plant Report
Kobada Gold Project | Capital Cost Breakdown
TSX-V: AGG
Description Capital Cost Contingency
Total Capital Cost
US$ US$ US$
Initial Capital
Mining Pre-Production and Establishment 25,473,951 2,547,395 28,021,346
Plant and Infrastructure 72,291,850 5,505,832 77,797,682
TSF Phase 1 19,134,389 1,913,439 21,047,828
Pre-Production Costs 8,390,148 839,015 9,229,163
Total Initial CAPEX 125,290,338 10,805,681 136,096,019
Initial Capital Cost
Sustaining Capital Cost
Description Capital Cost Contingency
Total Capital Cost
US$ US$ US$
Sustaining Capital
Mining 7,001,057 0 7,001,057
TSF Phases 2 and 3 31,773,642 0 31,773,642
Mine Wide – Resettlement 1,449,706 1,409,270 2,858,976
Mine Wide – Rehab and Closure 10,336,847 494,104 10,830,951
Mine Wide – Post Closure Costs 4,569,702 68,611 4,638,313
Total Sustaining Capital 55,130,954 1,971,985 57,102,939
Maximum Funding Curve – US$ 138 mln – May 2022

| 34Source: SENET - SP0800 Kobada Process Plant Report
Kobada Gold Project | Operating Cost Breakdown
TSX-V: AGG
Operating Cost Breakdown
Projected Discounted Cash Flow After Tax (US$)
Description Life of Mine
US$/t processed
US$/oz
Mining 8.15 303.52
Processing 7.08 143.74
G&A 2.24 83.29
Refining and Transport 0.20 7.59
Royalties 1.23 45.86
Total 18.91 704.01
Sensitivity Analysis

| 35Source: SENET - SP0800 Kobada Process Plant Report
Kobada Gold Project | Mine Closure and Sustainability
Legislation- Conforms to new requirements in 2012 Malian Mining Code
- In line with IFC Environmental Health and Safety Planning for MineClosure Planning
Key components of closure plan- Address beneficial future land use through multi-stakeholder
engagement
- Regularly updated to reflect changes in operations
- Include pos-closure, risk monitoring and aftercare
- Monitor pollutants for up to 5 years after closure
- Include progressive restoration during operations
- Provide rehabilitation funding guarantees to regulatory authorities
TSX-V: AGG
Description Unit Cost
Process Plant and Associated Structures US$ 1,734,684
Waste Rock Dumps, Ore Stockpiles and ROM US$
North Waste Dump US$ 1,531,088
South Waste Dump US$ 4,177,216
Low Grade Ore Stockpiles US$ 900,456
Open Pits US$ 1,142,881
Roads (Internal, Haul and Access) US$ 225,174
Pollution Control Dams US$ 264,959
Tailing Storage Facility US$ 10,302,232
Decommissioning and Post Closure Monitoring
US$ 1,277,850
Sub-Total: Measured Works US$ 21,556,540
Contingency (allowance for unquantified works)
US$(@5%) 562,715
Contractors Preliminary and General Costs US$(@25%) 2,954,256
Project Management, Engineering Design and Environmental Permitting
US$(@5%) 738,564
Total (excluding taxes) US$ 25,812,075

| 36Source: SENET - SP0800 Kobada Process Plant Report
Kobada Gold Project | Opportunities and Risks
Opportunities
- Mineral Resource: Conversion of oxide inferred resource into
measured and indicated – huge potential on pit optimisation
- Exploration Upside: 4 km of 30 km drilled – 5 high quality targets
identified for drilling – significant oxide resource upside
- Construction Schedule Optimisation: Fast-track by ordering long
lead items early – detailed design almost complete
- Marginal Ore: Cut-off grades used are lower than current gold
price – changing this will bring in more marginal ore as economic
- Sulphide Material: Significant sulphide opportunity identified to
warrant future drilling and optimisation
- Underground Mine: Future potential due to deeper sulphides
below the oxides (>300 m deep)
- Transition Ore: More testwork required to improve conservative
approach to transitional ore recoveries
- Gold Price: US$1530/oz was used in a financial model - at current
spot prices NPV increases by more than US$100 million
TSX-V: AGG
Risks
- Gold Price: Gold price is the most sensitive to NPV and IRR. With a
US$1530/oz used versus current spot price, downside risk is limited
- Currency Fluctuations: Risk of these currencies gaining or losing
value, which will affect commodity prices, and project CAPEX and
OPEX. Forward cover would mitigate this
- Country/Political Risk: This includes political unrest, economic
policy changes, legislative and fiscal changes. AGG will ensure
political insurance on all loans for the duration of the Project
- Logistics: Border closures could delay critical logistics. Numerous
routes in through multiple ports using established Malian freight
providers will mitigate this