The NexRad Radar Rainfall tool is accessed through the ET...
17
1 The NexRad Radar Rainfall tool is accessed through the ET Data and Radar-based Rainfall Data link on the DBHYDRO Browser Menu.
Transcript of The NexRad Radar Rainfall tool is accessed through the ET...

1
The NexRad Radar Rainfall tool is accessed through the ET Data and Radar-based Rainfall Data
link on the DBHYDRO Browser Menu.

2
Entering the NexRad Radar Rainfall Application
The NexRad Radar Rainfall application provides users with the ability to access rainfall data for
District areas for varied spatially and temporally aggregated datasets in tabular and image
formats. Elements on the main application screen include detailed and overview map images; a navigation panel (1) that allows users to select and activate different types of Query, Data, and Polygon and display different layers: a time series retrieval panel (2) that enables time-specific information to be returned; and a mapping function toolbar (3) that enables mapping functions. The District developed ArcGIS JavaScript based application for NEXRAD data retrieval.
Navig
atio
n P
an
el
Timeseries
Retrieval Panel
Mapping Function
Toolbar
3
1. Using the Navigation Panel
The navigation panel allows users to determine how information is displayed on Nexrad interface.
Query Type Selection:
Users can select Map Based Output or Text Based Output from Query Type Selection.
Example showing map based output for monthly radar rainfall data for Palm Beach County
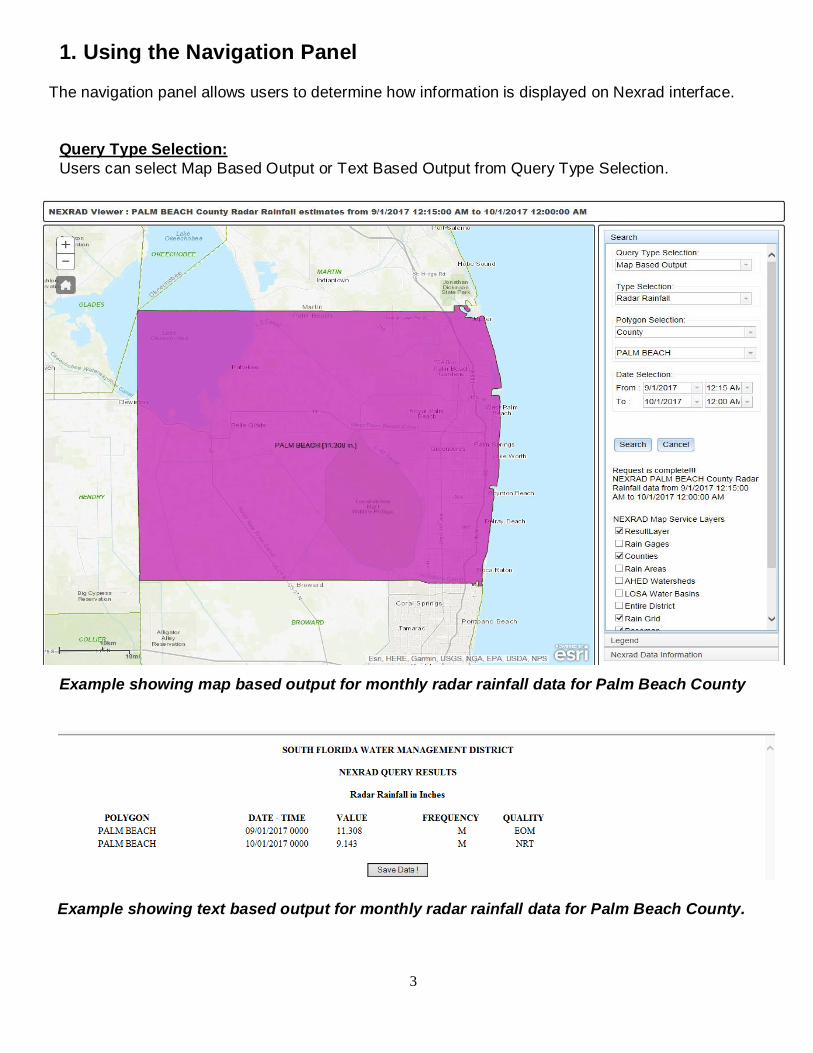
Example showing text based output for monthly radar rainfall data for Palm Beach County.

4
Type selection:
Type selection lets user choose the type of data they need from a drop-down box of data types:
Radar Rainfall, Reference ET, Potential ET, and Solar Radiation as shown below:
Polygon selection:
It has two sets of drop-down boxes: Top one allows user to select the type of Polygon that they want
to query information for by selecting either County, Rain areas, AHED (Arc-Hydro Enhanced Database) Watersheds, LOSA (Lake Okeechobee Service Area) Water Basins, entire district and rain grid as
shown below. Bottom drop-down box is for selecting the detail options for the polygon selection made under top drop-down box other than the entire district and rain grid.
Options under top drop-down box Options under bottom drop-down box
Map display is also controlled by Navigation Panel selections.
User can activate any layers as listed under NEXRAD Map Service Layers.
Polygon selected for top drop-down box
Polygon options for bottom drop-down box
5
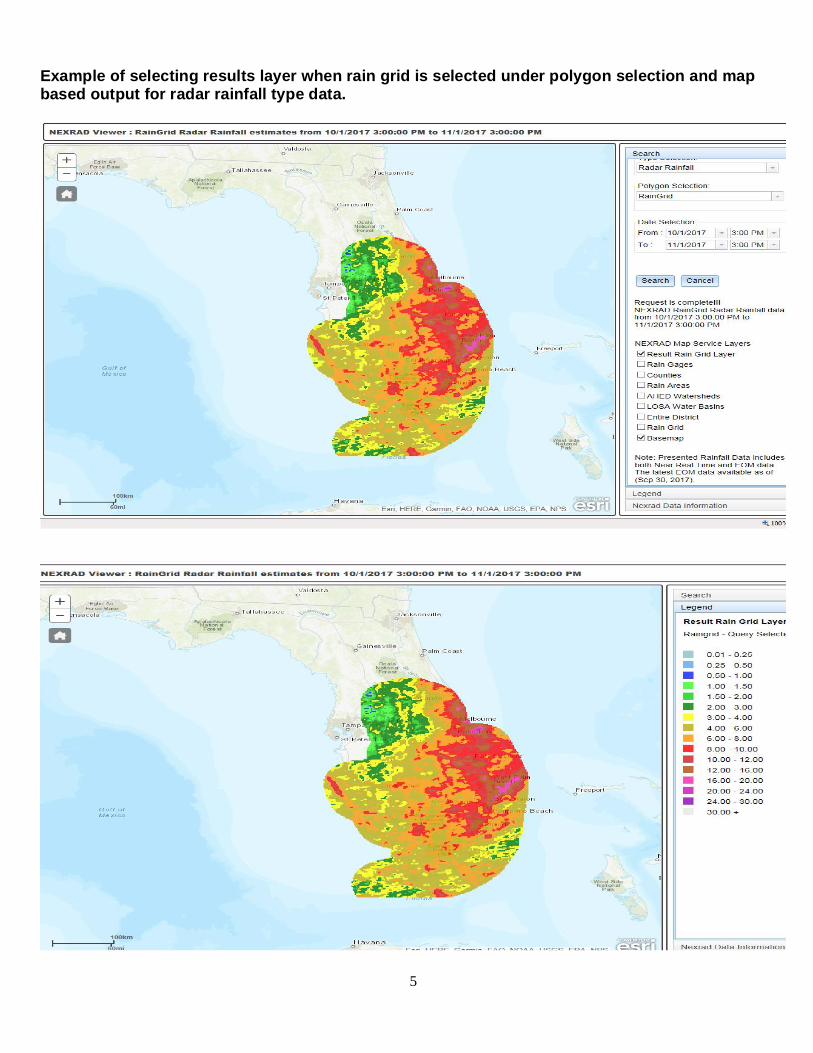
Example of selecting results layer when rain grid is selected under polygon selection and map based output for radar rainfall type data.

6
Example of selecting rain gauge layer, user can see all rain gauges

7
Example of selecting county layer, user can see all counties

8
Example of selecting Rain areas

9
Example of selecting AHED Watershed

10
Example of selecting LOSA Water Basin layer
11
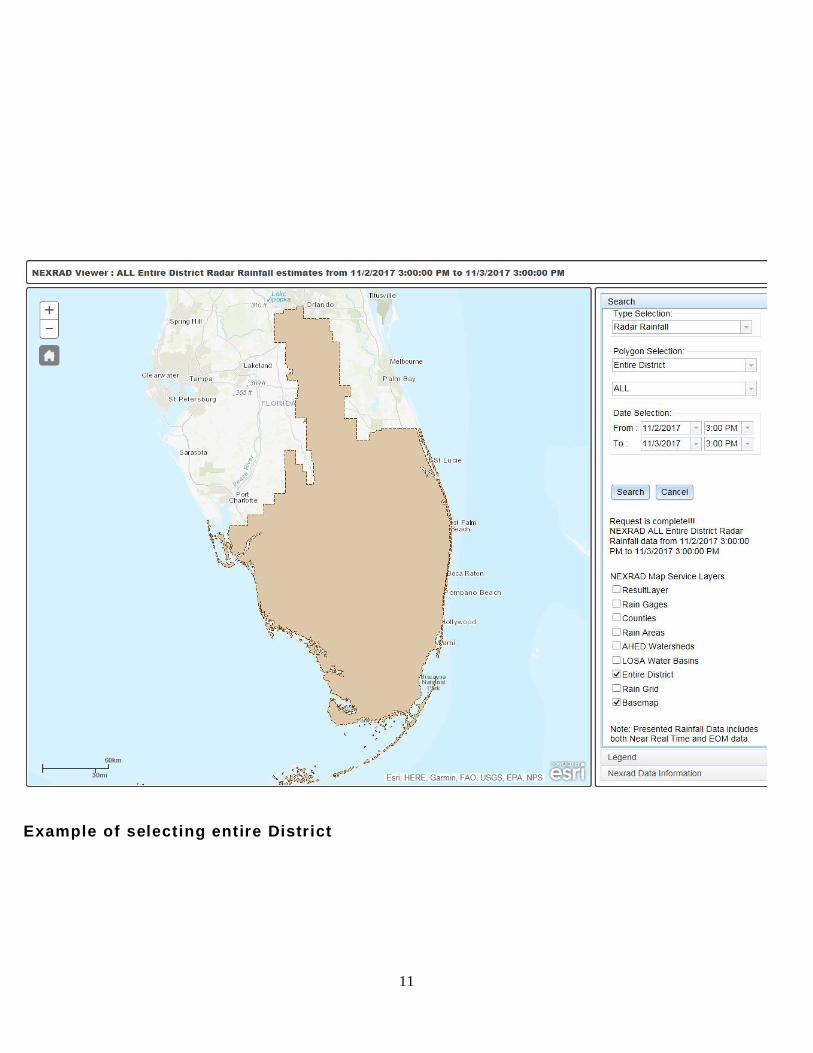
Example of selecting entire District

12
Example of selecting rain grid
2. Using the Times Series Retrieval Panel
The Time Series Retrieval Panel allows user to select any date for which they want data to be retrieved.
Requested data from the NexRad Radar Rainfall database is retrieved and displayed to the map image or
as text output depending on user choice.
After request is complete, a message shows that request is complete and data is retrieved for specified
polygon for the specified data type for the selected date range in the specified output format.
Time series header is seen on top of the viewer.
Another note also representing the quality of radar data (Near-Real-Time, which is NRT or End-of-Month,
which is EOM) is visible at the bottom of the panel.

13
Timeseries Header
Message
showing status
of the request.
Message
showing quality
of the data.

14
Detail Step by Step Instructions for Map Based Output: Step 1: Select Map Based Output from Query Type Selection drop down menu.
Step 2: Select the type of data from Type selection drop down menu.
Step 3: Select the category of polygon (county, rain area, AHED Watershed, LOSA Water Basin, entire
district or rain grid) from top drop-down menu under Polygon Selection.
Step 4: Select any specific county, rain area, AHED Watershed or LOSA Water Basin or all from the second
drop-down menu under Polygon Selection. For entire district and rain grid no further breakdown option is
available.
Step 5: Select the period of data request from Date Selection menu.
Step 6: Click “Search”.
Step 7: Check the Time series header along with the messages showing the status
of request and quality of the data.
Step 8: Turn on the Layers from Map Service Layers including result layer and polygon selected for query.
Step 9: Look for the results on map mentioning the amount of rain for specified polygon selected for query.
Step 10: To better understand the results open the “Legend” at the bottom of the panel.

15
Example showing map based output for radar rainfall for All Rain Areas.

16
Detail Step by Step Instructions for Text Based Output: Step 1: Select Text Based Output from Query Type Selection drop down menu.
Step 2: Select the type of data from Type selection drop down menu.
Step 3: Select the period of data request from Date Selection menu.
Step 4: Select the category of polygon (Select pixel, entire district, county, LOSA Water Basin or
AHED Watershed) from top drop-down menu under Polygon Selection.
Step 5: Select any specific pixel, entire district, county, LOSA Water Basin or AHED Watershed
from the second drop-down menu under Polygon Selection. For entire district, no further breakdown
option is available. Multiple pixels can be selected using ‘/’, ‘’’, or ‘%’.
Step 6: Select Time interval: either 15 min, 1 hour, Daily, Event, Monthly, or Annual.
Step 7: Select Output destination either as Browser or File.
Step 8: Select Output File Format as either txt or excel.
Step 9: Click check box to include zeroes or not.
Step 10: Click check box to include pixels in polygon or not.
Step 11: Check Batch Mode if data set request is large (over 10,000 rows), provide an email
address with batch mode request.
Step 12: Click on “Get Data” tab to get output.
17
3. Using the Map Function Toolbar The Map Function Toolbar allows user to perform several
Mapping functions including:
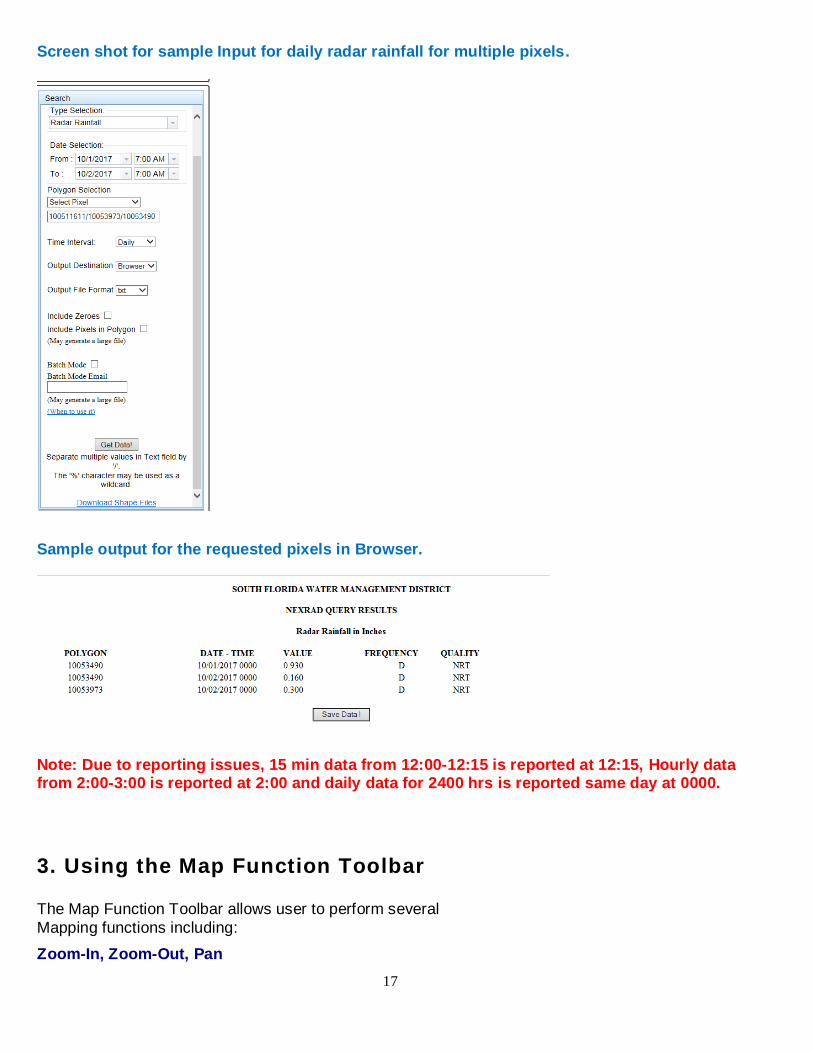
Screen shot for sample Input for daily radar rainfall for multiple pixels.
Sample output for the requested pixels in Browser.
Note: Due to reporting issues, 15 min data from 12:00-12:15 is reported at 12:15, Hourly data from 2:00-3:00 is reported at 2:00 and daily data for 2400 hrs is reported same day at 0000.
Zoom-In, Zoom-Out, Pan