The New Response Spectrum Model for Australia · Keywords: Seismicity, Seismic Hazard, Response...
19
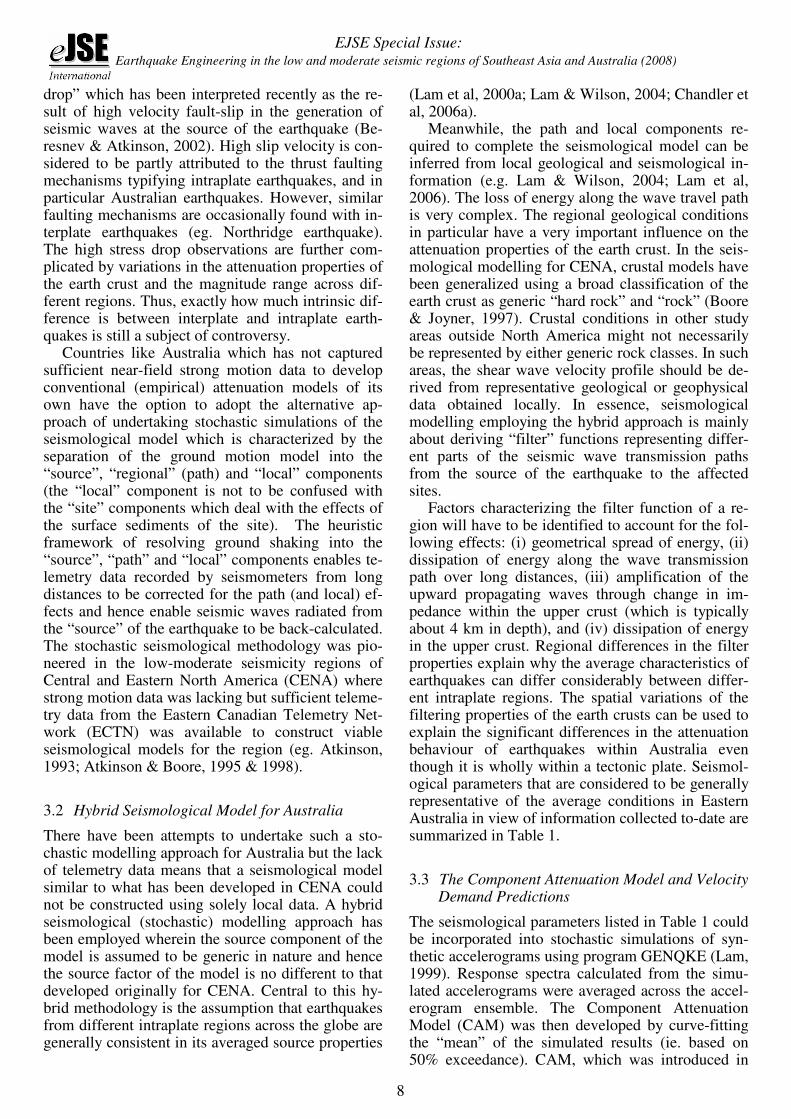
EJSE Special Issue: Earthquake Engineering in the low and moderate seismic regions of Southeast Asia and Australia (2008) 6 1 BACKGROUND Whilst earthquakes worldwide predominantly occur along tectonic plate boundaries (interplate regions) destructive earthquakes do occur away from the plate margins and are known as intraplate earth- quakes. In the past 100 years, 20 earthquakes of magnitude 6 (M6) or greater have occurred in conti- nental Australia which is wholly within the Indo- Australasian plate. There are on average 2 – 3 earth- quakes of M5 or greater occurring every year in Aus- tralia (McCue et al., 1995). The Meckering earthquake of M6.9, occurring in Western Australia in 1968, was the first earthquake event in Australia which caused notable civil engi- neering damage. This event prompted research into the potential seismic hazard across the whole of Australia culminating in the development of the first earthquake code AS2121 (1979) which was super- seded by AS1170.4 (1993). The latter standard has incorporated the seismic hazard map of Australia as reported by Gaull et al (1990). The Newcastle earthquake of M5.6 in 1989, oc- curring in New South Wales, caused 11 deaths. Re- search into the seismic performance behaviour of structures in Australia has since been developed, and “displacement” as the criterion to quantify perform- ance has been central to the research theme. Topics of investigations include seismic activity (seismic- ity), seismic demand (ground motion) and the per- formance behaviour of vulnerable items including unreinforced masonry walls, buildings with a soft storey and unrestrained building contents. The key objective of this paper is to present the outcome of research undertaken by the authors since the mid 1990’s in support of the new response spec- trum model for Australia. The modelling concept which places emphasis on displacement demand predictions is potentially applicable to other regions of low-moderate seismicity around the globe. The rest of this paper provides an overview of updates on seismicity modelling, attenuation modelling, and re- sponse spectrum modelling for rock and soil sites. A case-study illustrating the practical implementation of the developed model on the seismic assessment of a lifeline facility is provided at the end of the paper. 2 SEISMIC ACTIVITY MODELLING 2.1 Modelling from historical data Early contributors to seismic activity in Australia in- clude researchers from the Australian Geological Survey Organisation (the precursor of Geoscience Australia), Bureau of Mineral Resources and De- partment of Geology and Mineralogy. Seismically The New Response Spectrum Model for Australia N.T.K. Lam Infrastructure Protection Group (IPG) Department of Civil & Environmental Engineering The University of Melbourne, VIC, Australia J.L. Wilson Faculty of Engineering and Industrial Science Swinburne University of Technology, VIC, Australia ABSTRACT: This paper presents an overview of recent research in Australia into seismic activity and ground motion modelling which has culminated in the development of a new response spectrum model for Australia as featured in the new standard for seismic actions. An important element of the research is the prediction of the displacement demand of small-moderate magnitude earthquakes that are characteristics of the intraplate tectonic environment of Australia. The practical implementation of the response spectrum model is illustrated at the end of the paper with the case-study of a lifeline facility. Advancements in seismic demand is compli- mented by the accurate assessment of the seismic performance of the structure and their sub-assemblages in- cluding those with non-ductile behavior. Keywords: Seismicity, Seismic Hazard, Response Spectrum, Australia, Component Attenuation Model
Transcript of The New Response Spectrum Model for Australia · Keywords: Seismicity, Seismic Hazard, Response...

EJSE Special Issue: Earthquake Engineering in the low and moderate seismic regions of Southeast Asia and Australia (2008)
6
1 BACKGROUND Whilst earthquakes worldwide predominantly occur along tectonic plate boundaries (interplate regions) destructive earthquakes do occur away from the plate margins and are known as intraplate earth-quakes. In the past 100 years, 20 earthquakes of magnitude 6 (M6) or greater have occurred in conti-nental Australia which is wholly within the Indo-Australasian plate. There are on average 2 – 3 earth-quakes of M5 or greater occurring every year in Aus-tralia (McCue et al., 1995).
The Meckering earthquake of M6.9, occurring in Western Australia in 1968, was the first earthquake event in Australia which caused notable civil engi-neering damage. This event prompted research into the potential seismic hazard across the whole of Australia culminating in the development of the first earthquake code AS2121 (1979) which was super-seded by AS1170.4 (1993). The latter standard has incorporated the seismic hazard map of Australia as reported by Gaull et al (1990).
The Newcastle earthquake of M5.6 in 1989, oc-curring in New South Wales, caused 11 deaths. Re-search into the seismic performance behaviour of structures in Australia has since been developed, and “displacement” as the criterion to quantify perform-ance has been central to the research theme. Topics
of investigations include seismic activity (seismic-ity), seismic demand (ground motion) and the per-formance behaviour of vulnerable items including unreinforced masonry walls, buildings with a soft storey and unrestrained building contents.
The key objective of this paper is to present the outcome of research undertaken by the authors since the mid 1990’s in support of the new response spec-trum model for Australia. The modelling concept which places emphasis on displacement demand predictions is potentially applicable to other regions of low-moderate seismicity around the globe. The rest of this paper provides an overview of updates on seismicity modelling, attenuation modelling, and re-sponse spectrum modelling for rock and soil sites. A case-study illustrating the practical implementation of the developed model on the seismic assessment of a lifeline facility is provided at the end of the paper.
2 SEISMIC ACTIVITY MODELLING
2.1 Modelling from historical data
Early contributors to seismic activity in Australia in-clude researchers from the Australian Geological Survey Organisation (the precursor of Geoscience Australia), Bureau of Mineral Resources and De-partment of Geology and Mineralogy. Seismically
The New Response Spectrum Model for Australia
N.T.K. Lam Infrastructure Protection Group (IPG) Department of Civil & Environmental Engineering
The University of Melbourne, VIC, Australia
J.L. Wilson Faculty of Engineering and Industrial Science
Swinburne University of Technology, VIC, Australia
ABSTRACT: This paper presents an overview of recent research in Australia into seismic activity and ground motion modelling which has culminated in the development of a new response spectrum model for Australia as featured in the new standard for seismic actions. An important element of the research is the prediction of the displacement demand of small-moderate magnitude earthquakes that are characteristics of the intraplate tectonic environment of Australia. The practical implementation of the response spectrum model is illustrated at the end of the paper with the case-study of a lifeline facility. Advancements in seismic demand is compli-mented by the accurate assessment of the seismic performance of the structure and their sub-assemblages in-cluding those with non-ductile behavior.
Keywords: Seismicity, Seismic Hazard, Response Spectrum, Australia, Component Attenuation Model
EJSE Special Issue: Earthquake Engineering in the low and moderate seismic regions of Southeast Asia and Australia (2008)
7
active areas all over Australia were divided into source zones (each of which was assumed to possess a measurable and uniform level of activity). The ac-tivity level, which was assumed to remain constant with time, was modelled in accordance with the ob-served rate of recurrence of earthquake events in the historical database covering a time span of approxi-mately 150 years (Gaull et al, 1990). This activity model when combined with selected attenuation models by the Cornell-McGuire Integration proce-dure predicts a notional peak ground acceleration (or “Hazard Factor”: terminology used in AS 1170.4: 2007) ranging between 0.05g and 0.11g for most parts of Australia for a 10% probability of ex-ceedance (PE) in a design life of 50 years (i.e. return period of 500 years). Normally, this probabilistic seismic hazard approach is used in regions where a great deal is known of the cause of the seismicity and individual fault sources. The noticeable “bull-eyes” contours in the Australian seismic hazard con-tour maps were the result of the occurrence of iso-lated historical events. This means that significant changes in the model (additional “bull-eye”) have to be made each time a major earthquake event occurs “unexpectedly”. There are techniques such as the Kernel Method which has been developed to smear the footprints of isolated historical events (review by Hutchinson et al, 2003). However, the seismic activ-ity model has largely been shaped by observations over a period of around 150 years. The point of con-tention is that the observed spatial distribution of historical events would not necessarily be indicative of the probabilistic distribution of potential future destructive events.
2.2 Modelling from neo-tectonic data
Alternative approaches to seismic activity for Aus-tralia based on geo-morphological and paleo-seismological analysis was pioneered at the Univer-sity of Melbourne (Sandiford et al, 2003), followed by contributions from Geoscience Australia. The availability of high resolution Digital Elevation Model (DEM) derived from aerial and satellite im-ages in conjunction with geological data makes it possible for scarps from surface rupturing of pre-historical earthquakes in parts of Australia to be identified (Clarke, 2006; Leonard & Clarke, 2006). DEM information including fault lengths and scarp displacements have been translated into data forming part of the neo-tectonic earthquake catalogue cover-ing a time span of up to approximately one hundred thousand years. It is noted that only large magnitude events (in the order of M7, or larger) have scarps that can be identified following such a long period of exposure. For these reasons, neo-tectonic data so generated from DEM only provides recurrence in-
formation in the high magnitude range whilst the conventional historical events catalogue are largely made up of records from low – moderate magnitude (M< 6) events. Leonard & Clark (2006) undertook a study to test the consistency between the very differ-ent scales of the two recurrence models. An impor-tant finding from the latter study is the significant inconsistencies between the recurrence model of the historical catalogue and that of the neo-tectonic cata-logue for the shield regions of Western Australia. The contemporary seismicity level for this part of Australia (based on the catalogue of historical events) is much higher than that projected by the neo-tectonic model (based on data of pre-historical activities). The change in activity level from “pre-historical” to “historical” times follows different trends in different parts of Australia which suggests the interesting phenomenon of activity migration. Limitations of the conventional probabilistic seismic hazard methodology based on historical events have become evident particularly for regions of low – moderate seismicity. The newly developed neo-tectonics catalogue for Australia estimates the max-imum magnitude (Mmax) to be in the order of M7.5, whilst Mmax = M7 seems reasonable when considering only the information provided by the da-tabase of historical earthquakes.
A hazard factor, or acceleration coefficient, of 0.08g has been stipulated for major capital cities in-cluding Canberra, Sydney and Melbourne for a re-turn period of 500 years (0.08g corresponds to a peak ground velocity of 60 mm/sec according to the definitions by the Standard AS 1170.4 since the 1993 edition; further details of the conversion rela-tionship is provided by the footnotes of Figure 1). In-frastructure designed and built over the past 15 years in Australia has been based on this design parameter. Any attempt to make changes is expected to be met with strong resistance irrespective of whether the currently stipulated hazard level is truly representa-tive of the actual seismicity in these cities. Whilst seismic activity modelling must continue to develop, research efforts should be directed at assessing, and comparing, the potential seismic performance of structures and their components.
3 ATTENUATION MODELLING
3.1 General
A common question to ask is how the ground shak-ing generated by interplate and intraplate earth-quakes would differ if the moment magnitude, epi-central distance and site conditions are kept the same. Intraplate earthquakes in Central and Eastern North America (CENA) have been known for a long time to be characterized by the so called “high stress
EJSE Special Issue: Earthquake Engineering in the low and moderate seismic regions of Southeast Asia and Australia (2008)
8
drop” which has been interpreted recently as the re-sult of high velocity fault-slip in the generation of seismic waves at the source of the earthquake (Be-resnev & Atkinson, 2002). High slip velocity is con-sidered to be partly attributed to the thrust faulting mechanisms typifying intraplate earthquakes, and in particular Australian earthquakes. However, similar faulting mechanisms are occasionally found with in-terplate earthquakes (eg. Northridge earthquake). The high stress drop observations are further com-plicated by variations in the attenuation properties of the earth crust and the magnitude range across dif-ferent regions. Thus, exactly how much intrinsic dif-ference is between interplate and intraplate earth-quakes is still a subject of controversy.
Countries like Australia which has not captured sufficient near-field strong motion data to develop conventional (empirical) attenuation models of its own have the option to adopt the alternative ap-proach of undertaking stochastic simulations of the seismological model which is characterized by the separation of the ground motion model into the “source”, “regional” (path) and “local” components (the “local” component is not to be confused with the “site” components which deal with the effects of the surface sediments of the site). The heuristic framework of resolving ground shaking into the “source”, “path” and “local” components enables te-lemetry data recorded by seismometers from long distances to be corrected for the path (and local) ef-fects and hence enable seismic waves radiated from the “source” of the earthquake to be back-calculated. The stochastic seismological methodology was pio-neered in the low-moderate seismicity regions of Central and Eastern North America (CENA) where strong motion data was lacking but sufficient teleme-try data from the Eastern Canadian Telemetry Net-work (ECTN) was available to construct viable seismological models for the region (eg. Atkinson, 1993; Atkinson & Boore, 1995 & 1998).
3.2 Hybrid Seismological Model for Australia
There have been attempts to undertake such a sto-chastic modelling approach for Australia but the lack of telemetry data means that a seismological model similar to what has been developed in CENA could not be constructed using solely local data. A hybrid seismological (stochastic) modelling approach has been employed wherein the source component of the model is assumed to be generic in nature and hence the source factor of the model is no different to that developed originally for CENA. Central to this hy-brid methodology is the assumption that earthquakes from different intraplate regions across the globe are generally consistent in its averaged source properties
(Lam et al, 2000a; Lam & Wilson, 2004; Chandler et al, 2006a).
Meanwhile, the path and local components re-quired to complete the seismological model can be inferred from local geological and seismological in-formation (e.g. Lam & Wilson, 2004; Lam et al, 2006). The loss of energy along the wave travel path is very complex. The regional geological conditions in particular have a very important influence on the attenuation properties of the earth crust. In the seis-mological modelling for CENA, crustal models have been generalized using a broad classification of the earth crust as generic “hard rock” and “rock” (Boore & Joyner, 1997). Crustal conditions in other study areas outside North America might not necessarily be represented by either generic rock classes. In such areas, the shear wave velocity profile should be de-rived from representative geological or geophysical data obtained locally. In essence, seismological modelling employing the hybrid approach is mainly about deriving “filter” functions representing differ-ent parts of the seismic wave transmission paths from the source of the earthquake to the affected sites.
Factors characterizing the filter function of a re-gion will have to be identified to account for the fol-lowing effects: (i) geometrical spread of energy, (ii) dissipation of energy along the wave transmission path over long distances, (iii) amplification of the upward propagating waves through change in im-pedance within the upper crust (which is typically about 4 km in depth), and (iv) dissipation of energy in the upper crust. Regional differences in the filter properties explain why the average characteristics of earthquakes can differ considerably between differ-ent intraplate regions. The spatial variations of the filtering properties of the earth crusts can be used to explain the significant differences in the attenuation behaviour of earthquakes within Australia even though it is wholly within a tectonic plate. Seismol-ogical parameters that are considered to be generally representative of the average conditions in Eastern Australia in view of information collected to-date are summarized in Table 1.
3.3 The Component Attenuation Model and Velocity Demand Predictions
The seismological parameters listed in Table 1 could be incorporated into stochastic simulations of syn-thetic accelerograms using program GENQKE (Lam, 1999). Response spectra calculated from the simu-lated accelerograms were averaged across the accel-erogram ensemble. The Component Attenuation Model (CAM) was then developed by curve-fitting the “mean” of the simulated results (ie. based on 50% exceedance). CAM, which was introduced in
EJSE Special Issue: Earthquake Engineering in the low and moderate seismic regions of Southeast Asia and Australia (2008)
9
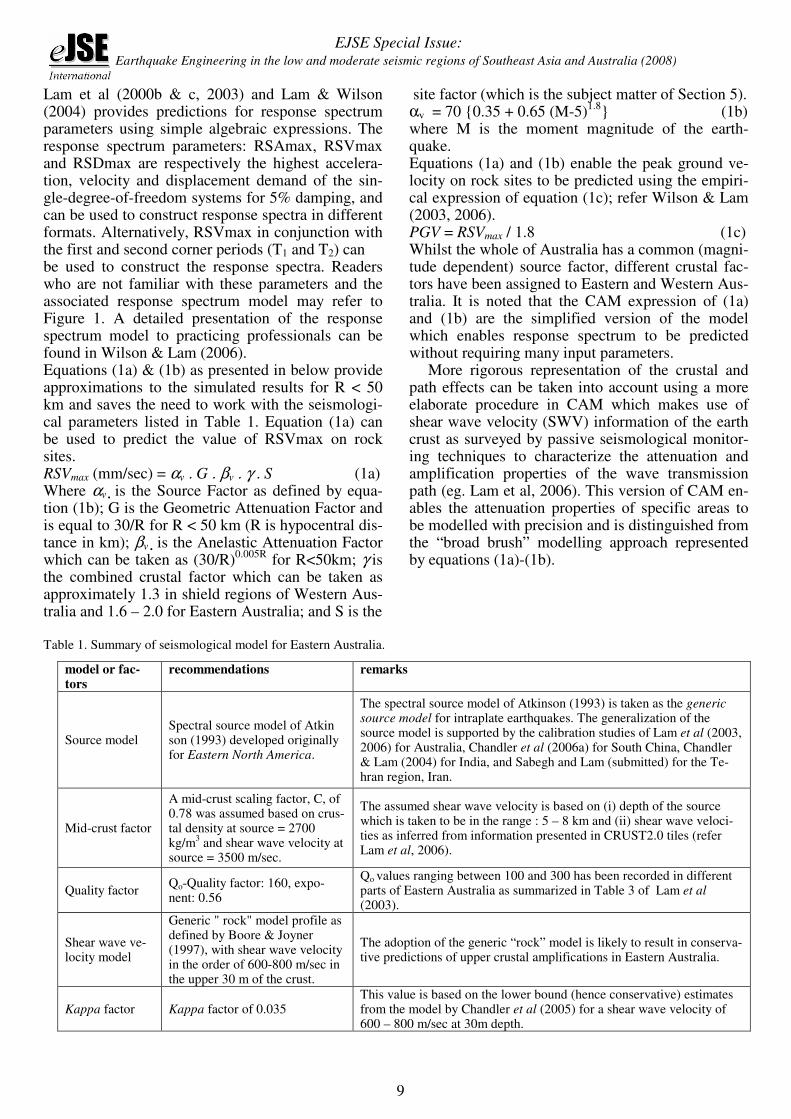
Lam et al (2000b & c, 2003) and Lam & Wilson (2004) provides predictions for response spectrum parameters using simple algebraic expressions. The response spectrum parameters: RSAmax, RSVmax and RSDmax are respectively the highest accelera-tion, velocity and displacement demand of the sin-gle-degree-of-freedom systems for 5% damping, and can be used to construct response spectra in different formats. Alternatively, RSVmax in conjunction with the first and second corner periods (T1 and T2) can be used to construct the response spectra. Readers who are not familiar with these parameters and the associated response spectrum model may refer to Figure 1. A detailed presentation of the response spectrum model to practicing professionals can be found in Wilson & Lam (2006). Equations (1a) & (1b) as presented in below provide approximations to the simulated results for R < 50 km and saves the need to work with the seismologi-cal parameters listed in Table 1. Equation (1a) can be used to predict the value of RSVmax on rock sites. RSVmax (mm/sec) = αv . G . βv . γ . S (1a) Where αv is the Source Factor as defined by equa-tion (1b); G is the Geometric Attenuation Factor and is equal to 30/R for R < 50 km (R is hypocentral dis-tance in km); βv is the Anelastic Attenuation Factor which can be taken as (30/R)
0.005R for R<50km; γ is
the combined crustal factor which can be taken as approximately 1.3 in shield regions of Western Aus-tralia and 1.6 – 2.0 for Eastern Australia; and S is the
site factor (which is the subject matter of Section 5). αv = 70 {0.35 + 0.65 (M-5)
1.8} (1b)
where M is the moment magnitude of the earth-quake. Equations (1a) and (1b) enable the peak ground ve-locity on rock sites to be predicted using the empiri-cal expression of equation (1c); refer Wilson & Lam (2003, 2006). PGV = RSVmax / 1.8 (1c) Whilst the whole of Australia has a common (magni-tude dependent) source factor, different crustal fac-tors have been assigned to Eastern and Western Aus-tralia. It is noted that the CAM expression of (1a) and (1b) are the simplified version of the model which enables response spectrum to be predicted without requiring many input parameters.
More rigorous representation of the crustal and path effects can be taken into account using a more elaborate procedure in CAM which makes use of shear wave velocity (SWV) information of the earth crust as surveyed by passive seismological monitor-ing techniques to characterize the attenuation and amplification properties of the wave transmission path (eg. Lam et al, 2006). This version of CAM en-ables the attenuation properties of specific areas to be modelled with precision and is distinguished from the “broad brush” modelling approach represented by equations (1a)-(1b).
Table 1. Summary of seismological model for Eastern Australia.
model or fac-tors
recommendations remarks
Source model Spectral source model of Atkin son (1993) developed originally for Eastern North America.
The spectral source model of Atkinson (1993) is taken as the generic source model for intraplate earthquakes. The generalization of the source model is supported by the calibration studies of Lam et al (2003, 2006) for Australia, Chandler et al (2006a) for South China, Chandler & Lam (2004) for India, and Sabegh and Lam (submitted) for the Te-hran region, Iran.
Mid-crust factor
A mid-crust scaling factor, C, of 0.78 was assumed based on crus-tal density at source = 2700 kg/m
3 and shear wave velocity at
source = 3500 m/sec.
The assumed shear wave velocity is based on (i) depth of the source which is taken to be in the range : 5 – 8 km and (ii) shear wave veloci-ties as inferred from information presented in CRUST2.0 tiles (refer Lam et al, 2006).
Quality factor Qo-Quality factor: 160, expo-nent: 0.56
Qo values ranging between 100 and 300 has been recorded in different parts of Eastern Australia as summarized in Table 3 of Lam et al (2003).
Shear wave ve-locity model
Generic " rock" model profile as defined by Boore & Joyner (1997), with shear wave velocity in the order of 600-800 m/sec in the upper 30 m of the crust.
The adoption of the generic “rock” model is likely to result in conserva-tive predictions of upper crustal amplifications in Eastern Australia.
Kappa factor Kappa factor of 0.035 This value is based on the lower bound (hence conservative) estimates from the model by Chandler et al (2005) for a shear wave velocity of 600 – 800 m/sec at 30m depth.

EJSE Special Issue: Earthquake Engineering in the low and moderate seismic regions of Southeast Asia and Australia (2008)
10
(a) Model in the displacement, velocity and acceleration response spectrum format
(b) Model in the form of ADRS diagram
Figure 1. Format of the new Response Spectrum Model for Australia (standard provisions).
RSD
RSV
RSA
Bi-linear
(idealised)
Idealised Response Spectrum Models
(a)
(b)
(c)
RSD=RSA(T/2π)2
RSV=RSA(T/2π)
T2
T1
T0
T1
PGV
RSVmax~1.8 PGV
T0
T-1 or 1/T
T-2 or 1/T2
T-1 or 1/T
PGA
RSamax=2.5 PGA in codes typicallyT0
A Displacement
Spectrum
A Velocity Spectrum
An
AccelerationSpectrum
Displacement
Controlled (a “cap”)
Velocity
Controlled
Acceleration
Controlled
RSDmax
SUMMARY
T1 T2
SA R
RSD
T1
T2
RSDmax
RSAmax
RSD
RSVRSA
TRSVRSD
TRSVRSA
2
max
max
max
: (2) with (1) Combining
(2)2
(1)2
=
−−−−−
=
−−−−−
=
π
π
Displacement Cap
SA R
RSD
T1
T2
RSDmax
RSAmax
RSD
RSVRSA
TRSVRSD
TRSVRSA
2
max
max
max
: (2) with (1) Combining
(2)2
(1)2
=
−−−−−
=
−−−−−
=
π
π
Displacement Cap
RSAmax = 3(kpZ) Fa (1)
units in g’s RSVmax = 1.8 PGV Fv where PGV= 750 (kpZ) (2)
units in mm/sec RSDmax = RSVmax (T2/2π) where T2 = 1.5 secs
units in mm footnotes:
(1) Factor of “3” (instead of “2.5”) is intended to reflect the well known phenome-
non of high spectral amplification in the short period range with intraplate earth-
quakes; kp is the return period factor and Fa and Fv are site factors (refer Table 3).
(2) The conversion factor of “750” was used by the Standard for back calculating the
notional pga (or hazard factor) from the inferred designed PGV on rock sites of any
given area. This relationship is consistent with a T1 value of ~ 0.3 secs.

EJSE Special Issue: Earthquake Engineering in the low and moderate seismic regions of Southeast Asia and Australia (2008)
11
3.4 Stochastic versus Intensity models
The approach of mapping macroseismic (Intensity) data taken from post-disaster damage surveys of earthquake affected areas was adopted by Gaull et al (1990) in developing the attenuation models for the whole of Australia. The developed attenuation mod-els were then incorporated into seismic hazard ana-lyses for generation of the probabilistic seismic haz-ard maps which have been in use in Australia for almost 15 years. Ground motion parameters such as peak ground velocity (PGV), or peak ground accel-eration (PGA), can be inferred from Intensity data expressed in the Modified Mercalli Intensity (MMI) scales using empirical relationships. Equations (2a) & (2b) represents one such attenuation model that has been developed for an “average” site in Eastern Australia as presented in Gaull et al (1990). MMI = 1.5M – 3.9 log R + 3.9 -0.6 (Eastern Australia) (2a) 2
MMI = 7/5 PGV (2b)
where PGV is expressed in mm/sec. The main drawback with this approach is uncertain-ties with the accuracies of the Intensity mapping and that of the inferred ground motions given that Inten-sity-PGV correlations are dependent on many factors including local design and detailing practices of the built infrastructure. Furthermore, Intensity mapping cannot take into account site effects. Earthquakes of different magnitudes are not necessarily well repre-sented by historical events archived in the Intensity database. Thus, the properties of earthquake ground shaking cannot be characterized accurately by at-tenuation relationships based solely on Intensity data. An important step in the development of the hybrid seismological (stochastic) model is the corre-lation of PGV’s simulated for rock sites against PGV’s inferred from “average” sites from the Modi-fied Mercalli Intensity (MMI) data. The quality of the model was well reflected in the good linear cor-relations between the two sets of predicted PGV’s.
Earlier attenuation studies for the Melbourne area, Australia and the South China Hong Kong area showed that the PGV’s of an average site as inferred from Intensity data were consistently 2.0 – 2.2 times higher than the PGV’s predicted for rock sites by stochastic simulations (Lam et al, 2006; Chandler et al, 2006a). This inferred amplification factor (from rock site to average site) can be described as a cali-bration factor since errors arising from different causes as described in the foregoing could have been absorbed into the factor. Notwithstanding, the in-ferred amplification (calibration) factor of 2.0-2.2 is considered reasonable for the moderate level of ground shaking that is consistent with a seismic co-efficient of 0.1g. In essence, predictions by CAM, (as represented by equations (1a)-(1c)), and that by the MMI model of Gaull et al (1990) for Eastern Australia, (as represented by equations (2a)-(2b)), are actually consistent when differences between “generic rock” sites and “average (soil)” sites have been accounted for.
4 DISPLACEMENT DEMAND MODELLING
Using equations (1a)-(1c) and equations (2a)-(2b) which provide generally consistent predictions for the PGV’s on rock sites, a list of earthquake scenar-ios expressed in terms of the Magnitude-Distance (M-R) combinations can be calibrated in order that the predicted PGV’s on rock sites match with the de-sign PGV of 60 mm/sec (which corresponds to a fac-tor of 0.08g). Such M-R listing for Eastern Australia is shown in Table 2.
Equation (3) is the CAM expression for the pre-diction of the highest displacement demand up to a natural period of 5 seconds (RSDmax) and is similar in form to equation (1a) for the prediction of RSVmax. RSDmax (mm) = αd . G . βd . γ . S (3) where αd is the source factor.
Table 2. M-R Combinations in Eastern Australia.
RSDmax (mm) T2
Eq. 3&4a&5 M R (km)
Eqs. 3 & 4a Eqs. 3 & 4b
5.0
5.5
6.0
6.5
7.0
10 – 15
20
30 – 35
50
90*
9
10
17
22
30*
5
9
17
32
NA
0.5
0.6
1.0
1.3
1.7
* PGV and RSDmax predicted for R> 50 km were calculated not by the presented expressions but using a more
elaborate procedure (Lam et al., 2000) which is not shown herein.
EJSE Special Issue: Earthquake Engineering in the low and moderate seismic regions of Southeast Asia and Australia (2008)
12
Two expressions have been developed for the prediction of the value of αd. The first expression (equation 4a) which is of the form similar to equa-tion (1b) was developed by the stochastic simula-tions of the CENA source model (Lam et al, 2000b). Equation (4b) is based on a theoretical model pre-sented originally in Lam & Chandler (2005). Signifi-cant to note is the general consistencies between the two independently developed relationships up to M6.5; but equation (4a) is more realistic than equa-tion (4b) for higher magnitude earthquakes.
αd = 10 {0.20 + 0.80 (M-5)
2.3} (4a)
αd = 10 M-5
(4b)
The path factors of G and γ used in equation (3) can be taken to be identical to those used in equation (1a). The Anelastic Attenuation Factor βd may be taken as (30/R)
0.003R for R<50km. Values of RSDmax
as calculated from equations (3) & (4a-4b) are also shown in Table 2 alongside the listed M-R combina-tions. The “second corner period”, T2, of the dis-placement response spectrum as defined by equation (5) is also shown. Interestingly, the magnitude de-pendent values of T2 (as shown in Table 2) can be approximated by the simple linear expression of eq-uation (6).
T2 = 2π (RSDmax/RSVmax) (5) T2 ~ 0.5 + (M-5)/2 for M ≥ 5 (6) Clearly, the displacement demand behaviour of the earthquake is very sensitive to its moment magnitude when PGV is kept constant. The non-linear relation-ships between the velocity and displacement parame-ters mean that neither the PGV nor PGA value of the earthquake could be sufficiently indicative of the po-tential destructiveness of the earthquake.
Thus, an accurate identification of the T2 parame-ter is critical. In the new Australian Standard for earthquake actions (AS1170.4:2007), the value of T2 is implicitly taken as 1.5 secs based on an upper moment magnitude limit of M7. The use of the re-sponse spectrum parameters: RSVmax, RSDmax and T2 in the construction of response spectra for practical engineering applications on rock sites is il-lustrated in Section 6. The determination of addi-tional parameters for modelling of the site effects is briefly described in Section 5.
5 MODELLING OF SITE EFFECTS
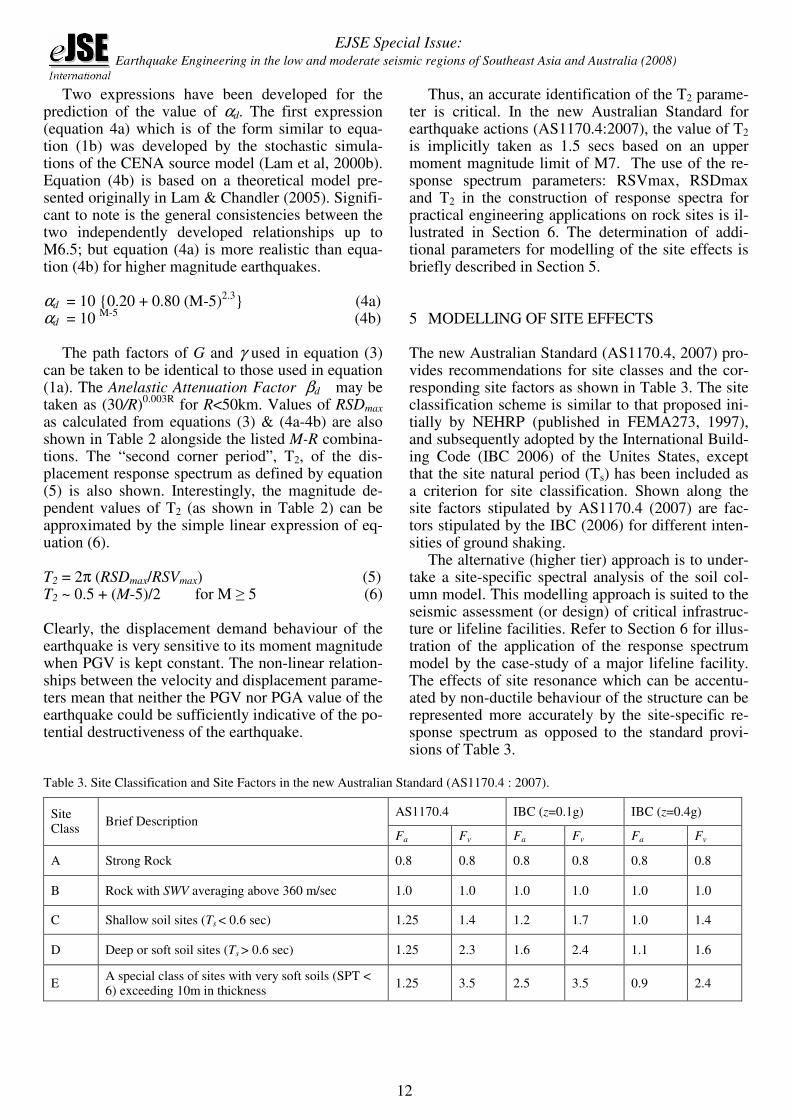
The new Australian Standard (AS1170.4, 2007) pro-vides recommendations for site classes and the cor-responding site factors as shown in Table 3. The site classification scheme is similar to that proposed ini-tially by NEHRP (published in FEMA273, 1997), and subsequently adopted by the International Build-ing Code (IBC 2006) of the Unites States, except that the site natural period (Ts) has been included as a criterion for site classification. Shown along the site factors stipulated by AS1170.4 (2007) are fac-tors stipulated by the IBC (2006) for different inten-sities of ground shaking.
The alternative (higher tier) approach is to under-take a site-specific spectral analysis of the soil col-umn model. This modelling approach is suited to the seismic assessment (or design) of critical infrastruc-ture or lifeline facilities. Refer to Section 6 for illus-tration of the application of the response spectrum model by the case-study of a major lifeline facility. The effects of site resonance which can be accentu-ated by non-ductile behaviour of the structure can be represented more accurately by the site-specific re-sponse spectrum as opposed to the standard provi-sions of Table 3.
Table 3. Site Classification and Site Factors in the new Australian Standard (AS1170.4 : 2007).
AS1170.4 IBC (z=0.1g) IBC (z=0.4g) Site Class
Brief Description Fa Fv Fa Fv Fa Fv
A Strong Rock 0.8 0.8 0.8 0.8 0.8 0.8
B Rock with SWV averaging above 360 m/sec 1.0 1.0 1.0 1.0 1.0 1.0
C Shallow soil sites (Ts < 0.6 sec) 1.25 1.4 1.2 1.7 1.0 1.4
D Deep or soft soil sites (Ts > 0.6 sec) 1.25 2.3 1.6 2.4 1.1 1.6
E A special class of sites with very soft soils (SPT < 6) exceeding 10m in thickness
1.25 3.5 2.5 3.5 0.9 2.4
EJSE Special Issue: Earthquake Engineering in the low and moderate seismic regions of Southeast Asia and Australia (2008)
13
In the site-specific model, the response spectrum is amplified at the fundamental natural period of the site period (Ts) at which point the structure is subject to the highest drift demand. This form of response spectrum construction is distinguished from the usual “site factor” models based on broad classifica-tion of the site in contemporary codes of practices. Models developed to-date by the authors and col-laborators for the estimation of the site period and site factor can be found in Lam and Wilson (1999), Lam et al (2001), Srikanth (2006) and Tsang et al (2006a & b). It is noted that the calculated site am-plification factors (in the order of 3 – 5 typically) which are dependent on the soil SWV, hysteretic and radiation damping properties and frequency content of the bedrock excitations in relation to the site natu-ral period (Ts) can be significantly higher than most current code provisions which are based on averag-ing results from a range of very different site condi-tions. It is noted, however, that inconservatism in the values of the code specified site amplification factors has been offset by the implicit conservatism of the rock response spectrum models (as demonstrated in the next section).
6 CASE-STUDY OF A LIFELINE FACILITY
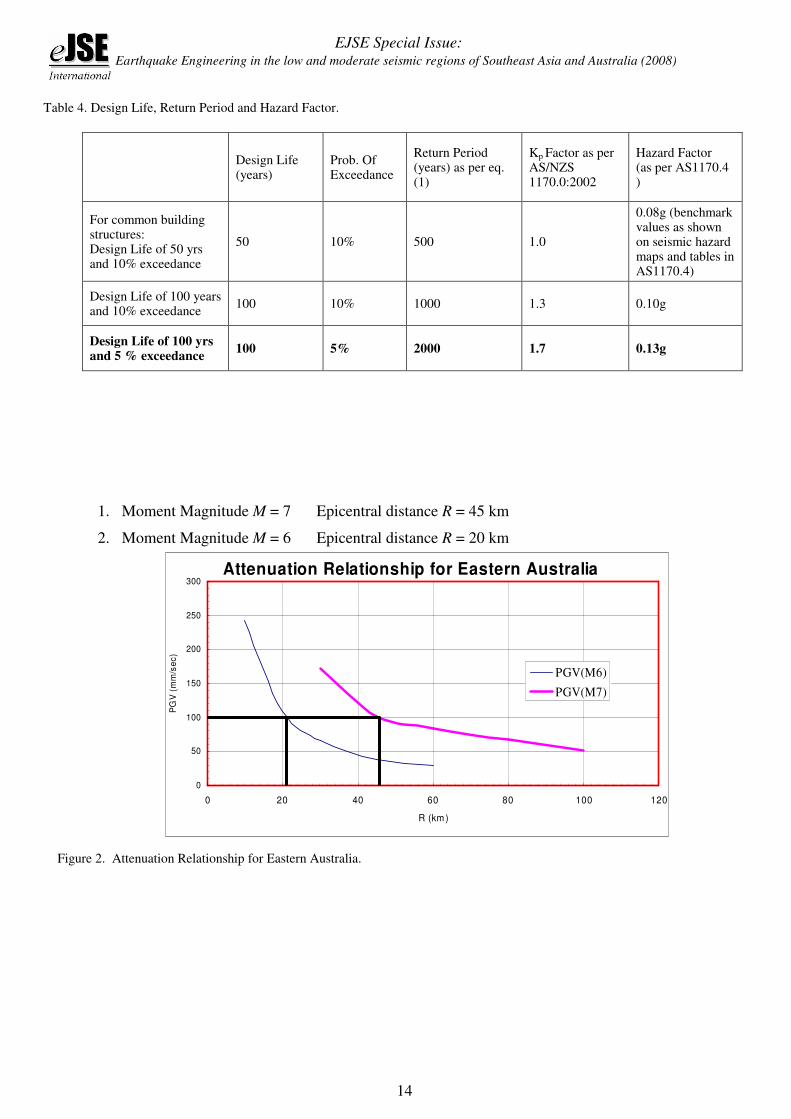
This section presents the case-study of the construc-tion of the site-specific response spectrum model for a major lifeline facility in Australia. The response spectra are subject to scaling by the Hazard Factor (Z) which is dependent on the design life of the fa-cility and the probability of exceedance (PE) as shown in Table 4. Benchmark Hazard Factors which correspond to 10% PE in a Design Life of 50 years are presented in seismic hazard maps. A value of 0.08g has been stipulated for major centres of popu-lation on the eastern seaboard including Sydney, Melbourne and Canberra. A higher Hazard Factor of 0.13g was calculated for the design/assessment of the lifeline facility based on a 5% PE in a Design Life of 100 years.
A 100 year design life and a 5 % probability of exceedance is translated into a design return period of 2000 years according to equation (7).
DesignLife
RPPr
−−=
111 (7)
where Pr is probability of exceedance; RP is return period.
The stipulated KP factor is accordingly equal to 1.7 in accordance with AS/NZS 1170.0 : 2002. A seismic hazard factor (KpZ) of 0.13g is calculated (where Z = 0.08g has been identified for the bench-
mark return period of 500 years for the area). The recommended design peak ground velocity (PGV) on rock is accordingly 100 mm/sec according to eq-uation (8) which is consistent with the 1993 and 2007 editions of AS1170.4.
ZKmmPGV P750sec)/( = (8)
The notional peak ground velocity (PGV) on rock
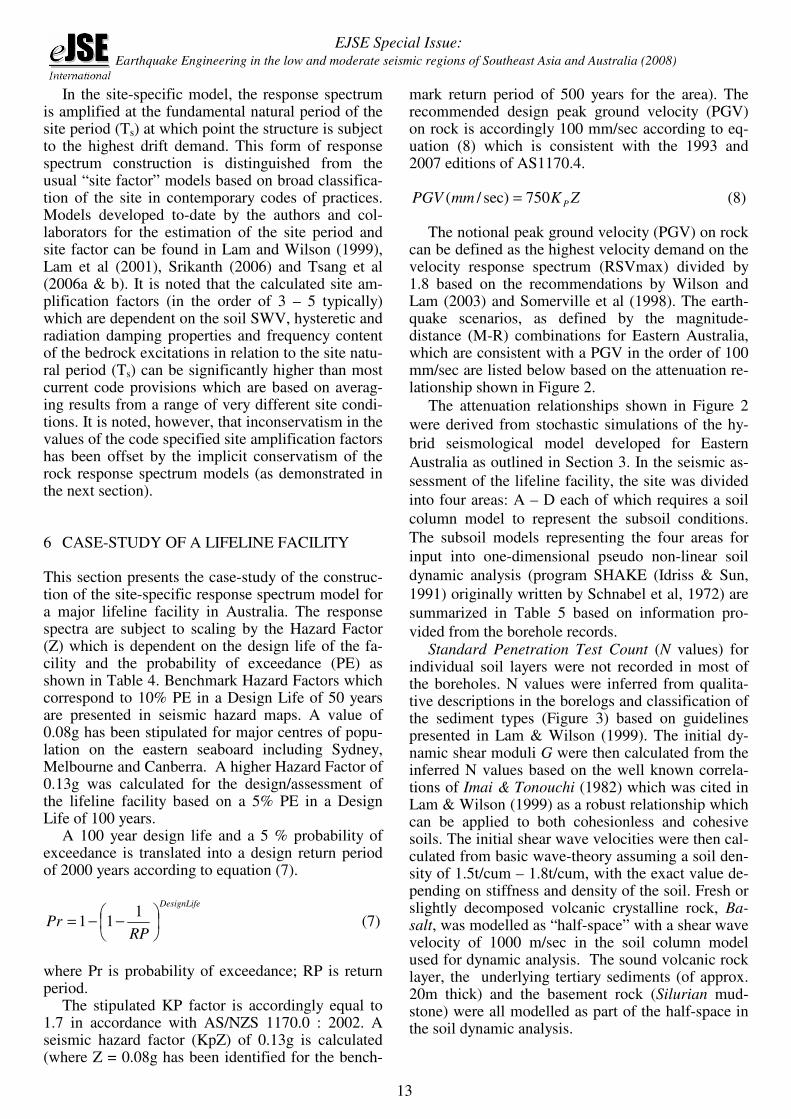
can be defined as the highest velocity demand on the velocity response spectrum (RSVmax) divided by 1.8 based on the recommendations by Wilson and Lam (2003) and Somerville et al (1998). The earth-quake scenarios, as defined by the magnitude-distance (M-R) combinations for Eastern Australia, which are consistent with a PGV in the order of 100 mm/sec are listed below based on the attenuation re-lationship shown in Figure 2.
The attenuation relationships shown in Figure 2
were derived from stochastic simulations of the hy-
brid seismological model developed for Eastern
Australia as outlined in Section 3. In the seismic as-
sessment of the lifeline facility, the site was divided
into four areas: A – D each of which requires a soil
column model to represent the subsoil conditions.
The subsoil models representing the four areas for
input into one-dimensional pseudo non-linear soil
dynamic analysis (program SHAKE (Idriss & Sun,
1991) originally written by Schnabel et al, 1972) are
summarized in Table 5 based on information pro-
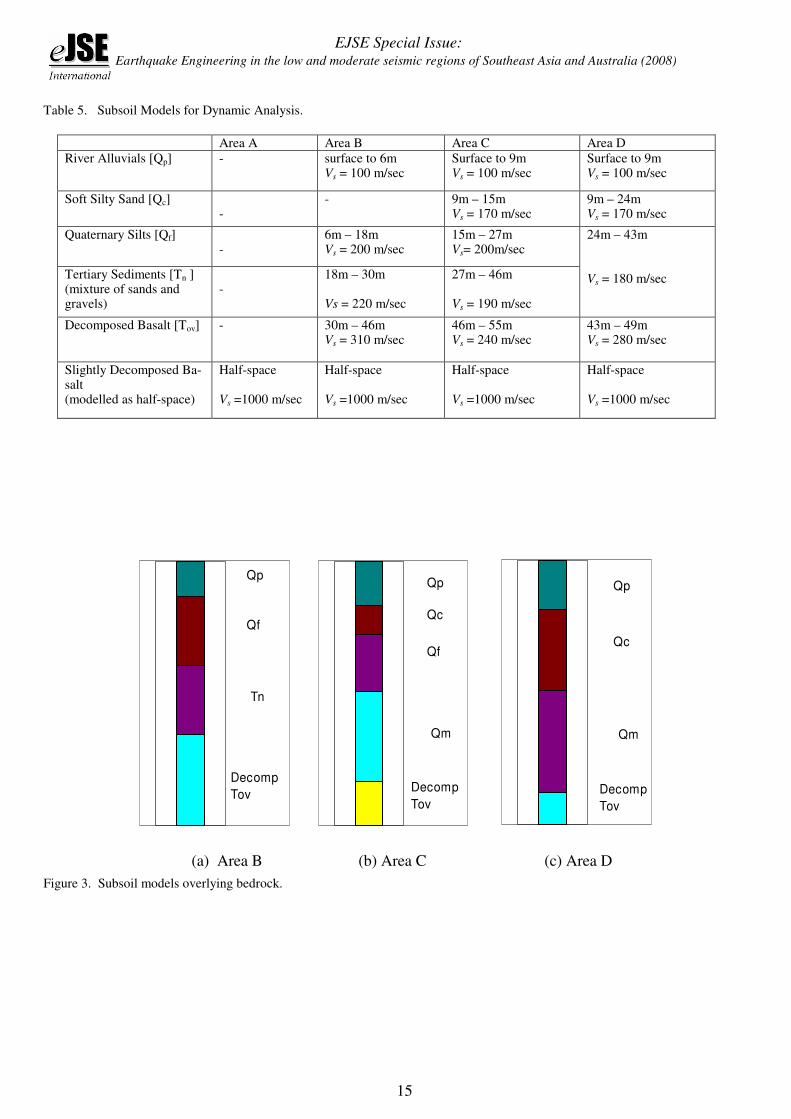
vided from the borehole records. Standard Penetration Test Count (N values) for
individual soil layers were not recorded in most of the boreholes. N values were inferred from qualita-tive descriptions in the borelogs and classification of the sediment types (Figure 3) based on guidelines presented in Lam & Wilson (1999). The initial dy-namic shear moduli G were then calculated from the inferred N values based on the well known correla-tions of Imai & Tonouchi (1982) which was cited in Lam & Wilson (1999) as a robust relationship which can be applied to both cohesionless and cohesive soils. The initial shear wave velocities were then cal-culated from basic wave-theory assuming a soil den-sity of 1.5t/cum – 1.8t/cum, with the exact value de-pending on stiffness and density of the soil. Fresh or slightly decomposed volcanic crystalline rock, Ba-salt, was modelled as “half-space” with a shear wave velocity of 1000 m/sec in the soil column model used for dynamic analysis. The sound volcanic rock layer, the underlying tertiary sediments (of approx. 20m thick) and the basement rock (Silurian mud-stone) were all modelled as part of the half-space in the soil dynamic analysis.
EJSE Special Issue: Earthquake Engineering in the low and moderate seismic regions of Southeast Asia and Australia (2008)
14
Table 4. Design Life, Return Period and Hazard Factor.
Attenuation Relationship for Eastern Australia
0
50
100
150
200
250
300
0 20 40 60 80 100 120
R (km )
PG
V (
mm
/se
c)
PGV(M6)
PGV(M7)
Figure 2. Attenuation Relationship for Eastern Australia.
1. Moment Magnitude M = 7 Epicentral distance R = 45 km
2. Moment Magnitude M = 6 Epicentral distance R = 20 km
Design Life (years)
Prob. Of Exceedance
Return Period (years) as per eq. (1)
Kp Factor as per AS/NZS 1170.0:2002
Hazard Factor (as per AS1170.4 )
For common building structures: Design Life of 50 yrs and 10% exceedance
50 10% 500 1.0
0.08g (benchmark values as shown on seismic hazard maps and tables in AS1170.4)
Design Life of 100 years and 10% exceedance
100 10% 1000 1.3 0.10g
Design Life of 100 yrs and 5 % exceedance
100 5% 2000 1.7 0.13g
EJSE Special Issue: Earthquake Engineering in the low and moderate seismic regions of Southeast Asia and Australia (2008)
15
Table 5. Subsoil Models for Dynamic Analysis.
Figure 3. Subsoil models overlying bedrock.
Area A Area B Area C Area D
River Alluvials [Qp] - surface to 6m Vs = 100 m/sec
Surface to 9m Vs = 100 m/sec
Surface to 9m Vs = 100 m/sec
Soft Silty Sand [Qc] -
- 9m – 15m Vs = 170 m/sec
9m – 24m Vs = 170 m/sec
Quaternary Silts [Qf] -
6m – 18m Vs = 200 m/sec
15m – 27m Vs= 200m/sec
Tertiary Sediments [Tn ] (mixture of sands and gravels)
-
18m – 30m Vs = 220 m/sec
27m – 46m Vs = 190 m/sec
24m – 43m Vs = 180 m/sec
Decomposed Basalt [Tov] - 30m – 46m Vs = 310 m/sec
46m – 55m Vs = 240 m/sec
43m – 49m Vs = 280 m/sec
Slightly Decomposed Ba-salt (modelled as half-space)
Half-space Vs =1000 m/sec
Half-space Vs =1000 m/sec
Half-space Vs =1000 m/sec
Half-space Vs =1000 m/sec
Qp
Qf
Tn
Decomp
Tov
Qp
Qc
Qf
Qm
Decomp
Tov
Qp
Qc
Qm
Decomp
Tov
(a) Area B (b) Area C (c) Area D
EJSE Special Issue: Earthquake Engineering in the low and moderate seismic regions of Southeast Asia and Australia (2008)
16
In the soil dynamic analyses, the stiffness degra-dation relationship of the soil sediments expressed in terms of the ratio of the soil shear modulus G/Gmax and soil shear strain γ is defined by equation (9).
r
G
G
γ
γ+
=
1
1
max
where γr is taken as 0.025 for sand
and silts (9)
Similarly, the critical damping ratio ζ is defined by equation (10).
r
iγγ
γςςς
++= max
(10)
where ζi and ζmax is taken as 0.015 and 0.16 respec-tively for sand and silts.
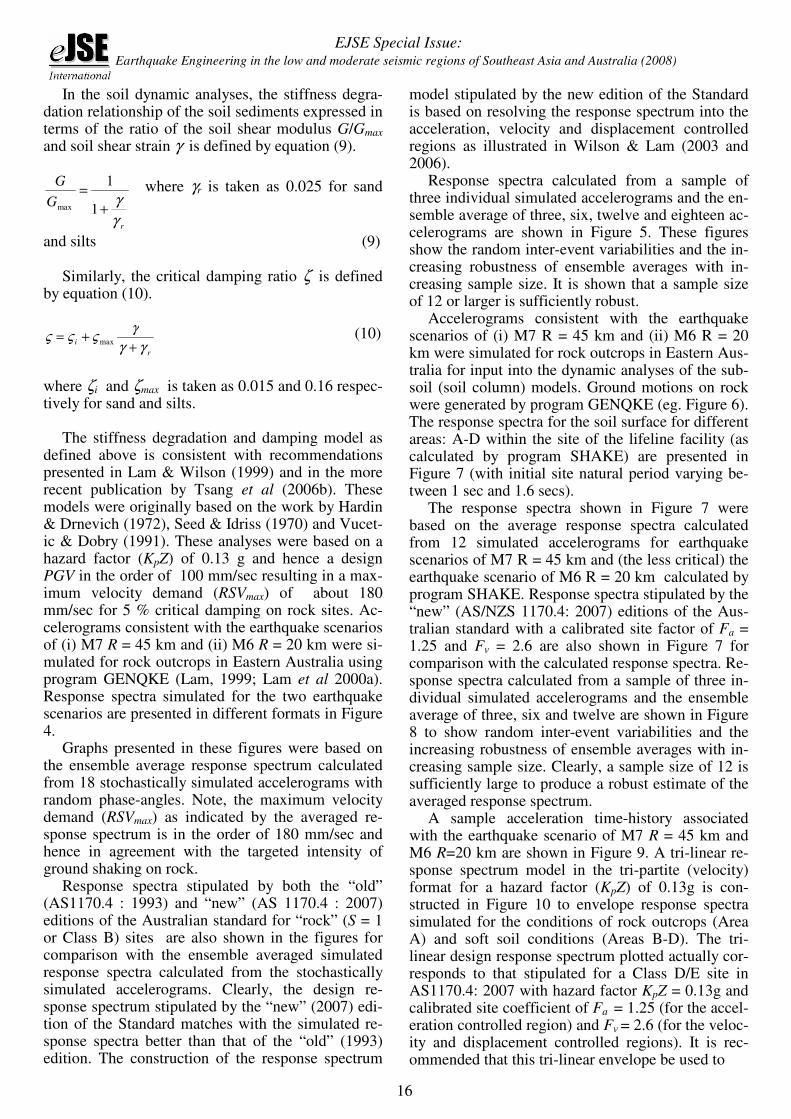
The stiffness degradation and damping model as defined above is consistent with recommendations presented in Lam & Wilson (1999) and in the more recent publication by Tsang et al (2006b). These models were originally based on the work by Hardin & Drnevich (1972), Seed & Idriss (1970) and Vucet-ic & Dobry (1991). These analyses were based on a hazard factor (KpZ) of 0.13 g and hence a design PGV in the order of 100 mm/sec resulting in a max-imum velocity demand (RSVmax) of about 180 mm/sec for 5 % critical damping on rock sites. Ac-celerograms consistent with the earthquake scenarios of (i) M7 R = 45 km and (ii) M6 R = 20 km were si-mulated for rock outcrops in Eastern Australia using program GENQKE (Lam, 1999; Lam et al 2000a). Response spectra simulated for the two earthquake scenarios are presented in different formats in Figure 4.
Graphs presented in these figures were based on the ensemble average response spectrum calculated from 18 stochastically simulated accelerograms with random phase-angles. Note, the maximum velocity demand (RSVmax) as indicated by the averaged re-sponse spectrum is in the order of 180 mm/sec and hence in agreement with the targeted intensity of ground shaking on rock.
Response spectra stipulated by both the “old” (AS1170.4 : 1993) and “new” (AS 1170.4 : 2007) editions of the Australian standard for “rock” (S = 1 or Class B) sites are also shown in the figures for comparison with the ensemble averaged simulated response spectra calculated from the stochastically simulated accelerograms. Clearly, the design re-sponse spectrum stipulated by the “new” (2007) edi-tion of the Standard matches with the simulated re-sponse spectra better than that of the “old” (1993) edition. The construction of the response spectrum
model stipulated by the new edition of the Standard is based on resolving the response spectrum into the acceleration, velocity and displacement controlled regions as illustrated in Wilson & Lam (2003 and 2006).
Response spectra calculated from a sample of three individual simulated accelerograms and the en-semble average of three, six, twelve and eighteen ac-celerograms are shown in Figure 5. These figures show the random inter-event variabilities and the in-creasing robustness of ensemble averages with in-creasing sample size. It is shown that a sample size of 12 or larger is sufficiently robust.
Accelerograms consistent with the earthquake scenarios of (i) M7 R = 45 km and (ii) M6 R = 20 km were simulated for rock outcrops in Eastern Aus-tralia for input into the dynamic analyses of the sub-soil (soil column) models. Ground motions on rock were generated by program GENQKE (eg. Figure 6). The response spectra for the soil surface for different areas: A-D within the site of the lifeline facility (as calculated by program SHAKE) are presented in Figure 7 (with initial site natural period varying be-tween 1 sec and 1.6 secs).
The response spectra shown in Figure 7 were based on the average response spectra calculated from 12 simulated accelerograms for earthquake scenarios of M7 R = 45 km and (the less critical) the earthquake scenario of M6 R = 20 km calculated by program SHAKE. Response spectra stipulated by the “new” (AS/NZS 1170.4: 2007) editions of the Aus-tralian standard with a calibrated site factor of Fa = 1.25 and Fv = 2.6 are also shown in Figure 7 for comparison with the calculated response spectra. Re-sponse spectra calculated from a sample of three in-dividual simulated accelerograms and the ensemble average of three, six and twelve are shown in Figure 8 to show random inter-event variabilities and the increasing robustness of ensemble averages with in-creasing sample size. Clearly, a sample size of 12 is sufficiently large to produce a robust estimate of the averaged response spectrum.
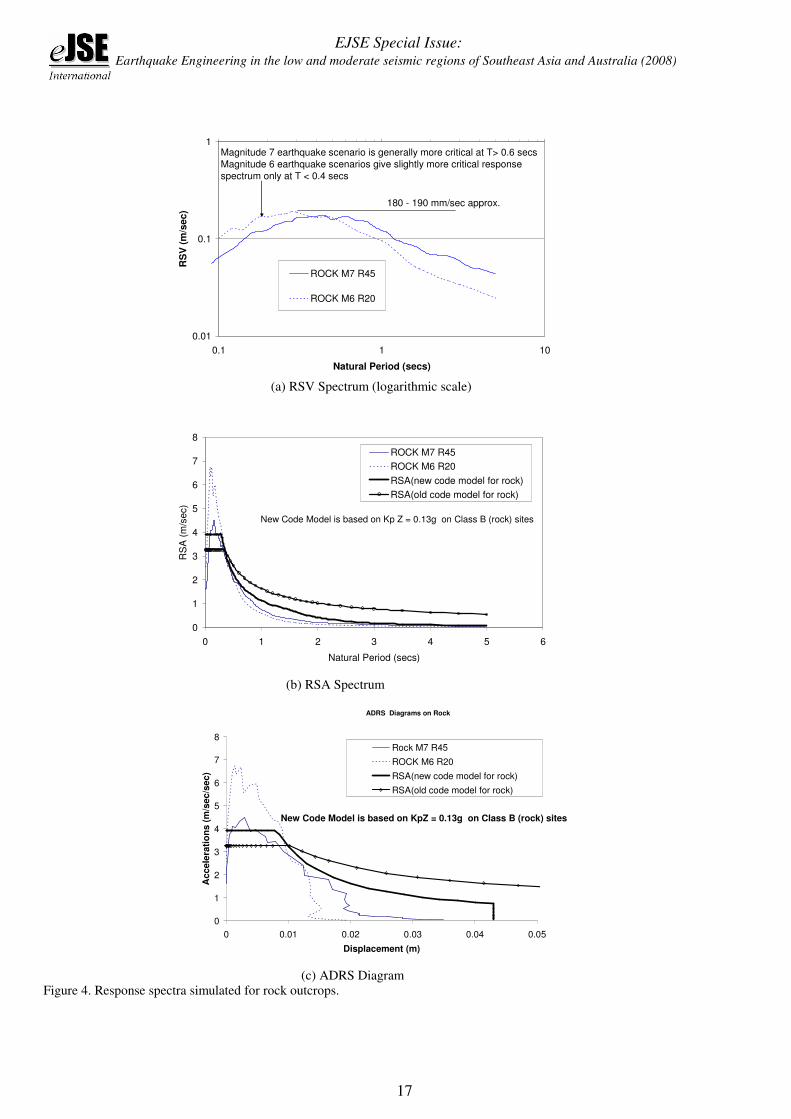
A sample acceleration time-history associated with the earthquake scenario of M7 R = 45 km and M6 R=20 km are shown in Figure 9. A tri-linear re-sponse spectrum model in the tri-partite (velocity) format for a hazard factor (KpZ) of 0.13g is con-structed in Figure 10 to envelope response spectra simulated for the conditions of rock outcrops (Area A) and soft soil conditions (Areas B-D). The tri-linear design response spectrum plotted actually cor-responds to that stipulated for a Class D/E site in AS1170.4: 2007 with hazard factor KpZ = 0.13g and calibrated site coefficient of Fa = 1.25 (for the accel-eration controlled region) and Fv = 2.6 (for the veloc-ity and displacement controlled regions). It is rec-ommended that this tri-linear envelope be used to
EJSE Special Issue: Earthquake Engineering in the low and moderate seismic regions of Southeast Asia and Australia (2008)
17
0.01
0.1
1
0.1 1 10
Natural Period (secs)
RS
V (
m/s
ec
)
ROCK M7 R45
ROCK M6 R20
Magnitude 7 earthquake scenario is generally more critical at T> 0.6 secs
Magnitude 6 earthquake scenarios give slightly more critical response
spectrum only at T < 0.4 secs
180 - 190 mm/sec approx.
(a) RSV Spectrum (logarithmic scale)
0
1
2
3
4
5
6
7
8
0 1 2 3 4 5 6
Natural Period (secs)
RS
A (
m/s
ec)
ROCK M7 R45
ROCK M6 R20
RSA(new code model for rock)
RSA(old code model for rock)
New Code Model is based on Kp Z = 0.13g on Class B (rock) sites
(b) RSA Spectrum
ADRS Diagrams on Rock
0
1
2
3
4
5
6
7
8
0 0.01 0.02 0.03 0.04 0.05
Displacement (m)
Accele
rati
on
s (
m/s
ec/s
ec)
Rock M7 R45
ROCK M6 R20
RSA(new code model for rock)
RSA(old code model for rock)
New Code Model is based on KpZ = 0.13g on Class B (rock) sites
(c) ADRS Diagram Figure 4. Response spectra simulated for rock outcrops.

EJSE Special Issue: Earthquake Engineering in the low and moderate seismic regions of Southeast Asia and Australia (2008)
18
Individual Simulations
0.01
0.1
1
0.1 1 10
Natural Period (secs)
RS
V (
m/s
ec)
Rock motions for M7 R=45km
(a) Individual Simulations
Averages of 3, 6, 12 and 18 records
0.01
0.1
1
0.1 1 10
Natural Period (secs)
RS
V (
m/s
ec)
average of 3
average of 6
average of 12
average of 18
Rock motions for M7 R=45km
(b) Averages of 3, 6, 12 and 18 Figure 5. Response spectra showing random variabilities.

EJSE Special Issue: Earthquake Engineering in the low and moderate seismic regions of Southeast Asia and Australia (2008)
19
Simulated acceleration time-history for M7 R=45km on rock
-3
-2
-1
0
1
2
3
0 2 4 6 8 10 12 14 16
time (secs)
acce
lera
tio
n (
m/s
ec/s
ec
)
(a) Earthquake scenario of M7 R = 45 km
Simulated acceleration time-history for M6 R=20km on rock
-3
-2
-1
0
1
2
3
0 2 4 6 8 10 12 14 16
time (secs)
ac
ce
lera
tio
n (
m/s
ec
/sec
)
(b) Earthquake scenario of M6 R = 20 km Figure 6. Sample acceleration time-histories on rock.

EJSE Special Issue: Earthquake Engineering in the low and moderate seismic regions of Southeast Asia and Australia (2008)
20
0.01
0.1
1
0.1 1 10
Natural Period (secs)
RS
V (
m/s
ec
)
Pier 12 Site M7 R45
Pier 13 Site M7 R45
Pier 15-25 site M7 R45
Pier 12 Site M6 R20
Pier 13 Site M6 R20
Magnitude 6 earthquake scenarios give slightly more
critical response spectral properties only at T < 0.4 secs
Pier 13 site spectrum
Magnitude 7 Scenario
M7 R=45km
Spectra for pier 15-25
are similar
Pier 12 site spectrum
Magnitude 7 scenario
M7 R=45km
(a) Velocity Response Spectrum
M7 R45 Site RSA
0
1
2
3
4
5
6
7
8
0 1 2 3 4 5 6
Natural Period (secs)
RS
A (
m/s
ec/s
ec
)
ROCK M7 R45
Pier 12 Site M7 R45
Pier 13 Site M7 R45
Pier 15-25 site M7 R45
RSA(new code model for Class D/E soil)
New Code Model is based on KpZ = 0.13g
and Fa = 1.25 , Fv = 2.6
The Fv value of 2.6 is between 2.3 for Class D sites and 3.5
for Class E sites
Hence, "Class D/E" is indicated in the legend
(b) Acceleration Response Spectrum
Soil Sites ADRS M7 R45
0
1
2
3
4
5
6
7
8
0 0.02 0.04 0.06 0.08 0.1 0.12
Displacement (m)
Acce
lera
tion
s (
m/s
ec/s
ec)
Rock M7 R45
Pier 12 site M7 R45
Pier 13 site M7 R45
Pier 15-25 site M7 R45
RSA(new code model for Class D/E soil)
New Code Model is based on KpZ = 0.13g
and Fa = 1.25 , Fv = 2.6
The Fv value of 2.6 is between 2.3 for Class D
sites and 3.5 for Class E sites
Hence, "Class D/E" is indicated in the legend
(c) Acceleration-Displacement Response Spectrum Diagram Figure 7. Response spectra simulated for soil surface.

EJSE Special Issue: Earthquake Engineering in the low and moderate seismic regions of Southeast Asia and Australia (2008)
21
Individual Simulations
0.01
0.1
1
0.1 1 10
Natural Period (secs)
RS
V (
m/s
ec
)
Soil surface motions at Pier 13 for M7 R=45km Averages of 3, 6, 12 and 18 records
0.01
0.1
1
0.1 1 10
Natural Period (secs)
RS
V (
m/s
ec
)
average of 3
average of 6
average of 12
Soil surface motions at Pier 13 for M7 R=45km
Figure 8 Response spectra showing random variabilities.
Simulated acceleration time-history for M6 R=20km
on soil surface at Pier 13
-3
-2
-1
0
1
2
3
0 2 4 6 8 10 12 14 16
time (secs)
accele
rati
on
(m
/sec/s
ec)
(a) Earthquake scenario of M7 R = 45 km
Simulated acceleration time-history for M7 R=45km
on soil surface at Pier 13
-3
-2
-1
0
1
2
3
0 2 4 6 8 10 12 14 16
time (secs)
ac
ce
lera
tio
n (
m/s
ec
/se
c)
(b) Earthquake scenario of M6 R = 20 km
Figure 9. Sample acceleration time-histories on soil surface.
EJSE Special Issue: Earthquake Engineering in the low and moderate seismic regions of Southeast Asia and Australia (2008)
22
Recommended Models in Velocity Spectrum Format
0.01
0.1
1
0.1 1 10
Natural Period (secs)
RS
V (
m/s
ec
)
Recommended model for soil surface (Pier 12 - East Abutment)
Recommended model for rock (West Abutment - Pier 11)
Velocity
Controlled
RegionAcceleration
Controlled
Region
Displacement
Controlled
Region
Figure 10. Recommended response spectrum models (based on KpZ = 0.13g)
Recommended Acceleration Response Spectra
0
1
2
3
4
5
6
0 0.5 1 1.5 2 2.5 3
Natural Period (secs)
RS
A (
m/s
ec/s
ec)
Recommended model for soil surface (Pier 12 - East Abutment)
Old code (AS1170.4:1993) model for soft soil (S=2)
Recommended model for rock (West Abutment - Pier 11)
Old code (AS1170.4:1993) model for rock
(a) Acceleration Response Spectrum Format
Recommended Response Spectrum Models
0
1
2
3
4
5
6
0 0.02 0.04 0.06 0.08 0.1 0.12
Displacement (m)
Acc
ele
rati
on
(m
/se
c/s
ec)
Recommended model for rock (West Abutment - Pier 11)
Recommended model for soil surface (Pier 12 - East Abutment)
Acceleration
Controlled
Velocity
Controlled
Displacement
Controlled
(b) ADRS Diagram Format
Figure 11. Recommended response spectrum models.
EJSE Special Issue: Earthquake Engineering in the low and moderate seismic regions of Southeast Asia and Australia (2008)
23
define the response spectrum model for the lifeline facility as illustrated in Figure 11 (acceleration response spec-trum and the ADRS diagram format respectively). A sample acceleration time-history associated with each of the projected earthquake scenarios is shown in Figure 6.
7 CONCLUSIONS
• Recent development of the neo-tectonic catalogue provides insights into the phenomenon of seismic migration and reveals limitations of the conven-tional modelling methodology based solely on the catalogue of historical earthquake events.
• The hybrid seismological (stochastic) model has been developed for Eastern Australia and other parts of the continent based on combining the ge-neric source model of intraplate earthquakes with the filtering models of the earth crusts.
• Peak ground velocities derived from the hybrid seismological model and that from Intensity in-formation have been compared. A calibration (site) factor of 2.0 – 2.2 which relates ground shakings predicted for a rock site to that for an av-erage site has been identified.
• The Component Attenuation Model (CAM) en-ables response spectrum parameters : RSVmax and RSDmax, or corner period T2, to be calculated for a given earthquake scenario using simple alge-braic expressions. Response spectra can be con-structed for rock sites using these parameters.
• Site classifications and amplification factors simi-lar to the NEHRP recommendations have been stipulated.
• The implementation of the response spectrum model for site-specific applications which allow for the effects of soil resonance has been illus-trated by the case-study of a lifeline facility in Australia.
REFERENCES
AS 2121 1979. The Design of earthquake Resistant Buildings known as the SAA Earthquake Code. Published by The Standards Association of Australia; Standards House, 80 Arthur St, North Sydney, NSW. ISBN 0 7262 1695 X.
AS/NZS 1170.0 2002. Australian/New Zealand Standard for Structural Design Actions, Part 0: General Principles.
AS/NZS 1170.4 2007. Australian/New Zealand Standard for Structural Design Actions, Part 4: Earthquake Actions in Australia..
AS1170.4 1993. Standards Association of Australia. Minimum design loads on structures : Part 4: Earthquake Loads - and Commentary, 1993.
Atkinson, G.M. 1993 “Earthquake source spectra in Eastern North America”. Bull. Seism. Soc, 83, 1778–1798.
Atkinson, G. M. and Boore, D. M. 1995. “Ground Motion Re-lations for Eastern North America”. Bulletin of the Seismol-ogical Society of America, 85, 17–30.
Atkinson, G.M. and Boore, D.M. 1998. “Evaluation of Models for Earthquake Source Spectra in Eastern North America”, Bulletin of the Seismological Society of America, 88, 917–934
Beresnev, I.A. and Atkinson, G.M. 2002. “Source Parameter of Earthquakes in Eastern and Western North America Based on Finite-Fault Modelling”, Bulletin Seismological Society of America; 92(2): 695-710.
Boore, D.M., Joyner, W.B. 1997. “Site amplifications for ge-neric rock sites”. Bulletin of the Seismological Society of America, 87 (2), 327–341.
Chandler A.M., & Lam N.T.K. 2004. “An attenuation model for distant earthquakes”, Earthquake Engineering and Structural Dynamics; 33:183–210.
Chandler, A.M., Lam, N.T.K. & Tsang, H.H. 2005. “Shear Wave Velocity Modelling in Crustal Rock for Seismic Haz-ard Analysis”, Soil Dynamics and Earthquake Engineering, 25(2): 167-185.
Chandler A.M., N.T.K. Lam, H.H. Tsang 2006a. “Regional and local factors in attenuation modelling: Hong Kong case study”. Journal of Asian Earth Sciences 27, 892-906
Chandler, A. M., Lam, N. T. K. & Tsang, H. H. 2006b. “Near-surface Attenuation Modelling based on Rock Shear-Wave Velocity Profile”, Soil Dynamics and Earthquake Engi-neering, 26(11): 1004-1014.
Clarke, D. 2006. “A seismic source zone model based on neo-tectonic data”, Proceedings of the Annual Technical Con-ference of the Australian Earthquake Engineering Society, Canberra, 69-76.
FEMA 1997. “1997 NEHRP Recommended Provisions for Seismic Regulations for New Buildings”. FEMA 273, USA: Federal Emergency Management Agency, Washington DC.
Gaull, B.A., Michael-Leiba, M.O., and Rynn, J.M.W., (1990), “Probabilistic earthquake risk maps of Australia”, Austra-lian Journal of Earth Sciences, 37: 169-187.
Hardin B.O., Drnevich V.P. 1972. “Shear modulus and damp-ing in soils: measurement and parameter effects”, Journal of Soil Mechanics and Foundations, ASCE, 98(SM6): 603-624.
Hutchinson, G.L., Lam, N.T.K. and Wilson, J.L. 2003. “De-termination of earthquake loading and seismic performance in intraplate regions”, Progress in Structural Engineering and Materials, John Wiley & Sons Ltd., 5:181-194. Invited Paper.
Idriss, I.M. and Sun, J.I. 1991. User’s manual for SHAKE-91, sponsored by National Institute of Standards and Technol-ogy, Maryland, U.S.A. and Department of Civil & Envi-ronmental Engineering, University of California, Davis, U.S.A., 1992.
International Building Code 2006. International Code Council 2006, California, USA: International Code Council.
Lam N.T.K., Wilson J.L. & Chandler, A.M. 2001. “Seismic Displacement Response Spectrum Estimated from the Frame Analogy Soil Amplification Model”, Journal of En-gineering Structures, 23: 1437-1452.
Lam N.T.K. 1999. Program GENQKE User;s Manual, Civil & Environmental Eng., Univ. of Melbourne
Lam, N.T.K. & Chandler, A.M. 2005. “Peak Displacement Demand in Stable Continental Regions”, Earthquake Engi-neering and Structural Dynamics, John Wiley & Sons Ltd, 34: 1047-1072.

EJSE Special Issue: Earthquake Engineering in the low and moderate seismic regions of Southeast Asia and Australia (2008)
24
Lam, N.T.K. and Wilson, J.L. 1999. “Estimation of the Site Natural Period from borehole records”, Australian Journal of Structural Engineering, SE1(3): 179-199. Awarded Chapman Medal.
Lam, N.T.K. and Wilson, J.L. 2004. “Displacement Modelling of Intraplate Earthquakes”, Special issue on Performance Based Seismic Design (Ed. Nigel Priestley), ISET Journal of Earthquake Technology, Indian Institute of Technology, 41(1), paper no. 439: 15-52. Invited Paper and BN Gupta Award Winning paper.
Lam, N.T.K., Sinadinovski, C. and Koo, R. & Wilson, J.L. 2003. “Peak Ground Velocity Modelling for Australian In-traplate Earthquakes”, International Journal of Seismology and Earthquake Engineering, International Institute of Earthquake Engineering and Seismology, 5(2): 11-22.
Lam, N.T.K., Wilson, J.L. and Hutchinson, G.L. 2000a. “Gen-eration of Synthetic Earthquake Accelerograms Using Seismological Modelling : A Review ", Journal of Earth-quake Engineering , 4(3): 321-354.
Lam, N.T.K., Wilson, J.L., Chandler, A.M. & Hutchinson, G.L. 2000b. “Response Spectral Relationships for Rock Sites Derived from The Component Attenuation Model”, Earth-quake Engineering and Structural Dynamics, 29(10): 1457-1490.
Lam, N.T.K., Wilson, J.L., Chandler, A.M. & Hutchinson, G.L.2000c. “Response Spectrum Modelling for Rock Sites in Low and Moderate Seismicity Regions Combining Ve-locity, Displacement and Acceleration Predictions”, Earth-quake Engineering and Structural Dynamics, 29(10): 1491-1526.
Lam,N.T.K., Asten, M., Roberts, J., Srikanth V., Wilson, J.L., Chandler, A.M. & Tsang, H.H. 2006. “Generic Approach for Modelling Earthquake Hazard”, Journal of Advanced Structural Engineering, 9(1): 67-82. Selected and Invited Paper.
Leonard, M. & Clarke, D. 2006. “Reconciling neotectonic and seismic recurrence rates in SW WA”, Proceedings of the Annual Technical Conference of the Australian Earthquake Engineering Society, Canberra, 19-24.
McCue, K., Dent, V. & Jones, T. 1995. “The Characteristics of Australian Strong Motion”, Proceedings of the Fifth Pacific Conference on Earthquake Engineering, 71-80.
Sabegh, S.Y. & Lam, N.T.K., (submitted), “Ground motion modelling in Tehran based on the stochastic method” sub-mitted for considerations for publication in Journal of Soil Dynamics and Earthquake Engineering.
Sandiford, M., Leonard, M. & Coblentz, D. 2003. “Geological Constraints on active seismicity in southeast Australia” Aus-tralian Earthquake Engineering Society. Proceedings of the 2003 Conference, University of Melbourne Paper No. 1.
Schnabel, P.B, Lysmer, J. & Seed, H.B. 1972.. “A computer program for earthquake response analysis of horizontally layered sites”, Earthquake Eng. Res. Centre report: EERC 72-12, Univ. of California Berkeley, USA.
Seed, H.B. and Idriss, I.M. 1970). Soil moduli and damping factors for dynamic response analyses Earthquake Eng. Res. Centre report UCB/EERC-70/10, Univ. of California Berkeley, California, U.S.A.
Somerville, M., McCue, K. & Sinadinovski, C. 1998.. “Re-ponse Spectra Recommended for Australia”, Australian Structural Engineering Conference, Auckland, 1998: 439-444.
Srikanth, V. 2006. A Soil Amplification Model for Intraplate Seismic Regions, PhD thesis, Department of Civil & Envi-ronmental Engineering, University of Melbourne.
Tsang, H.H., Chandler, A.M. & Lam, N.T.K. 2006a. “Estimat-ing non-linear site response by single period approxima-
tion”, Journal of Earthquake Engineering and Structural Dynamics. 35(9): 1053-1076.
Tsang, H.H., Chandler, A.M. & Lam, N.T.K. 2006b. “Simple Models for estimating site period shift and damping in soil”, Journal of Earthquake Engineering and Structural Dynam-ics, 35(15): 1925-1947.
Vucetic, M. & Dobry, R. 1991. “Effect of soil plasticity on cy-clic response”, Journal of Geotechnical Engineering, American Society of Civil Engineers, 117: 89-109.
Wilson, J.L. & Lam. N.T.K. 2003. “A recommended earth-quake response spectrum model for Australia”, Australian Journal of Structural Engineering. Engineers Australia, 5(1):17-27.
Wilson, J.L. & Lam. N.T.K. 2006. “Earthquake Design of Buildings in Australia by Velocity and Displacement Prin-ciples”, Australian Journal of Structural Engineering Transactions, Engineers, Australia, 6(2): 103-118. Awarded Warren Medal