The neutral model approach Stephen P. Hubbell (1942- Motoo Kimura (1924-1994)
13
The neutral model approach Stephen P. Hubbell (1942- Motoo Kimura (1924- 1994)
-
Upload
gyles-hensley -
Category
Documents
-
view
220 -
download
0
Transcript of The neutral model approach Stephen P. Hubbell (1942- Motoo Kimura (1924-1994)

The neutral model approach
Stephen P. Hubbell (1942- Motoo Kimura (1924-1994)

EI
S
All ecological patterns are now triggered by only one fundamental constant, universal biodiversity number that is the product 2pm, with p being the
speciation rate and m being the size of the metacommunity.
Metacommunity
BD
EI
BD
EI
BD
EI
BD
EI
BD
EI
BD
P
P
P
P
Local community
Ecological drift Zero sum multinomial
Neutral models try to explain ecological patterns by five basic stochastic processes:
- Simple birth processes - Simple death processes
- Immigration of individuals - Dispersal of individuals
- Lineage branching
Ecological driftZero sum multinomialSpecies equivalence
Ecological patterns are now triggered by one fundamental constant, the universal biodiversity number Q = 2pm, with p being the lineage branching rate and m the size of the metacommunity
Neutral models are individual based!
Although they make predictions about diversities they do not explicitly refer to species!
Diversities refer to evolutionary lineages
Metacommunity species richness: S= Q ln(Q /m)
Neutral theory of macroecology

• Irrespective of species randomly chosen individuals of an assemblage die with probability d• Irrespective of species randomly chosen individuals of an assemblage are born with probability
b• Irrespective of species randomly chosen individuals immigrate from other assemblages with
probability i• Irrespective of species randomly chosen individuals emigrate from local assemblages to others
with probability e• Irrespective of species randomly chosen individuals mutate into a new species with probability n
How does a neutral model work?
DB
E
I
S
Local community
Metacommunity
0 0 0 0 0 0iJ J iJ bJ eJ dJ J
Zero sum multinomial
Local community structure is determined by three basic parameters
The net reproduction rate r = b - d
The migration rate m = i - e
The metacommunity size J
The speciation rate n
Neutral models lack any specific biological interaction like
• Competition Mutualism
• Regulation Species specific survival

The speciation modes
I
I
I
I I
I
I I
I
I
5 patches with individuals of different lineages
Point mutation
One individual transforms into a new lineage with probability n
I
I
I
I I
I
I I
I
I
Peripheral isolate
A randomly chosen part of one lineage of a local unity
transforms into a new lineage with probability n
I
I
I
I I
I
I I
I
I
Fission track
A randomly chosen part of one lineage of the metacommunity transforms into a new lineage
with probability n
After many time steps an equilibrium is established
Analytical solution exists
2J Fundamental biodiversity number Q
ln 1J
S
a-diversity
No analytical solutions yet
The metacommuity has a log-series species abundance distribution.

1
10
100
1000
10000
0 5 10 15 20 25 30
Rank order
Abu
ndan
ce
Core species
0.1
1
10
100
0 5 10 15 20 25 30Rank order
Abu
ndan
ce
Satellite species
Neutral models make explicit predictions about
Abundance rank order relationships
Diversity and evenness
The study object: ground beetles on lake islands in Lake Mamry (Ulrich and Zalewski 2007)
Leistus rufomarginatusPhotos by Roy Anderson

Neutral models make explicit predictions about
Species - area relationships
Individuals – area relationships
0
5
10
15
20
25
30
35
40
45
0.01 0.1 1 10 100
Area
S
The study object: ground beetles on lake islands in Lake Mamry (Ulrich and Zalewski 2007)
Carabus granulatus
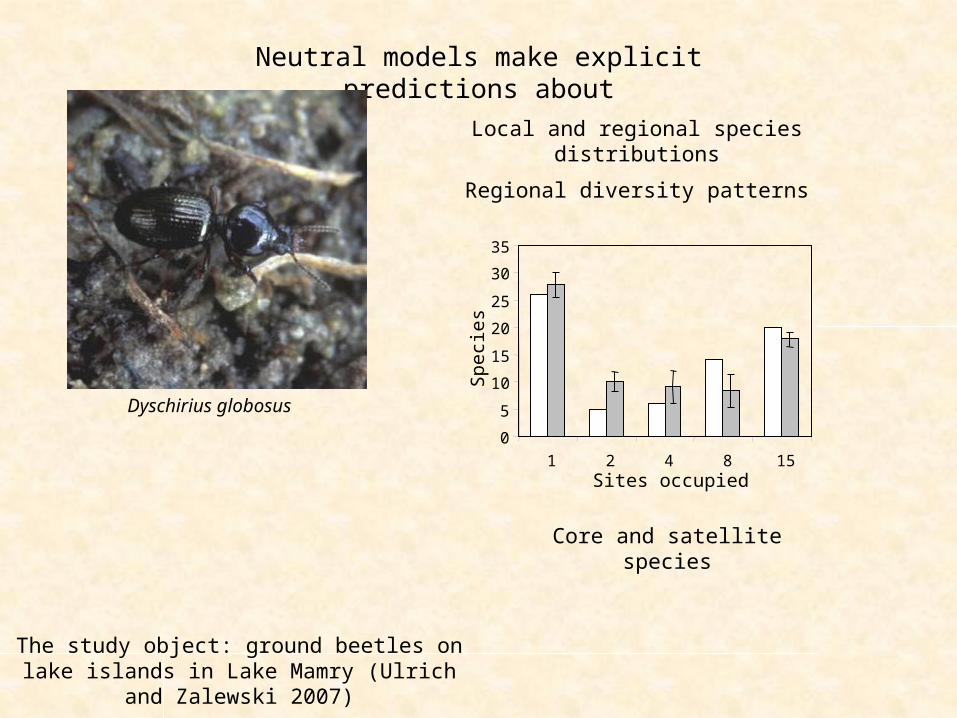
Neutral models make explicit predictions about
Local and regional species distributions
Regional diversity patterns
0
5
10
15
20
25
30
35
1 2 4 8 15Sites occupied
Spe
cie
s
Core and satellite species
The study object: ground beetles on lake islands in Lake Mamry (Ulrich and Zalewski 2007)
Dyschirius globosus

Neutral models make explicit predictions about
Abundance - range size relationships
Spatial species turnover
0
2
4
6
8
10
12
14
16
0.01 1 100
Mean site abundance
Occ
urre
nces
Observed
0
2
4
6
8
10
12
14
16
0.01 1 100
Mean site abundance
Occ
urre
nces
Predicted
The study object: ground beetles on lake islands in Lake Mamry (Ulrich and Zalewski 2007)
Patrobus atrorufus
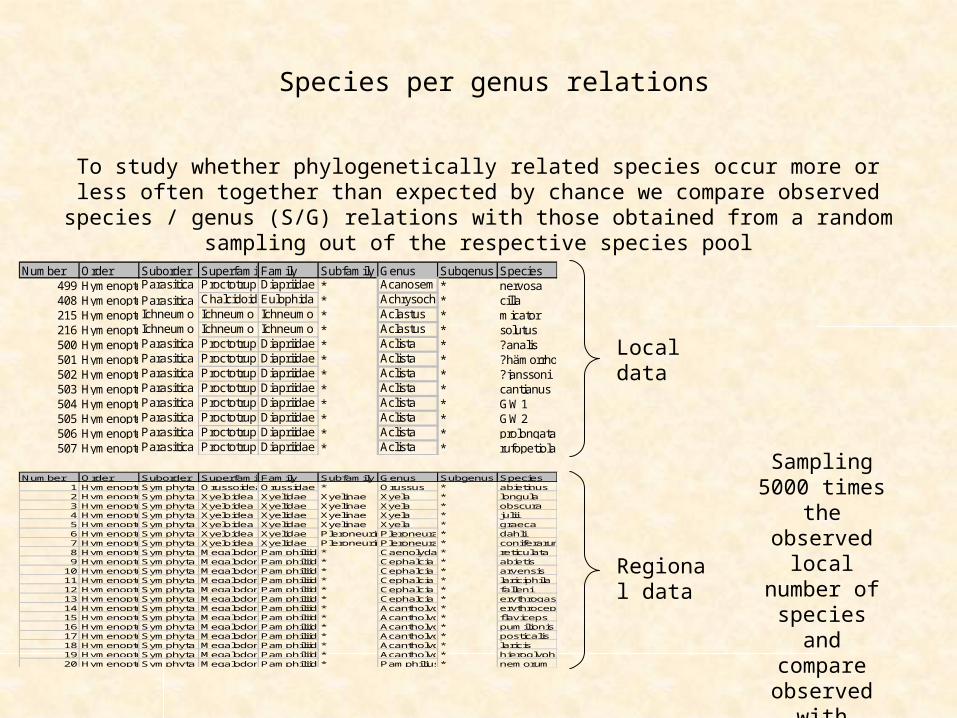
Species per genus relations
Number Order Suborder SuperfamilyFamily Subfamily Genus Subgenus Species1 HymenopteraSymphyta OrussoideaOrussidae * Orussus * abietinus2 HymenopteraSymphyta Xyeloidea Xyelidae Xyelinae Xyela * longula3 HymenopteraSymphyta Xyeloidea Xyelidae Xyelinae Xyela * obscura4 HymenopteraSymphyta Xyeloidea Xyelidae Xyelinae Xyela * julii5 HymenopteraSymphyta Xyeloidea Xyelidae Xyelinae Xyela * graeca6 HymenopteraSymphyta Xyeloidea Xyelidae PleroneurinaePleroneura* dahli7 HymenopteraSymphyta Xyeloidea Xyelidae PleroneurinaePleroneura* coniferarum8 HymenopteraSymphyta MegalodontoideaPamphiliidae* Caenolyda * reticulata9 HymenopteraSymphyta MegalodontoideaPamphiliidae* Cephalcia * abietis
10 HymenopteraSymphyta MegalodontoideaPamphiliidae* Cephalcia * arvensis11 HymenopteraSymphyta MegalodontoideaPamphiliidae* Cephalcia * lariciphila12 HymenopteraSymphyta MegalodontoideaPamphiliidae* Cephalcia * falleni13 HymenopteraSymphyta MegalodontoideaPamphiliidae* Cephalcia * erythrogaster14 HymenopteraSymphyta MegalodontoideaPamphiliidae* Acantholyda* erythrocephala15 HymenopteraSymphyta MegalodontoideaPamphiliidae* Acantholyda* flaviceps16 HymenopteraSymphyta MegalodontoideaPamphiliidae* Acantholyda* pumilionis17 HymenopteraSymphyta MegalodontoideaPamphiliidae* Acantholyda* posticalis18 HymenopteraSymphyta MegalodontoideaPamphiliidae* Acantholyda* laricis19 HymenopteraSymphyta MegalodontoideaPamphiliidae* Acantholyda* hieroglyphica20 HymenopteraSymphyta MegalodontoideaPamphiliidae* Pamphilius* nemorum
To study whether phylogenetically related species occur more or less often together than expected by chance we compare observed species / genus (S/G) relations with those
obtained from a random sampling out of the respective species pool
Number Order Suborder SuperfamilyFamily Subfamily Genus Subgenus Species499 HymenopteraParasitica Proctotrup Diapriidae * Acanosem * nervosa408 HymenopteraParasitica Chalcidoid Eulophida * Achrysoch * cilla215 HymenopteraIchneumo Ichneumo Ichneumo * Aclastus * micator216 HymenopteraIchneumo Ichneumo Ichneumo * Aclastus * solutus500 HymenopteraParasitica Proctotrup Diapriidae * Aclista * ?analis501 HymenopteraParasitica Proctotrup Diapriidae * Aclista * ?hämorrhoidalis502 HymenopteraParasitica Proctotrup Diapriidae * Aclista * ?janssoni503 HymenopteraParasitica Proctotrup Diapriidae * Aclista * cantianus504 HymenopteraParasitica Proctotrup Diapriidae * Aclista * GW1505 HymenopteraParasitica Proctotrup Diapriidae * Aclista * GW2506 HymenopteraParasitica Proctotrup Diapriidae * Aclista * prolongata507 HymenopteraParasitica Proctotrup Diapriidae * Aclista * rufopetiolata
Local data
Regional data
Sampling 5000 times
the observed local number
of species and compare
observed with expect S/G
ratios
Genus SpeciesFamily
Time
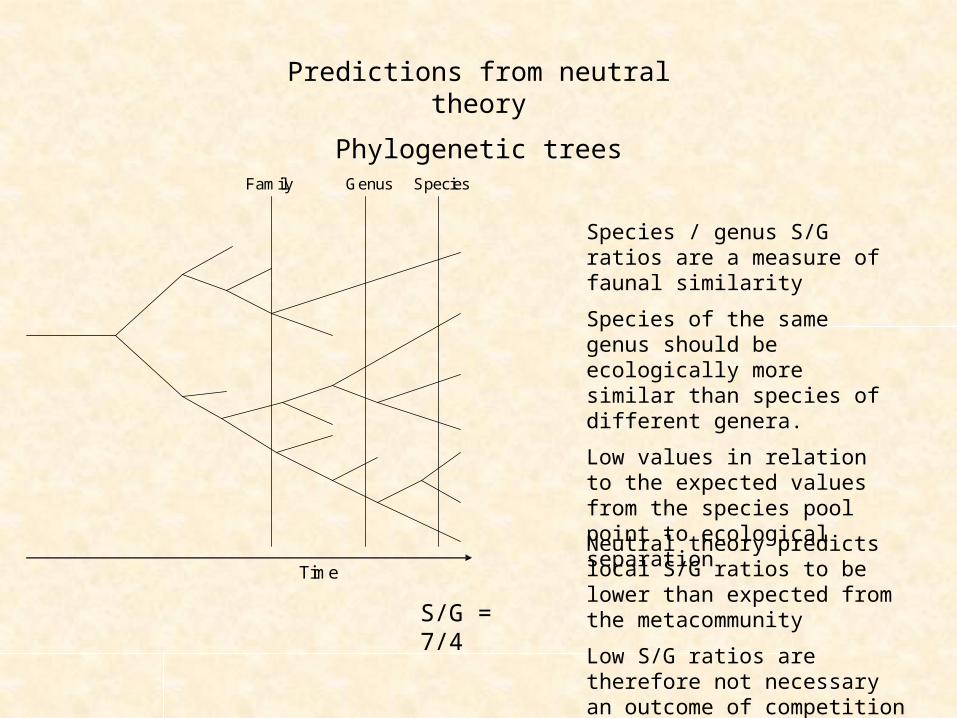
Predictions from neutral theory
Phylogenetic trees
Species / genus S/G ratios are a measure of faunal similarity
Species of the same genus should be ecologically more similar than species of different genera.
Low values in relation to the expected values from the species pool point to ecological separation
S/G = 7/4
Neutral theory predicts local S/G ratios to be lower than expected from the metacommunity
Low S/G ratios are therefore not necessary an outcome of competition

Older lineages are expected to have higher local and regional abundances
More widespread lineages should be older
The total number of lineages is predicted to grow exponentially with evolutionary time
1 3 11 21 270
10
20
30
40
50
0 1 2 3 4 5 6
TimeL
ine
ag
es
z
Predictions from neutral theory
Phylogenetic trees
Genus SpeciesFamily
Time
Genus SpeciesFamily
Time
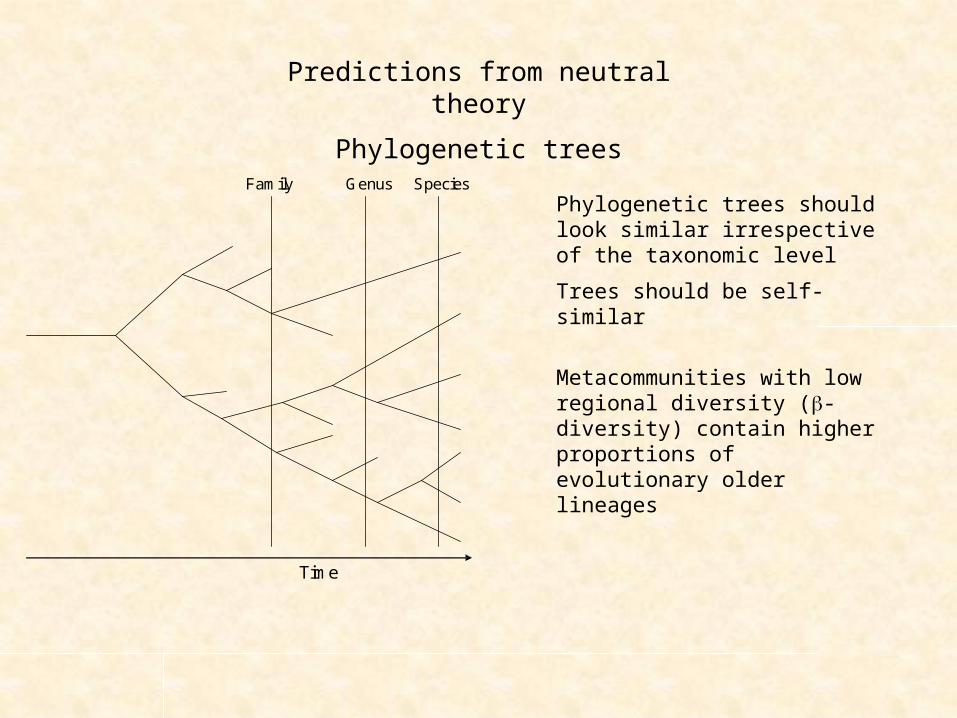
Predictions from neutral theory
Phylogenetic trees
Phylogenetic trees should look similar irrespective of the taxonomic level
Trees should be self-similar
Metacommunities with low regional diversity (b-diversity) contain higher proportions of evolutionary older lineages

Neutral theory: http://en.wikipedia.org/wiki/Unified_neutral_theory_of_biodiversity
Null and neutral models: www.uvm.edu/~ngotelli/manuscriptpdfs/gotelli_mcgill_ecography.pdf
Neutrality: www.zoology.ufl.edu/rdholt/holtpublications/189.pdf
Today’s reading