The Neuroactive Peptide N-Acetylaspartylglutamate (NAAG...
36
JPET #152553 - 1 - The Neuroactive Peptide N-Acetylaspartylglutamate (NAAG) is not an Agonist at the mGluR3 subtype of Metabotropic Glutamate Receptor Maninder Chopra, Yi. Yao, Timothy J. Blake, David. R. Hampson, Edwin. C. Johnson Dept of Neuroscience (MC, ECJ), and Dept of Chemistry (TJB), CNS/Pain Discovery, AstraZeneca Pharmaceuticals, Wilmington, Delaware Leslie Dan Faculty of Pharmacy, University of Toronto, Toronto, Ontario, Canada (YY, DRH) JPET Fast Forward. Published on April 23, 2009 as DOI:10.1124/jpet.109.152553 Copyright 2009 by the American Society for Pharmacology and Experimental Therapeutics. This article has not been copyedited and formatted. The final version may differ from this version. JPET Fast Forward. Published on April 23, 2009 as DOI: 10.1124/jpet.109.152553 at ASPET Journals on August 19, 2019 jpet.aspetjournals.org Downloaded from
Transcript of The Neuroactive Peptide N-Acetylaspartylglutamate (NAAG...

JPET #152553
- 1 -
The Neuroactive Peptide N-Acetylaspartylglutamate (NAAG)
is not an Agonist at the mGluR3 subtype of Metabotropic
Glutamate Receptor
Maninder Chopra, Yi. Yao, Timothy J. Blake, David. R. Hampson, Edwin. C.
Johnson
Dept of Neuroscience (MC, ECJ), and Dept of Chemistry (TJB), CNS/Pain Discovery,
AstraZeneca Pharmaceuticals, Wilmington, Delaware
Leslie Dan Faculty of Pharmacy, University of Toronto, Toronto, Ontario, Canada
(YY, DRH)
JPET Fast Forward. Published on April 23, 2009 as DOI:10.1124/jpet.109.152553
Copyright 2009 by the American Society for Pharmacology and Experimental Therapeutics.
This article has not been copyedited and formatted. The final version may differ from this version.JPET Fast Forward. Published on April 23, 2009 as DOI: 10.1124/jpet.109.152553
at ASPE
T Journals on A
ugust 19, 2019jpet.aspetjournals.org
Dow
nloaded from

JPET #152553
- 2 -
Running Title: NAAG is not an agonist at mGluR3 Receptor
Corresponding Author: Edwin C. Johnson
Address:
AstraZeneca Pharmaceuticals
1800 Concord Pike, CNS/Pain Discovery
Wilmington, Delaware 19850
Phone: (302) 886-4970
Fax: (302) 886-4140
Email: [email protected]
Number of Text Pages: 16
Number of Tables: 1
Number of Figures: 6
Number of References: 27
Number of Words:
Abstract: 220
Introduction: 654
Discussion: 979
List of abbreviations used in the paper:
4C3HPG: 4-carboxy-3-hydroxyphenylglycine; DCG-IV: 2S, 1'R, 2'R, 3'R)-2-(2, 3-
dicarboxycyclopropyl)glycine; HPLC: High Performance Liquid Chromatography;
mGluR3: Metabotropic Glutamate Receptor Subtype 3; NAAG: N-
acetylaspartylglutamate; NAALADase: N-acetyl-α-linked acidic dipeptidase
Section: Neuropharmacology
This article has not been copyedited and formatted. The final version may differ from this version.JPET Fast Forward. Published on April 23, 2009 as DOI: 10.1124/jpet.109.152553
at ASPE
T Journals on A
ugust 19, 2019jpet.aspetjournals.org
Dow
nloaded from

JPET #152553
- 3 -
ABSTRACT
The peptide N-acetylaspartylglutamate (NAAG) is present in high concentrations in
the mammalian central nervous system. Various mechanisms have been proposed for its
action including selective activation of the metabotropic glutamate receptor, mGluR3, its
action at NMDA receptor, or to produce glutamate by its hydrolysis catalyzed by an
extracellular protease. To re-examine its agonist activity at mGluR3, we co-expressed
human or rat mGluR3 with G-protein inward rectifying channels in Xenopus oocytes.
HPLC analysis of commercial sources of NAAG showed 0.38%-0.48% glutamate
contamination. While both human and rat mGluR3 were highly sensitive to glutamate
with EC50 of 58 and 28 nM respectively, purified NAAG (100 μM) had little activity
(7.7% of full activation by glutamate). Only in the millimolar range did it show
significant activity, possibly due to residual traces of glutamate remaining in the purified
NAAG preparations. In contrast, the unpurified NAAG sample did produce a full agonist
response with mGluR3 co-expressed with Gα15 with an EC50 of 120 μM, as measured by
a calcium release assay. This response can be explained by the 0.38-0.48% glutamate
contamination. Our results suggest that NAAG may not have a direct agonist activity at
the mGluR3 receptor. Thus, a number of in vivo and in vitro published results that did
not address the issue of glutamate contamination of NAAG preparations may need to be
re-evaluated.
This article has not been copyedited and formatted. The final version may differ from this version.JPET Fast Forward. Published on April 23, 2009 as DOI: 10.1124/jpet.109.152553
at ASPE
T Journals on A
ugust 19, 2019jpet.aspetjournals.org
Dow
nloaded from

JPET #152553
- 4 -
INTRODUCTION
The neurochemistry of the modified dipeptide N-acetylaspartylglutamate (NAAG)
has been studied extensively over the past 25 years. It is present in millimolar
concentrations in many neuronal pathways throughout the central nervous systems of
mammals (Coyle, 1997). NAAG is contained in vesicles and released from neurons in a
calcium-dependent manner (Neale et al., 2000). In the brain, the major mode of
metabolism of NAAG is via glutamate carboxypeptidase II, also known as either
prostate-specific membrane antigen, or N-acetyl-α-linked acidic dipeptidase
(NAALADase). In the CNS, this enzyme is present on astrocytes where it cleaves the
dipeptide into N-acetylaspartate and L-glutamate (Berger et al., 1999). The development
of inhibitors of this peptidase has been an active area of study because they have been
shown to produce beneficial effects in a wide variety of in vitro and in vivo cellular and
animal models of neurological disorders including amyotrophic lateral sclerosis (Ghadge
et al., 2003), pain, particularly inflammatory (Yamamoto et al., 2007), ischemia (Slusher
et al., 1999), and diabetic retinopathy (Neale et al., 2005).
Based on neurochemical profiling, it has been assumed for some time that
neuroprotective properties of NAAG stem from its reported ability to act as (a) a partial
agonist or antagonist at the NMDA receptor, and (b) a highly selective agonist at the
mGluR3 subtype of metabotropic glutamate receptor (mGluR3) with the latter being the
most widely accepted mechanism of action (Wroblewska et al., 1997; Neale et al., 2000).
The interaction of NAAG at the NMDA receptor has been controversial and it is not
This article has not been copyedited and formatted. The final version may differ from this version.JPET Fast Forward. Published on April 23, 2009 as DOI: 10.1124/jpet.109.152553
at ASPE
T Journals on A
ugust 19, 2019jpet.aspetjournals.org
Dow
nloaded from

JPET #152553
- 5 -
completely clear how the peptide affects NMDA receptor activity. For example, NAAG
was reported to activate NMDA receptors with an EC50 of 0.7 mM (Westbrook et al.,
1986), while others have reported that it possess antagonist activity at this receptor
(Bergeron et al., 2005; 2007). Among G-protein-coupled receptors, NAAG has been
reported to be a highly selective agonist at mGluR3 with an EC50 of 65 μM at a chimeric
receptor consisting of the extracellular ligand-binding domain of mGluR3 and the
transmembrane domain and carboxy terminus of mGluR1a (Wroblewska et al., 1997).
As with glutamate stimulation of mGluR3, NAAG stimulation is assumed to inhibit
the release of glutamate from nerve terminals, thereby affording neuroprotection in
excitoxic testing paradigms. Another potential mGluR3-mediated neuroprotective
mechanism is via the release of growth factors. Activation of mGluR3, which is
expressed in both neurons and astrocytes, by the Group II agonists DCG-IV and
4C3HPG, has been shown to protect neurons from excitotoxic cell death by inducing the
release of transforming growth factor beta from astrocytes (Bruno et al., 1998). In fact,
experiments conducted on mGluR2 and mGluR3 knockout mice strongly indicate that
much of the anti-excitotoxic properties of Group II mGluR agonists are mediated by the
mGluR3 receptor subtype rather than the mGluR2 subtype (Corti et al., 2007). Thus
mGluR3 may play a heretofore under-appreciated role in both normal brain function, and
in disease states.
The two Group II mGluRs, mGluR2 and mGluR3, are highly homologous with each
other. The rat sequences are 65% identical in the extracellular ligand binding domain and
75% identical in the transmembrane domain region. This high degree of amino acid
sequence homology has stymied the development of highly receptor subtype-specific
This article has not been copyedited and formatted. The final version may differ from this version.JPET Fast Forward. Published on April 23, 2009 as DOI: 10.1124/jpet.109.152553
at ASPE
T Journals on A
ugust 19, 2019jpet.aspetjournals.org
Dow
nloaded from

JPET #152553
- 6 -
compounds (Conn and Pin, 1997; Brauner-Osborne et al., 2007). Nevertheless, NAAG
has been suggested to be a selective agonist for mGluR3 (Wroblewska et al., 1997).
However, the molecular basis for this specificity has not been reported. A molecular
docking analysis conducted on the mGluRs has shown that the glutamate binding site is
rather restricted in terms of the space available for larger ligands, such as peptides, to
bind (Wang and Hampson, 2006; Wang et al., 2006). In the present study, we re-
examined the interaction of NAAG at Group II mGluRs. We found that unpurified
NAAG but not purified NAAG activated mGluR3, and that commercial preparations of
NAAG are contaminated with L-glutamate; the later finding likely explains the
previously reported activity at this receptor.
This article has not been copyedited and formatted. The final version may differ from this version.JPET Fast Forward. Published on April 23, 2009 as DOI: 10.1124/jpet.109.152553
at ASPE
T Journals on A
ugust 19, 2019jpet.aspetjournals.org
Dow
nloaded from

JPET #152553
- 7 -
METHODS
Purification of NAAG
NAAG purchased from Sigma was dissolved in ultrapure water. Prepacked poly-prep
cation exchange columns (2ml) from Bio-Rad (AG 50W-X8 resin, 200-400 mesh, Cat no:
731-6214) were washed with water and then with 5 bed volumes of 10 mM HCl (pH 2).
One ml of 10 mM NAAG was loaded onto the column; the unretained fraction containing
NAAG was collected and the column was washed with 1 bed volume of water followed
by 5 bed volumes of 10 mM HCl. The bound glutamate can be eluted with 1M
ammonium.
HPLC analysis
Amino acid analyses of unpurified commercial samples and purified samples of
NAAG were carried out using PITC derivatized amino acids on a Waters Alliance
Separation Module equipped with a Hypersil ODS column and a Waters 2487 dual
wavelength absorbance detector (set at 254 nm). The injection volume was 20 μl, the
mobile phase was 60% acetonitrile, and the column temperature was 48ºC. The data
were analyzed using Waters Empower 2 chromatography software.
Mass Spectrometric analysis of NAAG samples
The NAAG samples were analyzed by electrospray LCMS by loop injection and
gradient elution on a Waters QTOF-1 and an Agilent 6210 TOF (for accurate mass
measurements) fronted with Agilent 1100 and 1200 HPLC systems respectively. A
This article has not been copyedited and formatted. The final version may differ from this version.JPET Fast Forward. Published on April 23, 2009 as DOI: 10.1124/jpet.109.152553
at ASPE
T Journals on A
ugust 19, 2019jpet.aspetjournals.org
Dow
nloaded from

JPET #152553
- 8 -
purified batch from Sigma was diluted (x10) with water:acetonitrile:formic acid (1:1:0.1
v/v) prior to analysis (1 μl aliquot injections). The compound was studied under both
positive and negative ionization conditions. For gradient elution, a Discovery HS C18
75x2.1mm, 3 μM column was used at a flow rate of 0.5 ml/min. The analysis was
performed using mobile phases of water/acetonitrile/formic acid at ratios of 98:2:0.1 v/v
(phase A) and 2:98:0.05 (phase B). The gradient was ramped linearly from 2% to 95% B
over 10 min.
Functional analysis of mGluRs in HEK293 cells
Human embryonic kidney 293 cells (American Type Culture Collection # CRL 1573)
were transiently transfected in 6 well plates using 2 μg of rat wild-type mGlu3 (or rat
mGluR2) cDNA plus 2 μg of Gα15 cDNA using the Fugene 6 reagent (Roche
Biochemicals) or Lipofectamine 2000 (InVitrogen Inc.) as instructed by the
manufacturers. Twenty-four hours after transfection, the cells were plated in
polyornithine pre-treated 96-well microtiter plates (Costar black microtiter plates) at
100,000 cells/100μl of DMEM medium. Forty hours post-transfection, cells were
washed once with calcium assay buffer (20 mM HEPES, pH 7.4, 146 mM NaCl, 5 mM
KCl, 1 mM MgCl2, 1 mM CaCl2, 1 mg/ml bovine serum albumin and 1 mg/ml glucose)
and incubated at 37ºC in 100 μl of assay buffer. After a 2-hour incubation, the assay
buffer was changed and the cells were incubated for another 1 hour at 37ºC. The assay
buffer was removed and 30 μl of assay buffer containing 6 μM of Fluo-4 (Molecular
Probes Inc.) was added into each well; the cells were incubated for 1 hour at room
temperature in the dark. The cells were washed 3 times with assay buffer and then
This article has not been copyedited and formatted. The final version may differ from this version.JPET Fast Forward. Published on April 23, 2009 as DOI: 10.1124/jpet.109.152553
at ASPE
T Journals on A
ugust 19, 2019jpet.aspetjournals.org
Dow
nloaded from

JPET #152553
- 9 -
incubated in 150 μl of assay buffer for 30 min. at room temperature in the dark. Agonists
were dissolved in assay buffer and the responses were recorded on a FLEXstation
benchtop scanning fluorometer (Molecular Devices Corp., Sunnyvale CA) at room
temperature with settings of 485 nm for excitation and 525 nm for emission. Maximal
responses were observed with 1 mM L-glutamate. Thus, in each experiment the results
are expressed as a percentage of the response obtained with 1 mM L-glutamate, and
described as % activation. The Graphpad Prism software was used to plot fluorescence
intensities and calculate the EC50 values.
Preparation of Xenopus oocytes
Surgically removed ovarian lobes of Xenopus laevis frogs were obtained
commercially (Nasco), and teased out in OR2 solution (82 NaCl, 2.5 KCl, 5 HEPES, 1.5
NaH2PO4, 1 MgCl2, 0.1 EDTA, in mM, pH 7.4). The oocytes were defolliculated by
incubation in 25 mL OR2 containing 2 mg/mL collagenase 1A (Sigma) two times for
about 60 minutes on a platform vibrating at 1Hz and stored in 0.5 X Leibovitz’s L-15
medium containing 50mg/ml gentamycin, 10 units/ml penicillin, and 10mg/ml
streptomycin.
Preparation and injection of cRNA
Capped cRNAs from the linearized vectors containing human mGluR3, Human Kir
3.1 and Kir 3.4 genes were prepared using mMESSAGE mMACHINE T7 Ultra Kit
(Ambion, Cat#AM1345). For rat mGluR3 cRNA, N-cmyc-tagged mGluR3 or mGluR2
DNA was linearized by NotI and 1 μg of purified linearized DNA was mixed with
NTP/ARCA, T7 reaction buffer and T7 enzyme mix in total volume of 20 μl, and
This article has not been copyedited and formatted. The final version may differ from this version.JPET Fast Forward. Published on April 23, 2009 as DOI: 10.1124/jpet.109.152553
at ASPE
T Journals on A
ugust 19, 2019jpet.aspetjournals.org
Dow
nloaded from

JPET #152553
- 10 -
incubated at 370C for 2 hours. After adding 1 μl of DNase I, the mixture was incubated
at 370C for 15 min, then 20 μl of 5xE-PAP buffer, 10 μl of 25 mM MnCl2, 10 ul of ATP
solution, 4 μl of E-PAP and 36 μl of RNAse-free water were added. After 45 min
incubation at 37ºC, the mixture was placed on ice. cRNA was purified by
phenol:chloroform extraction and isopropanol precipitation. Freshly harvested oocytes
(0-1 day old) were injected with 25-50 nL of RNA cocktail with approximately 5-10 ng
of the mGluR3 and 1 ng each of Kir 3.1 and 3.4. The injected oocytes were incubated in
at room temperature for 3-7 days before recording.
Two-Electrode Voltage-Clamping Measurements
All measurements were done in a medium containing ND-96 (96 NaCl, 2 KCl, 1.8
CaCl2.2H2O, 1 MgCl2.6H2O, 5 HEPES, in mM, pH 7.5). Two-electrode voltage-clamp
recording was carried out using OpusXpress amplifier (Axon Instruments, Foster City,
CA), which allows simultaneous recording from 8 oocytes. The assays for GIRK-based
mGluR2 and mGluR3 activation in oocytes have been described (Saugstad et al, 1996,
Sharon et al., 1997). Oocytes were impaled with two electrodes of 0.5-2 MΩ tip
resistance when filled with 3M KCl. Membrane potential was clamped at -60mV.
Current amplitude was measured from baseline to peak using Clampfit (Axon Inst.,
Foster City, CA). Various other data shown here were fitted and plotted using GraphPad
Prism (GraphPad Software, Inc. San Diego, CA). The GIRK currents mediated through
Kir 3.1/3.4 are K+ channels were uncovered by perfusing the oocytes with High K buffer
(2 NaCl, 96 KCl, 1.8 CaCl2.2H2O, 1 MgCl2.6H2O, 5 HEPES, in mM, pH 7.5), typically
for 120-180 seconds. A pulse of 60-120 seconds of agonist(s) was applied during the
This article has not been copyedited and formatted. The final version may differ from this version.JPET Fast Forward. Published on April 23, 2009 as DOI: 10.1124/jpet.109.152553
at ASPE
T Journals on A
ugust 19, 2019jpet.aspetjournals.org
Dow
nloaded from

JPET #152553
- 11 -
High K+ pulse, to measure agonist activation of mGluR3 receptor and Gβγ production,
which in turn modulates the GIRK currents. For LY341495 antagonist experiments, the
agonist pulse was followed by a solution with added antagonist. Application of 3 mM
Ba2+ in the buffer blocked most or all of the currents, showing that the current being
measured is largely mediated through GIRK channels (data not shown).
Data analysis
Dose-response curves for agonists and antagonists were fitted by nonlinear regression
to the equations: I = Imax/[1 + (EC50/Ag)n] or I = Imax Imax/[1 + (IC50/An)n] wherein
Imax = maximal normalized current response (in the absence of antagonist for inhibitory
curves), Ag = agonist concentration, An = antagonist concentration, EC50 = agonist
concentration eliciting half maximal current, IC50 = antagonist concentration eliciting half
maximal current, and n = Hill coefficient. Antagonist curves were constrained to Imax=1
and Imin= 0. For agonist efficacy curves, Imin was constrained to 0, but Imax was not
constrained. For the antagonists, IC50 values were converted to Kb values using the Leff-
Dougall (Leff and Dougall, 1993) variant of the Cheng-Prusoff equation: Kb =
IC50/((2 + ([Ag]/[EC50])n)1/n 1), where Ag is the agonist, and n = Hill coefficient.
This article has not been copyedited and formatted. The final version may differ from this version.JPET Fast Forward. Published on April 23, 2009 as DOI: 10.1124/jpet.109.152553
at ASPE
T Journals on A
ugust 19, 2019jpet.aspetjournals.org
Dow
nloaded from

JPET #152553
- 12 -
RESULTS
Purification of NAAG
There have been previous speculations that the commercial NAAG may have
significant impurities, including glutamate (Losi et al., 2004). NAAG obtained from
Sigma was purified on a cation exchange column essentially as described earlier in Losi
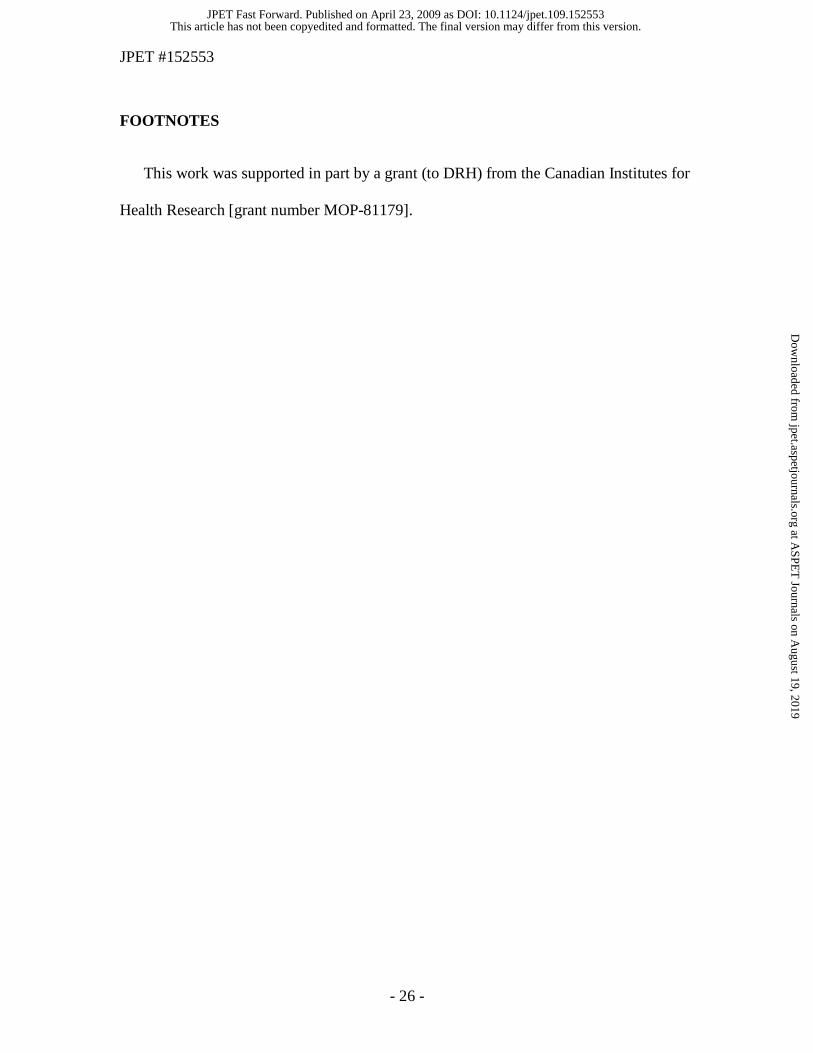
et al., (2004). Figure 1 shows HPLC chromatogram of unpurified (upper panel) and
purified (lower panel). Quantification of the glutamate peak area showed that the
unpurified NAAG from various batches of Sigma were contaminated with glutamate in
the range of 0.38-0.48%, as seen in the Figure 1 peak marked Glu. The batches purified
in this study had significantly lower glutamate levels (0.01%), as shown by the
diminished glutamate peak in the chromatogram in Figure 1. Since NAAG does not
possess a free amino group to react with the derivitizing reagent, it is not present in the
chromatogram. Losi et al (2004) reported that all commercial NAAG sources contain
between 0.1-0.5% glutamate, and they had to purify NAAG from Tocris (to < 0.1% in
their studies). Our qualitative HPLC analysis supports this observation that NAAG from
Tocris also contained glutamate. A recent study further confirmed glutamate
contamination in NAAG from Tocris to be ~0.5% (Fricker et al. 2009). We focused all
our studies starting with commercial NAAG from Sigma.
We went on to establish unequivocally if the purified NAAG indeed was structurally
intact. For that purpose, purified NAAG was spectroscopically confirmed by electrospray
mass spectrometric analysis. The ESI(+) and ESI(-) mass spectra obtained from analysis
of the purified sample from Sigma are shown in Figure 2. The ESP(+) mass spectrum
This article has not been copyedited and formatted. The final version may differ from this version.JPET Fast Forward. Published on April 23, 2009 as DOI: 10.1124/jpet.109.152553
at ASPE
T Journals on A
ugust 19, 2019jpet.aspetjournals.org
Dow
nloaded from

JPET #152553
- 13 -
shows the protonated molecular ion at m/z 305 together with the protonated dimer at m/z
609. The corresponding ESP(-) negative ions were observed at m/z 303 and 607
respectively. The spectra confirm the molecular mass of the neutral molecule as 304 Da.
The elemental composition of the protonated molecular ions (m/z 305) from the two
NAAG samples was confirmed, by accurate mass measurement to within 1.04 ppm
respectively.
Analysis of Purified and Unpurified NAGG in a Calcium Release Assay.
The effect of commercial (Sigma) unpurified NAAG on mGluR3 co-expressed with
Gα15 was measured by calcium-based fluorescence on a FLEXstation. Unpurified NAAG
elicited robust activation with EC50 of 120 μM (Figure 3). In contrast, purified
preparations of NAAG elicited no measurable response in this assay up to 5 mM on
mGluR3 or mGluR2.
Effect of NAAG on mGluR3 expressed in Xenopus oocytes
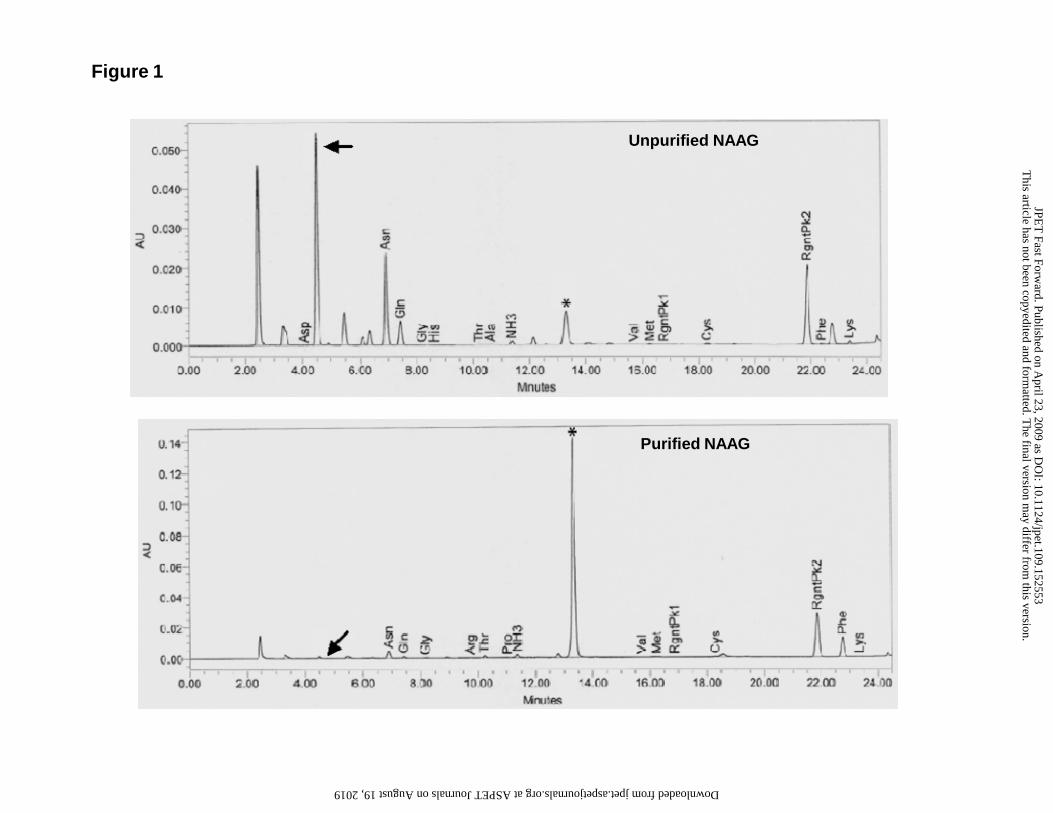
To assess functional activity of unpurified and purified NAAG, human and rat
mGluR3 receptors were co expressed with GIRK1 and GIRK4. Glutamate elicited robust
responses to the GIRK current, which enabled us to characterize effect of NAAG as
compared to glutamate in a more quantitative fashion. Concentration response curves
showed that both human and rat mGluR3 are highly sensitive to glutamate, with 58 and
28 nM EC50 respectively (Figure 5). Application of commercial unpurified NAAG at 10
or 100 μM elicited strong current responses in both human (Figure 4b) and rat mGluR3
(data not shown). Responses to 100 μM NAAG were comparable to that with 1 mM
This article has not been copyedited and formatted. The final version may differ from this version.JPET Fast Forward. Published on April 23, 2009 as DOI: 10.1124/jpet.109.152553
at ASPE
T Journals on A
ugust 19, 2019jpet.aspetjournals.org
Dow
nloaded from

JPET #152553
- 14 -
glutamate applied to same at the end of experiment (Figure 4b). The glutamate response
was slightly smaller than the impure NAAG response, possibly due to desensitization or
run-down. Over multiple studies we did not observe a difference between maximal
stimulation by glutamate or unpurified NAAG. Purified NAAG, on the other hand, had
significantly reduced responses to both human (Figure 4a) and rat mGluR3 (Figure 4c).
The purified NAAG preparations still had a low level of residual glutamate, which could
be responsible for residual activity seen in Figure 4a and 4c. Employing the numbers
from the HPLC assay for the purified NAAG (0.01% glutamate), 100 μM purified
NAAG would still have 10 nM of glutamate, sufficient to elicit a small response. An
application of 10 nM glutamate elicited a response 5.5 + 1.1% of the full agonist response
on human mGluR3 (data from Figure 5), which fully explains residual current (~7.7 %)
by 100 μM purified NAAG in Figure 4a. Table 1 summarizes the effect of unpurified
and purified NAAG on human mGluR3, showing that purified NAAG had highly
diminished responses as compared to commercial unpurified NAAG.
If residual glutamate in the commercial NAAG preparations is responsible for its
activity on mGluR3, a competitive antagonist should inhibit the activation with similar
potency. Thus, if we compare the inhibition by mGluR3 directly activated by glutamate
(1 μM) to that activated by NAAG, where the concentration of the calculated
contaminating glutamate in the NAAG sample is also 1 μM, the inhibition curves should
be the same or very similar. The batch of NAAG used at 250 μM has approximately 1
μM glutamate, and is expected to fully activate human mGluR3 receptors (Figure 5).
Human mGluR3 receptors were stimulated with either 250 μM commercial NAAG
(Sigma) or 1 μM glutamate and dose-dependently inhibited with the mGluR2/3 selective
This article has not been copyedited and formatted. The final version may differ from this version.JPET Fast Forward. Published on April 23, 2009 as DOI: 10.1124/jpet.109.152553
at ASPE
T Journals on A
ugust 19, 2019jpet.aspetjournals.org
Dow
nloaded from

JPET #152553
- 15 -
orthosteric antagonist, LY341495 in the Xenopus oocyte assay. The inhibition curves
from this study were essentially identical (Figure 6a). LY341495 inhibited both NAAG-
and glutamate-activated mGluR3 with an IC50 of 57 and 71 nM respectively (Figure 6a).
This corresponds to a calculated Kb of 4.8 and 3.0 nM or log(Kb) of –8.3 or –8.5
respectively. (Note, the Kb used here is the Leff-Dougall variant of the Cheng-Prusoff
equation that determines antagonist affinity in functional tests correcting for the agonist
EC50, Hill number and agonist concentration (Leff and Dougall, 1993).
As a final demonstration of the presence of glutamate in commercial unpurified
NAAG, we tested NAAG on human mGluR2 co-expressed with GIRK channels in
Xenopus oocytes. Application of 1 mM commercial NAAG (Sigma) elicited a response
that was blocked by LY341495 in a dose-dependent manner with an IC50 of 58 nM
(Figure 6b). The response to 1 mM NAAG was 64% (63.4 + 0.087; n=7) as compared
to100 μM glutamate, which causes 100% activation. The glutamate contamination in 1
mM NAAG was calculated to be about 4-5 μM; the activation observed with commercial
1 mM NAAG on mGluR2 was very similar to that with equivalent glutamate (EC50 for
glutamate on human mGluR2 is 2.6 μM, data not shown).
This article has not been copyedited and formatted. The final version may differ from this version.JPET Fast Forward. Published on April 23, 2009 as DOI: 10.1124/jpet.109.152553
at ASPE
T Journals on A
ugust 19, 2019jpet.aspetjournals.org
Dow
nloaded from

JPET #152553
- 16 -
DISCUSSION
We explored the possibility that the activity of NAAG at mGluR3 is due to glutamate
contamination in commercial samples rather than direct activation of mGluR3 by NAAG,
in part, because we had variable results with commercial, “off the shelf” samples. Other
studies have questioned the purity of commercial NAAG (Losi et al., 2004) using
purified NAAG to reassess its at native NMDA receptors and concluded that NAAG was
not active at NMDA receptor in cerebellar granule cells. Given this, we set out to
examine the purity of NAAG and whether the purity of NAAG altered its agonist activity
at mGluR3.
When rat mGluR3 co-expressed with Gα15 was tested the in FLEXstation calcium
release assay, we observed that commercial NAAG preparations had low potency (EC50 =
120 μM) consistent with previous publications (Wroblewska et al., 1997). HPLC analysis
of these NAAG preparations showed that there was significant contamination with
glutamate. We estimated that this contamination is approximately 0.38-0.48%. NAAG.
Commercial NAAG preparation was then purified through an ion exchange column,
which substantially reduced the glutamate level to 0.01%. This purified NAAG
preparation was inactive at mGluR3 in the Flexstation assay. Mass spectrometric
analysis confirmed that intact NAAG was present in the purified samples.
To independently confirm this observation, we assessed the activity of glutamate,
commercial NAAG, and the glutamate-depleted NAAG in Xenopus oocytes expression
rat or human mGluR3 with GIRK. In this preparation, we confirmed the high potency of
This article has not been copyedited and formatted. The final version may differ from this version.JPET Fast Forward. Published on April 23, 2009 as DOI: 10.1124/jpet.109.152553
at ASPE
T Journals on A
ugust 19, 2019jpet.aspetjournals.org
Dow
nloaded from

JPET #152553
- 17 -
glutamate (EC50= 58 nM at human mGluR3 and 28 nM at rat mGluR3). Commercial
NAAG showed robust currents confirming the Flexstation observations. Additionally the
glutamate-depleted NAAG was nearly inactive; residual activity could be due to the trace
remaining glutamate. Thus, in the NAAG dose-response study in the Flexstation, at the
EC50 (120 μM) there would have been approximately 0.6 μM glutamate. In the oocytes
studies, the 10 and 100 μM NAAG would have approximately 0.5 and 5 μM glutamate
respectively. Given the high potency of glutamate at mGluR3, this level of glutamate
contamination is sufficient to explain the NAAG responses in both assays. The
observation that the inhibition curves of NAAG or glutamate by LY341495 overlap, and
their corresponding Kb values are similar, constitutes independent support for our
hypothesis that the activation of mGluR3 by NAAG is through contaminating glutamate.
Finally, the commercial NAAG sample was able to activate mGluR2 at high doses
predicted by the level of glutamate contamination. Thus, these data demonstrate that at
recombinant rat and human mGluR3, N-acetylaspartylglutamate, NAAG, is not an
agonist.
Demonstrating that NAAG is not a selective mGluR3 agonist has implications on
studies published previously and their resulting interpretations. Schweitzer et al. (2000)
demonstrated, using 3H-LY354740 that glutamate (from Tocris) had an affinity of 0.44
μM at mGlu3 and 1.2 μM at mGluR2 while NAAG showed affinities of 19 μM and 236
μM respectively. These NAAG affinity determinations can be explained by glutamate
contamination in the NAAG preparation. Similarly, a number of studies have used
NAAG to demonstrate an activity in native preparations and ascribe this to activation of
mGluR3.
This article has not been copyedited and formatted. The final version may differ from this version.JPET Fast Forward. Published on April 23, 2009 as DOI: 10.1124/jpet.109.152553
at ASPE
T Journals on A
ugust 19, 2019jpet.aspetjournals.org
Dow
nloaded from

JPET #152553
- 18 -
Our findings suggest that conclusions from earlier studies investigating the effects of
NAAG on mGluR3 will need to be re-evaluated. A number of studies have used NAAG
in native preparations and shown a lack of activity and interpreted the result as
demonstration that mGluR3 is not involved in the observed activity. For example, Neale
and Salt (2006) showed that the mGluR2/3 agonist, LY354740 modulated the IPSCs in
the superior colliculus while NAAG (up to 500 μM) was without activity. These results
were interpreted to demonstrate that the activity of LY354740 was mediated by mGluR2.
Another study (Poschel et al., 2005) suggested that “mGluR3 is critically required for
hippocampal LTP” based on the activity of commercial NAAG in an in vivo preparation.
In these studies, and others, the use of NAAG to show the role of mGluR3 needs to be re-
evaluated since almost all have not have addressed the issue of glutamate contamination.
Thus, the in vivo effects of NAAG previously described are likely due to other
mechanisms, such as NAAG as a source of glutamate released by the action of NAAG
peptidases. The interpretation of different studies is further confounded by the possibility
that mGluR3 receptor may have coupling to different G-proteins in different systems
(Wroblewska et al., 2006). A number of publications have linked mGluR3 to the
pathophysiology of schizophrenia (Coyle, 2006) through candidate gene association
studies (Addington et al., 2004). These hypotheses on the role of mGluR3 in
schizophrenia have been, at least in part, based on using NAAG to demonstrate a
selective mGluR3 action. A recent study further supported our findings that commercial
sources of NAAG are contaminated with glutamate. They showed that purified NAAG
had little effect on GIRK currents from HEK cells transfected with human mGluR2 or
mGluR3 and human GIRK1/2 (Fricker et al., 2009). They also showed that 1 μM
This article has not been copyedited and formatted. The final version may differ from this version.JPET Fast Forward. Published on April 23, 2009 as DOI: 10.1124/jpet.109.152553
at ASPE
T Journals on A
ugust 19, 2019jpet.aspetjournals.org
Dow
nloaded from

JPET #152553
- 19 -
LY341495 abolished glutamate evoked GIRK. They did not show if LY341495 inhibits
currents stimulated by commercial NAAG. We have explored this in quite more detail in
a Xenopus oocyte based assay. First we show that commercial NAAG induced currents
are inhibited by LY341495 in a dose-dependent manner in both human mGluR2 and
mGluR3. Detailed Concentration-response curves on both human mGluR3 and human
mGluR2 allowed us to calculate the affinity of the active moiety in commercial NAAG to
be identical to that of glutamate, suggesting that glutamate is indeed likely
pharmacological moiety responsible for this activity in impure NAAG. We further
confirmed purity of NAAG in our purified preparations by mass-spectroscopic
techniques.
In summary, we have shown that NAAG is not an agonist at mGluR3 receptor. We
speculate that it may have an alternative role, such as acting as a NAALAdase-regulated
reservoir of glutamate. The hypothesis that the high concentration of NAAG in the CNS
could NAAG may serve as an important source of physiological glutamate requires
further investigation.
This article has not been copyedited and formatted. The final version may differ from this version.JPET Fast Forward. Published on April 23, 2009 as DOI: 10.1124/jpet.109.152553
at ASPE
T Journals on A
ugust 19, 2019jpet.aspetjournals.org
Dow
nloaded from

JPET #152553
- 20 -
ACKNOWLEDGEMENTS
We wish to thank Geeta Ayer and Alan Robbins for generating the human mGluR3
and Kir constructs.
This article has not been copyedited and formatted. The final version may differ from this version.JPET Fast Forward. Published on April 23, 2009 as DOI: 10.1124/jpet.109.152553
at ASPE
T Journals on A
ugust 19, 2019jpet.aspetjournals.org
Dow
nloaded from

JPET #152553
- 21 -
REFERENCES
Addington AM, Gornick M, Sporn AL, Gogtay N, Greenstein D, Lenane M, Gochman P,
Baker N, Balkissoon R, Vakkalanka RK, Weinberger DR, Straub RE, Rapoport JL.
(2004) Polymorphisms in the 13q33.2 gene G72/G30 are associated with childhood-onset
schizophrenia and psychosis not otherwise specified. Biol Psychiatry 55:976-980.
Berger UV, Luthi-Carter R, Passani LA, Elkabes S, Black I, Konradi C, Coyle JT. (1999)
Glutamate carboxypeptidase II is expressed by astrocytes in the adult rat nervous system.
J Comp Neurol 415:52-64.
Bergeron R, Coyle JT, Tsai G, Greene RW. (2005) NAAG reduces NMDA receptor
current in CA1 hippocampal pyramidal neurons of acute slices and dissociated neurons.
Neuropsychopharmacology 30:7-16.
Bergeron R, Imamura Y, Frangioni JV, Greene RW, Coyle JT. (2007) Endogenous N-
acetylaspartylglutamate reduced NMDA receptor-dependent current neurotransmission in
the CA1 area of the hippocampus. J Neurochem 100:346-357.
Brauner-Osborne H, Wellendorph P, Jensen AA. (2007) Structure, pharmacology and
therapeutic prospects of family C G-protein coupled receptors. Curr Drug Targets 8:169-
184.
Bruno V, Battaglia G, Casabona G, Copani A, Caciagli F, Nicoletti F. (1998)
Neuroprotection by glial metabotropic glutamate receptors is mediated by transforming
growth factor-beta. J Neurosci 18:9594-9600.
This article has not been copyedited and formatted. The final version may differ from this version.JPET Fast Forward. Published on April 23, 2009 as DOI: 10.1124/jpet.109.152553
at ASPE
T Journals on A
ugust 19, 2019jpet.aspetjournals.org
Dow
nloaded from

JPET #152553
- 22 -
Conn PJ and Pin JP. (1997) Pharmacology and functions of metabotropic glutamate
receptors. Annu Rev Pharmacol Toxicol 37:205-237.
Corti C, Battaglia G, Molinaro G, Riozzi B, Pittaluga A, Corsi M, Mugnaini M, Nicoletti
F, Bruno V. (2007) The use of knock-out mice unravels distinct roles for mGlu2 and
mGlu3 metabotropic glutamate receptors in mechanisms of
neurodegeneration/neuroprotection. J Neurosci 27:8297-8308.
Coyle JT. (1997) The nagging question of the function of N-acetylaspartylglutamate.
Neurobiol Dis 4:231-238.
Coyle JT. (2006) Glutamate and schizophrenia: Beyond the dopamine hypothesis. Cell
Mol Neurobiol 26:365-384.
Fricker AC, Selina Mok MH, de la Flor R, Shah AJ, Woolley M, Dawson LA, Kew JN.
(2009) Effects of N-acetylaspartylglutamate (NAAG) at group II mGluRs and NMDAR.
Neuropharmacology .
Ghadge GD, Slusher BS, Bodner A, Canto MD, Wozniak K, Thomas AG, Rojas C,
Tsukamoto T, Majer P, Miller RJ, Monti AL, Roos RP. (2003) Glutamate
carboxypeptidase II inhibition protects motor neurons from death in familial amyotrophic
lateral sclerosis models. Proc Natl Acad Sci U S A 100:9554-9559.
Leff, P, Dougall, I.G., (1993) Further concerns over Cheng-Prusoff analysis. Trends in
Pharmacol. 14:110-112.
This article has not been copyedited and formatted. The final version may differ from this version.JPET Fast Forward. Published on April 23, 2009 as DOI: 10.1124/jpet.109.152553
at ASPE
T Journals on A
ugust 19, 2019jpet.aspetjournals.org
Dow
nloaded from

JPET #152553
- 23 -
Losi G, Vicini S, Neale J. (2004) NAAG fails to antagonize synaptic and extrasynaptic
NMDA receptors in cerebellar granule neurons. Neuropharmacology 46:490-496.
Neale JH, Bzdega T, Wroblewska B. (2000) N-acetylaspartylglutamate: The most
abundant peptide neurotransmitter in the mammalian central nervous system. J
Neurochem 75:443-452.
Neale JH, Olszewski RT, Gehl LM, Wroblewska B, Bzdega T. (2005) The
neurotransmitter N-acetylaspartylglutamate in models of pain, ALS, diabetic neuropathy,
CNS injury and schizophrenia. Trends Pharmacol Sci 26:477-484.
Neale SA and Salt TE. (2006) Modulation of GABAergic inhibition in the rat superior
colliculus by a presynaptic group II metabotropic glutamate receptor. J Physiol 577:659-
669.
Poschel B, Wroblewska B, Heinemann U, Manahan-Vaughan D. (2005) The
metabotropic glutamate receptor mGluR3 is critically required for hippocampal long-
term depression and modulates long-term potentiation in the dentate gyrus of freely
moving rats. Cereb Cortex 15:1414-1423.
Saugstad JA, Segerson TP, Westbrook GL. (1996) Metabotropic glutamate receptors
activate G-protein-coupled inwardly rectifying potassium channels in Xenopus oocytes. J
Neurosci. 16:5979–5985.
Schweitzer C, Kratzeisen C, Adam G, Lundstrom K, Malherbe P, Ohresser S, Stadler H,
Wichmann J, Woltering T, Mutel V. (2000) Characterization of [(3)H]-LY354740
This article has not been copyedited and formatted. The final version may differ from this version.JPET Fast Forward. Published on April 23, 2009 as DOI: 10.1124/jpet.109.152553
at ASPE
T Journals on A
ugust 19, 2019jpet.aspetjournals.org
Dow
nloaded from

JPET #152553
- 24 -
binding to rat mGlu2 and mGlu3 receptors expressed in CHO cells using semliki forest
virus vectors. Neuropharmacology 39:1700-1706.
Sharon D, Vorobiov D, Dascal N. (1997) Positive and Negative Coupling of the
Metabotropic Glutamate Receptors to a G Protein–activated K+ Channel, GIRK, in
Xenopus Oocytes. J. Gen. Physiol. 109: 477–490.
Slusher BS, Vornov JJ, Thomas AG, Hurn PD, Harukuni I, Bhardwaj A, Traystman RJ,
Robinson MB, Britton P, Lu XC, Tortella FC, Wozniak KM, Yudkoff M, Potter BM,
Jackson PF. (1999) Selective inhibition of NAALADase, which converts NAAG to
glutamate, reduces ischemic brain injury. Nat Med 5:1396-1402.
Wang M and Hampson DR. (2006) An evaluation of automated in silico ligand docking
of amino acid ligands to family C G-protein coupled receptors. Bioorg Med Chem
14:2032-2039.
Wang M, Yao Y, Kuang D and Hampson DR. (2006) Activation of Family C G-protein-
coupled Receptors by the Tripeptide Glutathione. J. Biol. Chem. 281 (13), 8864–8870.
Westbrook GL, Mayer ML, Namboodiri MA, Neale JH. (1986) High concentrations of
N-acetylaspartylglutamate (NAAG) selectively activate NMDA receptors on mouse
spinal cord neurons in cell culture. J Neurosci 6:3385-3392.
Wroblewska B, Wroblewski JT, Pshenichkin S, Surin A, Sullivan SE, Neale JH. (1997)
N-acetylaspartylglutamate selectively activates mGluR3 receptors in transfected cells. J
Neurochem 69:174-181.
This article has not been copyedited and formatted. The final version may differ from this version.JPET Fast Forward. Published on April 23, 2009 as DOI: 10.1124/jpet.109.152553
at ASPE
T Journals on A
ugust 19, 2019jpet.aspetjournals.org
Dow
nloaded from

JPET #152553
- 25 -
Wroblewska B, Wegorzewska IN, Bzdega T, Olszewski RT, Neale JH. (2006)
Differential negative coupling of type 3 metabotropic glutamate receptor to cyclic GMP
levels in neurons and astrocytes. J Neurochem 96:1071-1077.
Yamamoto T, Saito O, Aoe T, Bartolozzi A, Sarva J, Zhou J, Kozikowski A,
Wroblewska B, Bzdega T, Neale JH. (2007) Local administration of N-
acetylaspartylglutamate (NAAG) peptidase inhibitors is analgesic in peripheral pain in
rats. Eur J Neurosci 25:147-158.
This article has not been copyedited and formatted. The final version may differ from this version.JPET Fast Forward. Published on April 23, 2009 as DOI: 10.1124/jpet.109.152553
at ASPE
T Journals on A
ugust 19, 2019jpet.aspetjournals.org
Dow
nloaded from
JPET #152553
- 26 -
FOOTNOTES
This work was supported in part by a grant (to DRH) from the Canadian Institutes for
Health Research [grant number MOP-81179].
This article has not been copyedited and formatted. The final version may differ from this version.JPET Fast Forward. Published on April 23, 2009 as DOI: 10.1124/jpet.109.152553
at ASPE
T Journals on A
ugust 19, 2019jpet.aspetjournals.org
Dow
nloaded from

JPET #152553
- 27 -
LEGENDS FOR FIGURES
Figure 1: Amino acid analysis of the commercial (unpurified sample from Sigma) and
purified NAAG samples. HPLC chromatograms showing unpurified (upper
panel) and purified (lower panel at twice the gain) NAAG. The glutamate peak
(arrow) is substantially reduced in the purified preparation. The peaks labeled
“RgntPK1 and RgntPK2” are a breakdown product of the derivatizing reagent.
The peak labeled with an asterisk is an unidentified substance, possibly
corresponding to another breakdown product of the derivatizing reagent.
Figure 2: ESP(+) (top) and ESP(-) (bottom) mass spectra from the gradient LC-MS
analysis of the purified Sigma NAAG sample. The compound eluted with a
retention time of 0.72 min. The protonated monomer and the dimer molecular
ions (m/z 305 and 609 respectively) and the equivalent deprotonated molecular
anions (m/z 303 and 607) confirmed the molecular mass of NAAG as 304 Da.
Figure 3: Concentration-response curve for the effect of unpurified NAAG on rat
mGluR3 co-expressed with Gα15 in HEK 293 cells. Various concentrations of
commercial NAAG (from Sigma) were added in assay buffer to mGluR3
expressing cells loaded with Fluo-4, and responses were measured in a
FLEXstation. Each point represents the mean + SEM of 5 determinations.
Commercial unpurified NAAG (from Sigma) elicited strong responses with an
EC50 of 120 μM. Purified NAAG at 5 mM elicited no responses in this assay
on rat mGluR3 (open circle, n = 3) or rat mGluR2 (open triangle, n = 2).
This article has not been copyedited and formatted. The final version may differ from this version.JPET Fast Forward. Published on April 23, 2009 as DOI: 10.1124/jpet.109.152553
at ASPE
T Journals on A
ugust 19, 2019jpet.aspetjournals.org
Dow
nloaded from

JPET #152553
- 28 -
Figure 4: Current traces from a representative Xenopus oocyte expressing human (a and
b) or rat (c) mGluR3 and Kir3.1/3.4 in response to high potassium buffer,
followed by addition of various concentrations of purified (from a Sigma batch
shown in panels a and c) or unpurified NAAG (from Sigma shown in panel b)
or glutamate, as indicated, 120 seconds after the start of high potassium pulse.
NAAG is indicated as P or U in parentheses for the purified and unpurified
samples respectively. The actual time is somewhat longer than 120 seconds
due to delay of pipet tip exchange by the robotics. Cells were perfused for 5
minutes with normal ND96 between the pulses. Currents were normalized to
the current at the end of high potassium buffer solution, just before agonist
application, to compensate for the variability of individual GIRK current
responses.
Figure 5: Concentration-response curve for the effect of glutamate on human and rat
mGluR3 co-expressed with Kir3.1/3.4 in Xenopus oocytes. The glutamate-
stimulated currents were expressed as a fraction of maximum fold potentiation
from basal GIRK current responses induced by high K+ alone. Glutamate
potently stimulated both human and rat mGluR3 with EC50 values of 58 and 28
nM respectively. Data for human mGluR3 is from 7 oocytes, while that for rat
mGluR3 is from 6 oocytes.
Figure 6: Concentration-response curves for the inhibition of human mGluR3 (Figure
6a) or human mGluR2 (Figure 6b) mediated GIRK-current by the mGluR
antagonist, LY341495. (a). Inhibition of commercial NAAG (Sigma, 250 μM)
or glutamate (1 μM) mediated activation of mGluR3 GIRK currents in Xenopus
This article has not been copyedited and formatted. The final version may differ from this version.JPET Fast Forward. Published on April 23, 2009 as DOI: 10.1124/jpet.109.152553
at ASPE
T Journals on A
ugust 19, 2019jpet.aspetjournals.org
Dow
nloaded from

JPET #152553
- 29 -
oocytes by the mGluR antagonist, LY341495. Relative Responses was
calculated as a decrease in the agonist-induced GIRK current with application
of the inhibitor relative to the stimulation seen with the agonist alone. The IC50
values for inhibition for both NAAG and glutamate mediated activation were
57 and 71 nM respectively. The numbers of oocytes tested were 2, 6, 10, 11,
11, 4 for concentrations 1, 10, 100, 300 nM, 1 μM and 10 μM respectively.
Error bars are standard error of means. (b), Inhibition of human mGluR2
current activated by commercial NAAG (Sigma, 1 mM) by LY341495 with a
IC50 of 58 nM. The numbers of oocytes tested were 5, 10, 10, 4, 6, 3 for
concentrations 1, 10, 100, 300 nM, 1 μM and 10 μM respectively. error bars are
standard error of means. Upper right corner shows a current trace from a
representative oocyte expressing human mGluR2 and Kir3.1/3.4. The upper
bar above the trace (1) show the application of high potassium buffer, middle
bar (2) shows 1 mM Sigma NAAG, and lower bar (3) shows 1 μM LY341495.
The vertical and horizontal scales are 1 μA and 50 seconds respectively.
This article has not been copyedited and formatted. The final version may differ from this version.JPET Fast Forward. Published on April 23, 2009 as DOI: 10.1124/jpet.109.152553
at ASPE
T Journals on A
ugust 19, 2019jpet.aspetjournals.org
Dow
nloaded from

JPET #152553
- 30 -
TABLES
Table 1:
Table 1: Effect of unpurified and purified NAAG (from Sigma) on human mGluR3. The
relative effect represent average of fraction of fold potentiation of GIRK currents relative
to that obtained with full agonist response with 1 mM glutamate in the each cell tested.
Even this small level of activation may represent residual glutamate in the purified prep,
with an estimated concentration from 0.1-100 nM.
Purified NAAG Unpurified NAAG
Conc Relative Effect (avg) SD n Relative
Effect (avg) SD n
1 μM 0.023 0.065 8
10 μM 0.048 0.051 11 0.455 0.239 4
100 μM 0.077 0.085 11 0.917 0.409 4
300 μM 0.081 0.060 7
1 mM 0.039 0.074 11
This article has not been copyedited and formatted. The final version may differ from this version.JPET Fast Forward. Published on April 23, 2009 as DOI: 10.1124/jpet.109.152553
at ASPE
T Journals on A
ugust 19, 2019jpet.aspetjournals.org
Dow
nloaded from
Unpurified NAAG
Purified NAAG
Figure 1
This article has not been copyedited and form
atted. The final version m
ay differ from this version.
JPET
Fast Forward. Published on A
pril 23, 2009 as DO
I: 10.1124/jpet.109.152553 at ASPET Journals on August 19, 2019 jpet.aspetjournals.org Downloaded from

Figure 2R
elat
ive
Ab
un
dan
ce
Mass to charge ration (m/z)
This article has not been copyedited and form
atted. The final version m
ay differ from this version.
JPET
Fast Forward. Published on A
pril 23, 2009 as DO
I: 10.1124/jpet.109.152553 at ASPET Journals on August 19, 2019 jpet.aspetjournals.org Downloaded from

Figure 3
-6 -5 -4 -3 -2
0
25
50
75
100
Log [NAAG] (M)
% A
ctiv
atio
n
This article has not been copyedited and form
atted. The final version m
ay differ from this version.
JPET
Fast Forward. Published on A
pril 23, 2009 as DO
I: 10.1124/jpet.109.152553 at ASPET Journals on August 19, 2019 jpet.aspetjournals.org Downloaded from

a. Human mGluR3. High K
Agonist
b.
Human mGluR3 .
c.
Rat mGluR3
10 μMNAAG(U)
100 μM NAAG(U)
1 mM Glutamate
100 s
1 mMNAAG (P)
100 μM NAAG(P)
1 mM Glutamate
100 μM NAAG P)
1 mMGlutamate
10 μM NAAG (P)
Figure 4
This article has not been copyedited and formatted. The final version may differ from this version.JPET Fast Forward. Published on April 23, 2009 as DOI: 10.1124/jpet.109.152553
at ASPE
T Journals on A
ugust 19, 2019jpet.aspetjournals.org
Dow
nloaded from
-9 -8 -7 -6 -5 -4
0.00
0.25
0.50
0.75
1.00 Human mGluR3
Rat mGluR3
Glutamate [M]
Rel
ativ
e F
old
Po
ten
tiatio
n
Figure 5
This article has not been copyedited and form
atted. The final version m
ay differ from this version.
JPET
Fast Forward. Published on A
pril 23, 2009 as DO
I: 10.1124/jpet.109.152553 at ASPET Journals on August 19, 2019 jpet.aspetjournals.org Downloaded from

a.
b.Human mGluR2
-9 -8 -7 -6
0.00
0.25
0.50
0.75
1.00
NAAG
Log LY341495 [M]
Rel
ativ
e re
spo
nse
Human mGluR3
-9 -8 -7 -6 -5
0.00
0.25
0.50
0.75
1.00
NAAG
Glutamate
Log LY341495 [M]
Rel
ativ
e re
spo
nse
123
Figure 6
This article has not been copyedited and formatted. The final version may differ from this version.JPET Fast Forward. Published on April 23, 2009 as DOI: 10.1124/jpet.109.152553
at ASPE
T Journals on A
ugust 19, 2019jpet.aspetjournals.org
Dow
nloaded from