The network analysis of urban streets of Tirana - …ceur-ws.org/Vol-1746/paper-14.pdf · The...
10
The network analysis of urban streets of Tirana Enxhia Sala MSC. in Mathematics and Computer Engineering University of Tirana, Faculty of Natural Sciences, Department of Applied Mathematics [email protected] Abstract In this article we use Multiple Centrality Assessment (MCA) based on the idea of Sergio Porta [Por06]. We apply MCA for the urban streets of Tirana. MCA is based on primal, rather than dual, street graphs, it works within a metric, rather than topological, framework and it investigates a plurality of peer centrality indices. We show that, in the MCA primal approach, some centrality indices nicely capture the ‘skeleton’ of the urban structure that impacts so much on economic and cultural development of the city, which is also the purpose of our study. Moreover, the distributions of centrality in self-organized cities are different from those in planned cities. In our analysis we are considering all roads for vehicles, pedestrian paths and even the closed roads, which appear as leaves in the primary graph (vertex degree k=1). The area considered in this study is 4.392052∙10 6 m 2 (1.7 miles 2 ). We have built two databases for the sake of the study. One database contains information about edges like the vertex pairs of each edge and their weight (length in meters). The total number of edges is K = 1964. The other database contains information about geographical location of vertices (Longitude, Latitude for each vertex). The total number of edges is N=1565. After all the analysis, we’ll see if Tirana is a self-organized city or a planned one. 1 Introduction The study of complex networks is a new area of scientific research (since 2000) inspired of real-world networks such as computer networks, technological networks, brain networks and social networks. But, spatial networks were actually the subject a long time ago of many studies in quantitative geography. Objects of studies in geography are locations, activities and flows of individuals and goods. Already in the 1970s the scientists working in quantitative geography focused on networks evolving in time and space. The network analysis of territorial cases has a long tradition, especially in transportation and economic geography. All these approaches, like ‘closeness’, ‘connectivity’, or ‘cost’ focus on the idea that some places (or streets) are more important than others because they are more central. [Por06] Two coordinates (Longitude, Latitude) 1 , used in the database of vertices, uniquely determine a point in the area and specifically a geographic position on Earth. The picture below explains it better. Figure 1: Longitude, Latitude To calculate the Euclidean distance between two points in Earth, we apply the Haversine formula. This formula is a special case of spherical trigonometry and it is used for the first time in 1801 by spanish 1 https://www.google.al/search?q=longitude+and+latitude&n ewwindow=1&espv=2&rlz=1C1TSNF_enGR420GR420&s ource=lnms&tbm=isch&sa=X&ved=0ahUKEwj7wJr96ILP AhVDvRoKHS8aANsQ_AUICCgB&biw=1366&bih=643 #imgrc=dUAQi979hwA9NM%3A
Transcript of The network analysis of urban streets of Tirana - …ceur-ws.org/Vol-1746/paper-14.pdf · The...

The network analysis of urban streets of Tirana
Enxhia Sala
MSC. in Mathematics and
Computer Engineering
University of Tirana, Faculty of
Natural Sciences, Department of
Applied Mathematics
Abstract
In this article we use Multiple Centrality Assessment (MCA) based on the idea of Sergio Porta [Por06]. We apply MCA for the urban streets of Tirana. MCA is based on primal, rather than dual, street graphs, it works within a metric, rather than topological, framework and it investigates a plurality of peer centrality indices. We show that, in the MCA primal approach, some centrality indices nicely capture the ‘skeleton’ of the urban structure that impacts so much on economic and cultural development of the city, which is also the purpose of our study. Moreover, the distributions of centrality in self-organized cities are different from those in planned cities. In our analysis we are considering all roads for vehicles, pedestrian paths and even the closed roads, which appear as leaves in the primary graph (vertex degree k=1). The area considered in this study is 4.392052∙10
6 m
2
(1.7 miles2). We have built two databases for
the sake of the study. One database contains information about edges like the vertex pairs of each edge and their weight (length in meters). The total number of edges is K = 1964. The other database contains information about geographical location of vertices (Longitude, Latitude for each vertex). The total number of edges is N=1565. After all the analysis, we’ll see if Tirana is a self-organized city or a planned one.
1 Introduction
The study of complex networks is a new area of
scientific research (since 2000) inspired of real-world
networks such as computer networks, technological
networks, brain networks and social networks. But,
spatial networks were actually the subject a long time
ago of many studies in quantitative geography. Objects
of studies in geography are locations, activities and
flows of individuals and goods. Already in the 1970s
the scientists working in quantitative geography
focused on networks evolving in time and space. The
network analysis of territorial cases has a long tradition,
especially in transportation and economic geography.
All these approaches, like ‘closeness’, ‘connectivity’,
or ‘cost’ focus on the idea that some places (or streets)
are more important than others because they are more
central. [Por06] Two coordinates (Longitude, Latitude)1, used in the
database of vertices, uniquely determine a point in the area and specifically a geographic position on Earth. The picture below explains it better.
Figure 1: Longitude, Latitude To calculate the Euclidean distance between two
points in Earth, we apply the Haversine formula. This formula is a special case of spherical trigonometry and it is used for the first time in 1801 by spanish
1 https://www.google.al/search?q=longitude+and+latitude&n
ewwindow=1&espv=2&rlz=1C1TSNF_enGR420GR420&s
ource=lnms&tbm=isch&sa=X&ved=0ahUKEwj7wJr96ILP
AhVDvRoKHS8aANsQ_AUICCgB&biw=1366&bih=643
#imgrc=dUAQi979hwA9NM%3A

mathematician and astronomer José de Mendoza y Ríos2. To implement this formula, we need longitude, latitude and the radius of Earth R = 6371∙10
6 m.
For data processing we have used the software program R: package igraph for construction of graphs, package Geosphere to perform calculations and package RColorBrewer for coloring graphs according to different algorithms.
2 The primal approach of urban streets of
Tirana
By using the primal approach, where networks of
streets and intersections can be represented by spatial
graphs in which zero-dimensional geographic entities
(such as intersections) are turned into zero-dimensional
graph entities (nodes) placed into a two-dimensional
Euclidean space, and one-dimensional geographic
entities (such as streets) are turned into one-
dimensional graph entities (edges or links). The primal
approach is also the world standard in geospatial
dataset construction. [Por06]
Moreover for us it is more important the metric
distance rather than topological one. So, according to
primal approach, the streets will be represented by the
edges and intersections will be represented by the
nodes. Of course, that the graph will be a weighted
graph. So, each edge will be attached the weight that in
this case will be the length (in meters). Each vertex of
graph will be identified by a number that will be unique
for each vertex. Also the graph will not be oriented,
since we’re not considering the directions of motion.
Four primal approaches (Figure 2, Figure 3) [Por06]
namely Ahmedabad, Venice, Richmond, CA, and
Walnut Creek, CA, are here given closer focus in order
to frame the comparison between those cities and
Tirana (Figure 4, Figure 5).
On one hand Ahmedabad and Venice are typical self-
organized patterns, in that they `spontaneously'
emerged from a historical process outside of any
central coordination (the graph network visualization is
disorganized). On the other hand Richmond and
Walnut Creek are planned patterns, developed
following one coordinating layout in a relatively short
2 https://en.wikipedia.org/wiki/Haversine_formula
period of time (the graph network visualization is
quadratic). [Por06]
Figure 2: Map of (a) Ahmedabad; (b) Venice; (c)
Richmond; (d) Walnut Creek [Por06]
Figure 3: Primal approach of (a) Ahmedabad; (b)
Venice; (c) Richmond; (d) Walnut Creek [Por06]

Figure 4: Map of Tirana3
Figure 5: Primal graph of Tirana
3
http://www.arcgis.com/home/webmap/viewer.html?webmap=
1cefeb8113724e489ef63f29629683c4
As we see the primal graph, we can judge that Tirana is
a city, which can be regarded as self-organized.
3 Defining centrality indices
Network’s cost W is the sum of all edges lengths
[Por06]:
Network’s cost for Tirana WTir = 112 468 m. The
calculations are made for 1 mile2.
The characteristic path length L (Watts and Strogatz,
1998) [Wat98] is defined as the average length of the
shortest paths (with the average being calculated over
all the couples of nodes in the network):
L is a good measure of the connectivity properties of
the network. For Tirana, we got the result
LTir=1456.764m.
Average path length <l>4 is a concept in network
topology that is defined as the average number of steps
along the shortest paths for all possible pairs of
network nodes. It is a measure of the efficiency of
information or mass transport on a network. Our result
was <l>Tir=19.92. It means that it takes 20 steps on
average to go along the shortest paths for all possible
pairs of intersections in Tirana.
High values of W and L low values of <l> are
properties of self-organized cities.
Diameter D5 is the shortest distance between the two
most distant nodes in the network. In other words, once
4 https://en.wikipedia.org/wiki/Average_path_length
5 https://en.wikipedia.org/wiki/Network_science
the shortest path length from every node to all other
nodes is calculated, the diameter is the longest of all the
calculated path lengths. Diameter of Tirana (Figure 6)
is D=3590m, while the Euclidian distance between
those nodes is dE=2867m. Thus , the diameter is 1.25
times greater than the Euclidian distance.
Figure 6: Diameter (blue) and Euclidian distance (red)
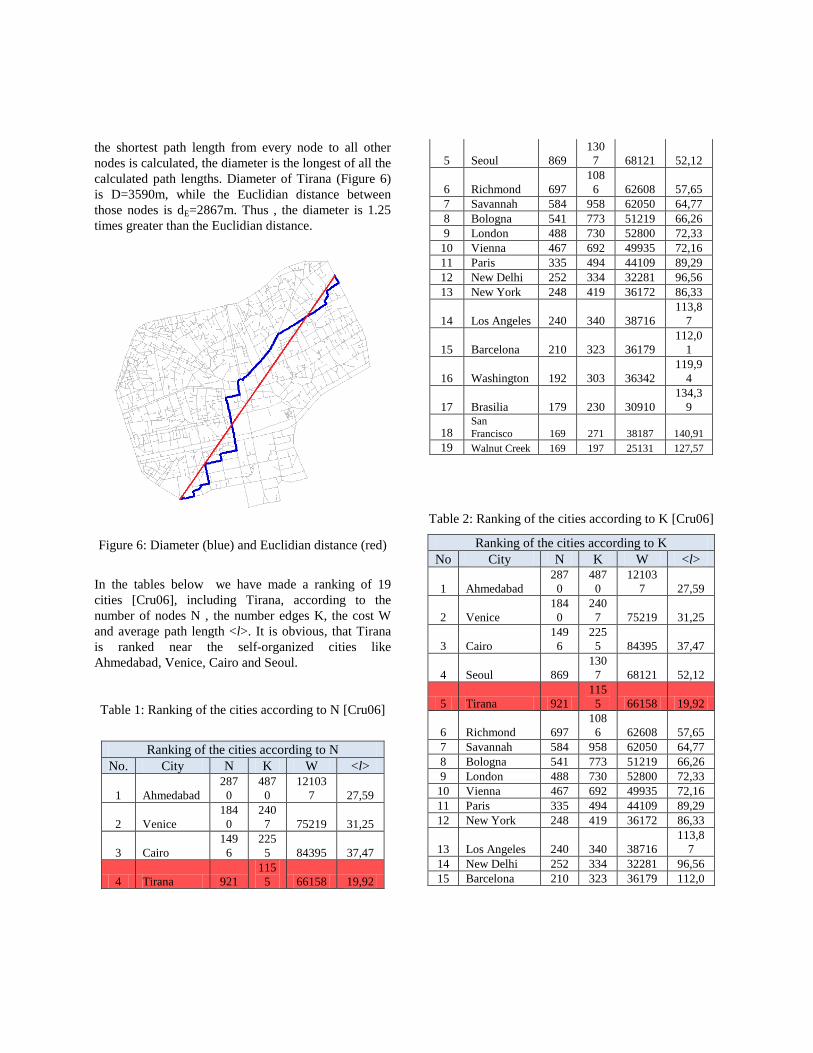
In the tables below we have made a ranking of 19
cities [Cru06], including Tirana, according to the
number of nodes N , the number edges K, the cost W
and average path length <l>. It is obvious, that Tirana
is ranked near the self-organized cities like
Ahmedabad, Venice, Cairo and Seoul.
Table 1: Ranking of the cities according to N [Cru06]
Ranking of the cities according to N
No. City N K W <l>
1 Ahmedabad
287
0
487
0
12103
7 27,59
2 Venice
184
0
240
7 75219 31,25
3 Cairo
149
6
225
5 84395 37,47
4 Tirana 921
115
5 66158 19,92
5 Seoul 869
130
7 68121 52,12
6 Richmond 697
108
6 62608 57,65
7 Savannah 584 958 62050 64,77
8 Bologna 541 773 51219 66,26
9 London 488 730 52800 72,33
10 Vienna 467 692 49935 72,16
11 Paris 335 494 44109 89,29
12 New Delhi 252 334 32281 96,56
13 New York 248 419 36172 86,33
14 Los Angeles 240 340 38716
113,8
7
15 Barcelona 210 323 36179
112,0
1
16 Washington 192 303 36342
119,9
4
17 Brasilia 179 230 30910
134,3
9
18 San
Francisco 169 271 38187 140,91
19 Walnut Creek 169 197 25131 127,57
Table 2: Ranking of the cities according to K [Cru06]
Ranking of the cities according to K
No City N K W <l>
1 Ahmedabad
287
0
487
0
12103
7 27,59
2 Venice
184
0
240
7 75219 31,25
3 Cairo
149
6
225
5 84395 37,47
4 Seoul 869
130
7 68121 52,12
5 Tirana 921
115
5 66158 19,92
6 Richmond 697
108
6 62608 57,65
7 Savannah 584 958 62050 64,77
8 Bologna 541 773 51219 66,26
9 London 488 730 52800 72,33
10 Vienna 467 692 49935 72,16
11 Paris 335 494 44109 89,29
12 New York 248 419 36172 86,33
13 Los Angeles 240 340 38716
113,8
7
14 New Delhi 252 334 32281 96,56
15 Barcelona 210 323 36179 112,0

1
16 Washington 192 303 36342
119,9
4
17
San
Francisco 169 271 38187
140,9
1
18 Brasilia 179 230 30910
134,3
9
19 Walnut Creek 169 197 25131
127,5
7
Table 3: Ranking of the cities according to W [Cru06]
Ranking of the cities according to W
No. Qyteti N K W <l>
1 Ahmedabad
287
0
487
0
12103
7 27,59
2 Cairo
149
6
225
5 84395 37,47
3 Venice
184
0
240
7 75219 31,25
4 Seoul 869
130
7 68121 52,12
5 Tirana 921
115
5 66158 19,92
6 Richmond 697
108
6 62608 57,65
7 Savannah 584 958 62050 64,77
8 London 488 730 52800 72,33
9 Bologna 541 773 51219 66,26
10 Vienna 467 692 49935 72,16
11 Paris 335 494 44109 89,29
12 Los Angeles 240 340 38716
113,8
7
13
San
Francisco 169 271 38187
140,9
1
14 Washington 192 303 36342
119,9
4
15 Barcelona 210 323 36179
112,0
1
16 New York 248 419 36172 86,33
17 New Delhi 252 334 32281 96,56
18 Brasilia 179 230 30910
134,3
9
19 Walnut Creek 169 197 25131
127,5
7
Table 4: Ranking of the cities according to <l> [Cru06]
Ranking of the cities according to <l>
No. City N K W <l>
1
San
Francisco 169 271 38187
140,9
1
2 Brasilia 179 230 30910
134,3
9
3 Walnut Creek 169 197 25131
127,5
7
4 Washington 192 303 36342
119,9
4
5 Los Angeles 240 340 38716
113,8
7
6 Barcelona 210 323 36179
112,0
1
7 New Delhi 252 334 32281 96,56
8 Paris 335 494 44109 89,29
9 New York 248 419 36172 86,33
10 London 488 730 52800 72,33
11 Vienna 467 692 49935 72,16
12 Bologna 541 773 51219 66,26
13 Savannah 584 958 62050 64,77
14 Richmond 697
108
6 62608 57,65
15 Seoul 869
130
7 68121 52,12
16 Cairo
149
6
225
5 84395 37,47
17 Venice
184
0
240
7 75219 31,25
18 Ahmedabad
287
0
487
0
12103
7 27,59
19 Tirana 921
115
5 66158 19,92
3.1 Being near others: Closeness Centrality
Closeness centrality, CC, [Por06] measures to which
extent a node i is near to all the other nodes along the
shortest paths, and is defined as [Por06]:

where dij is the shortest path length between i and j,
defined, in a valued graph, as the smallest sum of the
edges length l throughout all the possible paths in the
graph between i and j. [Por06]
Implemented on primal graphs, the spatial flow of CC
is dominated by the so-called `border effect', in the
sense that higher CC scores consistently group around
the geo-metric center of the image. To some extent less
evident in less dense cases such as Walnut Creek, the
border effect is overwhelming in denser urban fabrics
such as those of Ahmedabad and Venice (Figure 7 a,b)
[Por06]. Also the primal graph of Tirana is dominated
by this effect (Figure 8).
Figure 7: CC (a) Ahmedabad; (b) Venice; (c)
Richmond; (d) Walnut Creek [Por06]
Figure 8: C
C, Tirana6
The problem: as we have just shown, the CC integration
index simply does not work on such primal graphs
because CC is vulnerable to the border effect. But C
C is
not the only option. Centrality is a multifold concept
and we have many indices at hand. Thus, to overcome
this problem we can limit the analysis of CC to a local
scale, at which it maintains a good potential. [Por06]
A review of Ahmedabad [Por06] and of my results
for Tirana are offered in the figures below.
Figure 9: CC Ahmebadad: (a) general C
C (b) Local C
C,
d<400m; (c) Local CC, d<200m [Por06]
6 We notice that the graph coloring is done scalable from
dark red to dark blue. With dark red are colored vertices
with higher values of CC, while with dark blue are colored
vertices with lower values CC.

Figure 10: CC Tirana: (a) general C
C (b) Local C
C,
d<600m; (c) Local CC, d<200m
Now, the concept of ‘being near others’ is more
meaningful, because in this way are defined locations
(intersections and roads) that are more important for
certain areas of the city. This type of analysis can help
entrepreneurs increase their economic activities in such
areas, which can be considered optimal (for example
supermarket chains).
3.2 Being between others: Betweenness Centrality
Betweenness centrality, CB, [Por06] is based on the
idea that a node is central if it lies between many other
nodes, in the sense that it is traversed by many of the
shortest paths connecting couples of nodes. The
betweenness centrality of node i is [Por06]:
where njk is the number of shortest paths between j and
k, and njk(i) is the number of shortest paths between j
and k that contain node i.
Figure 11 shows visual presentation of CB for
Ahmedabad, Venice, Richmond and Walnut Creek
[Por06]. While figure 12 shows visual presentation of
CB, that I have made, for Tirana.
Figure 11: CB (a) Ahmebadad; (b) Venice; (c)
Richmond; (d) Walnut Creek [Por06]
From the visual presentation of CB for Tirana, we
notice that the most important streets, that influence
most the rest of the street network, are "Fortuzi" street,
Durrësi street, Dibra street, Kavaja street and "Myslym
Shyri " street.
Figure 12: CB, Tirana

3.3 Being direct to the others: Straightness
Centrality
Straightness centrality, CS, [Por06] originates from
the idea that the efficiency in the communication
between two nodes i and j is equal to the inverse of the
shortest path length dij. The straightness centrality of
node i is defined as [Por06]:
where dEucl ij is the Euclidean distance between nodes i
and j along a straight line, and we have adopted a
normalization recently proposed for geographic
networks. This measure captures to which extent the
connecting route between nodes i and j deviates from
the virtual straight route.
Figure 13 shows visual presentation of CS for
Ahmedabad, Venice, Richmond and Walnut Creek
[Por06]. While figure 14 shows visual presentation of
CS, that I have made, for Tirana.
Figure 13: CS (a) Ahmebadad; (b) Venice; (c)
Richmond; (d) Walnut Creek [Por06]
Figure 14: CS, Tirana
From this visual representation of CS for Tirana, we
notice that the straight streets, that directly link two
intersections are mainly boulevards like "Dëshmorët e
Kombit" boulevard, "Zhan D'Ark" boulevard and
"Bajram Curri" boulevard. While some other streets are
"Muhamet Gjollesha" street, "Asim Vokshi" street, etc.
It was the first urban planning made in 1923, by the
Austrians, which attempted to build straight streets for
the capital city of Albania7.
3.4 Being critical for all the others: Information
Centrality
Information centrality, CI , [Por06] relates the node
centrality to the ability of the network to respond to the
deactivation of the node. The information centrality of
node i is defined as the relative drop in the network
efficiency E[G] caused by the removal from G of the
edges incident in i [Por06]:
7 Planet Urbanistike të Tiranës në vite, Arkivi Qendror
Teknik i Ndërtimit (AQTN)

where the efficiency of a graph G is defined as [Por06]:
and where G′ is the graph with N nodes and K – ki
edges obtained by removing from the original graph G
the ki edges incident in node i. An advantange of using
the efficiency to measure the performance of a graph is
that E[G] is finite even for disconnected graphs.
The spatial distribution of node centralities can be
visualized as the one of Tirana reported in Figure 16.
While figure 15 shows visual presentation of CS for
Ahmedabad, Venice, Richmond and Walnut Creek
[Por06].
Figure 15: CI (a) Ahmebadad; (b) Venice; (c)
Richmond; (d) Walnut Creek [Por06]
Figure 16: CI, Tirana
From this visual representation of CI for Tirana, we
notice that some of the most critical streets, that are
very important for the connectivity of the street
network in Tirana, playing in this way the role of
‘bridges’, are “Fortuzi” street, Durrësi street, Bogdanët
street, “Myslym Shyri” street, Dibra street, “Qemal
Stafa” street, Saraçët street, etc.
4 Results and Future Work
In this article we used MCA method and we
concluded that Tirana is a self-organized city. We also
defined some of the most important streets of Tirana
that capture the ‘skeleton’ of the urban structure that
impacts so much on economic and cultural
development of the city. In the future, it will be of great
interest to use MCA method even for other cities of
Albania. For example we may use MCA for the city of
Korça, that can be prejudged as a planned city. In this
way we can make comparisons between different cities
of Albania.
5 Acknowledgments
I am very thankful to DR. Eva NOKA (JANI) for
leading me in this research and to the engineers of
Department of Transportation and Mobility in the

Municipality of Tirana, especially to the head of Traffic
Control Sector Mr. Kreshnik Bajraktari for supporting
me with updated information on network of urban
streets of Tirana.
References
[Por06] S. Porta, P. Crucitti, V. Latora, Environment
and Planning B: Planning and Design, volume 33,
pages 705-725, 2006
[Cru06] P. Crucitti, V. Latora, S. Porta, Centrality in
networks of urban streets, 2006
[Wat98] D.J. Watts and S.H. Strogatz, Nature 393, 440
(1998).