
Ruminant Protein Nutrition More appropriate: Rumen Nitrogen Metabolism.

The net contribution of ruminant production
to the protein supply for humans
June, 18, 2018
S. Laisse 1, R. Baumont 2, P. Veysset 2, M. Benoit 2,
P. Madrange 3, B. Rouillé 1, J.-L. Peyraud 4
1 IDELE, Service Lait, Monvoisin, 35650 Le Rheu, France 2 INRA, UMR Herbivores, 63122 Saint-Genès-Champanelle, France 3 IDELE, Service Viandes, 63170 Aubière, France 4 INRA, UMR PEGASE, 35590 Saint-Gilles, France
.02 June, 18, 2018
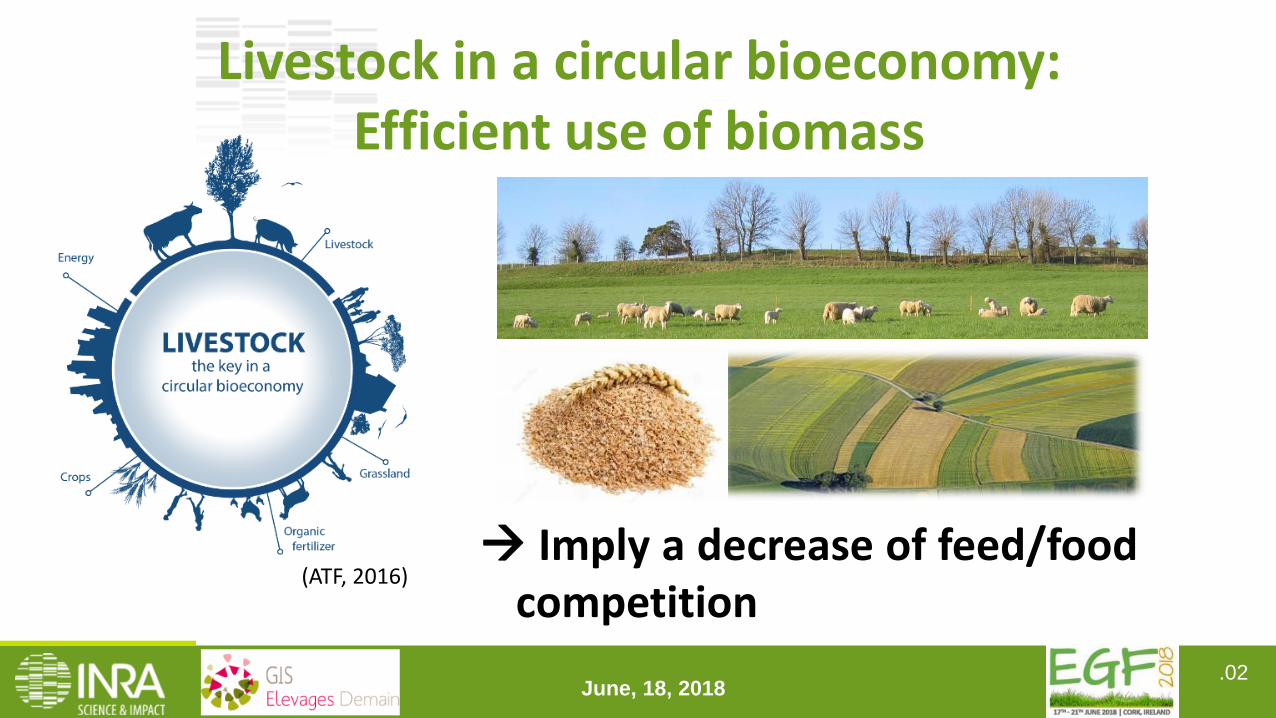
Livestock in a circular bioeconomy: Efficient use of biomass
Imply a decrease of feed/food competition
(ATF, 2016)

.03 June, 18, 2018
How to evaluate the contribution of Livestock to human food production?
Animal products
(milk, meat)
Plant feedstuffs
Livestock system
Only human edible vegetable feed material is in competition with human food
3 Non edible
proteins
Human edible
protein in milk,
meat, offals Non-edible
protein
Human edible
protein in
feedstuffs
Livestock system
Net contribution to human
protein food supply
Feed conversion efficiency of LFS
.04 June, 18, 2018
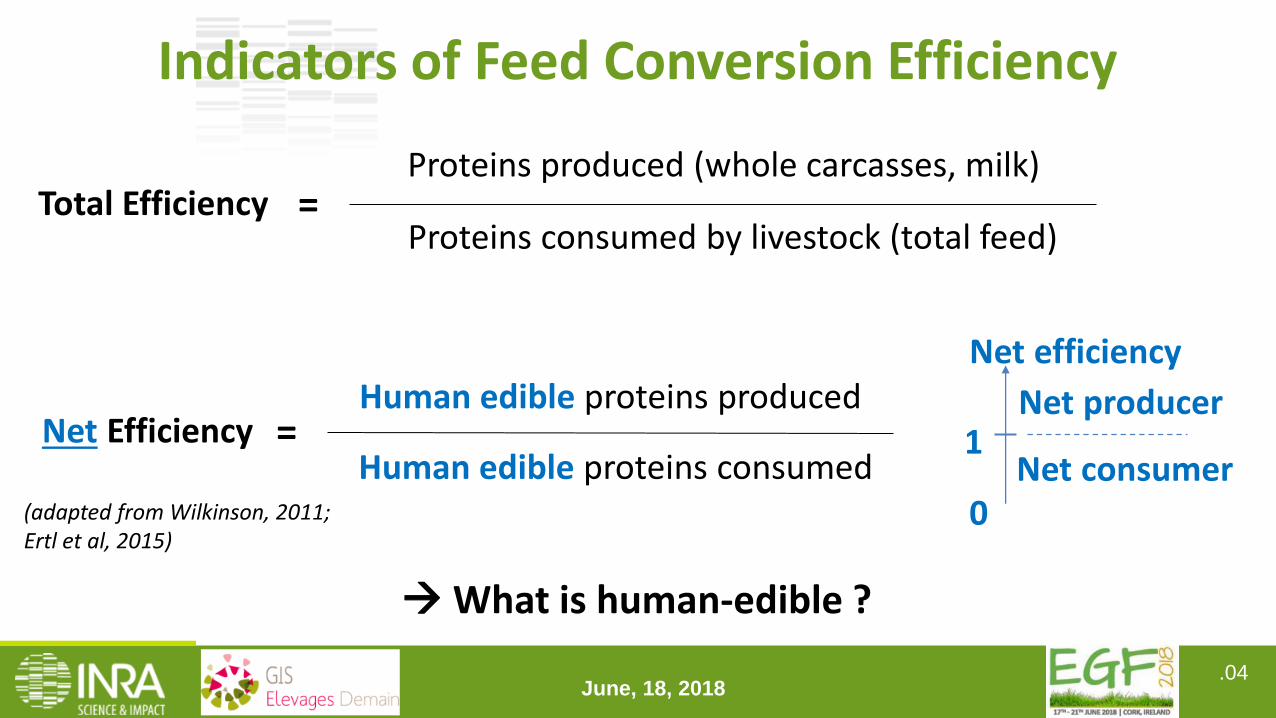
Indicators of Feed Conversion Efficiency
Proteins produced (whole carcasses, milk)
Proteins consumed by livestock (total feed) Total Efficiency =
Human edible proteins produced
Human edible proteins consumed =
Net efficiency
Net producer 1
0 Net consumer
Net Efficiency
What is human-edible ?
(adapted from Wilkinson, 2011; Ertl et al, 2015)

.05 June, 18, 2018
- Milk
Human edible fraction of animal products
98% of volume edible
Animal % of live weight
% of proteins in live animal
Dairy Cow 45 % 55 %
Beef Cow 49 % 60 %
Bull-calf 51 % 63 %
Lamb 41 % 43 %
- “Meat”

.06 June, 18, 2018
Grass : non edible
Cereals grain : partly edible
By-products : often non-edible
Soybean meal : protein extraction is possible
Human edible fraction of feedstuffs

.07 June, 18, 2018
Table of Human edible protein fraction of feedstuffs
Feedstuffs Current Scenario
Grass 0%
Maize silage 10% [grain part]
Wheat grain 66%
Maize grain 15%
Peas 74%
Soybean meal 60%
Rapeseed meal & sunflower meal
0%
DDGS, sugar beet pulp 0%
Potential Scenario
Hypothesis for Potential scenario (best use of plant protein)
0% /
20% According to maize grain
74% More complete flours, bran use
30% Less starch extraction for flour
92% Less protein extraction for more grain consumption
92% Better protein extraction process
55% Protein extraction
0% /

.08 June, 18, 2018
Ruminant Farming Systems studied Productions : Dairy cattle, Beef cattle, Sheep Examples of existing French farming systems, chosen according to contrasted
feeding systems (“Inosys” – Réseaux d’élevage)
Calculations made at farm level including all products (e.g. milk and meat for dairy farms) and all animals (heifers).
.09 June, 18, 2018
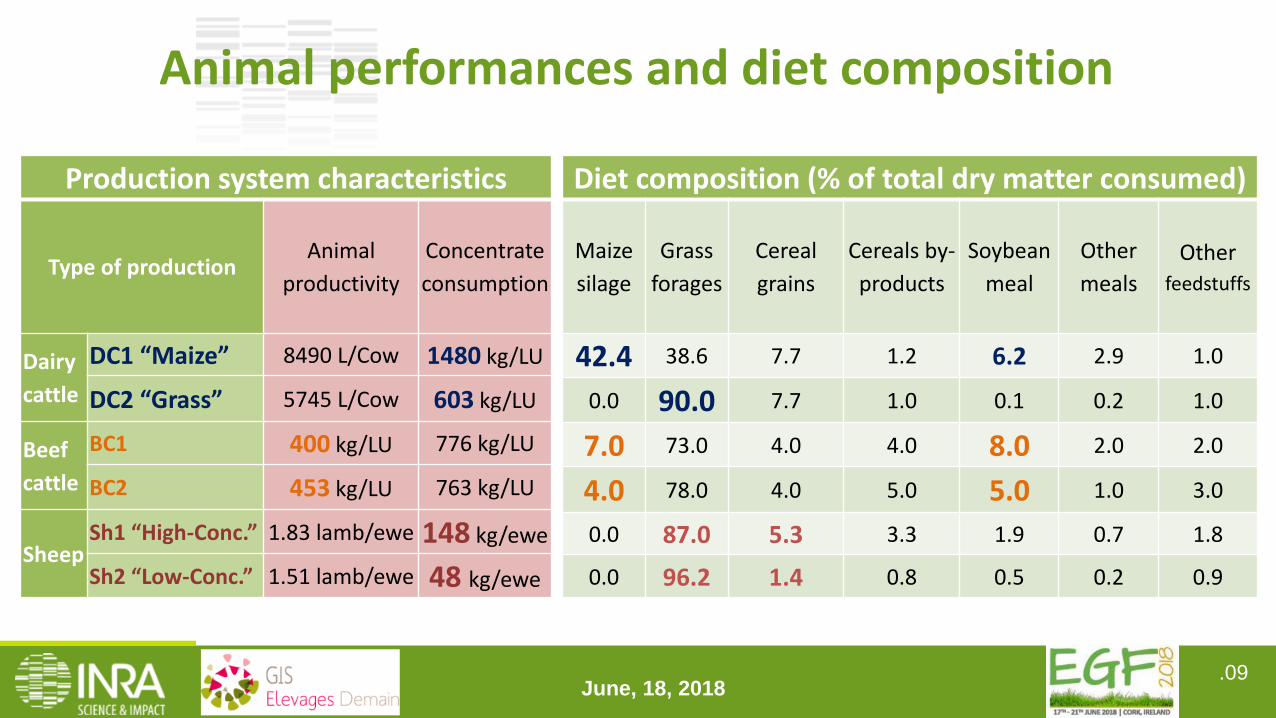
Production system characteristics
Type of production Animal
productivity
Concentrate
consumption
Dairy
cattle
DC1 “Maize” 8490 L/Cow 1480 kg/LU
DC2 “Grass” 5745 L/Cow 603 kg/LU
Beef
cattle
BC1 400 kg/LU 776 kg/LU
BC2 453 kg/LU 763 kg/LU
Sheep Sh1 “High-Conc.” 1.83 lamb/ewe 148 kg/ewe
Sh2 “Low-Conc.” 1.51 lamb/ewe 48 kg/ewe
Animal performances and diet composition
Diet composition (% of total dry matter consumed)
Maize
silage
Grass
forages
Cereal
grains
Cereals by-
products
Soybean
meal
Other
meals
Other
feedstuffs
42.4 38.6 7.7 1.2 6.2 2.9 1.0
0.0 90.0 7.7 1.0 0.1 0.2 1.0
7.0 73.0 4.0 4.0 8.0 2.0 2.0
4.0 78.0 4.0 5.0 5.0 1.0 3.0
0.0 87.0 5.3 3.3 1.9 0.7 1.8
0.0 96.2 1.4 0.8 0.5 0.2 0.9

.010 June, 18, 2018
Total protein conversion efficiency of ruminant systems
Contrasted results ! ≈ 4 kg of feedstuff protein for 1 kg of animal protein (milk, whole carcasses)
≈ 10-15 kg of feedstuff protein for 1 kg of animal protein (whole carcasses)
DC1 DC2 BC1 BC2 Sh1 Sh2 0.0
0.5
1.0
1.5
2.0
2.5
3.0
Pro
tein
Eff
icie
ncy (
kg/k
g) Total Protein Efficiency
.011 June, 18, 2018
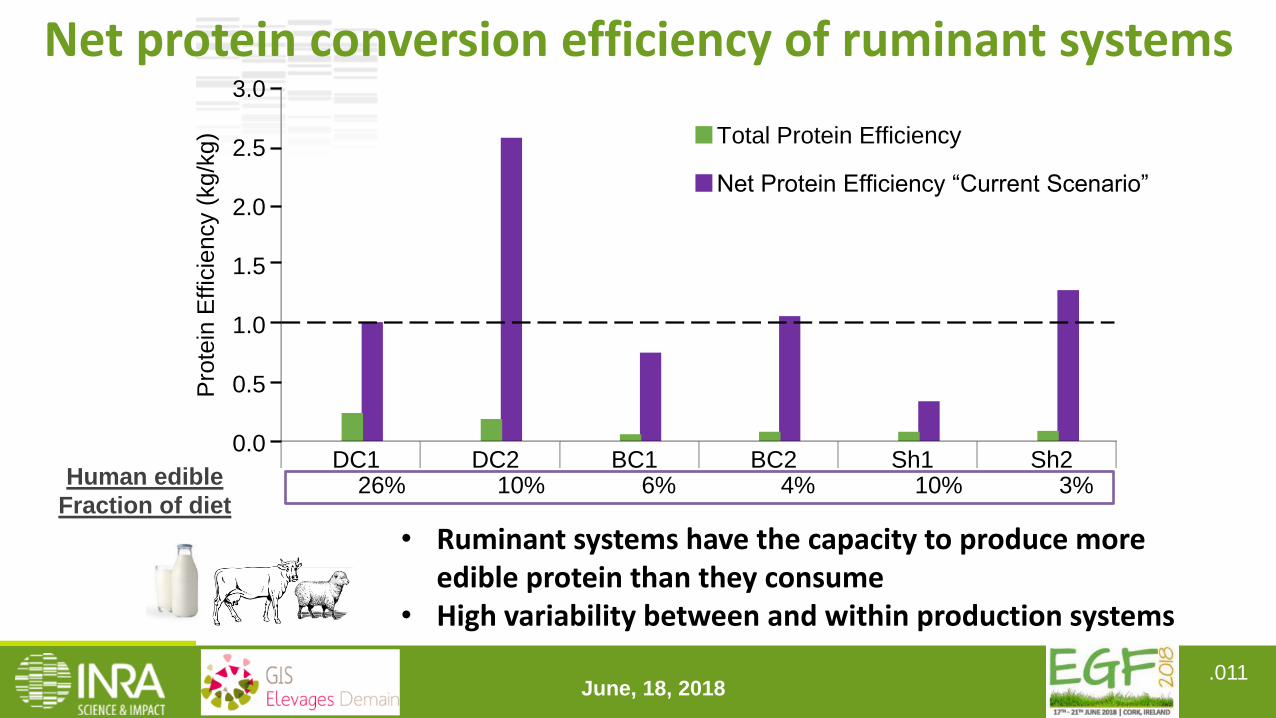
Net protein conversion efficiency of ruminant systems
• Ruminant systems have the capacity to produce more edible protein than they consume
• High variability between and within production systems
Human edible
Fraction of diet
Net Protein Efficiency “Current Scenario”
26% 10% 6% 4% 10% 3% DC1 DC2 BC1 BC2 Sh1 Sh2
0.0
0.5
1.0
1.5
2.0
2.5
3.0
Pro
tein
Eff
icie
ncy (
kg/k
g) Total Protein Efficiency

.012 June, 18, 2018
High impact of the scenario of plant protein utilisation in food industry
Net protein conversion efficiency of ruminant systems
Human edible
Fraction of diet
DC1 DC2 BC1 BC2 Sh1 Sh2 26% 10% 6% 4% 10% 3%
43% 11% 11% 8% 14% 4%
0.0
0.5
1.0
1.5
2.0
2.5
3.0
Pro
tein
Eff
icie
ncy (
kg/k
g) Total Protein Efficiency
Net Protein Efficiency “Current Scenario”
Net Protein Efficiency “Potential Scenario”
.013 June, 18, 2018
Conclusion Net protein conversion efficiency brings a new insight on feed/food
competition
Ruminants can positively contribute to human protein supply by efficient use of grasslands and non edible by-products
Margins of progress exist for all types of production systems
Future utilization of feedstuffs in the food industry needs to be taken into account
Feed conversion efficiency has to be evaluated in conjunction with:
o Land use
o Other indicators of economical, environmental and social performances

Thank you for your attention
September 2-6, 2018 Clermont-Ferrand, France

.015 June, 18, 2018
Literature synthesis (edible fraction, protein content) - Milk
- “Meat” – example of beef cow
Human edible fraction of animal products
98% of volume edible
Slaughter Cut
Live weight (100%) Carcass weight
(57%)
Meat (38%)
Edible offal (6%) Leather, non-edible
offal, fat (20%)
Water losses (1%)
Non-edible by-products (14%)
Losses (15%) (dead animals,
digestive content, etc.)
Edible by-products (bone for gelatin,
fat for tallow) (6%)
Edible fraction In beef cattle:
50% of live weight 61% of proteins
.016 June, 18, 2018
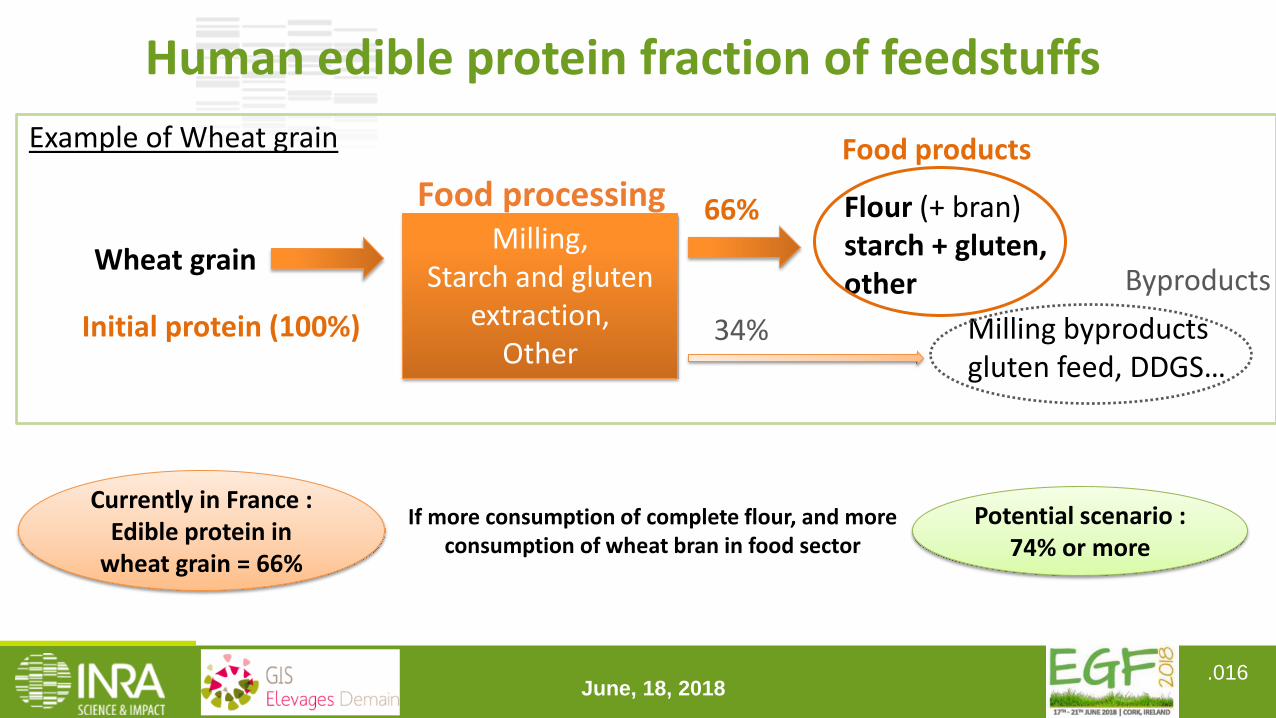
Flour (+ bran) starch + gluten, other
Milling, Starch and gluten
extraction, Other
Milling byproducts gluten feed, DDGS…
Food processing
Wheat grain
Initial protein (100%)
Food products
34%
66%
Byproducts
Currently in France : Edible protein in
wheat grain = 66%
Potential scenario : 74% or more
If more consumption of complete flour, and more consumption of wheat bran in food sector
Human edible protein fraction of feedstuffs
Example of Wheat grain


![COURSE AL60D: ADVANCED RUMINANT PRODUCTIONostasp.brinkster.net/downloads/al60d2012.pdfAGLS6004 [AL60D] Advanced Ruminant Production Advanced Ruminant Production Gary Wayne Garcia 02/09/2012](https://static.fdocuments.net/doc/165x107/5e52eefa225a0e0647002013/course-al60d-advanced-ruminant-agls6004-al60d-advanced-ruminant-production-advanced.jpg)

