The Need For Improved GIS Capabilities and an Overview of … · 2011-03-18 · NEFSC Data on Fish...
31
The Need For Improved GIS Capabilities and an Overview of NEFSC Data on Fish Distribution, Hydrography and Seabed Habitat Dr. Thomas Noji, Division Chief (presenter) Steven Fromm, IT Specialist Suellen Fromm, IT Specialist John Manderson, Fisheries Research Biologist Northeast Fisheries Science Center, Howard Marine Lab, Sandy Hook, NJ. Abstract The Northeast Fisheries Science Center possesses extensive databases with data on seasonal fish distribution by life-history stage, seabed characteristics including surficial geology and benthic fauna, plankton and hydrography. In order to facilitate current research on habitat-dependent fish recruitment, as well as to address other habitat-related issues such as the protection of cold-water corals and the spread of invasive species, it is important to further develop (or replace) our current GIS to include hydrographic and seabed data, as well as information on relevant human activities such as current and planned trawl effort and petroleum activities. Workshop on GIS Tools Supporting Ecosystem Approaches to Management 1
Transcript of The Need For Improved GIS Capabilities and an Overview of … · 2011-03-18 · NEFSC Data on Fish...

The Need For Improved GIS Capabilities and an Overview of NEFSC Data on Fish Distribution, Hydrography and Seabed
Habitat
Dr. Thomas Noji, Division Chief (presenter) Steven Fromm, IT Specialist Suellen Fromm, IT Specialist
John Manderson, Fisheries Research Biologist
Northeast Fisheries Science Center, Howard Marine Lab, Sandy Hook, NJ.
Abstract The Northeast Fisheries Science Center possesses extensive databases with data on seasonal fish distribution by life-history stage, seabed characteristics including surficial geology and benthic fauna, plankton and hydrography. In order to facilitate current research on habitat-dependent fish recruitment, as well as to address other habitat-related issues such as the protection of cold-water corals and the spread of invasive species, it is important to further develop (or replace) our current GIS to include hydrographic and seabed data, as well as information on relevant human activities such as current and planned trawl effort and petroleum activities.
Workshop on GIS Tools Supporting Ecosystem Approaches to Management 1

The need for improved GIS capabilities and an overview of
NEFSC data on fish distribution, hydrography and seabed habitat
Note: This version has been modified for distribution. Several slides were removed from the original for proprietary reasons.
Dr. Thomas Noji, Steven Fromm, Suellen Fromm, John Manderson
Northeast Fisheries Science CenterJames J. Howard Marine Sciences LaboratorySandy Hook, NJ

• What do we need?• What are the tasks?• What do we want?• What can we do?

NEFSC mission
Conduct ecosystem-based research and assessments of living marine resources and their environments in the Northeast Shelf ecosystem to
(a) promote recovery and long-term sustainability of fish stocks and protected species;
(b) restore and preserve habitats necessary to secure ecosystem health; and
(c) enhance and ensure long-term social and economic benefits to society from their use.

Ecosystems Processes Division
Understand the effects of environmental variability and human disturbances on fish and shellfish productivity relative to habitat.
• Primary Objectives• 1. Identify and map marine habitat• 2. Identify ecological processes and fish life histories
relevant for understanding the importance of habitats for fish recruitment
• 3. Describe the impact of anthropogenic factors and environmental changes (broad temporal scale) on fish populations

Tasks
A. Promote recovery and long-term sustainability of fish stocks and protected species -Map fish distribution-Map fishing effort, e.g. VMS-Ecosystem considerations in stock assessments
B. Restore and preserve habitats necessary to secure ecosystem health -Provide information on Essential Fish Habitat to the Councils in the form of maps-Map habitat types -Map Habitat Areas of Particular Concern-Map threatening human activities-Map current and proposed management actions, e.g. closures
C. Enhance and ensure long-term social and economic benefits to society from their use
• -Map “services” by geographical location, e.g. petroleum, fisheries, pharmaceuticals, ecotourism, etc.
• -Map ecosystem services (structure, composition, function)

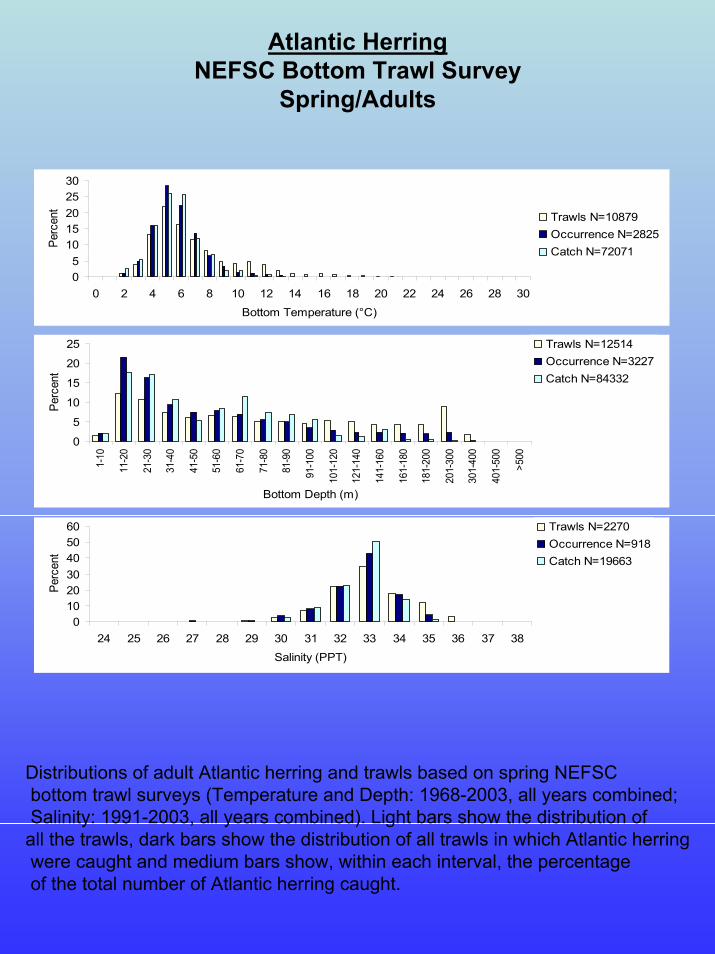
Atlantic HerringNEFSC Bottom Trawl Survey
Spring/Adults

An example of a 10-minute squares map used in designating summer flounder EFH.
Habitat or Fish Distribution?

Stock Assessment Process
• Wait for Paul Rago!

Tasks
A. Promote recovery and long-term sustainability of fish stocks and protected species -Map fish distribution-Map fishing effort, e.g. VMS-Ecosystem considerations in stock assessments
B. Restore and preserve habitats necessary to secure ecosystem health -Provide information on Essential Fish Habitat to the Councils in the form of maps-Map habitat types (implies ability to classify)-Map Habitat Areas of Particular Concern-Map human and natural activities affecting habitats-Map current and proposed management actions, e.g. closures
C. Enhance and ensure long-term social and economic benefits to society from their use
• -Map “services” by geographical location, e.g. petroleum, fisheries, pharmaceuticals, ecotourism, etc.
• -Map ecosystem services (structure, composition, function)

Length
Table
Species Code/Maturity
Control Table
ESSENTIAL FISH HABITAT GIS DATABASE
Cruise/Station
Table
Views created for Chart DataStation/Length
View
Merged Station/Length Summary
All 38 SpeciesSQL procedure to
create ORACLE views for EXCEL
Chart views
Occurrence by
Bottom Temperature
Salinity
Depth
Season
SQL procedure to create ORACLE
views for GIS
Species Views
Adult/Juv.
Survey Type
Winter, Spring, Summer, Fall
VBA procedure
to create tables
for charts
GIS Maps EXCEL Charts
Source data is provided by the NEFSC Woods Hole lab via ORACLE snapshots. Local subset tables are created based on certain qualifying criteria, i.e. survey type, year, gear and species.
Atlantic HerringNEFSC Bottom Trawl Survey
Spring/Adults
05
1015202530
0 2 4 6 8 10 12 14 16 18 20 22 24 26 28 30
Bottom Temperature (°C)
Perc
ent
Trawls N=10879Occurrence N=2825Catch N=72071
0
5
10
15
20
25
1-10
11-2
0
21-3
0
31-4
0
41-5
0
51-6
0
61-7
0
71-8
0
81-9
0
91-1
00
101-
120
121-
140
141-
160
161-
180
181-
200
201-
300
301-
400
401-
500
>500
Bottom Depth (m)
Perc
ent
Trawls N=12514Occurrence N=3227Catch N=84332
0102030405060
24 25 26 27 28 29 30 31 32 33 34 35 36 37 38
Salinity (PPT)
Perc
ent
Trawls N=2270Occurrence N=918Catch N=19663
Distributions of adult Atlantic herring and trawls based on spring NEFSCbottom trawl surveys (Temperature and Depth: 1968-2003, all years combined;Salinity: 1991-2003, all years combined). Light bars show the distribution of
all the trawls, dark bars show the distribution of all trawls in which Atlantic herringwere caught and medium bars show, within each interval, the percentageof the total number of Atlantic herring caught.

Atlantic Mackerel and SST
Spring 1968 Spring 1974

Tasks
A. Promote recovery and long-term sustainability of fish stocks and protected species -Map fish distribution-Map fishing effort, e.g. VMS-Ecosystem considerations in stock assessments
B. Restore and preserve habitats necessary to secure ecosystem health -Provide information on Essential Fish Habitat to the Councils in the form of maps-Map habitat types, ecosystem services -Map Habitat Areas of Particular Concern-Map threatening human activities-Map current and proposed management actions, e.g. closures
C. Enhance and ensure long-term social and economic benefits to society from their use
• -Map “services” by geographical location, e.g. petroleum, fisheries, pharmaceuticals, ecotourism, etc.
• -Map ecosystem services (structure, composition, function)

Gulf of Maine Mapping Initiative

GULF OF MAINE
COUNCIL
CANADA
GOMMI Steering
Committee
GOMMI Administrative
&Contracting
Office
UNITED STATES
GOMMI Mapping
OfficeU.S. &
Canada
GSCDFO
State/ProvinceAgencies
NOAAUSGS
Academia, Others
Regional Advisory
Committees
Research & TechnicalAdvisory
Committees

What do we wantfrom GIS?
Synthesis.
Data limited
A growing demand: Synthesis
H.M.S. Challenger↓
Satellite Imagery
Non-spatial analysis↓
GIS
Individual data sets↓
Integrated data
Analysis limited
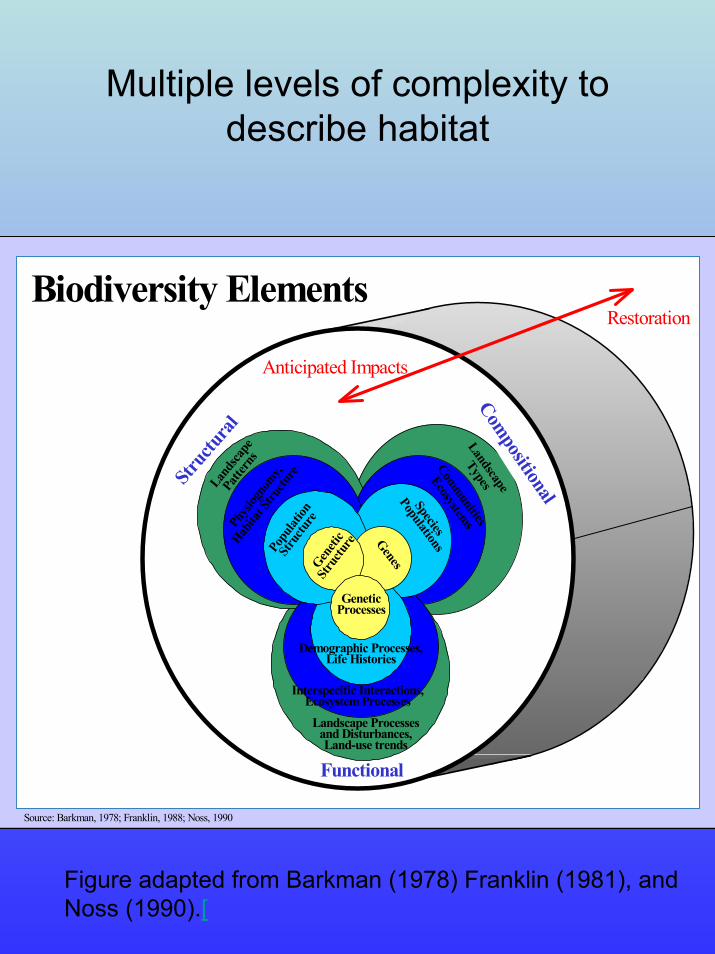
Multiple levels of complexity to describe habitat
Biodiversity Elements
Struc
tural
Compositional
Functional
Popu
lation
Stru
cture
Geneti
cSt
ructu
re
Species
PopulationsGenes
GeneticProcesses
Lands
cape
Patter
nsPhy
siogn
omy,
Habita
t Stru
cture
Landscape
Types
Communities
Ecosystems
Demographic Processes,Life Histories
Interspecific Interactions,Ecosystem Processes
Landscape Processesand Disturbances,Land-use trends
Restoration
Anticipated Impacts
Source: Barkman, 1978; Franklin, 1988; Noss, 1990
Figure adapted from Barkman (1978) Franklin (1981), and Noss (1990).[

e.g.
FunctionalSeascape Processes and Disturbances, currents,
tides, gyres, mixing depth, entrainment, event frequencies and intensities, fisheries
Interspecific Interactions, Ecosystem Processes: succession, predation, competition, commensalism, mutualism, parasitism, disease, functional groups of species or taxa, stability vs. habitat disturbance, nutrient cycling
Demographic Processes, Life Histories: migration, recruitment, survivorship, behavior
Genetic Processes: mutation, gene flow, island effects, non-random mating, inbreeding depression, gene expression

Integrate Laboratory with Field Studies
0 - 22 - 44 - 66 - 88 - 1010 - 12
-1.5 - -0.5-0.5 - 0.30.3 - 1.31.3 - 2.22.2 - 3.13.1 - 4.1
1.4 -2.7 m2.7 -3.7m3.7 -5.0 m5.2 -6.5 m6.5 -7.7m7.7 -9.0 m
10.4 -11.5 m9.0 -10.4 m
0.2 -1.4 m
Depth
0 - 22 - 44 - 66 - 88 - 1010 - 1212 - 14
Sediment Organics(% dry wt)
(m at MLW) ( O )Mean Grain Size
Sediment Shell(% dry wt)

Pelagic HabitatLarge-scale pelagic coupling
Platt et al. 2003

Pelagic HabitatLarge-scale pelagic coupling

Benthic-Pelagic Coupling

Monitoring

Develop sampling and monitoring strategies
Develop sampling and monitoring strategies
Discrete pointsSlow
Still photography, grab samples, tidepool/beach
inventories
Fine scale(1-10 m2)
Selected continuous transects
Moderate
Video, sidescansonar,
interferometricsidescan sonar, laser line scan
Medium scale(10-100 km2)
CompleteRapidMultibeam,
satellite, CASI, LIDAR
Coarse scale(10-1000+ km2)
Sampling density
Data acquisition
speedMethods
Sampling resolution

.. and implement them
Daily operational planning with multibeam and backscatter maps.

Management Advice

Biodiversity & Gear Effects& Hot Issues
The New York Times 19 Sept. 2000
Environmental concerns are
driving fisheries research

Modeling
• Risk Assessment• Habitat suitability• Habitat vulnerability• Habitat recoverability• Ecosystem services

Core parameters
Large-scale circulationPrimary producersSecondary producersFish distributionFishing effortOther human activitiesBathymetryAcoustic backscatterSurficial geologyBenthic compositionIssues, e.g. cold-water coralsMgt. actions, e.g. closures, HAPCsPhotographic documentation

Current actions
• NEFSC – Sea Grant GIS / Mapping coordination– Identify partners / stakeholders– Prioritize issues– Ensure data access and exchange (incl.
propriety issues)
• NE Habitat Evaluation working group (Fishery Councils, ASMFC, NERO, NEFSC) – Evaluate existing models elucidating
ecosystem services– QA/QC of state data via ACCSP
• GOMMI• ICES, WGMHM, WGECO, WGFISH• Charleston, Sept 2004