The nature of violent crime in England and Wales
25
Page 1 of 25 Next release: To be announced Release date: 25 February 2021 Contact: Nick Stripe [email protected] +44 (0)20 7592 8695 Article The nature of violent crime in England and Wales: Year ending March 2020 A summary of violent crime from the Crime Survey for England and Wales and police recorded crime. Table of contents 1. Main points 2. Extent of violent crime 3. Long-term trends in violent crime 4. Trends for different types of violent crime 5. The relationship between victims and perpetrators 6. Levels of repeat victimisation 7. Groups of people most likely to be victims of violent crime 8. Reporting violent crime to the police 9. Injuries resulting from violent crime 10. Glossary 11. Measuring the data 12. Strengths and limitations 13. Related links
Transcript of The nature of violent crime in England and Wales

Page 1 of 25
Next release: To be announced
Release date: 25 February 2021
Contact: Nick Stripe [email protected] +44 (0)20 7592 8695
Article
The nature of violent crime in England and Wales: Year ending March 2020A summary of violent crime from the Crime Survey for England and Wales and police recorded crime.
Table of contents
1. Main points
2. Extent of violent crime
3. Long-term trends in violent crime
4. Trends for different types of violent crime
5. The relationship between victims and perpetrators
6. Levels of repeat victimisation
7. Groups of people most likely to be victims of violent crime
8. Reporting violent crime to the police
9. Injuries resulting from violent crime
10. Glossary
11. Measuring the data
12. Strengths and limitations
13. Related links

Page 2 of 25
1.
1 . Main points
Trends in violent crime
Over the last two decades the Crime Survey for England and Wales (CSEW) has shown long-term reductions in estimates of violent crime:
Victimisation rates have decreased from 4.7% of adults being a victim of violent crime in 1995 to 1.6% in the year ending March 2020; however, rates have remained fairly flat since the year ending March 2014.
The total number of incidents has decreased 72% from a peak of 4.5 million incidents in 1995 to 1.2 million incidents in the year ending March 2020; although there was no significant change in the last year, the downward trend has continued in recent years with the number of incidents decreasing 28% compared with the year ending March 2015 (1.7 million incidents).
The fall in total number of incidents since the year ending March 2015 was driven by a 41% reduction in repeat incidents, from 1.1 million incidents in the year ending March 2015 to 650,000 in the year ending March 2020.
While the overall level of CSEW violent crime showed no change compared with the previous year, there were increases in police recorded violence against the person, with offences 6% higher in the year ending March 2020 compared with the year ending March 2019. This included:
A 7% rise in homicide offences (to 695 offences); this figure includes the Grays lorry incident with 39 homicide victims, if this incident is excluded, homicide showed a 1% increase overall .1
A 6% rise in offences involving a knife or sharp instrument (to 50,019 offences); this is in contrast to a decrease in hospital admissions for assault by a sharp object (an 8% decrease to 4,674 admissions).
About this release
This publication reports on trends in violent crime across England and Wales for the year ending March 2020. This publication is largely unaffected by the coronavirus (COVID-19) pandemic as it mainly relates to the period prior to the lockdown. It is important to note that these are not the latest figures on trends in violent crime. Headline figures covering later periods have been published in the Crime in England and Wales quarterly
but this release provides more detail on the nature and circumstances of violent crime.statistical bulletin
Notes for Main points
Data presented from the Home Office Homicide Index refer to the position as at 15 December 2020, when the Homicide Index database was "frozen" for the purpose of analysis ( ).Homicide in England and Wales
2 . Extent of violent crime
The Crime Survey for England and Wales (CSEW) estimated that 1.6% of adults aged 16 years and over were a victim of violent crime in the year ending March 2020 , ( ), equating to 1 2 Appendix tables, year ending March 20201.2 million incidents of violence:
Page 3 of 25
0.9% were a victim of violence without injury
0.4% were a victim of assault with minor injury
0.4% were a victim of wounding
Just over half (52%) of all CSEW violent incidents in the last 12 months resulted in no injury to the victim. Of violent incidents involving injury, the majority of these were wounding, such as cuts or severe bruising. Overall, figures for the year ending March 2020 were similar to the previous year's survey; however, assault with minor injury decreased by 35% compared with the previous year ( ).Appendix tables, year ending March 2020
The police recorded 1.8 million violence against the person offences in the year ending March 2020 , an 3 4
increase of 6% from 1.7 million in the year ending March 2019 ( ). Appendix tables, year ending September 2020Of these:
"violence without injury" accounted for 41% (732,912 offences)
"violence with injury" accounted for 31% (540,502 offences)
"stalking and harassment" accounted for 28% (494,586)
"death or serious injury - unlawful driving" accounted for 0.05% (810 offences)
"homicide" accounted for 0.04% (721 offences)
This article does not cover homicide in detail. Instead, a separate Homicide in England and Wales: year ending article, which presents data analysis from the Home Office Homicide Index, has been published March 2020
alongside this release. The Homicide Index provides a greater level of detail about the nature of homicide offences and of victims and suspects than available in the main police recorded crime collection.
Violent crimes against children
The year ending March 2020 CSEW estimated that 2.6% of children aged 10 to 15 years (105,000) were a victim of violent crime in the previous 12 months, a decrease of 2.8 percentage points from the previous year. This 5
continues the downward trend since the year ending March 2010 . Children were more commonly victims of 6
violence with injury than violence without injury, 2.2% compared with 0.4% (Appendix tables, year ending March .2020)
Notes for Extent of violent crime

Page 4 of 25
1.
2.
3.
4.
5.
6.
"All violence" includes violence with injury (wounding, assault with minor injury), and violence without injury. For more information see Chapter 5.1 of the .User guide to Crime Statistics for England and Wales
Victims may report experiencing more than one incident of violence and, therefore, may report experiencing more than one type of violence.
Recorded crime figures presented in this release are those notified to the Home Office and that were recorded in the Home Office database on 11 December 2020, covering the year ending March 2020 - see
for the full dataset.Appendix Table A4
Police recorded crime data are not comparable with CSEW estimates as they cover a broader range of offences that the CSEW does not cover, such as stalking and harassment.
These are based on a"preferred measure" that takes into account factors identified as important in determining the severity of an incident such as the relationship of the victim to the perpetrator and the level of injury to the victim. See Chapter 2 of the for further information.User guide
Data first collected on crimes against children in the year ending March 2010.
3 . Long-term trends in violent crime
The Crime Survey for England and Wales (CSEW) provides the best measure of long-term trends
For the population groups and offences it covers, the CSEW is the best source for assessing long-term trends in violent crime as the survey's methodology has remained consistent over the full data time series prior to the coronavirus (COVID-19) pandemic. More information regarding how the coronavirus pandemic has impacted the CSEW can be found in Section 9 of Coronavirus and crime in England and Wales: August 2020.
Victimisation rates have decreased from 4.7% of adults being a victim of violent crime in 1995 to 1.6% in the year ending March 2020; however, these victimisation rates have remained fairly flat since the year ending March 2014 (Figure 1, ).Appendix tables, year ending March 2020
Page 5 of 25
1.
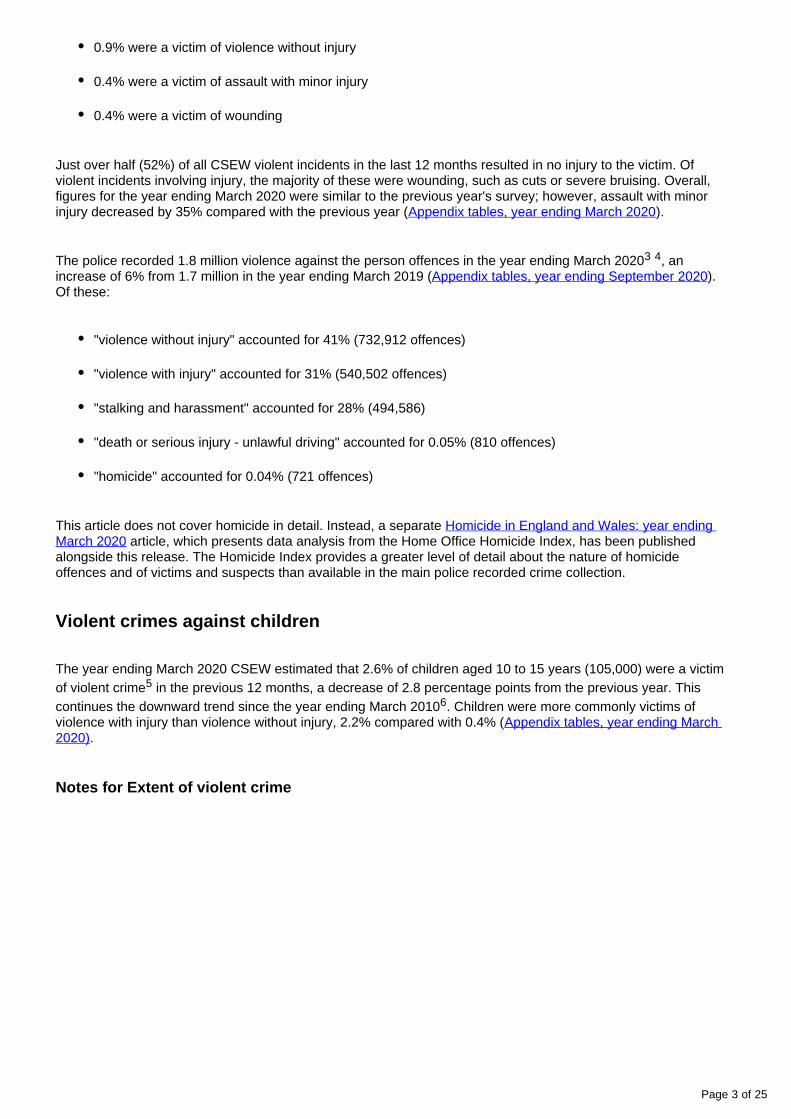
Figure 1: Prevalence of Crime Survey for England and Wales violent crime has remained fairly flat in recent years following long-term falls
England and Wales, year ending December 1981 to year ending March 2020
Source: Office for National Statistics - Crime Survey for England and Wales
Notes:
Prior to year ending March 2002, CSEW respondents were asked about their experience of crime in the previous calendar year, so year-labels identify the year in which the crime took place. Following the change to continuous interviewing, respondents' experience of crime relates to the full 12 months prior to interview (that is a moving reference period), so year-labels from year ending March 2002 onwards identify the CSEW year of interview.
The latest figure for the percentage of adults who were a victim in the previous 12 months (1.6%) was around one-third of that estimated for the year ending December 1995 (4.7%). The largest decline over this period has been for assault with minor injury, which at 0.4% for the year ending March 2020 was around one-fifth of the rate compared with the year ending December 1995 (1.8%, ).Appendix tables, year ending March 2020
In contrast to victimisation rates, incident rates continue on a downward trend. CSEW violence peaked in 1995 (4.5 million incidents) and has fallen by almost three-quarters (72%) to 1.2 million incidents for the year ending March 2020 (Figure 2, ).Appendix tables, year ending March 2020

Page 6 of 25
1.
Figure 2: Crime Survey for England and Wales shows long-term reductions in estimates of violent crime
England and Wales, year ending December 1981 to year ending March 2020
Source: Office for National Statistics - Crime Survey for England and Wales
Notes:
Prior to year ending March 2002, CSEW respondents were asked about their experience of crime in the previous calendar year, so year-labels identify the year in which the crime took place. Following the change to continuous interviewing, respondents' experience of crime relates to the full 12 months prior to interview (that is a moving reference period), so year-labels from year ending March 2002 onwards identify the CSEW year of interview.
Although there was no significant change in the last year, the number of incidents in the year ending March 2020 has decreased 28% compared with the year ending March 2015 (1.7 million incidents, Appendix tables, year
). This fall has been driven by a 41% fall in repeat incidents, from 1.1 million incidents in the ending March 2020year ending March 2015 to 650,000 in the year ending March 2020. There was also an 80% decrease in repeat incidents in the year ending March 2020 compared with the year ending December 1995 (Figure 3, Nature of
).violent crime appendix tables
Page 7 of 25
1.
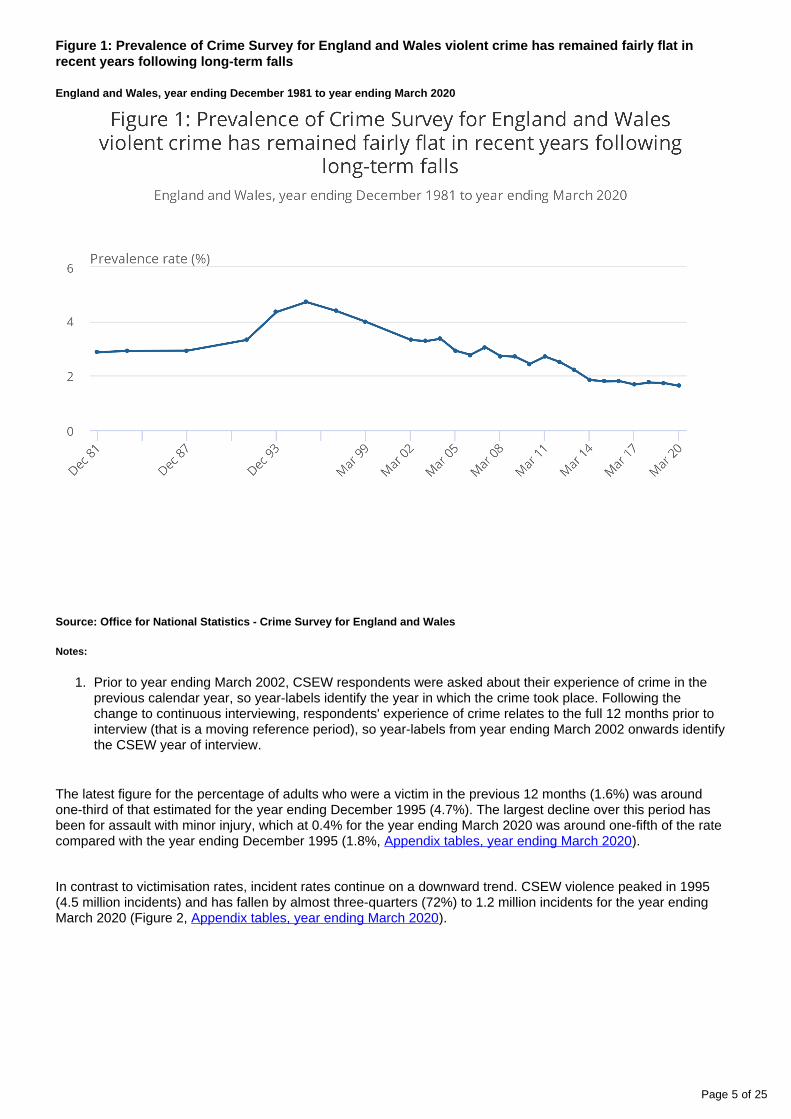
Figure 3. The fall in total number of incidents appears to be driven by a decrease in repeat incidents
England and Wales, year ending December 1995 to year ending March 2020
Source: Office for National Statistics - Crime Survey for England and Wales
Notes:
Only data capped at the 98th percentile are presented in this graph.
The longer-term reductions in violent crime shown by the CSEW are also reflected in the findings of research conducted by the (PDF, 807KB). Their annual survey, Violence and Society Research Group at Cardiff Universitycovering a sample of hospital emergency departments and walk-in centres in England and Wales, shows that violence-related attendances in 2019 have fallen 45% since 2010. Focusing on the more serious sub-set of attendances that result in admission, the most recent in England also show admissions data for NHS hospitalsadmissions resulting from an assault in the year ending March 2020 (27,150) were 32% lower than the year 1
ending March 2010 (39,858 admissions).
Recording improvements have driven rises in violent crime recorded by the police
In apparent contrast to the long-term downward trend of incidents of violent crime shown by the CSEW, police recorded violent crime has increased between the year ending March 2013 and the year ending March 2020, with 1.8 million violent offences recorded in the latest year ( ). This was Appendix tables, year ending September 2020the highest in a 12-month period since the introduction of the National Crime Recording Standard (NCRS) in April 2002. However, these increases are thought to be driven largely by improvements in recording in response to concerns over the quality of police crime data . These concerns were highlighted in Her Majesty's Inspectorate of 2
Constabulary and Fire & Rescue Services (HMICFRS) inspection reports.
Page 8 of 25
1.
2.
3.
Firstly, the report, published by HMICFRS in 2014, showed that Crime-recording: making the victim countviolence against the person offences had the highest under-recording rates across police forces in England and Wales. For more information see the User guide to crime statistics.
The 2015 HMICFRS report, Increasingly everyone's business: A progress report on the police response to (PDF, 1.5MB), then showed there had been an improved response by police to domestic abuse domestic abuse
following an inspection in 2013.
Police recorded crime data cannot provide information on longer-term trends in violent crime, as major changes such as the introduction of the NCRS, and the expansion of the in April 1998Home Office Counting Rules (HOCR), mean that the volume of violent crime recorded before and after these dates is not comparable.3
Notes for Long-term trends in violent crime
See "External causes" dataset in and Hospital Admitted Patient Care Activity, 2019 to 2020 Hospital provided by NHS Digital. Assault Episode Statistics, Admitted Patient Care - England, 2010 to 2011
admissions do not include sexual offences but include assault codes X85 to Y04 and Y08 and Y09 from the dataset.
As part of an inquiry by the Public Administration Select Committee (PASC) into crime statistics in late 2013, allegations of under-recording of crime by the police were made (in particular, concerns regarding the accuracy of police recorded crime data for sexual offences were raised). Because of wider concerns over the quality and consistency of crime recording, police recorded crime data were assessed against the Code
in 2014 (now the Code of Practice for Statistics). They were found not to of Practice for Official Statisticsmeet the required standard for designation as National Statistics. Since then, there has been an increased focus on improving recording practices, which has led to a greater proportion of reported crimes being recorded by the police.
The HOCR for recorded crime were expanded to include certain additional summary offences.
4 . Trends for different types of violent crime
It is important to look across a range of data sources to understand trends in different types of violent crime.
Crime Survey for England and Wales (CSEW) violence provides a good measure of the most commonly occurring violent crimes
Individual types of CSEW violence have followed a similar trend to overall CSEW violence, with large reductions 1
since the mid-to-late 1990s. Assaults with minor injury have shown the largest decrease (84%) since the peak in the year ending December 1995, while wounding and violence without injury decreased by 68% and 65% respectively ( ).Appendix tables, year ending March 2020
Police recorded crime provides a better measure of less common but higher-harm types of violence
Ongoing work by police forces over the last six years to improve crime recording practices make interpreting trends in police recorded violence against the person offences difficult. These changes in recording practices are thought to have had a larger effect on relatively lower-harm types of violent crime, but to have had little impact on higher-harm types of violence such as murder and attempted murder.
Page 9 of 25
Homicide and attempted murder
Based on data from the Home Office Homicide Index there were 695 homicides recorded in the year ending 2
March 2020, a 7% increase compared with the previous year when 648 homicides were recorded. Of the 695 homicides recorded, there were 39 homicides that related to the Essex lorry deaths; excluding these deaths, there was a volume increase of 8 homicides (1% increase, up to a total of 656). (Appendix tables, homicide in
).England and Wales
Homicide offences made up 0.04% of all violence against the person offences and the rate of homicide in the 3
population remains relatively low, at 12 homicides per 1 million people. Please see the Homicide in England and article for more information.Wales: year ending March 2020
There was a 3% decrease in the number of attempted murder offences in the year ending March 2020, to 1,005 offences ( ).Appendix tables, year ending September 2020
Offences involving weapons
Weapons were used in 21% of violent incidents according to the year ending March 2020 Crime Survey for England and Wales (CSEW, ). Knives and other stabbing implements were used Nature of crime, violence tablesin 9% of violent incidents. Weapons that fell under the category of "other" were used in 7% of violent incidents, and hitting implements were used in a similar proportion (6%) of violent incidents. The "other" category encompasses a broad range of objects that could be used as a weapon, including household items used as improvised weapons.
Offences involving firearms
Offences involving firearms encompass any notifiable offence recorded by the police where a firearm has been fired, used as a blunt instrument or been used as a threat. Firearm possession offences, where the firearm has not been used in the course of another offence, are not included in this analysis.
Offences involving firearms make up a small proportion of overall police recorded crime. In the year ending March 2020, they were used in approximately 0.2% of all police recorded offences . This is a lower proportion than seen 4
10 years ago when firearms were used in approximately 0.3% of all police recorded offences ( ).Weapons tables
There was a 6% decrease in offences involving firearms in the year ending March 2020 compared with the previous year. This was driven by an 11% decrease in the air weapon category (from 3,122 offences to 2,784 offences). The trend in offences involving firearms has been fairly flat in recent years following increases between the year ending March 2014 and the year ending March 2017 ( ).Weapons tables
There were 6,622 offences involving firearms excluding air weapons recorded in the year ending March 2020; this was a 4% fall compared with the previous year, but a 36% rise compared with the year ending March 2014 (Figure 4, ).Weapons tables

Page 10 of 25
1.
2.
Figure 4: Firearm offences recorded by the police fell this year following rises in recent years
England and Wales, year ending March 2003 to year ending March 2020
Source: Home Office - Police recorded crime
Notes:
Police recorded crime data are not designated as National Statistics.
More explicit guidelines for the classification of weapons introduced on 1 April 2004 may have increased the recording of firearm offences, particularly those committed by imitation weapons.
Police recorded offences involving a knife or sharp instrument
Information is also available, for selected crime types, on whether a recorded offence involved a knife or a sharp instrument. These cover the vast majority of offence types likely to involve a knife or sharp instrument. Knife possession offences, where the weapon has not been used in the course of another offence, are not included in this analysis.
Offences involving knives or sharp instruments rose by 6% in the year ending March 2020 compared with the previous year, from 47,388 offences to 50,019 offences (Crime in England and Wales, Police Force Area tables,
). Of these offences, 22,012 (44%) were for assault with injury or assault with intent year ending September 2020to cause serious harm and 21,961 (44%) were used in a robbery .4

Page 11 of 25
The past six years have seen a rise in the number of recorded offences involving a knife or sharp instrument in England and Wales, following a previously downward trend . The year ending March 2020 was the highest 5
number since the year ending March 2011, the earliest point for which comparable data are available (Weapons ).tables
These increases are thought to largely reflect a real rise in the occurrence of knife or sharp instrument offences. However, improvements in crime recording practices may have also contributed to the recent increases in these types of crime. To improve data quality the Home Office and police forces have developed a new methodology for identifying recorded offences involving knives or sharp instruments, and data using this new process will be included in the next quarterly crime statistics bulletin, covering data for the year ending December 2020. For more information, see "Improving data collection on offences involving knives or sharp instruments" in the year
.ending September 2020 quarterly bulletin
NHS data help to provide further insight into offences involving weapons. NHS hospitals in England reported 4,674 admissions for assault by a sharp object between April 2019 and March 2020, a decrease of 8% compared with the previous year ( ).Weapons tables
As expected, the number of police recorded knife crime offences is considerably higher than hospital admissions for assault by sharp object. Hospital admissions data capture the most serious offences, and for the large majority of knife offences recorded by the police the victim does not require hospital treatment.
Trends in hospital admissions for assault with sharp objects and police recorded offences involving knives or sharp instruments followed a similar trend between the year ending March 2011 and the year ending March 2016. However, police recorded offences involving knives or sharp instruments have risen more steeply in recent years compared with hospital admission figures (Figure 5, ). The steeper increase in police recorded Weapons tablesoffences involving a knife or a sharp instrument may partly reflect improvements in crime recording.

Page 12 of 25
1.
2.
3.
Figure 5: In the last year offences involving a knife or sharp instrument recorded by the police continued rising, whereas NHS hospital admissions showed a fall
England and Wales, year ending March 2011 to year ending March 2020
Source: Home Office - Police recorded crime and NHS Digital - Hospital Episode Statistics
Notes:
Police recorded crime data are not designated as National Statistics.
Police recorded knife and sharp instrument offences data are submitted via an additional special collection.
Over the time period of this data collection, most police forces have made data quality and recording improvements which means data from earlier years are not directly comparable with recent years. More details are available in Table P5 of the Crime in England and Wales Police force area tables.
Death or serious injury - unlawful driving
Offences related to death or serious injury caused by unlawful driving decreased by 4% in the latest year to March 2020 (to 810 offences), compared with the previous year (841 offences). There has been relatively little change in the number of offences in recent years following an upward trend from the year ending March 2013 to the year ending March 2017. Within the death or serious injury - unlawful driving offences category, over three-quarters of offences (79%, 642 offences) were classified as causing death or serious injury by dangerous driving. Causing death by careless or inconsiderate driving accounted for a further 16% of these offences (130 offences,
).Appendix tables, year ending September 2020
Notes for Trends for different types of violent crime

Page 13 of 25
1.
2.
3.
4.
5.
6.
See Chapter 5.1 of the for more information on the offences included in this breakdown.User guide
The Home Office Homicide Index contains detailed record-level information about each homicide recorded by police in England and Wales. It is continually updated with revised information from the police and the courts and, as such, is a richer source of data than the main recorded crime dataset and is therefore the preferred source for homicide statistics. Data presented refer to the position as at 15 December 2020, when the Homicide Index database was "frozen" for the purpose of analysis.
Proportion calculated from police recorded crime data.
Excluding fraud and computer misuse offences.
These figures were taken from the .Home Office police recorded crime and outcomes open data tables
Greater Manchester Police (GMP) have been excluded from the data to ensure comparability across years because of issues with their data supply following the implementation of new force IT systems.
5 . The relationship between victims and perpetrators
Crime Survey for England and Wales (CSEW) violence can be broken down by the relationship between the victim and the perpetrator, enabling the categorisation of stranger, acquaintance, or domestic violence. The definition of domestic violence in the CSEW refers to incidents reported through the face-to-face interview that were perpetrated by a partner or ex-partner, or a family member.
The level of domestic violence reported in this way is prone to significant under-reporting because many victims will not be willing to disclose such incidents in the context of a face-to-face personal interview. Of those aged 16 to 74 years who reported being victims of physical domestic abuse in the year ending March 2020 CSEW self-completion module on intimate violence, only 10.3% also reported being a victim of domestic violence in the face-1
to-face interview ( ). Domestic abuse prevalence and trends, England and Wales: year ending March 2020Therefore, the measures of domestic violence reported in this section are an under-estimation of the true extent of this type of violence and as a result, the proportions of violence perpetrated by strangers and acquaintances 2 3
will be over-estimated. More information can be found in Chapter 2 of the .User guide to crime statistics
In the year ending March 2020 CSEW, the most common perpetrators of violent crime were acquaintances (43%, 528,000 offences), with 41% of offences (511,000) perpetrated by a stranger, and the remaining 16% (200,000 offences) categorised as domestic violence (Figure 6, ). These figures Appendix tables, year ending March 2020have fluctuated over recent years, with acquaintance violence accounting for the largest proportion of offences in some years and stranger violence accounting for the largest proportion in others. The year ending March 2020 CSEW showed that:
incidents of stranger violence had fallen by 52% from the peak of 1.1 million offences in the year ending December 1995 to an estimated 511,000 offences
acquaintance violence fell by 75% from the peak of 2.1 million offences in the year ending December 1995 to an estimated 528,000 offences, being an important driver of changes in overall violence
there was no change for domestic, stranger or acquaintance violence compared with statistically significantthe previous year
The article provides further information on both Domestic abuse in England and Wales overview: November 2020physical and non-physical domestic abuse using the self-completion module of the CSEW in the year ending 4
March 2020; 2.3 million adults aged 16 to 74 years experienced domestic abuse in the last year (1.6 million women and 757,000 men), a slight but non-significant decrease from the previous year.

Page 14 of 25
1.
2.
3.
Figure 6: Stranger, acquaintance and domestic violence have shown declines since the mid-1990s
England and Wales, year ending December 1981 to year ending March 2020
Source: Office for National Statistics - Crime Survey for England and Wales
Notes:
Prior to year ending March 2002, CSEW respondents were asked about their experience of crime in the previous calendar year, so year-labels identify the year in which the crime took place. Following the change to continuous interviewing, respondents' experience of crime relates to the full 12 months prior to interview (i.e. a moving reference period), so year-labels from year ending March 2002 onwards identify the CSEW year of interview.
Base sizes for data from year ending March 2013 are smaller than previous years, due to sample size reductions introduced.
Owing to possible missing data regarding the relationship between the respondent (victim) and the offender for particular offences, the domestic violence/acquaintance/stranger breakdown may not sum to the total for all violence.
Relationship between victims and suspects from the Home Office Data Hub
Analysis of the relationship between victims and suspects of violent offences recorded by the police shows that a 5
greater proportion of violent offences against women were committed by an intimate partner ; for female victims, 6
49% of suspects were intimate partners, compared with 22% for male victims. The proportion of violent offences committed by a family relative was similar for both female (21%) and male (23%) victims. Acquaintance and stranger relationships between victims and suspects were more common for men, 34% and 21% respectively, compared with women, 22% and 8% respectively (Figure 7, ).Nature of violent crime appendix tables

Page 15 of 25
1.
2.
Figure 7: The suspects of violence against the person offences were most likely to be in “intimate partner” relationships with female victims, and “acquaintance” relationships with male victims
England and Wales, year ending March 2020
Source: Home Office - Police recorded crime
Notes:
Police recorded crime data are not designated as National Statistics.
Police recorded crime data based on 17 forces that provided data via the Home Office Data Hub or in a manual return. Data have not been reconciled with forces.
Perception of perpetrator from the Crime Survey for England and Wales (CSEW)
Victims of violent crime interviewed in the year ending March 2020 CSEW were able to provide some detail about the perpetrator(s) in 98% of incidents ( ). The following profiles are based on the Nature of crime, violence tablesvictims' recollection and perception of the perpetrator(s):
Page 16 of 25
1.
2.
3.
4.
5.
6.
perpetrators were most likely to be male, being reported as so in over three-quarters of violent incidents (82%)
perpetrators were most likely to be 25 to 39 years old, being reported as so in 42% of violent incidents; compared with 16 to 24 years old and 40 years and over in 28% and 26% of incidents, respectively
in 73% of violent incidents a sole perpetrator was reported to have been responsible
36% of incidents of stranger violence involved more than one perpetrator, compared with 27% of incidents of acquaintance violence and only 5% of domestic violence incidents
Notes for The relationship between victims and perpetrators
"Self-completion" means that the respondent reads the questions themselves and records their answers directly onto a laptop.
Stranger violence includes wounding and assaults in which the victim did not have any information about the perpetrator(s), or did not know and had never seen the perpetrator(s) before.
Acquaintance violence is comprised of wounding and assaults in which the victim knew one or more of the perpetrators at least by sight. It does not include domestic violence.
The self-completion module uses a broader definition of domestic abuse, including emotional or financial abuse and threats to hurt the respondent or someone close to them, rather than just physical violence.
Based on 17 police forces where sufficient data were available on the Data Hub for the year ending March 2020.
"Intimate partner" refers to all partner and ex-partner relationships, not just where the couple were married or in a civil partnership, but also including co-habiting partners and those considered in a relationship.
6 . Levels of repeat victimisation
Repeat victimisation is defined as the experience of being a victim of more than one crime of the same type within the last 12 months. In the year ending March 2020 survey, the Crime Survey for England and Wales (CSEW) showed that 77% of victims of violence were victimised once, while 23% were repeat victims in the previous 12 months (17% victimised two to four times, 6% victimised five times or more, Annual trend and
).demographic tables
The level of repeat victimisation showed no significant change from the previous year's survey, but has significantly decreased by 17 percentage points since 1995 (39%, ).Annual trend and demographic tables
In the year ending March 2020, 34% of victims of domestic violence , 27% of victims of acquaintance violence 1
and 14% of victims of stranger violence were repeat victims (Figure 8). However, these proportions can fluctuate from year to year ( ).Annual trend and demographic tables
The latest estimates showed that 52% of violent incidents were experienced by repeat victims compared with 74% in the year ending December 1995 (3.3 million incidents, when CSEW violence peaked, Annual trend and
).demographic tables

Page 17 of 25
1.
There were 646,000 repeat incidents and 593,000 single incidents in the year ending March 2020. There has been a fall in the total number of violent incidents since the year ending March 2015, which was driven by a 41% fall in repeat incidents from 1.1 million incidents in the year ending March 2015 to 646,000 in the year ending March 2020 ( ).Nature of violent crime appendix tables
The most common type of violence to be experienced on a repeated basis is domestic violence, which is not well measured by the face-to-face interview of the CSEW. Therefore, the analysis can only be used to draw conclusions about the repeat victimisation of domestic violence captured by this source, which may only provide a partial picture.
Figure 8: A third of those who reported experiencing domestic violence were repeat victims
England and Wales, year ending March 2020
Source: Office for National Statistics - Crime Survey for England and Wales
Notes for Levels of repeat victimisation
The main face-to-face interview under-estimates the number of domestic violence incidents.

Page 18 of 25
7 . Groups of people most likely to be victims of violent crime
The year ending March 2020 Crime Survey for England and Wales (CSEW) showed that victimisation of violent crime varied by certain personal and household characteristics (see for a Nature of violent crime appendix tablesfull breakdown). Many of the characteristics are closely associated with each other, so caution is needed in the interpretation of these different characteristics when viewed in isolation.
While the CSEW provides good estimates of prevalence for most crime types, for domestic violence incidents the self-completion module of the survey is the preferred measure. See Domestic abuse in England and Wales
for a breakdown of characteristics of victims of domestic abuse taken from the self-overview: November 2020completion module of the CSEW in year ending March 2020.
Sex
Men were more likely to be victims of CSEW violent crime than women (2% of men compared with 1.3% of women , Appendix Table 1). This was true for all types of violence, with the exception of domestic violence, 1
where women were more likely to be victims (0.3% of women and 0.1% of men, Nature of violent crime appendix ). The year ending March 2020 CSEW showed that:tables
stranger violence showed the largest difference in victimisation between men and women (1.2% compared with 0.4% respectively)
0.7% of men and 0.5% of women experienced acquaintance violence
However, estimates of domestic abuse derived from the self-completion module of the CSEW for respondents aged 16 to 59 years show that women were more likely to be victims of this kind of violence than men, 8.1% and 4.0% respectively ( ).Domestic abuse in England and Wales overview: November 2020
The CSEW estimated that 60% of victims of violence were male, with 40% being female in the year ending March 2020 (data not shown). This is notably different from the Home Office Data Hub, which showed more violence against the person offences recorded by the police had female victims (56%) than male victims (44%). A likely reason for the difference between the sources is that females are more commonly the victims in cases of domestic abuse, which accounts for around one-third of violence recorded by the police. The Home Office Data Hub showed that in 70% of offences with a female victim the perpetrator was an intimate partner or other family relative. In comparison, the perpetrator was an intimate partner or other family relative in 45% of offences with a male victim ( ).Nature of violent crime appendix tables
While the CSEW provides good estimates of most crime types, the main face-to-face interview under-estimates the number of domestic violence incidents. (see the "How are victims and perpetrators related?" section of this article for more information).
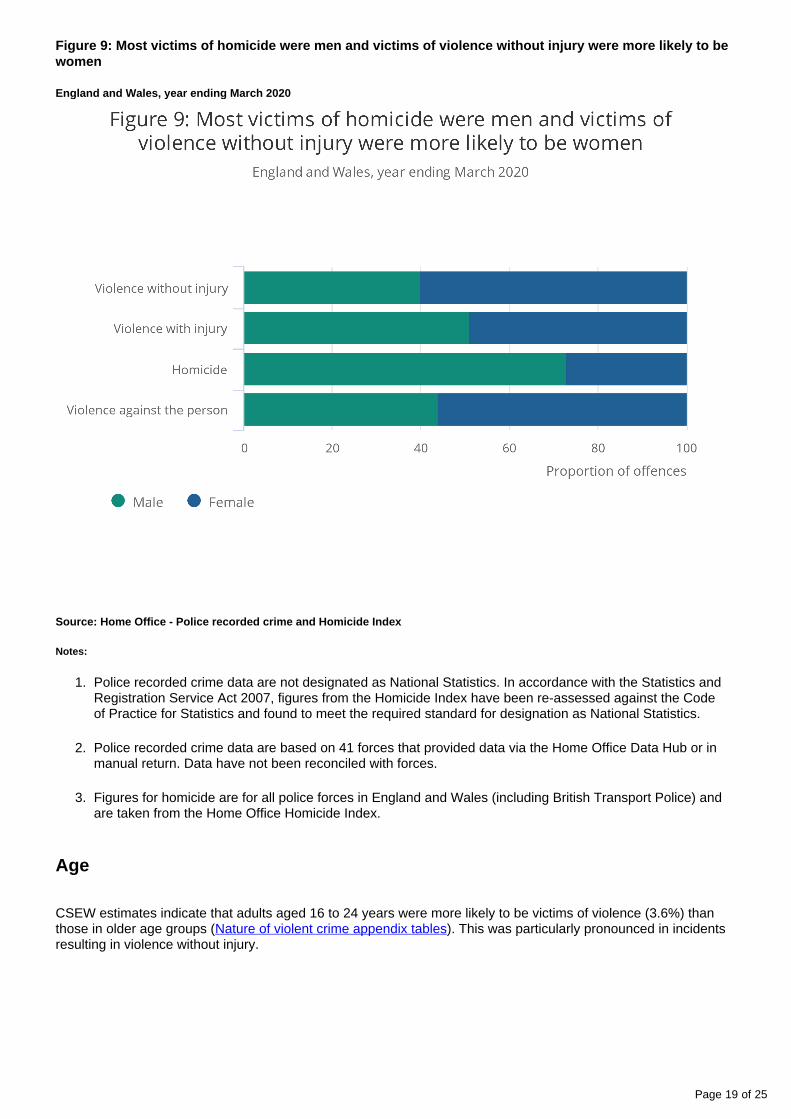
The breakdown of male and female victims differed by the type of violence recorded by the police, with females accounting for a larger proportion of victims of violence without injury than males (60% compared with 40% respectively). However, males and females accounted for a similar proportion of victims of violence with injury, 51% and 49% respectively (Figure 9, ).Nature of violent crime appendix tables
Figures from the Home Office Homicide Index for the year ending March 2020 show that 73% of homicide victims were male and 27% were female. More information on homicide offences can be found in Homicide in England
.and Wales: year ending March 2020
Page 19 of 25
1.
2.
3.
Figure 9: Most victims of homicide were men and victims of violence without injury were more likely to be women
England and Wales, year ending March 2020
Source: Home Office - Police recorded crime and Homicide Index
Notes:
Police recorded crime data are not designated as National Statistics. In accordance with the Statistics and Registration Service Act 2007, figures from the Homicide Index have been re-assessed against the Code of Practice for Statistics and found to meet the required standard for designation as National Statistics.
Police recorded crime data are based on 41 forces that provided data via the Home Office Data Hub or in manual return. Data have not been reconciled with forces.
Figures for homicide are for all police forces in England and Wales (including British Transport Police) and are taken from the Home Office Homicide Index.
Age
CSEW estimates indicate that adults aged 16 to 24 years were more likely to be victims of violence (3.6%) than those in older age groups ( ). This was particularly pronounced in incidents Nature of violent crime appendix tablesresulting in violence without injury.

Page 20 of 25
1.
2.
3.
1.
2.
The CSEW patterns were replicated in data from the Home Office Data Hub on the age of victims of police recorded violence (taken from 24 forces). This showed that younger adults were also more likely to be victims of violent crimes recorded by the police in the year ending March 2020 (Figure 10, Nature of violent crime appendix
). For example, while those aged 20 to 29 years made up around 13% of the population , they were victims tables 2
in 25% of violence against the person offences recorded by the police. Older people and the very young were less likely to be victims. For example, those aged 80 years or over were victims in 1% of violent offences but made up around 5% of the population. Those aged under 10 years accounted for 12% of the population but only 3% of victims.
Figure 10: Younger adults were more likely to be victims of violent crimes recorded by the police
England and Wales, year ending March 2020
Notes
Police recorded crime data are not designated as National Statistics.
Police recorded crime data are based on 24 forces that provided data via the Home Office Data Hub or in manual return. Data have not been reconciled with forces.
Population figures are based on the ONS population estimates for England and Wales.
Download the data
Other characteristics of victims of CSEW violence
Those who were single (3.0%), cohabiting (2.1%) or separated (3.7%) were more likely to be victims of violence compared with married adults (0.9%).
Single adults with children (3.4%) were more likely to be victims of violence than those living with other adults and children (1.7%) and adults living with no children (1.5%).
Renters (2% social and 2.5% private) were more likely to be victims of violent crime than home owners (1.2%).
People with disabilities (2.4%) were more likely to be victims of violent crime than people without disabilities (1.5%) ( ).Nature of violent crime appendix tables
For children aged 10 to 15 years, boys were more likely than girls to have experienced violent crime (3.6% compared with 1.4% respectively). See for more information.Annual trend and demographic tables
Notes for Groups of people most likely to be victims of violent crime
This pattern is different for domestic abuse and sexual assault. For more information please see Domestic and abuse in England and Wales overview: November 2020 Sexual offending: victimisation and the path
.through the criminal justice system
Based on the Office for National Statistics (ONS) England and Wales population estimates.

Page 21 of 25
1.
2.
8 . Reporting violent crime to the police
In the year ending March 2020, the Crime Survey for England and Wales (CSEW) estimated that 49% of violent incidents were reported to the police ( ). This estimate showed no change Annual trend and demographic tablesfrom the previous year (44%); the 5 percentage points increase was not . This latest statistically significantreporting rate for violence was higher than the reporting rate for all CSEW crime, excluding fraud and computer misuse (39%).
The rates at which violent crimes were reported to the police also varied according to the victim to offender relationship. Over half of domestic violence incidents (58%) and stranger violence incidents (56%) were reported to police, both an increase from the previous year (40% and 46% respectively), while 40% of acquaintance violence incidents were reported to the police, a similar percentage to the previous year (45%).
As in previous years, reporting rates continue to vary by type of violence, with 68% of wounding incidents in the latest survey year being reported to the police, compared with 37% of violent incidents without injury. This indicates that, as might be expected, respondents are more likely to report more serious incidents to the police.
Combined data from the CSEW year ending March 2017 to the year ending March 2019 showed that 15% of violent incidents experienced by children aged 10 to 15 years came to the attention of the police (Nature of crime
). This figure is likely to reflect the relative low severity of violent incidents experienced by children.tables
9 . Injuries resulting from violent crime
Victims sustained a physical injury in 48% of incidents of violence in the year ending March 2020 Crime Survey for England and Wales (CSEW; . This varied by perpetrator, with 62% of Nature of crime, violence tables)incidents of domestic violence resulting in physical injury compared with 52% of stranger violence incidents and 1
38% of acquaintance violence incidents.
The most common type of injury experienced was minor bruising or black eye (27% of violent incidents). More serious injuries such as concussion or loss of consciousness (2%) or broken bones (2%) were less common. Victims received some form of medical attention in 15% of violent incidents ( ).Nature of crime, violence tables
Incidents of violent crime experienced by children were more likely to result in injury, with victims aged 10 to 15 years sustaining an injury in 85% of incidents in the combined three years between year ending March 2017 and year ending March 2019 CSEW. Victims received some form of medical attention as a result of the violence in 22% of incidents. Of those incidents where the victim aged 10 to 15 years sustained an injury, minor bruising or black eye was the most common injury (67%), followed by marks on skin (18%) and scratches (18%). In 6% of violent incidents where the victim aged 10 to 15 years sustained an injury, this was a serious injury (2 Nature of
).crime tables
Notes for Injuries resulting from violent crime
Figures relate to domestic violence estimates from face-to-face CSEW interviews.
Serious injury includes facial or head injuries, broken nose, concussion, broken bones and eye or facial injuries caused by acid, paint, sand, and so on, thrown in the face.
10 . Glossary

Page 22 of 25
Violence with injury
Includes all incidents of wounding and assault with injury; homicide is only included for police recorded crime. Police recorded crime also includes attempts at inflicting injury, although the Crime Survey for England and Wales (CSEW) would not include these if no actual injury occurred.
Wounding
The incident results in severe or less serious injury, for example, cuts, severe bruising, chipped teeth, bruising or scratches requiring medical attention or any more serious injuries.
Assault with minor injury
An incident where the victim was punched, kicked, pushed or jostled and the incident resulted in minor injury to the victim, for example, scratches or bruises.
Violence without injury
Includes all incidents of assault without injury (or attempt from the CSEW only) where the victim was punched, kicked, pushed or jostled but resulted in no injury. From July 2013, police recorded crime no longer includes under this sub-category possession of weapons offences and public order offences, such as public fear, alarm or distress. These offences are now included in new sub-categories within "other crimes against society", named "possession of weapons offences" and "public order offences".
Homicide
Includes the offences of murder, manslaughter, corporate manslaughter and infanticide.
Knife or sharp instrument offences
An offence is recorded by the police as involving a knife or sharp instrument when the weapon is present during the offence or the threat is believed to be real. The weapon does not necessarily have to be used. These data are based on a special collection that includes the offences: homicide; attempted murder; threats to kill; assault with injury and assault with intent to cause serious harm; robbery; rape; and sexual assault.
Offences involving a firearm
Includes those where a firearm is fired, used as a blunt instrument, or used as a threat. Firearms include shotguns; handguns; rifles; imitation weapons such as BB guns or soft air weapons; other weapons such as CS gas, pepper spray and stun guns; and unidentified weapons. They exclude conventional air weapons, such as air rifles.
More information and further definitions can be found in the "offence type" section of the User guide to crime .statistics for England and Wales
11 . Measuring the data

Page 23 of 25
Crime Survey for England and Wales (CSEW)
The Crime Survey for England and Wales (CSEW) is a face-to-face victimisation survey, which asks people resident in households in England and Wales about their experiences of a selected range of offences in the 12 months prior to the interview. In addition, from April 2009, in households with children aged 10 to 15 years, a child is also selected at random to be interviewed using a separate shorter 10- to 15-year-olds' questionnaire.
Putting the safety of the public first, we have suspended all face-to-face interviewing on the CSEW to minimise social contact as a result of the coronavirus (COVID-19) pandemic.
Fieldwork for the year ending March 2020 was suspended two weeks early on 17 March 2020 just prior to the lockdown restrictions being announced by the government on 23 March 2020. Estimates for the year ending March 2020 presented in this release are therefore unaffected by the pandemic.
All differences reported in this article are at the 5% level unless stated otherwise.statistically significant
Police recorded crime
Police recorded crime figures are supplied to the Office for National Statistics (ONS) (via the Home Office) by the 43 territorial police forces of England and Wales, plus the British Transport Police. As with the CSEW, both actual and attempted assaults are included in the figures.
The coverage of police recorded violent crime is defined by the . This includes a broad notifiable offence listspectrum of offences, ranging from assault without injury and harassment, to offences such as homicide. There are some crimes that may involve some degree of violence but are not covered in this article, which focuses on victim-based offences. For example, public order offences recorded by the police may involve violence, but no specific victim is identified. See for police recorded figures on Appendix Table A4, year ending September 2020public order offences.
For some types of crime, because of ongoing changes in police recording practices, an increase in the number of offences recorded by the police is unlikely to indicate a real rise in these types of crime. Police recorded crime data are not designated as . Details of concerns over the quality of these data are in the UK National StatisticsStatistics Authority .most recent assessment report
More information on both these sources can be found in the .User guide to crime statistics for England and Wales
More quality and methodology information on strengths, limitations, appropriate uses, and how the data were created is available in the .Crime in England and Wales QMI
12 . Strengths and limitations
Crime Survey for England and Wales (CSEW)
The CSEW is a large nationally representative sample survey that has used a consistent methodology over time. The survey covers crimes not reported to the police and is not affected by changes in police recording practice; therefore, it is a reliable measure of long-term trends.

Page 24 of 25
The CSEW does not cover crimes against businesses and those not resident in households (for example, residents of institutions and visitors). Headline estimates exclude offences that are difficult to estimate robustly (such as sexual offences) or that have no victim who can be interviewed (for example, homicides and drug offences). In addition, the survey is subject to error associated with sampling and respondents recalling past events. Potential time lag between occurrence of the crime and survey data collection means that the survey is not a good measure of emerging trends.
Police recorded crime
Police recorded crime has wider offence coverage and population coverage than the CSEW. It is the primary source of local crime statistics and is a good measure of offences that are well-reported to and well-recorded by the police, as well as lower volume crimes (for example, homicide). In addition, the time lag between occurrence of crime and reporting results tends to be short, providing an indication of emerging trends.
On the other hand, police recorded crime excludes offences that are not reported to, or not recorded by, the police and does not include less serious offences dealt with by magistrates' courts (for example, motoring offences). Trends can be influenced by changes in recording practices or police activity as well as public reporting of crime, making it difficult to make long-term comparisons. There are also concerns about the quality of recording and that crime is not recorded consistently across police forces.

Page 25 of 25
13 . Related links
Guide to finding crime statisticsMethodology | Released 17 July 2020A guide that directs you on where best to find different crime statistics.
Crime in England and Wales: year ending March 2020Bulletin | Released 17 July 2020Crime against households and adults, also including data on crime experienced by children, and crimes against businesses and society.
Nature of crime: violence: year ending March 2020Dataset | Released 3 September 2020Annual data from the Crime Survey for England and Wales, including when and where incidents happened and the victim's perception of the incident.
Nature of crime tables, children aged 10 to 15 years violence: Year ending March 2019Dataset | Released 27 March 2020Annual data from the Crime Survey for England and Wales. Data include when and where incidents happened, information about offenders, the victim's perception of the incident, and who they reported the incident to.
Domestic abuse in England and Wales overview: November 2020Bulletin | Released 25 November 2020Figures on domestic abuse from the Crime Survey for England and Wales, police recorded crime and a number of different organisations.
Domestic abuse prevalence and trends, England and Wales: year ending March 2020Bulletin | Released 25 November 2020Prevalence, long-term trends and types of domestic abuse experienced by adults, based on findings from the Crime Survey for England and Wales, and police recorded crime.
Homicide in England and Wales: year ending March 2020Article | Released 25 February 2021Analyses of information held within the Home Office Homicide Index, which contains detailed record-level information about each homicide recorded by police in England and Wales.
Offences involving the use of weapons: data tables: year ending March 2020Dataset | Released 25 February 2021Data tables relating to offences involving weapons as recorded by police and hospital episode statistics.