The National Ribat University - المستودع الرقمي | جامعة...
63
The National Ribat University Faculty of Graduate Studies and Scientific Research Nutritional Assessment of Civilian and Police Students at the National Ribat University A thesis submitted in partial fulfillment for the requirements of the degree of Master in Human Nutrition and Dietetics By Etizaz Dfaalla Mohamed Supervisor Dr Nadia Abdel Rahim Khogli October, 2014
Transcript of The National Ribat University - المستودع الرقمي | جامعة...

The National Ribat University
Faculty of Graduate Studies
and Scientific Research
Nutritional Assessment of Civilian and Police
Students
at the National Ribat University
A thesis submitted in partial fulfillment for the
requirements of the degree of Master in Human Nutrition
and Dietetics
By
Etizaz Dfaalla Mohamed
Supervisor
Dr Nadia Abdel Rahim Khogli
October, 2014

2

I
اآلية
الرحيم الرحمن اهلل بسم
أنهه ل إله إله هى والملئكة وأولى ( شهد للاه
هى العزيز إله إله ل العلم قائما بالقسط
) الحكيم
العظيم اهلل صدق
سورة آل ) عمران : 81 (

II
Dedication
To my mother:
for her kindness, patience , and always been a
great source of motivation ,and , inspiration.
To my father:
for his kindness, and his valuable guidance and
advices, which helped me to reach better and high
level of education.
To my family members:
who supported me all the way since the
beginning of my studies. Without your care and
encouragement, this would not be possible. Finally,
I dedicate this work to my friends Amal Musa for
her encouragement, and cooperation. and to,Fars,
and Emad, and ribat university students Alhars,
Ganta, Amar, Mohmed, Nayla, Abd alla.

III
Acknowledgements
Many thanks to Allah, the Beneficial, the Merciful without Him none of this work
would have been carried out.
My greatest appreciation is to my thesis advisor, Dr. Nadia A bdel Rahim
Khogli. Your expertise, encouragement, motivation, and support were received from
our first encounter brainstorming ideas to the end of the thesis defense.
My gratitude for Dr. Osama Mohmed. Elsnousi for his debates about
choosing the study.
And 1 wish to thanks to all staff and students in Sudanese Police and Law College
they gave me the chance to do this study.
I would like to thanks my friend Amal Mousa for encouragement
throughout the production of this thesis, & also thanks Sohair Amin , Amal Abdlla ,
and Bader Anor.
Our appreciation and thanks are extended to the students of Ribat
University, for the valuable information they provided for our research.

IV
Abstract
This was a cross-sectional descriptive study conducted among the National Ribat
University students from the Police and Law College and civilian students from
different colleges at the main campus. The aim was to assess their nutritional status
and identify factors that affect it.
Data was collected by using a questionnaire that included demographic data,
anthropometric measurements [weight, height, waist-hip ratio (WHR), body fat
percentage (BFP)] and food intake [24 hours recall, and food frequency questionnaire]
. The sample included 100 students, 50 civilian (CS) and 50 police (PS). Their
average age was 21 years mostly from middle income families [CS 46.0%, PS
66.0%], more CS from high income families [CS 26.0%, PS 0.0%] but less from low
income one [14.0% vs 20.0%].
The majority had normal body weight [CS 64.0%, PS 76.0%] but underweight was
more among CS [14.0% vs 6.0%] and also excess body weight [22.0% vs 18.0%].
Difference between BMI and age was only significant (P<0.05) among the CS.
Underweight cases among CS included 57.1% from low income families and 23.0%
from high income ones compared with 20.0% from low income ones among PS.
WHR showed 68.0% of CS and 84.0% of PS were healthy the rest had different levels
of risks that was always higher among CS than PS. Similarly BFP showed 62.0% of
CS and 84.0% of PS had healthy status, the rest had excess boy fat (>24%). The
correlation between BMI, WHR and BFP was significant (P<0.05) among both CS
and PS.
All PS took 3 meals/day but only 50.0% of the CS including 85.7% of the
underweight and 100% of obese-II. CS who took 2 meals/day included 75.0% of
obese-I. Among the CS there was a significant difference (P<0.05) between BMI and
meals/day. All the students had similar dietary habits except PS took more legumes
and fruits while CS more milk. CP took soft drinks, fast foods and ice-cream but most
PS did not (54-84%).
Energy intake (kcal/day) was higher by PS than CS [2129±370 vs 1901± 796].
Physical activity among PS included 2 sessions/day for >hours/session compared with
<1 session/day for <2 hours/session.
Appropriate recommendations were suggest to improve the nutritional status
especially of CS.

V
الخلصة
غالة ميخ اىششغخأخشذ هز اىذساعخ اىىصفخ اىقطؼخ ث غالة خبؼخ اىشثبغ اىىغ
واىقبى اىنيبد اىخزيفخ ف اىحش اىدبؼ اىشئغ , ف اىغىدا. ف اىفزشح , واىطالة اىذ
اىزغزوي ىيطالة , ورض 2014 ىىى اى ىفجش ومب اىغشض األعبع ىهز اىذساعخ هى اىزق
و اىز رؤثش ػي اىحبىخ اىزغزوخ. اىؼىا
ر خغ اىجببد ىهز اىذساعخ ثبعزخذا اىقبظ اىدغخ )اىطىه , اىىص , غجخ حػ اىىسك واىخصش
ذ خغ اىجببد أألعبعخ ,اعزخذا اعزبسح و مزيخ اىذهى ف اىدغ(, واالعزجببد اىز رع
اىغزاء. رنشاس اعزبسح اب , و 3عبػخ ىذح 24 اعزشخبع
شبسمخ ف اىذساعخ اىطالة اىز وافقىا ػي اى ميخ ششغخ 50غبىت , 100أخزد اىؼبد ,
اىذ. 50و
% 46عخ , و زىعػ اىذخو اىشهشي ىؼظ االعش ) 21 اىزبئح ا زىعػ ػش اىطالة أظحذ
ىيطيجخ اىذ حعشىالوغيجخ اىششغخ(, وامثش غزىي اىذخو اىشهشي اىؼبى %66اىطيجخ اىذ, و
%(10% ثبىقبثو, 14) % وغيجخ اىششغخ(, وىن هزا اقو ىيذخو االد10% اىطيجخ اىذ, 26)
وىن اىىص ,64%) , اىطيجخ اىذ و 76% غيجخ اىششغخ (ؼظ اىطالة ؼذه اوصاه غجؼخ
% 22(,و أعب اىىص اىضائذ )6% قبثو 14%اىطجؼ مب أمثش ث اىطيجخ اىذ )أقو
هبك إخزالف ؼزجش18قبثو ث ؤشش مزيخ اىدغ واىؼشفقػ ث اىطيجخ (P<0.05)%(. مب
ذ اى 57.1اىذ. اىحبالد األقو اىىص اىطجؼ ث اىطيجخ اىذ رع ذخو االد %
غ 23.0و قبسخ اىذخو اىؼبى اىذخو االد ث غيجخ اىششغخ. %20.0 %
%(, اصحبء اب 68%, واىطالة اىذ 84ثقبظ غجخ حػ اىىسك واىخصش,) غالة اىششغخ
اىزؼشض ىألخطبس اىز مبذ أػي دائ ىذه غزىبد خزيفخ ب ث اىطيجخ اىذ, ثفظ اىجقخ مب
% غيجخ اىششغخ مبذ غجؼخ , 84.0% اىطيجخ اىذ و 62.0اىطشقخ غجخ مزيخ اىذهى ف اىدغ
ث ؤشش مزيخ اىدغ , غجخ حػ اىىسك و (P<0.05)%(. اإلسرجبغ ؼزجش 24اىجقخ مب صائذح )<
.يجخ اىششغخ و اىذاىخصش, و غجخ مزيخ اىذهى ف اىدغ,ث اىط
85.7% فقػ اىطيجخ اىذ ثع رىل 50.0وخجبد غؼب / ى , و 3مو غيجخ اىششغخ خزو
100% اىىص أقو اىطجؼ و % اىىص اىضائذ اىذسخخ اىثبخ. اىطيجخ اىذ اىز خزو
إخزالف ؼزجش a االوى. مب هبك% اىىص اىضائذ اىذسخخ 75.0وخجزب / ى رع
(P<0.05) ػبداد غزائخ بثيخ ذه ػ ث ؤشش مزيخ اىدغ وخجبد غؼب / ى. مو اىطالة مب
بػذا غيجخ اىششغخ خزو اىجقىىبد واىفبمهخ األمثش ثب اىطيجخ اىذ حيت أمثش. أخز اىطيجخ اىذ
.%84-54)واألغؼخ خبهضح واظ مش ىن أمثش غيجخ اىششغخ خزو)اىششوثبد اىالمحىىخ
اىطيجخ اىذ / )عؼش حشاسي اىزبوىخ مخ غبقخ قجو غيجخ اىششغخ ى( مبذ أػي
(796 ±1901 , ثبىقبثو 2129±370)
خيغز / ى ه< عبػبد / غ >خيغخ اىشبغ اىطجؼ ث غيجخ اىششغخ رع / ى 1خيغخ قبسب
.ه>عبػزب / خيغخ
.رحغ اىضىخ اىغزخ خصىصب اىطيجخ اىذ اىزىصبد اىالئخ مبذ رقزشذ
VI
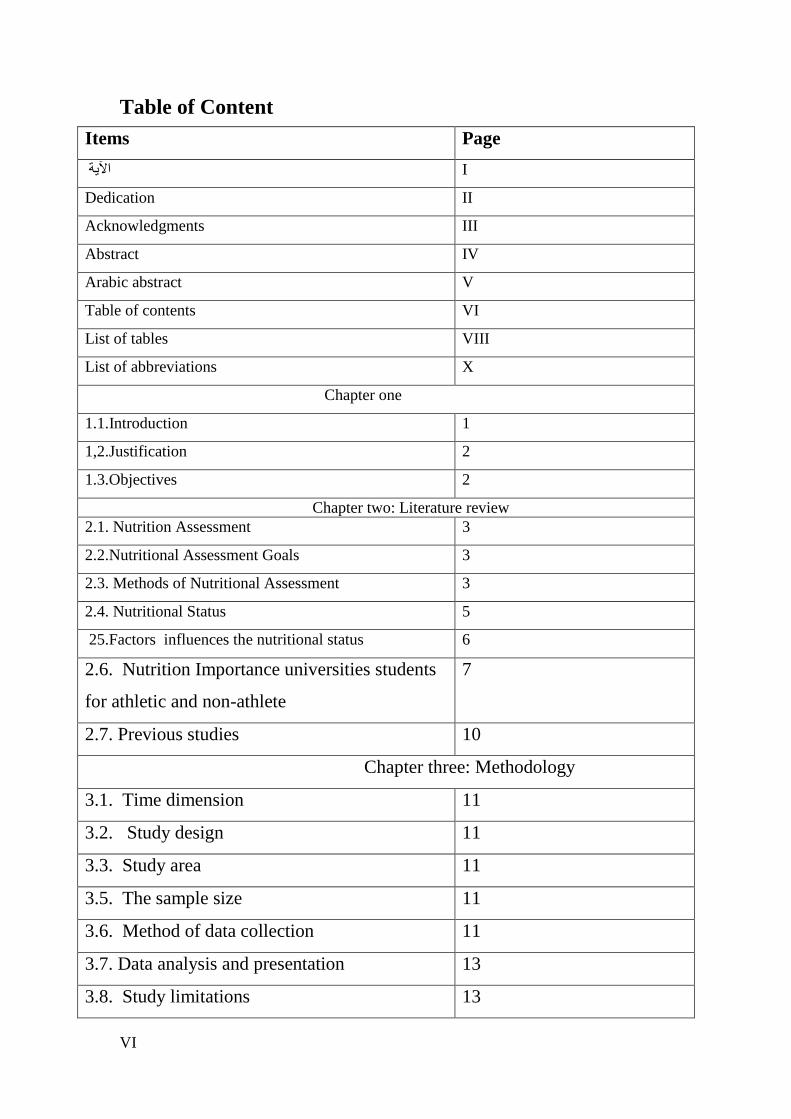
Table of Content
Items Page
I اخ
Dedication II
Acknowledgments III
Abstract IV
Arabic abstract V
Table of contents VI
List of tables VIII
List of abbreviations X
Chapter one
1.1.Introduction 1
1,2.Justification 2
1.3.Objectives 2
Chapter two: Literature review
2.1. Nutrition Assessment 3
2.2.Nutritional Assessment Goals 3
2.3. Methods of Nutritional Assessment 3
2.4. Nutritional Status 5
25.Factors influences the nutritional status 6
2.6. Nutrition Importance universities students
for athletic and non-athlete
7
2.7. Previous studies 10
Chapter three: Methodology
3.1. Time dimension 11
3.2. Study design 11
3.3. Study area 11
3.5. The sample size 11
3.6. Method of data collection 11
3.7. Data analysis and presentation 13
3.8. Study limitations 13

VII
3.9. Study ethics 13
Chapter four: Result
4. Results 14
Chapter five: Discussion
5. Discussion 27
Chapter six: Conclusion and recommendations
6.1Conclusion 30
6.2 Recommendations 31
List of references 32
Appendices
VIII
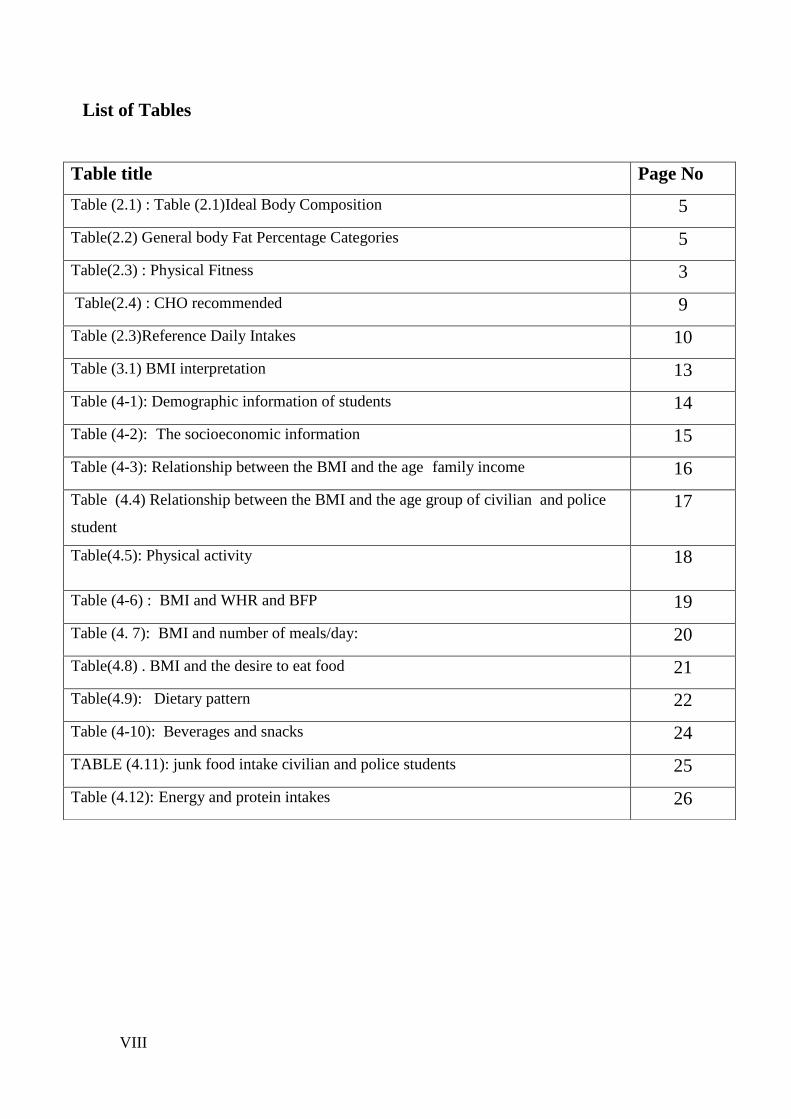
Page No Table title
5 Table (2.1) : Table (2.1)Ideal Body Composition
5 Table(2.2) General body Fat Percentage Categories
3 Table(2.3) : Physical Fitness
9 Table(2.4) : CHO recommended
10 Table (2.3)Reference Daily Intakes
13 Table (3.1) BMI interpretation
14 Table (4-1): Demographic information of students
15 Table (4-2): The socioeconomic information
16 Table (4-3): Relationship between the BMI and the age family income
17 Table (4.4) Relationship between the BMI and the age group of civilian and police
student
18 Table(4.5): Physical activity
19 Table (4-6) : BMI and WHR and BFP
20 Table (4. 7): BMI and number of meals/day:
21 Table(4.8) . BMI and the desire to eat food
22 Table(4.9): Dietary pattern
24 Table (4-10): Beverages and snacks
25 TABLE (4.11): junk food intake civilian and police students
26 Table (4.12): Energy and protein intakes
List of Tables

IX
List of Abbreviation
BMI: Body Mass Index.
BFP: Body Fat Percentage
DRls: Dietary Reference Intakes
LBM: Lean Body Mass
RDA : Recommended Dietary Allowance
WHO: World Health Organization
WHR: Waist-Hip Ratio
PS: police students
CS: civilian students

10
Chapter one
1.Introduction
1.1Introduction
Individuals are categorized as having optimal nutritional status or being undernourished, over
nourished. It is important to realize that many other lifestyle and environmental factors, in
addition to nutrition, influence health and well-being, but nutrition is a major, modifiable, and
powerful factor in promoting health, preventing and treating disease, and improving quality of
life.(Gibney et al, 2009).It involves understanding which nutrients are needed, where to find
them in food, how they are used bythe bodies, and the impact they have on the health. It also has
to consider the other factors, such as society, culture, economics, and technology, which are
involved in obtaining and choosing the foods we eat(Smolin and Grosvenor, 2009).
The health and wellbeing of young people not only affects their immediate quality of life and
productivity but also shapes the future health of the whole population (Eckersley, 2008).
University life is a challenging period for students who have to leave their familiar surroundings
and settle in a new environment. The unfamiliar environment may have an impact on their
personality, attitudes and behavior, and admission provides the adoption of new behaviors,
which can affect the health of students (Lokadhia, 2013).Students living in university hostels are
a distinct group of university students .They have particular characteristics, can inhibit unhealthy
behavior that do not contribute positively to the development of a healthy lifestyle (Abolfotouh
et al, 2007)
University students represent an attractive study population in this regard because they are
relatively young and also present a higher level of education than the general population of the
same age. This characteristic may be a particularly relevant factor because reports indicate that
these individuals have better nutritional habits due to more education (Irazustaa et al, 2007).The
study of university students is significant because a healthy body is able to maintain a healthy
mind (Lokadhia, 2013).
The current study aims to assess the nutritional status of Ribat University civilian and police
male students, through nutrition profile assessment, and to recommend a practical dietary pattern
for the above students. The civilian student’s campus is located in Burri and the police students
11
in Soba living in a hostel (14 Km from Khartoum) with activity exercises, and they have
academic programs like the civilian students
1.2. Justification:
Most studies on university students assessed both males and females or females only. Few
studies were carried out on male university students that identify risks of chronic diseases which
is important because males develop heart disease at a younger age than females, and prostate
cancer (Mahan, and Escott- Stump, 2008). In general, universities students in any country is the
future of that nation hence they can play a major role in development and the assessment of their
nutritional status to improve their health and well being also enhance their educational
performance.
1.3. Objectives:
1.3.1. General objectives:
To assess the nutrition status of civilian and police male students of Ribate University aged 19 –
24year.
1.3.2. Specific objectives:
-To determine anthropometric measurements; weight and height, and calculate BMI; WHR; body
composition and dietary intake.
-To find out various factors that affect the nutritional status of the students.

12
Chapter Two
2.Literature Review
2.1 Nutrition Assessment:
Is the system of determining conditions of nutritional health of a person, or a group of persons.
And more comprehensive to provide data to determining nutritional status (Mahan, and Escott-
Stump 2008).Nutritional status assessments of individuals make use of measurable criteria.
These criteria reflect physical, physiological and biochemical changes as a result of inadequate
food intake quality and quantity and diseases. Nutritional status can be accessed through body
measurements anthropometrics (EC and FAO, 2009).
2.2 Nutritional Assessment Goals:
The goals of nutrition assessments are to:
- Improve the health of the people in a defined area by building the capacity of local health
- Reduce nutritional risk and promote optimal nutritional health of community members
- Promote physical activity, food-related behaviors, and food intake, such as consumption of
fruits and vegetables (Spark, 2007)
2.3 Methods of Nutritional Assessment:
Most of the information important to the nutritional assessment of the individual will be obtained
by careful evaluation of some major areas namely.
- Anthropometric measurements.
- Biochemical data.
- Clinical or physical signs.
- Dietary/nutrient data (Vimala, 2009)
2.3.1 Anthropometric Measurements:
The term ‘anthropometric’ refers to comparative measurements of the body (Katsilambroset all,
2010). Anthropometric measurements of size, weight, and proportion of human body
(Grosvenor, 2000) are useful tools for evaluating over nutrition or under nutrition. Assessment of
weight and health risks involve height, weight, fat percentage, waist-hip ratio, and others
(Mahan and Escott-Stump, 2008; Katsilambroset all, 2010).
2.3.2 Body Weight Indicator of Health:
Recognition of body weight as an indicator of health status is probably universal and is as old as
13
humanity itself. In fact , in 1846 the English surgeon John Hutchison published a height –
weight table based on a sample of 30 men which he believed to be valuable in promoting
health, and detecting disease (Sareenet all, 2008)
2.3.3 Body Mass Index (BMI):
Body mass index (BMI), first described in the 1860s by Adolphe Quetelet is defined as the
individual's body mass divided by the square of his/her height – with the value universally being
given in units of kg/m2. The Quetelet’s Index is at present one of most accepted indicator to
assess appropriate weight for a given height (Sareenet all. 2008).
BMI is calculated as follows: BMI = weight (kg) / height (m2)
Limitation of BMI in Assessing Nutritional Status:-
BMI may not be an accurate tool for assessing weight status at an individual level, and other
ways of measuring body composition may be more useful and accurate. BMI does not provide
any indication of the distribution of body fat and does not fully adjust for the effects of height or
body shape, which may be particularly important when comparing figures across ethnic groups
(National Obesity Observatory, 2009). This is the major limitation of BMI in assessing
nutritional status that it does not differentiate lean body mass from fat (Pivarnik et al, 2007), and
determine body fatness of those people such as athletes who have a very limited level of body fat
and cannot be classified as overweight or obese like other adults (Katsilambroset all, 2010) and
real ethnic groups (Sareenet all, 2008). BMI is usually used in combination with waist-hip ratio
(WHR) and other body composition measurements to get an accurate assessment (Daniels,
2009).
2.3.4 Waist-Hip Ratio (WHR):
Waist/hip ratio is a useful tool for nutritional assessment, the area of waist and hip, can be used
in order to estimate the distribution ofbody fat and the danger of the development of certain
diseases related to the central distribution of fat.(Katsilambroset all, 2010). Healthy levels of the
waist/hip ratio for men of 0.9 has been shown to correlate strongly with a general status of
healthy, while values of over 1.0 are indicative of the presence of central obesity and increased
risk above 0.95 for men indicate a heightened risk (Katsilambroset all, 2010).
14
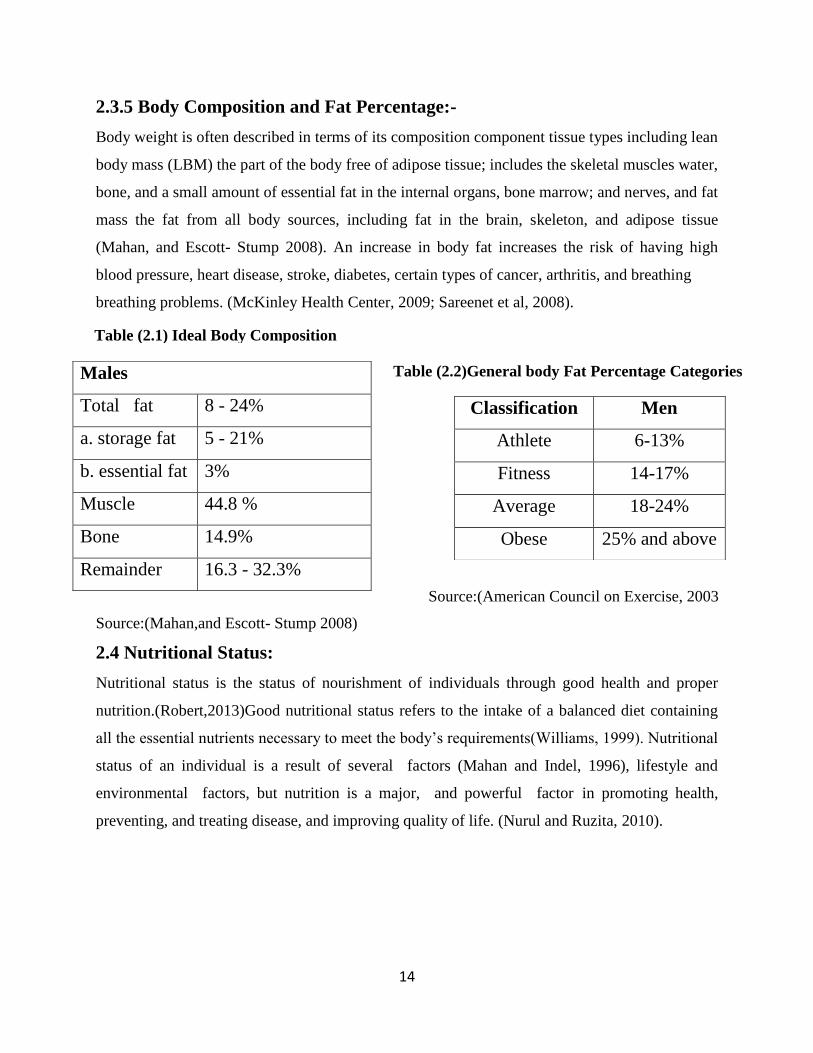
2.3.5 Body Composition and Fat Percentage:-
Body weight is often described in terms of its composition component tissue types including lean
body mass (LBM) the part of the body free of adipose tissue; includes the skeletal muscles water,
bone, and a small amount of essential fat in the internal organs, bone marrow; and nerves, and fat
mass the fat from all body sources, including fat in the brain, skeleton, and adipose tissue
(Mahan, and Escott- Stump 2008). An increase in body fat increases the risk of having high
blood pressure, heart disease, stroke, diabetes, certain types of cancer, arthritis, and breathing
breathing problems. (McKinley Health Center, 2009; Sareenet et al, 2008).
.
Source:(Mahan,and Escott- Stump 2008)
2.4 Nutritional Status: Nutritional status is the status of nourishment of individuals through good health and proper
nutrition.(Robert,2013)Good nutritional status refers to the intake of a balanced diet containing
all the essential nutrients necessary to meet the body’s requirements(Williams, 1999). Nutritional
status of an individual is a result of several factors (Mahan and Indel, 1996), lifestyle and
environmental factors, but nutrition is a major, and powerful factor in promoting health,
preventing, and treating disease, and improving quality of life. (Nurul and Ruzita, 2010).
Males
Total fat 8 - 24%
a. storage fat 5 - 21%
b. essential fat 3%
Muscle 44.8 %
Bone 14.9%
Remainder 16.3 - 32.3%
Classification Men
Athlete 6-13%
Fitness 14-17%
Average 18-24%
Obese 25% and above
Source:(American Council on Exercise, 2003
Table (2.2)General body Fat Percentage Categories
Table (2.1) Ideal Body Composition
15
2.5 Factors That influence the Nutritional Status:-
2.5.1Socioeconomic status influences:
Nutrition status may also be affected by inadequate sanitary environmental condition, large
family size, increase in population density,(Goma, 2006)household access to food supplies, use
of health services, availability of improved water sources (Guma, 2000), education, residence.
Food has personal meaning and relationships to personal needs (William and Sue, 2013).
2.5.2 Income Level:
Few major differences have been found between household income and food sufficiency status
(Amos, 2012).The problems of middle- income families differ in relative terms, but it isthe low-
income families, especially those in poverty situations that suffer extreme needs (William and
Sue, 2013).Income influences the variety of food from which people can choose and also the
amountof food that may be purchased from each of the food groups (Park, 1997).
2.5.3 Food Price:
Instability of food price is a critical problem affecting food security and hunger in developing
countries (George et all, 2013). Generally, people with limited income depend on lower cost
foods i.e. the bread from the cereal group to supply much of their classic nutrient need (Park et
all, 1997).
2.5.4 Food Habits and Social Behavior:
People need food because it keeps them healthy and offer enjoyment; the same foods are
delicacies for others. Some foods are categorized as being suitable for a given age group or as
more suitable for one sex than the other. Behavior occurs due to affect of individual and this
affect makes giving up he or she change. The costs of adopting new behaviors, counselors must
help client to change negative behavior to positive attitude, and partners impact of one s culture
on behavior has adverse consequences for efforts directly at individual and social change (Food
habit. 2013; Mahan and Escott- Stump, 2008; Pen, 1990). .
2.5.5 Food Choices:
People decide what to eat, when to eat, and even whether to eat in highly personal ways, often
based on behavioral or social motives rather than on an awareness of nutrition' s importance to
health. Many different food choices can support good health, and an understanding of nutrition
helps you make sensible selections more often (Rolfeset all, 2008).
16
.5.6 Physical Activity:
The World Health Organization (WHO) defined health in its constitution as "a state of complete
physical, mental, and social well-being and not merely the absence of disease or infirmity"
Fitness is the state or conditions of being healthy, or good health and condition as a result of
exercise, and nutrition balance.Nutrition and fitness are closely interrelated factors to body
composition, muscular endurance, and strength, respiratory and cardiovascular capacity
(Sareenet all, 2008). Physical activity in youth is a health promotion and a disease-prevention
strategy. (William et all, 2005).
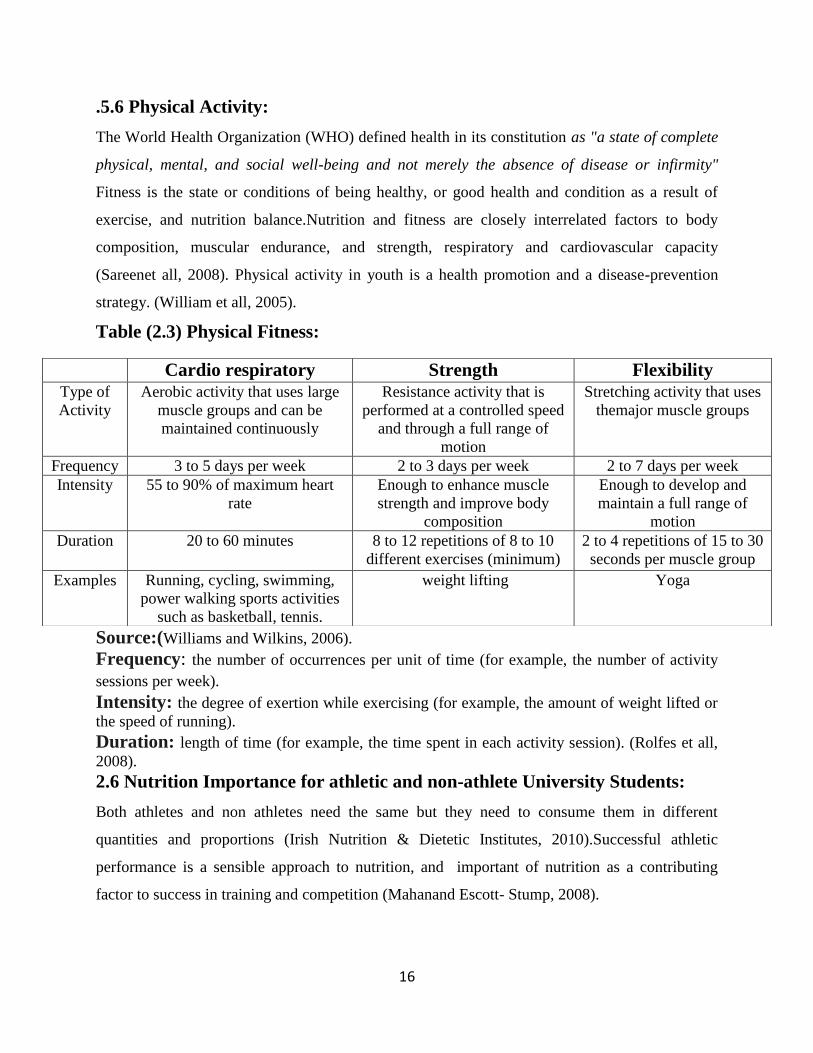
Table (2.3) Physical Fitness:
Source:(Williams and Wilkins, 2006). .),
Frequency: the number of occurrences per unit of time (for example, the number of activity
sessions per week). ..
Intensity: the degree of exertion while exercising (for example, the amount of weight lifted or
the speed of running).
Duration: length of time (for example, the time spent in each activity session). (Rolfes et all,
2008).
2.6 Nutrition Importance for athletic and non-athlete University Students:
Both athletes and non athletes need the same but they need to consume them in different
quantities and proportions (Irish Nutrition & Dietetic Institutes, 2010).Successful athletic
performance is a sensible approach to nutrition, and important of nutrition as a contributing
factor to success in training and competition (Mahanand Escott- Stump, 2008).
Cardio respiratory Strength Flexibility Type of
Activity
Aerobic activity that uses large
muscle groups and can be
maintained continuously
Resistance activity that is
performed at a controlled speed
and through a full range of
motion
Stretching activity that uses
themajor muscle groups
Frequency 3 to 5 days per week 2 to 3 days per week 2 to 7 days per week
Intensity 55 to 90% of maximum heart
rate
Enough to enhance muscle
strength and improve body
composition
Enough to develop and
maintain a full range of
motion
Duration 20 to 60 minutes 8 to 12 repetitions of 8 to 10
different exercises (minimum)
2 to 4 repetitions of 15 to 30
seconds per muscle group
Examples Running, cycling, swimming,
power walking sports activities
such as basketball, tennis.
weight lifting Yoga
17
2.6.1Energy:
Energy is the primary need of the body and takes precedence over all other needs (Mudambi and
Rajagopl ,2007).The most important component of successful sport training and performance is
to ensureadequate calorie intake to support energy expenditure and maintain strength, endurance,
muscle mass and overall health. Individuals who participate in an overall fitness program (i.e., 30
to 40 min/day, three times per week) can generally meet their daily nutritional needs by
following a normal diet providing 25 to35 kcal kg/day or roughly 1800 to 2400 calories a day.
However the 50-kg athlete engaging in more intense training of 2 to 3 hours/day five to six times
a week or high-volume training of 3 to 6 hours in one to two workouts per day 5 to 6 days a
week may expend up to an additional 600 to 1200 calories a day, thus requiring 50 to 80 kcal
kg/day or roughly 2500 to 4000 kcal day. For elite athletes or heavier athletes, daily calorie
needs can reach 150 to 200 kcal./kg, or roughly 7,500 to 10,000 calories a day, depending on the
volume and intensity of different training phases. (Mahan and Escott- Stump, 2008)
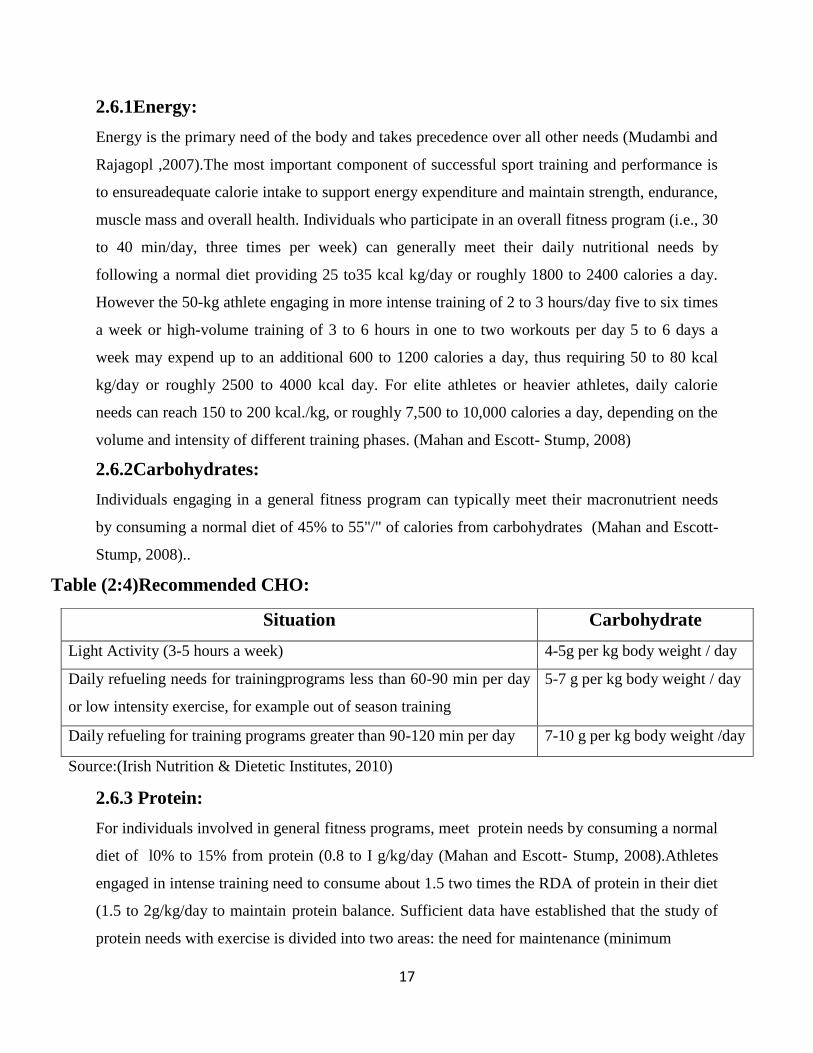
2.6.2Carbohydrates:
Individuals engaging in a general fitness program can typically meet their macronutrient needs
by consuming a normal diet of 45% to 55"/" of calories from carbohydrates (Mahan and Escott-
Stump, 2008)..
2.6.3 Protein:
For individuals involved in general fitness programs, meet protein needs by consuming a normal
diet of l0% to 15% from protein (0.8 to I g/kg/day (Mahan and Escott- Stump, 2008).Athletes
engaged in intense training need to consume about 1.5 two times the RDA of protein in their diet
(1.5 to 2g/kg/day to maintain protein balance. Sufficient data have established that the study of
protein needs with exercise is divided into two areas: the need for maintenance (minimum
Situation Carbohydrate Light Activity (3-5 hours a week) 4-5g per kg body weight / day
Daily refueling needs for trainingprograms less than 60-90 min per day
or low intensity exercise, for example out of season training
5-7 g per kg body weight / day
Daily refueling for training programs greater than 90-120 min per day 7-10 g per kg body weight /day
Source:(Irish Nutrition & Dietetic Institutes, 2010)
Table (2:4)Recommended CHO:.
18
protein required to accomplish nitrogen equilibrium), and the need for increasing lean tissue
(positive nitrogen balance),for bodybuilders or persons interested in increasing body
mass,(Mahan and Escott-Stump, 2008). .
2.6.4Fat:-Fat is the most concentrated source of food energy and supplies more than twice as
many calories Fat provides essential fatty acids that are necessary for cell membranes, skin,
hormones, and transport of fat-soluble vitamins. A general fitness program can typically meet the
needs by consuming a normal diet of 25 % to 35% from fat 0.5 to 1.5 g/kg/day of calories from
fat Small amounts of fat in diet are necessary. (Mahan and Escott- Stump, 2008).
.2.6.5 Vitamins and Minerals:.
Vitamins and minerals also are required in numerous reactions involved with exercise and
physical activity, including energy, carbohydrate, fat and protein metabolism, oxygen transfer
and delivery, and tissue repair (Wardla, 1999). The micronutrient requirements of athletes are
similar to healthy, fairly active individuals. The need of adequate vitamins and minerals in active
individuals for exercise(Mahan and Escott- Stump, 2008).Several micronutrients are of concern
in athletes, however (Mahan et all, 2012). . .
-B Vitamin: Increased energy metabolism creates a need for more of the B vitamins that serve
as part of coenzymes involved in the energy cycles (Mahan et all, 2012)...
-Folic acid: Folic acid is important of red blood cell synthesis (Mahan and Escott- Stump,
2008).
-Antioxidants vitamins A, Ascorbic acid, and tocopherol: .
Antioxidants have potential to enhance exercise performance or to prevent exercise-induced
muscle tissue damage. Cells continuously produce free radicals as a part of metabolic process.
Oxidative stress has been shown to increase the oxidative processes in the muscle during
exercise, leading to increased generation of free radicals. Free radicals are neutralized by
antioxidant defense systems that play an important role in protecting the cell membrane from
oxidative damage. Antioxidant nutrients may have a role in enhancing recovery from exercise
and maintaining optimal immune response (Mahan et all, 2012). ..
Iron: Has one of the most critical implications for sport performance. As a component of
hemoglobin, it is instrumental in transporting oxygen from the lungs to the tissue. Iron is also
a vital component of the cytochrome enzymes involved in the production of ATP. Thus it

19
follows that iron –deficiency anemia limits aerobic endurance and capacity for work. Even
partial depletion of iron stores have harmful effect on exercise performance, even when anemia
is not present. (Mahan et all, 2012)..
Table (2.3) Reference Daily Intakes
Micronutrient Amount vitamin A 5000 IU
Vitamin C 60 mg
Thiamin 1.5 mg
Roboflavin 1.7 mg
Niacin 20 mg
Calcium 1g
Iron 18 mg
vitamin D 4OOIU
vitamin E 30 IU
vitamin B6 2mg
Folic acid 0.4
Vitamin B12 6 mcg
Phosphorus l g
Iodine 150 mcg
Magnesium 400 mg
Zinc 15 mg
Copper 2mg
Biotin 0.3 mg
Pantothenic acid 10 mg
Selenium 70 mcg
Source: (Mahan et all, 2012).
2.7. Previous studies:
-In Sudan there are limited studies on the assessment of the nutritional status of university
students. The first study was by Abuzaid in 1996 for the first-year students of the University of
Khartoum living in hostels who found that the energy intake by both male and female students
was lower than the WHO recommendation (Guma, 2004).
-Shawgi (2011) reported on food intake and nutritional status of police students in The National
Ribat University, Police and Law College. Energy intake was 2226.8kcal/day, carbohydrates
(386.8g), fat (43.71g), and BMI (22.77kg/m2).
20
Chapter Three
3.Subjects and Methods
3.1 Study design:
Descriptive cross-sectional study was used to assess the nutritional status of the university
students. The study was undertaken between July and November 2014.
3.2 Study Area:
The current study was conducted at the National Ribat University, Police and Law College, in
Soba, and the Civilian Campus, in Burri, Khartoum.
3.3 Study Population:
Students selected to assess the nutritional status were civilian and police male students aged 19 –
24 years.
Excluded students were those with pace makers or any cardiac disease as these cannot use the
Millenium II scale (Appendix 4) for body fat measurements.
3.4 Sample size:
A sample of 100 students 50 students’ civilian and 50 student’s police consented to participate in
the study.
3.5 Data collection:
3.5.1 Primary data collection:
The first part of the primary data collection was within the National Ribat University Hospital
where the Millenium II scale is located.
3.5.1.1 Anthropometric measurement:
The measurements were used to calculate the nutritional indices namely BMI, fat percentage of
body composition and waist-hip ratio, were done on students from various faculties.
3.5.1.2Measuring weight, height, fat Percentage of the students:
Millennium ll scale (appendix 4), was used to obtain weight, height, and fat percentage. Students
were measured without shoes following standard procedures with the body firmly stretched.

21
3.5.1.3 Procedure of BMI calculation:
The BMI was calculated according to the following formula:
BMI = wt in kg / (ht in m) 2
Wt = weight in kilograms
Ht= height in meters
Table (3.1) BMI interpretation:
Category BMI range-
(kg/m2)
Underweight <18.5
Normal From 18.5 to 24,9
Overweight From 25 to 29.9
Obesity class I From 30 to 34.9
Obesity class II From 35 to 39.9
Obesity class III ≥ 40
Source: BMI classification (WHO, 2014).
3.5.1.4 Procedure for measuring of (WHR):-
A non-stretching measuring tape was used to measure the waist and hip circumferences. The
waist circumference was measured at the site just above the umbilicus and hip circumference at
the widest part of the hip. Measurements were conducted according to WHO recommended
standards.
3.5.1.2 Questionnaires:
The second part of the primary data designed to be filled by the researchers (appendix1), was
collected from the students using a questionnaire that included questions covering basic
information about the students’ socioeconomic status as well as information about their dietary
patterns using 24-hr recall,
The food intake was recorded in household measures, converted to weight and these to nutrients
using food composition tables (McCance and Widdowsons, 2000; Boutros, 1986), Results were
compared with recommended dietary allowance (RDA).

22
Dietary practices, information about major food items were obtained by food frequency method
in term of number of consumption per week. Information about fast food intake was also
recorded.
3.5.2 Secondary data:
The secondary data was collected from different books, related studies and the internet.
3.6 Study limitations:
-The measuring scale was heavy (weight 90 kg) and difficult to carry around the areas of work
and need location and environment which are essential for it to function correctly.
-Distance and time limitations to transport police students from soba to brri without disturbing
their college program,
3.7 Ethics consent: .
Ethical consent was obtained prior to the start of the study. Students were assured that they had
the right to withdraw from the study at any time. They were further assured that all the
information dealt with in high privacy and confidentiality.
3.8 Data analysis
The data collected were analyzed using Statistical Packages for Social Sciences (SPSS) version
15.0. Results were then presented in tables and charts, with p<0.05 as level significant.
23
Chapter Four
4.Results
Equal number of civilian students (CS) and police students (PS) were included in this study.
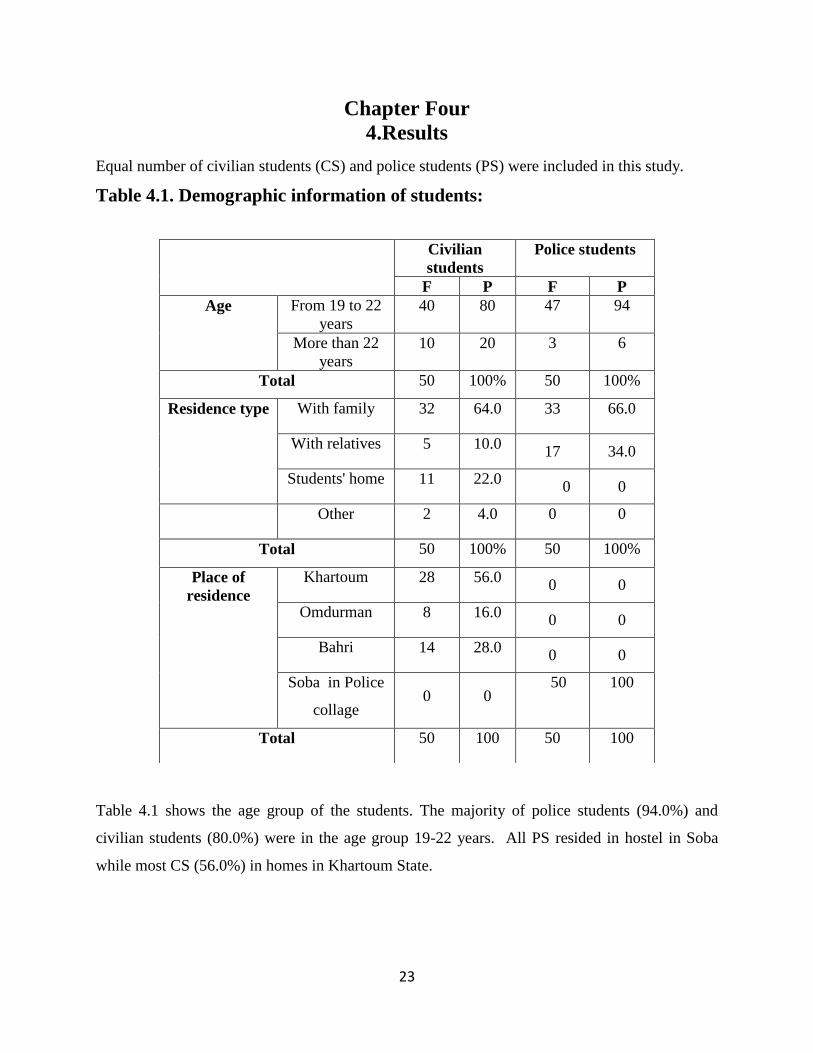
Table 4.1. Demographic information of students:
Table 4.1 shows the age group of the students. The majority of police students (94.0%) and
civilian students (80.0%) were in the age group 19-22 years. All PS resided in hostel in Soba
while most CS (56.0%) in homes in Khartoum State.
Civilian
students
Police students
F P F P
Age From 19 to 22
years
40 80 47 94
More than 22
years
10 20 3 6
Total 50 100% 50 100%
Residence type With family 32 64.0 33 66.0
With relatives 5 10.0 17 34.0
Students' home 11 22.0 0 0
Other 2 4.0 0 0
Total 50 100% 50 100%
Place of
residence
Khartoum 28 56.0 0 0
Omdurman 8 16.0 0 0
Bahri 14 28.0 0 0
Soba in Police
collage 0 0
50 100
Total 50 100 50 100
24
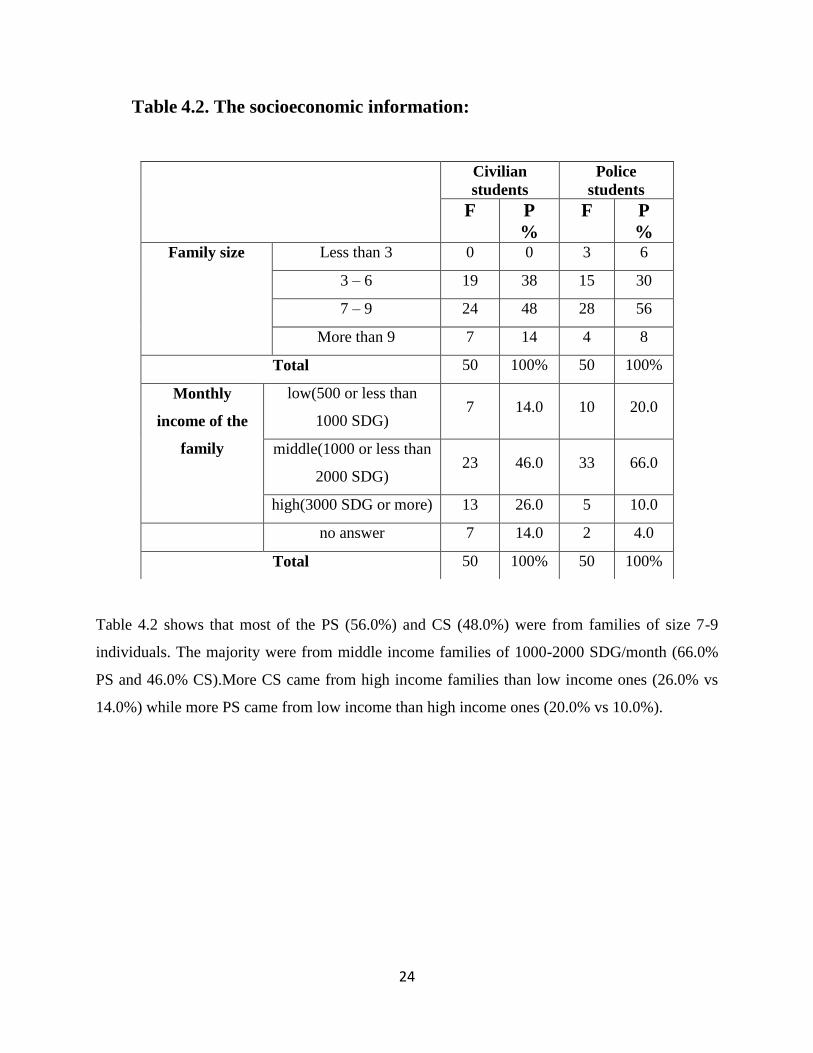
Table 4.2. The socioeconomic information:
Table 4.2 shows that most of the PS (56.0%) and CS (48.0%) were from families of size 7-9
individuals. The majority were from middle income families of 1000-2000 SDG/month (66.0%
PS and 46.0% CS).More CS came from high income families than low income ones (26.0% vs
14.0%) while more PS came from low income than high income ones (20.0% vs 10.0%).
Civilian
students Police
students
F P
%
F P
% Family size Less than 3 0 0 3 6
3 – 6 19 38 15 30
7 – 9 24 48 28 56
More than 9 7 14 4 8
Total 50 100% 50 100%
Monthly
income of the
family
low(500 or less than
1000 SDG) 7 14.0 10 20.0
middle(1000 or less than
2000 SDG) 23 46.0 33 66.0
high(3000 SDG or more) 13 26.0 5 10.0
no answer 7 14.0 2 4.0
Total 50 100% 50 100%
25
Table 4.3. The relationship between BMI and family income:
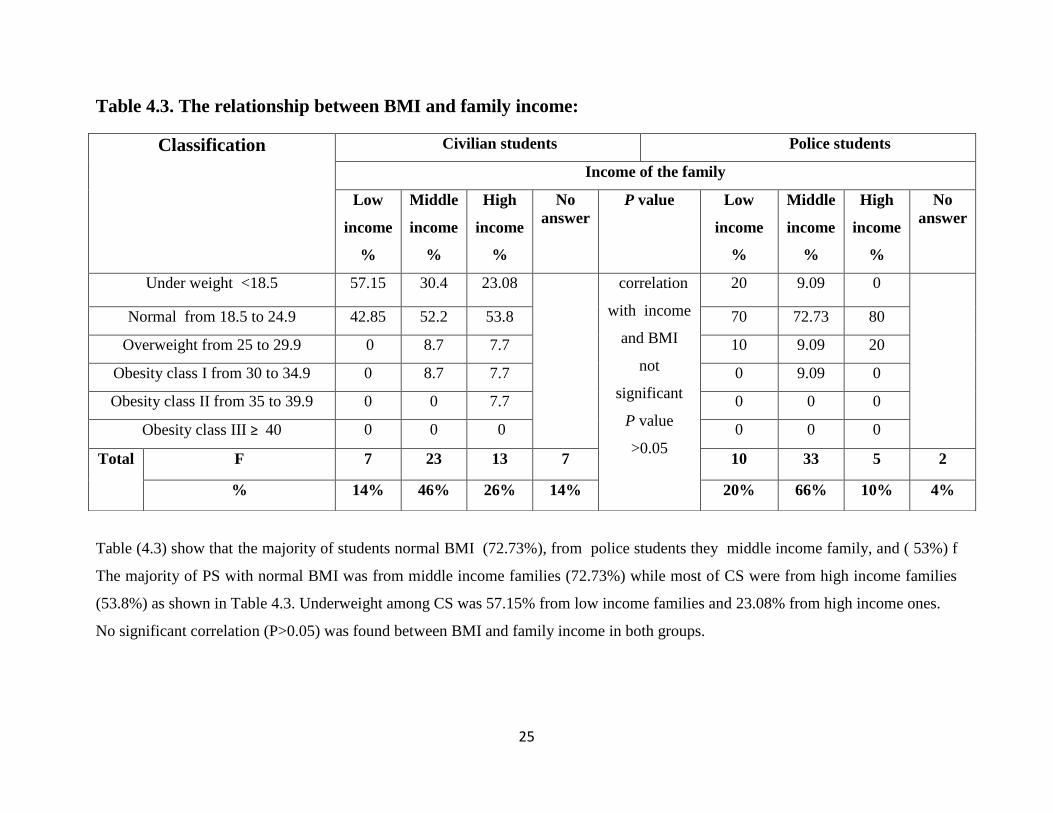
Table (4.3) show that the majority of students normal BMI (72.73%), from police students they middle income family, and ( 53%) f
The majority of PS with normal BMI was from middle income families (72.73%) while most of CS were from high income families
(53.8%) as shown in Table 4.3. Underweight among CS was 57.15% from low income families and 23.08% from high income ones.
No significant correlation (P>0.05) was found between BMI and family income in both groups.
Classification
Civilian students Police students
Income of the family
Low
income
%
Middle
income
%
High
income
%
No
answer
P value
Low
income
%
Middle
income
%
High
income
%
No
answer
Under weight <18.5 57.15 30.4 23.08 correlation
with income
and BMI
not
significant
P value
>0.05
20 9.09 0
Normal from 18.5 to 24.9 42.85 52.2 53.8 70 72.73 80
Overweight from 25 to 29.9 0 8.7 7.7 10 9.09 20
Obesity class I from 30 to 34.9 0 8.7 7.7 0 9.09 0
Obesity class II from 35 to 39.9 0 0 7.7 0 0 0
Obesity class III ≥ 40 0 0 0 0 0 0
Total
F 7 23 13 7 10 33 5 2
% 14% 46% 26% 14% 20% 66% 10% 4%
26
Table 4.4. The relationship between BMI and age groups of CS and PS:
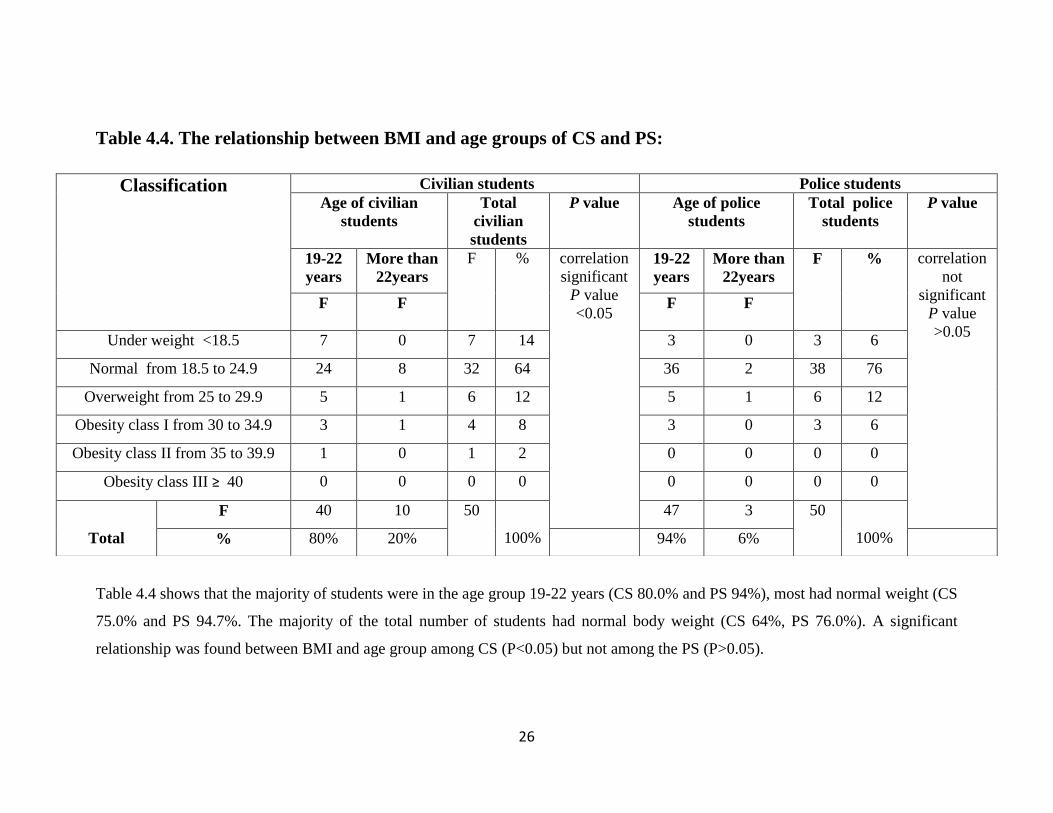
Table 4.4 shows that the majority of students were in the age group 19-22 years (CS 80.0% and PS 94%), most had normal weight (CS
75.0% and PS 94.7%. The majority of the total number of students had normal body weight (CS 64%, PS 76.0%). A significant
relationship was found between BMI and age group among CS (P<0.05) but not among the PS (P>0.05).
Classification
Civilian students Police students
Age of civilian
students
Total
civilian
students
P value Age of police
students
Total police
students
P value
19-22
years
More than
22years
F % correlation
significant
P value
<0.05
19-22
years
More than
22years
F % correlation
not
significant
P value
>0.05
F F F
F
Under weight <18.5 7 0 7 14 3 0 3 6
Normal from 18.5 to 24.9 24 8 32 64 36 2 38 76
Overweight from 25 to 29.9 5 1 6 12 5 1 6 12
Obesity class I from 30 to 34.9 3 1 4 8 3 0 3 6
Obesity class II from 35 to 39.9 1 0 1 2 0 0 0 0
Obesity class III ≥ 40 0 0 0 0 0 0 0 0
Total
F 40 10 50
100%
47 3 50
100% % 80% 20% 94% 6%

27
Table 4.5. Physical activity:
As shown in Table 4.5, all PS practiced sports e.g. football and high intensity interval training for
a duration of more than 2 hours, 2 sessions/day. 76.0% of CS practiced sports mainly football
(20.0%) for a duration of less than 2 hours (72.0%) for one session/day.
Civilian Students Police students
F % F %
Practicing
of sports
Yes 40 76 50 100
No 10 24 0 0
Total 50 100 50 100
Types of
sport
no exercise 30 48.0 0 0
Football 10 20.0 body building, running,
football, high-intensity
interval training,
increase short-term
muscle strength.
Running 1 2.0
Swimming 2 4.0
body building 3 6.0
Swedish sport 2 4.0
Walking 1 2.0
table tennis 1 2.0
football and
swimming 3 6.0
Total 50 100.0% 50 100.0%
Duration
of sport
Less than one hour 14 28.0 0 0
Less than two hours 22 44.0 0 0
Two hour – more 4 8.0 50 100.0
no exercise 11 22.0 0 0
Total 50 100.0 50 100.0
28
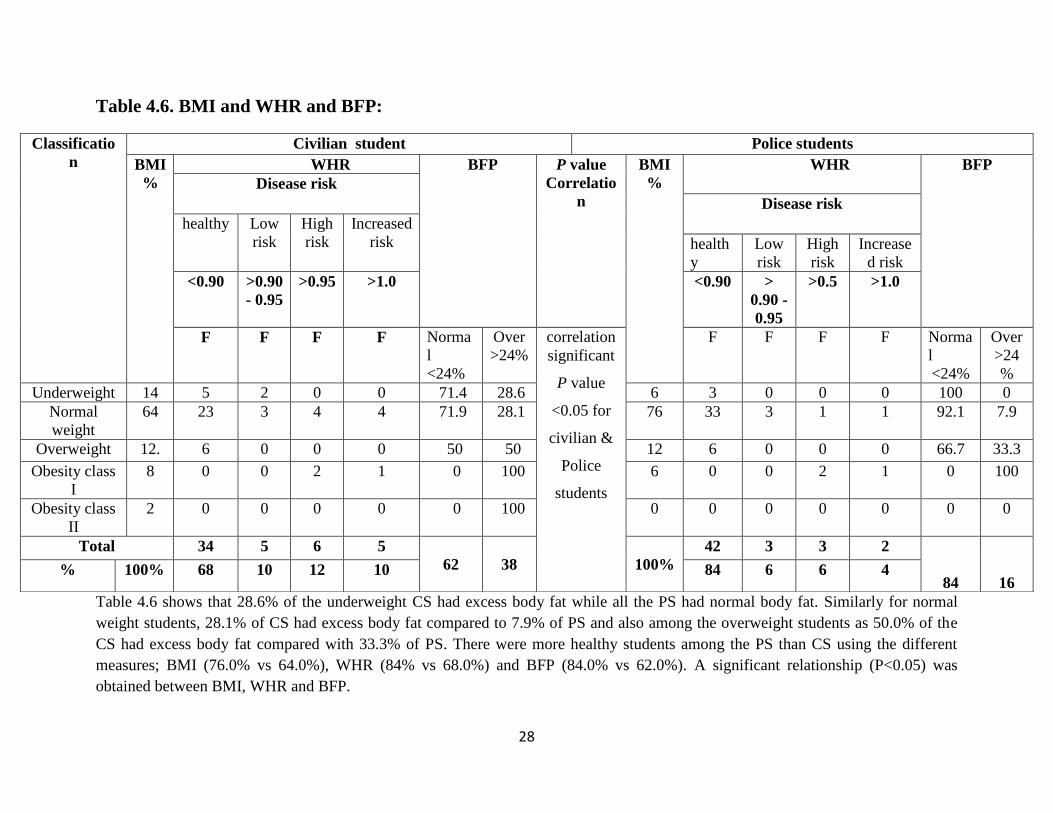
Table 4.6. BMI and WHR and BFP:
Table 4.6 shows that 28.6% of the underweight CS had excess body fat while all the PS had normal body fat. Similarly for normal
weight students, 28.1% of CS had excess body fat compared to 7.9% of PS and also among the overweight students as 50.0% of the
CS had excess body fat compared with 33.3% of PS. There were more healthy students among the PS than CS using the different
measures; BMI (76.0% vs 64.0%), WHR (84% vs 68.0%) and BFP (84.0% vs 62.0%). A significant relationship (P<0.05) was
obtained between BMI, WHR and BFP.
Classificatio
n
Civilian student Police students
BMI
%
WHR BFP P value
Correlatio
n
BMI
%
WHR BFP
Disease risk
Disease risk
healthy Low
risk
High
risk
Increased
risk health
y
Low
risk
High
risk
Increase
d risk
<0.90 >0.90
- 0.95
>0.95 >1.0 <0.90 >
0.90 -
0.95
>0.5 >1.0
F F F F Norma
l
<24%
Over
>24%
correlation
significant
P value
<0.05 for
civilian &
Police
students
F
F F F Norma
l
<24%
Over
>24
%
Underweight 14 5 2 0 0 71.4 28.6 6 3 0 0 0 100 0
Normal
weight
64 23 3 4 4 71.9 28.1 76 33 3 1 1 92.1 7.9
Overweight 12. 6 0 0 0 50 50 12 6 0 0 0 66.7 33.3
Obesity class
I
8 0 0 2 1 0 100 6 0 0 2 1 0 100
Obesity class
II
2 0 0 0 0 0 100 0 0 0 0 0 0 0
Total 34 5 6 5
62
38
100%
42 3 3 2
84
16 % 100% 68 10 12 10 84 6 6 4
29
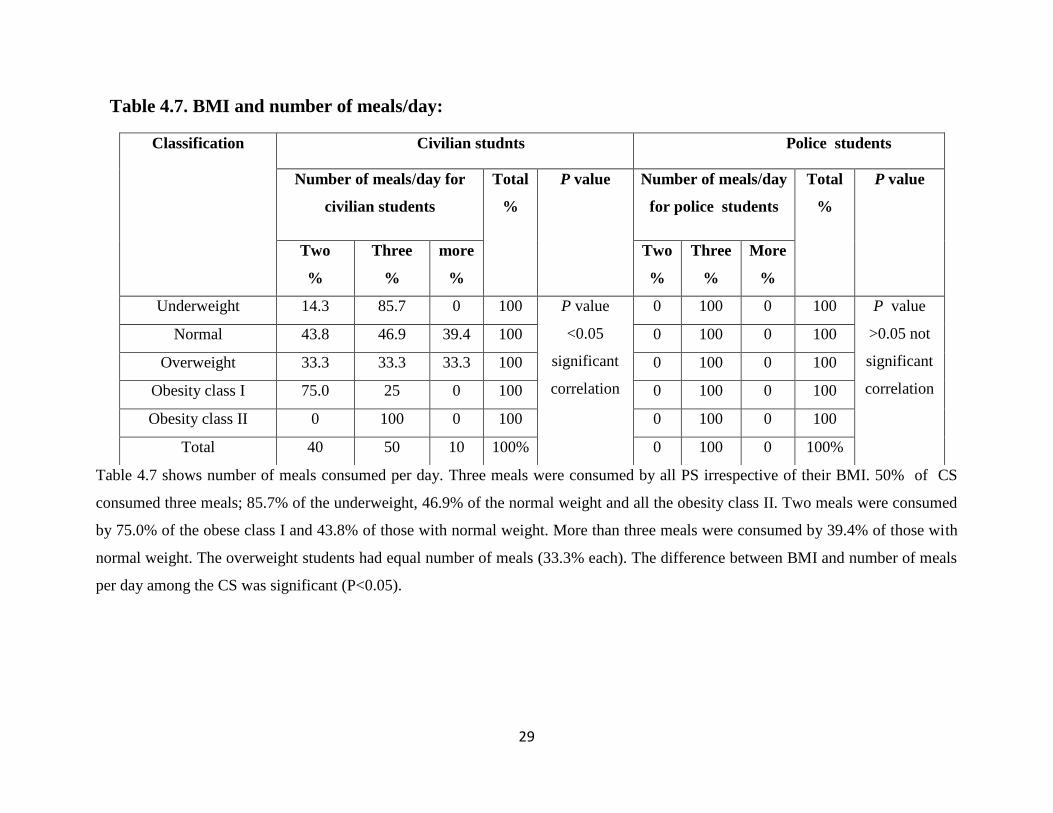
Table 4.7. BMI and number of meals/day:
Table 4.7 shows number of meals consumed per day. Three meals were consumed by all PS irrespective of their BMI. 50% of CS
consumed three meals; 85.7% of the underweight, 46.9% of the normal weight and all the obesity class II. Two meals were consumed
by 75.0% of the obese class I and 43.8% of those with normal weight. More than three meals were consumed by 39.4% of those with
normal weight. The overweight students had equal number of meals (33.3% each). The difference between BMI and number of meals
per day among the CS was significant (P<0.05).
Classification Civilian studnts Police students Number of meals/day for
civilian students
Total
%
P value
Number of meals/day
for police students
Total
%
P value
Two
%
Three
%
more
%
Two
%
Three
%
More
%
Underweight 14.3 85.7 0 100 P value
<0.05
significant
correlation
0 100 0 100 P value
>0.05 not
significant
correlation
Normal 43.8 46.9 39.4 100 0 100 0 100
Overweight 33.3 33.3 33.3 100 0 100 0 100
Obesity class I 75.0 25 0 100 0 100 0 100
Obesity class II 0 100 0 100 0 100 0 100
Total 40 50 10 100% 0 100 0 100%
30
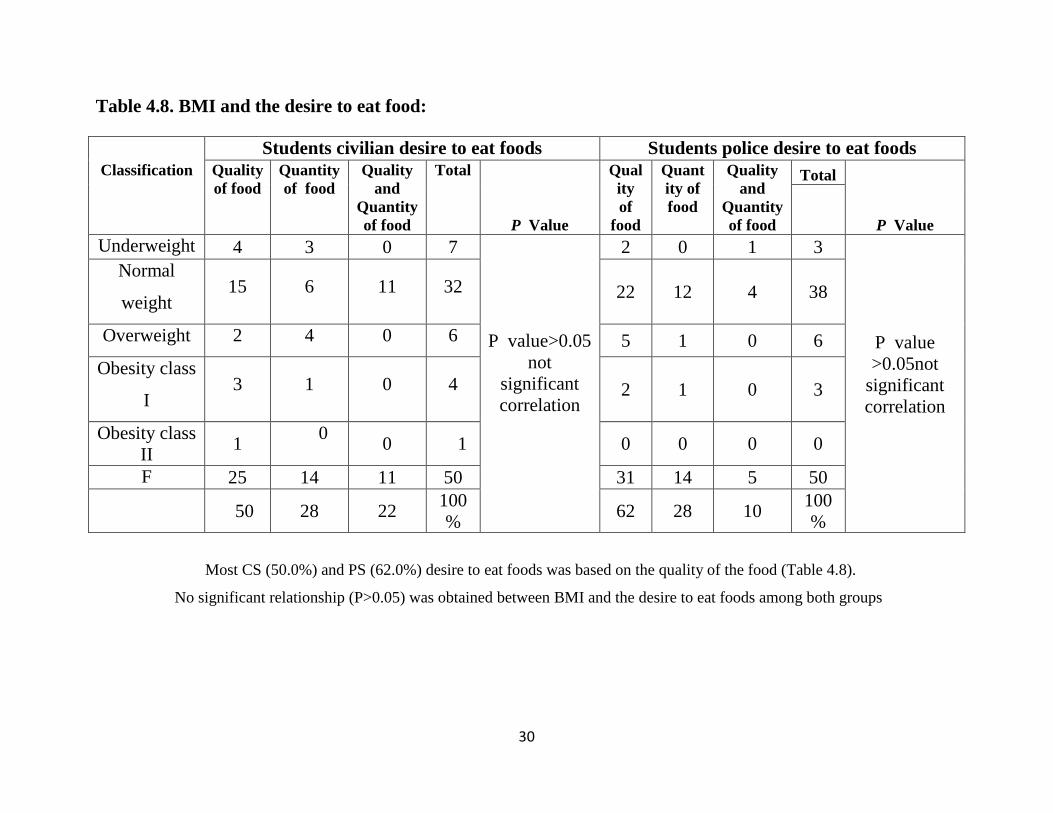
Table 4.8. BMI and the desire to eat food:
Most CS (50.0%) and PS (62.0%) desire to eat foods was based on the quality of the food (Table 4.8).
No significant relationship (P>0.05) was obtained between BMI and the desire to eat foods among both groups
Students civilian desire to eat foods Students police desire to eat foods
Classification
Quality
of food
Quantity
of food
Quality
and
Quantity
of food
Total
P Value
Qual
ity
of
food
Quant
ity of
food
Quality
and
Quantity
of food
Total
P Value
Underweight 4 3 0 7
P value>0.05
not
significant
correlation
2 0 1 3
P value
>0.05not
significant
correlation
Normal
weight 15 6 11 32 22 12 4 38
Overweight 2 4 0 6 5 1 0 6
Obesity class
I 3 1 0 4 2 1 0 3
Obesity class
II 1
0
0 1 0 0 0 0
F 25 14 11 50 31 14 5 50
50 28 22
100
% 62 28 10
100
%

31
Table 4.9. Dietary pattern:
Milk civilian students police students
F % F %
once a day 17 34 5 10
once a week 6 12 1 2
monthly 4 8 26 52
Rarely 13 26 14 28
Never 10 20 4 8
Meat
once a day 18 36 20 40
once a week 6 12 5 10
monthly 8 16 5 10
Rarely 9 18 10 20
Never 9 18 10 20
Legumes
once a day 15 30 21 42
once a week 22 44 3 6
monthly 1 2 2 4
Rarely 5 10 6 12
Never 7 14 18 36
Vegetable
once a day 27 24 34 23
once a week 8 25 1 21
monthly 3 0 0 0
Rarely 6 0 10 2
Never 6 1 5 4
Fruits
once a day 48 54 46 68
once a week 50 16 42 2
monthly 0 6 0 0
Rarely 0 12 4 20
Never 2 12 8 10
Bread
once a day 50 100 50 100
once a week 0 0 0 0
monthly 0 0 0 0
Rarely 0 0 0 0
Never 0 0 0 0
32
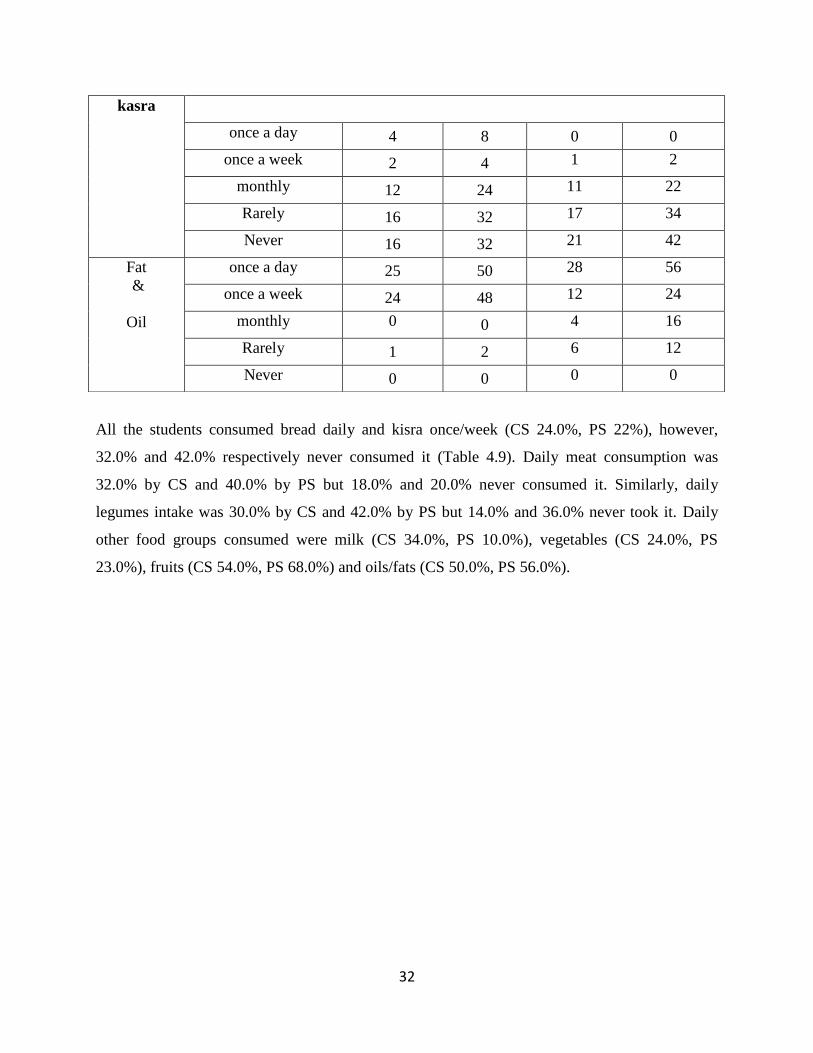
All the students consumed bread daily and kisra once/week (CS 24.0%, PS 22%), however,
32.0% and 42.0% respectively never consumed it (Table 4.9). Daily meat consumption was
32.0% by CS and 40.0% by PS but 18.0% and 20.0% never consumed it. Similarly, daily
legumes intake was 30.0% by CS and 42.0% by PS but 14.0% and 36.0% never took it. Daily
other food groups consumed were milk (CS 34.0%, PS 10.0%), vegetables (CS 24.0%, PS
23.0%), fruits (CS 54.0%, PS 68.0%) and oils/fats (CS 50.0%, PS 56.0%).
kasra
once a day 4 8 0 0
once a week 2 4 1 2
monthly 12 24 11 22
Rarely 16 32 17 34
Never 16 32 21 42
Fat
&
Oil
once a day 25 50 28 56
once a week 24 48 12 24
monthly 0 0 4 16
Rarely 1 2 6 12
Never 0 0 0 0
33
Table 4.10. Beverages and snacks:
.
.
,
Frequency of intake civilian students police students
F % F %
Tea once a day 30 60 34 68
once a week 5 10 6 12
monthly 0 0 1 2
Rarely 6 12 2 4
Never 9 18 7 14
Total 50 100 50 100
Coffee once a day 21 42 7 14
once a week 0 0 4 8
monthly 1 2 2 4
Rarely 12 24 8 16
Never 16 32 29 58
Total 50 100 50 100
Soft
drink
once a day 21 42 5 10
once a week 6 12 0 0
monthly 0 0 3 6
Rarely 9 18 10 20
Never 14 28 32 64
Total 50 100 50 100
Fresh
juice
once a day 32 64 18 36
once a week 4 8 3 6
monthly 2 4 6 12
Rarely 5 10 8 16
Never 7 14 15 30
Total 50 100 50 100
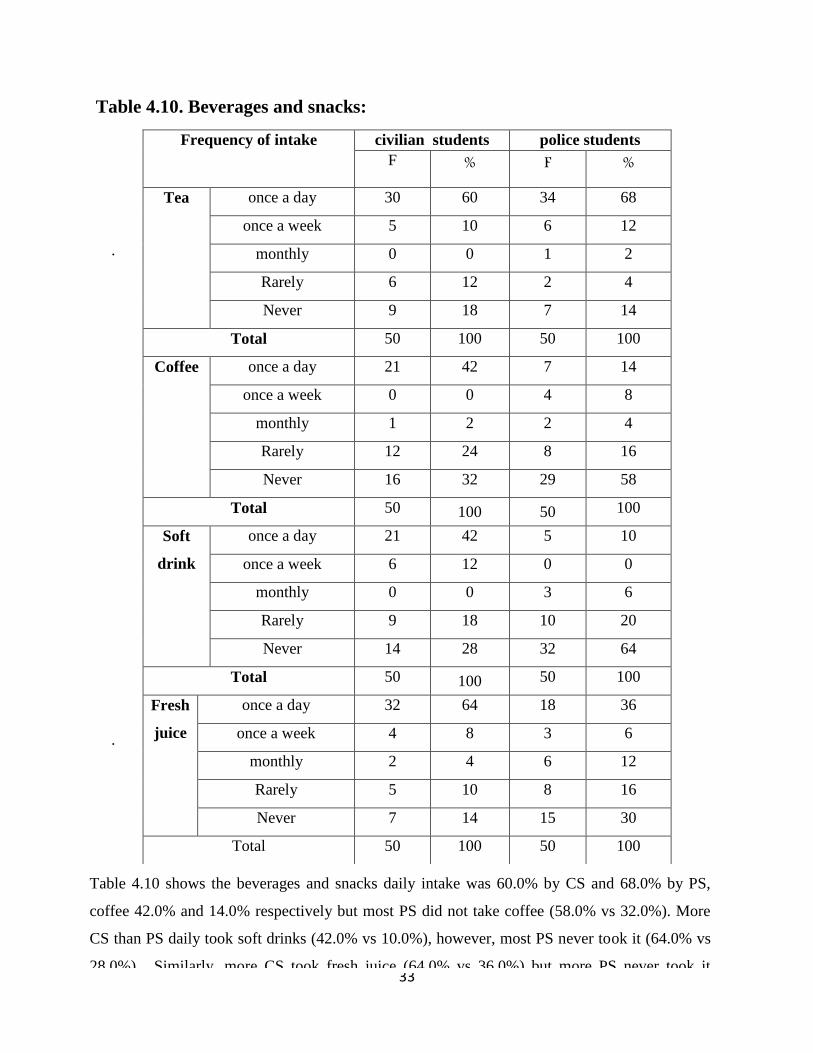
Table 4.10 shows the beverages and snacks daily intake was 60.0% by CS and 68.0% by PS,
coffee 42.0% and 14.0% respectively but most PS did not take coffee (58.0% vs 32.0%). More
CS than PS daily took soft drinks (42.0% vs 10.0%), however, most PS never took it (64.0% vs
28.0%). Similarly, more CS took fresh juice (64.0% vs 36.0%) but more PS never took it
(30.0% vs 14.0%).
34
Table 4.11. Junk food:
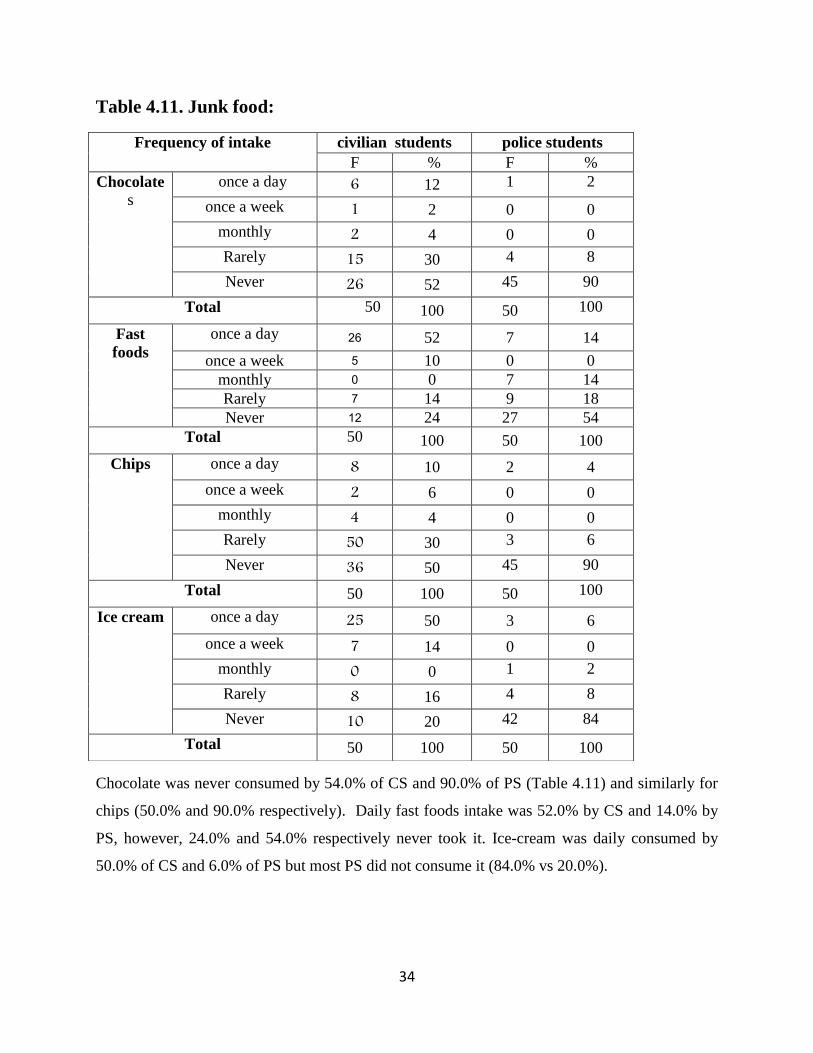
Chocolate was never consumed by 54.0% of CS and 90.0% of PS (Table 4.11) and similarly for
chips (50.0% and 90.0% respectively). Daily fast foods intake was 52.0% by CS and 14.0% by
PS, however, 24.0% and 54.0% respectively never took it. Ice-cream was daily consumed by
50.0% of CS and 6.0% of PS but most PS did not consume it (84.0% vs 20.0%).
Frequency of intake civilian students police students
F % F %
Chocolate
s
once a day 6 12 1 2
once a week 1 2 0 0
monthly 2 4 0 0
Rarely 15 30 4 8
Never 26 52 45 90
Total 50 100 50 100
Fast
foods
once a day 26 52 7 14
once a week 5 10 0 0
monthly 0 0 7 14
Rarely 7 14 9 18
Never 12 24 27 54
Total 50 100 50 100
Chips once a day 8 10 2 4
once a week 2 6 0 0
monthly 4 4 0 0
Rarely 50 30 3 6
Never 36 50 45 90
Total 50 100 50 100
Ice cream once a day 25 50 3 6
once a week 7 14 0 0
monthly 0 0 1 2
Rarely 8 16 4 8
Never 10 20 42 84
Total 50 100 50 100
35
Table 4.12. Energy and protein intakes:
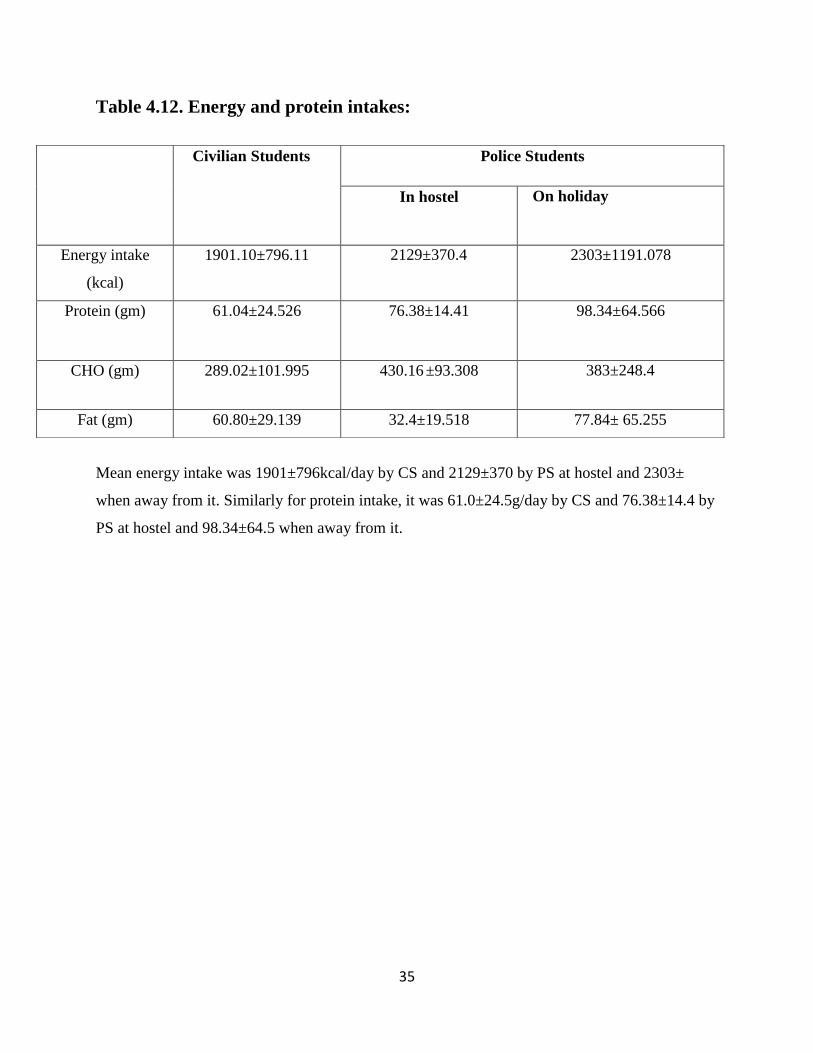
Mean energy intake was 1901±796kcal/day by CS and 2129±370 by PS at hostel and 2303±
when away from it. Similarly for protein intake, it was 61.0±24.5g/day by CS and 76.38±14.4 by
PS at hostel and 98.34±64.5 when away from it.
Police Students Civilian Students
On holiday
In hostel
2303±1191.078 2129±370.4 1901.10±796.11 Energy intake
(kcal)
98.34±64.566 76.38±14.41 61.04±24.526 Protein (gm)
383±248.4 ±93.308 430.16 289.02±101.995 CHO (gm)
77.84± 65.255 32.4±19.518 60.80±29.139 Fat (gm)
36
Chapter Five
5.Discussion
The study aimed at assessing the nutritional status of male civilian and police students
enrolled in the National Ribat University and any detrimental associated factors. One hundred
students were enrolled, 50 civilian (CS) and 50 police (PS). The CS lived independently while
the PS lived in hostel with a week-end (2 days) choice to be away from the hostel.
Mean ages were 21.0±1.34 years for CS and 21.2±0.915 years for PS hence they are
within the young adulthood age of 18-41 (Chora, 2000). Most of them were from families of 7-9
persons. The majority of the PS and a high proportion of the CS came from middle income
families; however, more CS came from high and less from low income families than the PS. This
indicates that generally CS came from more well-to-do families which are supported by the fees
they pay.
Two-third of the CS and three-quarters of the PS had normal body weight.
However, there were more underweight and excess body weight cases (BMI >30) among CS
than PS. There was a significant relationship (P<0.05) between BMI and age among the CS but
not the PS.
More than half of CS from low income families and more than a fifth from high income
ones suffered underweight compared with 20.0% of PS families from low income families; there
was no significant relation between BMI and income in the two groups.
BMI, a calculated indicator, was introduced to assess the nutritional status of adults in terms of
energy status but not as a direct measure of body fat as it does not differentiate between lean
body mass and fat mass at higher levels (WHO, 1995). This was shown in this study as CS
classified as underweight showed excess body fat (28.6%) which agreed with Costa (2012) that
underweight students classified by BMI may show higher body fat percentage and/or abdominal
(central) obesity.

37
Earlier studies showed that abdominal obesity measured as weight-for-hip ratio (WHR)
was associated with increased risks of myocardial infarction, stroke and premature death whereas
these diseases were not associated with the BMI measure of generalized obesity (Larson et al,
1984), hence WHR was a stronger independent factor than BMI (Lapidus et al, 1984). WHO
suggested that in populations with predisposition to central obesity, other indicators are needed
to refine action levels based on BMI to predict risks of chronic disease as obesity was associated
with the metabolic syndrome (decreased glucose and insulin tolerance, adverse lipid profile)
hence risk factors for type-2 diabetes and cardiovascular diseases. Its recommendation was the
use of waist circumference (WC) or WHR (WHO, 2008).
In accordance with the above, this study showed more risks of future chronic diseases among CS
than PS when assessed by WHR [CS 32% vs PS 16%] which was even more pronounced when
assessed by percentage body fat [CS 38% vs PS 16%].
All PS were involved in different levels of physical activities for more than 2 hours for 2
sessions/day compared with three-quarters of CS for one session less than 2 hours/day. This
explains why PS were healthier than CS in terms of BMI, WHR and body fat mass as regular
physical activity and a healthy diet can reduce excessive body weight and enhance body
composition (Boyle, 2007).
In this study and irrespective of duration and number of sessions, most of the students
were involved in physical activities as at their age they have boundless energy for exercise for its
own sake (CS) or as part of their routine activities (PS). The recommendation that may apply to
the CS is to participate in moderate activity on most if not all week days and to engage in heavy
exercise at least 3 days/week (Mahan and Escott-Stump, 2008).
All PS took three meals per day regardless of their BMI status. Half of CS consumed
three meals/day including 85.7% of those classified as underweight and all the obese-II while
those who consumed two meals/day included most of the obese-I. The relationship between
number of meals/day and BMI among CS was significant (P<0.05).
38
All students consumed bread daily. Similar intakes were observed for meat, vegetables,
kisra and oil/fat. PS had higher intakes of legumes and fruits while CS of milk.
Half of the CS consumed fast foods and ice-cream daily but rarely chocolate or chips but
among PS slightly more than half never took fast foods and more than 84% never took chocolate,
chips or ice-cream. Similarly, CS had more daily intakes of soft drinks and fruit juices while
more than half of PS never took soft drinks or coffee; their intake of fresh juices was lower than
that of CS. Generally, CS food choice included more milk, fast foods, chips, chocolate and ice-
cream and indication of petty cash availability. This is probably the reason why there were more
obese cases among them.
PS took more energy and protein than CS students (112% and 125% respectively) hence
they are expected to have more overweight and obese cases. However, their nutritional status
assessed by BMI, WHR or BFP was better hence having healthier bodies due to their daily
routine physical activities which was more varied and expended more energy than that of the CS.
Furthermore, results of 24-huors showed energy intake of PS similar to that calculated
by Shawgi (2011).
39
Chapter Six
6.Conclusions and Recommendations
6.1. Conclusions:
1. 100 students were enrolled in this study, 50 civilians (CS) and 50 police (PS), their average
age was 21 years old, mostly from middle income families with more CP from high and low
income ones.
2. The majority had normal body weights but there were more underweight and excess body
weight cases among CS than PS.
3. There was a significant relationship between BMI and age among the CS but not among the
PS.
4. Underweight cases among CS included more than half of those from low income families and
more than a fifth from high income ones compared with a fifth from PS from low income
families. No significant difference was noticed between BMI and income in the two groups.
5. Among the CS underweight, there were cases of excess body fat.
6. CS faced more risks of future chronic diseases than PS having better health and nutritional
status whether measured by BMI, WHR or BFP.
7. All PS were involved in physical activity for 2 sessions/day for >2 hours/session compared
with <1 session/day for <2 hours for CS.
8. All CS students took 3 meals/day regardless of their BMI status compared with half of CS
including most of the underweight ones. There was a significant relationship between BMI and
number of meals/day among the CS.
9. All the students had similar traditional food habits except that PS had more frequency of
intake of fruits and legumes while CS of milk. Half of CS took fast foods and ice-cream but 54%
and 84% of PS never took them. CS took soft drinks and fruit juices daily but 64% of PS never
took soft drinks and had lower intake of fruit juices.
10. PS had more energy (112%) and protein (125%) intakes than CS.

40
6.2. Recommendations:
1. Improved nutritional screening [BMI, WHR, BFP] of all CS fresh students
2. Periodic monitoring of all CS students by trained dieticians in the university clinic including
dietary counseling.
3. Physical activity is part of the assessment of the nutritional status so CS to engage in more
moderate and strenuous exercises to improve their nutritional status
4. Increase consumption of local vegetable and fruits and healthy foods, for all students, instead
of soft drink as junk food.
41
Reference
Abolfotouh M; Bassiouni F; Mouir G; and Ch R. (2007).Health –related lifestyles and risk
behaviours among students living in Alexandria University hostels. Journal World Health
Organization, Eastern Mediterranean World Health, Vol.13, N 2.
Ahmed A. .(2010). Determination of fruits’ and vegetables’ consumption amongst primary
school children (7-12 years) in Khartoum province. MSc in The National Ribat University
Faculty of Medicine.
American Council on Exercise (2003). ACE Personal Trainer Manual,3 th
edition. Ch. 6,
Pg. 188, Table 6.14.
Amos, PM. Factors That Were Found to Influences Ghanaian Adolescents' Eating.
2012,sgo sagepub. Com\content\2\4\2158244012468140 [Accessed on 20 January 2014].
Boyle; and Maria. A. (2007). Personal Nutrition. 4th edition. USA. Thomson Learning Inc.
Boutros Z. J . (1986). Sudan Food Composition Tables, 2 th
edition. National Chemical
Laboratories Ministry of Health. Khartoum, Sudan.
Chora, M.; Gulbraith; S.; Gerntion; and Hill. L. (2000). Body Mass Index Cut-off Points, a
Global Response to a Global Problem: The Epidemic of Over Nutrition. Bulletin of the
World Health Organization, 80 (12), 952-968. Available on: http://biniforpacatitoners-Nutri.
Costa LCF; and Vasconcelos FAG. Prevalence and factors associated with nutritional status
among female university students in Florianópolis, SC. Rev Bras Cineantropom Desempenho
Hum, 15(3): 326-337.(2013).
Daniels; and S.R. (2009).The Use of BMI in the Clinical Setting, Pediatrics. 124,
(Supplement No. 1), pp: S35-S41.
EC and FAO,(2013). Food Security Information for Action Programme, (2010). http://www.
oerafrica.org/ftpfolder/Agriculture/Nutrition/pdf/Nutrition_Assessment_Methods.
Eckersley. R. (2008). (Sept). Never better – or getting worse? The health and wellbeing of
young Australians. Australia 21 Ltd; www.australia21.org.au .
Elneim A. A. (2006). Dietary Patterns of University Students: A Case Study of the University
of Sennar. MSc in Khartoum University. Unpublished.
42
Food Habits. (2013). [online]. Available from:http://wikieducator.org/Lesson 5: food
Habits[Accessed: 30 April 2013].
George W. N, Jeffrey; Alwang; and William A. (2013). Economic of Agricultural
Development. 2 th
edition. USA. Blacksburg.
Girma, W and Genebo, T. (2000). Determinants of the Nutritional Status of Mothers. Health
and Nutrition Research Institute. www.measuredhs.com/pubs/pdf/FA39/02-nutrition.pdf
[Accessed on 20 anuary 201A.]
Gibney M J, Lanham-New SA, Cassidy A, and Vorster H H. (2009). Introduction to
Human Nutrition. 2nd Edition. UK. Wiley-Blackwell.
Grosvenor ; and Smolin . (2000).Nutrition Science and Application..United State of
America. Emily Barrosse.
Guma A. (2006). Nutrition status assessment of fresh intake of female students aged 15-22
year. MSc in Ahfad University for Women Omdurman.
Hong S; Song Y; Lee KH; Lee HS; Lee M; Jee SH; and Joung H. (2012). A fruit and
dairy dietary pattern is associated with a reduced risk of metabolic syndrome. Metabolism.
Elsevier Inc 2;61:883-90. doi: 10.1016/j.metabol.2011.10.018
Irazustaa A; Hoyosa I; Irazustab J; Ruizb F; Díazb E; and Gilb J. (2007).Increased
cardiovascular risk associated with poor nutritional habits in first-year university students.
Nutrition Research; 27: 387-394.
Irish Nutrition & Dietetic Institutes(INDI). (2010). Booklet on Food for Sport. 1th.
www.ais.org.au. Email: info@indi,ie.Katsilambros N; Dimosthenopoulos M; and Manglara
. P( 2010).Clinical Nutrition in Practice. 1 th
edition. UK: Wiley-Blackwell
Lapidus L, Bengtsson C, Larsson B et al (1984). Distribution of adipose tissue and risk of
cardiovascular disease and death: a 12 year follow-up of participants in the population study
of women in Gothenburg, Sweden. British Medical Journal, 289 (6465):1257-1261.
Larsson B, Svardsudd K, Walin et al (1984). Abdominal adipose tissue distribution, obesity
and risk of cardiovascular disease and death: 13 year follow-up of participation in the
population study of men born in 1913. British Medical Journal, 288(6428):1401-1404.
43
Lokadhia Manwa. University Students’ Dietary Patterns. (2013) A Case of a University in
Zimbabwe Journal of Emerging Trends in Educational Research and Policy Studies.
(JETERAPS) 4(1):191-197 (ISSN: 2141-699.
Mahan . B, and C. Indel. (1996). Food Nutrition and diet therapy. 2 th
edition. USA. Mc
Graw Hill. Publishers.
Mahan. L. K, and Escott –Stump S. (2008). Krause’s Food & Nutrition Therapy. 12 th
edition. St. Louis, Saunders Elsevier Publisher.
Mahan, L. K, Escott –Stump S, and Raymond anice. (2012).Krause’s Food & the Nutrition
Care Process . 13 th
edition. St. Louis, Saunders Elsevier Publisher.
McKinley Health Center. Body Mass Index. (2009).Available at http:/ /www.mckinley.i
llinois .edu.
McCance, and Widdowsons. (2000). The Composition of Foods. 5 th
Royal Society
Chemistry Publishing. United Kingdom;
Mudambi, S K, and Rajagopal. M.V. (2007). Fundamental of Foods and Nutrition, 4 th
edition. UK. New Age International Publishers.
Mushonga; N. G. T; Chagwena. D; Benhura . C; and Nyanga. L. K. (2013). An assessment
of the nutritional status of University of Zimbabwe students. Parkistan Journal of Nutrition
12, 30-33.
National Obesity Observatory. (2009). Body Mass Index as Measure of Obesityhttp://www.
docstoc.com/docs/28045569/Body-Mass-Index-as-a-measure-of-obesity, Accessed on
[13/12/2013].
Nurul, H, and Ruzita A. (2010). Preliminary Survey on nutritional status among University
students at Malaysia. Pak. J. Nutr., 9: 125-127.
Park. K. (1997).Preventive and Social Medicine. 14 th
edition. India, Tabular.
Pen, J.J. (1990). Preventive Nutrition Obesity Among School Children Available on:
WWW.opesschool/bc.ca/bdfs/fn12_intro_assn. [Accessed on 11/11/2013]
Pivarnik, J.J. O, and Oswald T. (2007). Research shows BMI often not an accurate indicator
of body fat. Michigan State University newsroom 5 March. (available at www.newsroom.
msu.edu).

44
PM Amos. )2012). Factors That Were Found to Influence Ghanaian Adolescents' Eating.
sgo.sagepub.com/content/2/4/2158244012468140.
Robert M. B. (2013). Eating disorders: All About Anorexia Nervosa. Available on:
WWW.shef.sa.UK/polopoly_FC/1.34770!/file/all about anorexia.bdf [Accessed
on11/11/2013].
Rolfes; SR Rady, Pinna K, and Whitney E N, Ellie. (2008). Understanding Normal and
Clinical Nutrition. London, Cengage Learning Publisher.
Sareen Gropper, Jack Smith and James Groff. (2008). Advanced Nutrition and Human
Metabolism, 5 th
ed. WADSWORTH.
Shawgi O.J. (2011). Food intake and nutritional assessment among students a Sudanese
police college. MSc in Al Zaeim Al Azhari University.
Spark Arlene. (2007). Nutrition in Public Health principles, policies, and practice.1 th
edition.
USA. CRC Press.
Smolin A. Lori ; and Grosvenor B Mary. . (2009). Basic Nutrition. books. google. Infobase
Publishing, Jan 1, 2009 ISBN, 1438102186, 9781438102184
Stang F. J; and William M, M. (1974).Nutrtion for good heath, California, pp.65-67.
Townsend; Carolynn E; and Roth Ruth A. (2013). Nutrition and Diet Therapy. 7 th
edition.
California USA, Delmar publishers;.
Vimala. V. (2009). Advances In Diet Therapy. 1 th
edition. Canada: New Age International
Publishers.
Wardlaw GM. (1999). Perspectives in nutrition. 4th
edition. Boston: WCB McGraw-Hill.
Williams, S.R. (1999).Essentials of Nutrition and Diet Therapy. 7th
edition. USA. Mospy.
Williams; and Sue Rodwell. (2013). Basic Nutrition and Diet Therapy.10th
edition. USA.
Mosby.
William B. R, M. M, Blimkie; Camron J. R. Stephen; R. Daniels; Rodney; K. Dishman;
Bernard; Gutin; Albert C. Hergenroeder; Aviva Must; Patricia; A. Nixon; James; M.
Pivarnik; Thomas; Rowlan d Stewart; Trost; Francois; and Trudeau. (2005). Evidence Based
Physical Activity for School-Age Youth. Original Articles. p 735-737.
WHO. (2014).BMI Classification www.who.int Accessed on [15/9/2013].
45
WHO (1995). Physical status: the use and interpretation of anthropometry. Report of WHO
Expert Consultation, Geneva.
WHO (2008). Waist circumference and waist-hip ration. Report of WHO Expert
Consultation, Geneva.

Appendix

1 Appendix
ثغ هللا اىشح اىشح
كلية الدراسات العليا -الزباط جامعة لطلبة جامعة الزباطالغذائى التقييماستبيان حىل
: ػي خغ االعئيخأخت فعال *
اىشق اىزغيغو -
اىؼش -
ىغن :نب ا -
اىقبسةغ ثؼط ف اىذاخيخ : غ اىىاىذ ىع اىغن -
طقخ اىغن ........................................................... -
عشح: .....................................................................ػذد أفشاد اال -
اىذخو اىشهشي ىالعشح :........................................................... -
اىشبغبد اىجذخ
*هو ربسط اىشبظخ:
ؼ ) ( ال ) (
؟ *ارا مبذ االخبثخ ثؼ ارمش ىع اىشبظخ اىز ربسعهب
؟*حذد عبػبد بسعخ اىشبظخ خاله االعجىع
عبػبد) ( 4- 3عبػبد ) ( 2- 1اقو عبػخ ) (
عبػبد فبمثش) ( 8عبػبد) ( 7- 5
:اىقبعبد اىدغبخ
........................................................... الطول بالسم: - ............................................................. الوزن بالكم: -
مؤشر كتمة الجسم: ...............................- نسبة الدهون: ................................-
Waist to hip-ratio (WHR)……………الورك نسبة إلى الخصر -
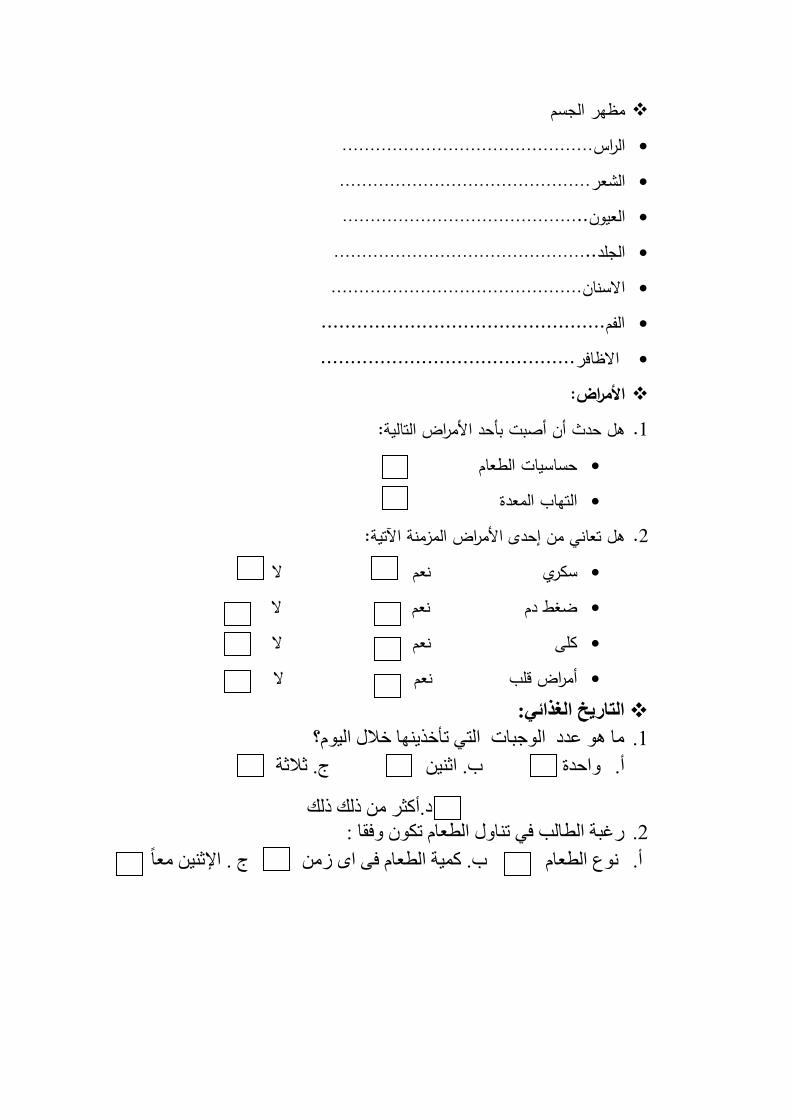
مظهر الجسم الراس……………………………………… الشعر……………………………………… العيون…………………………………….. الجمد……………………………………….. االسنان……………………………………… ................................................الفم االظافر........................................... :األمراض
هل حدث أن أصبت بأحد األمراض التالية: .1 حساسيات الطعام التهاب المعدة
هل تعاني من إحدى األمراض المزمنة اآلتية: .2 ال سكري نعم ضغط دم نعم ال كمى نعم ال أمراض قمب نعم ال :التاريخ الغذائي
ب هى ػذد اىىخجبد اىز رأخزهب خاله اىى؟ .1
ج. ثالثخ ة. اث واحذح . أ
د.أمثش رىل رىل
سغجخ اىطبىت ف ربوه اىطؼب رنى وفقب : .2
ج . اإلث ؼب ة. مخ اىطؼب ف اي ص ىع اىطؼب . أ

:ما هو عدد تناول الوجبات اآلتية جدول الغذاءات التكرارية: نوع الطعام
اطالقا" أحيانا بعض المرات الشهرمرة في مرة في اإلسبوع مرة في اليوم الكمية
الحميب ومنتجاته المحوم ومنتجاتها
البقوليات الخضروات
الفواكه
الخبز- الكسرة -
االرز او المكرونة-
الزيوت والشحوميتم تناولها بإنتظام أخرى أطعمة إدخل
الوجبات السريعة
ششوثبد غبصخ
اىشب
اىقهىح
آغنش
اىؼصبئشا ىطبصخخ
اىشنىالرخ
اىشجظ
أخرى حدد أطعمة
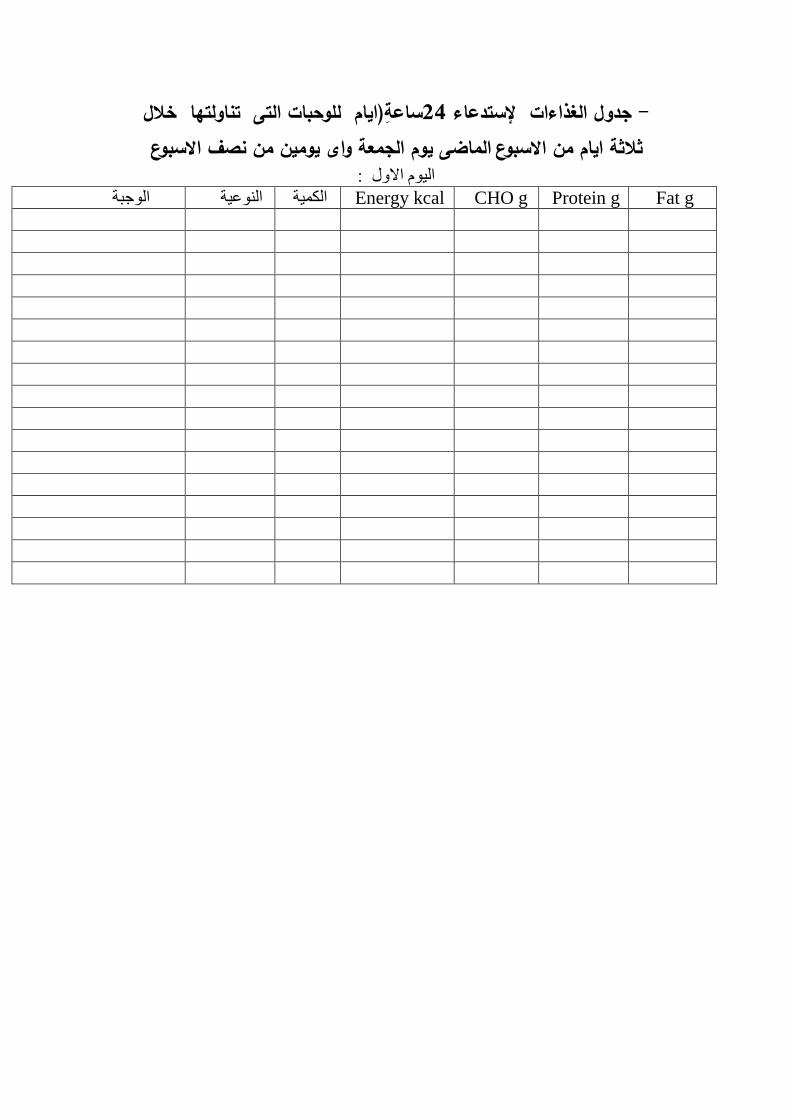
ساعة)ايام لموحبات التى تناولتها خالل 42 إلستدعاء جدول الغذاءات - يومين من نصف االسبوع وم الجمعة واىيالماضى م من االسبوعاثالثة اي
اىى االوه :
اىنخ اىىػخ اىىخجخ Energy kcal CHO g Protein g Fat g
اىى اىثب
اىنخ اىىػخ اىىخجخ Energy kcal CHO g Protein g Fat g
اىى اىثبىث )اىدؼخ(
اىنخ اىىػخ اىىخجخ Energy kcal CHO g Protein g Fat g
شنش ىن حغ رؼبون ؼب
وخضام هللا خشا
Appendix 2
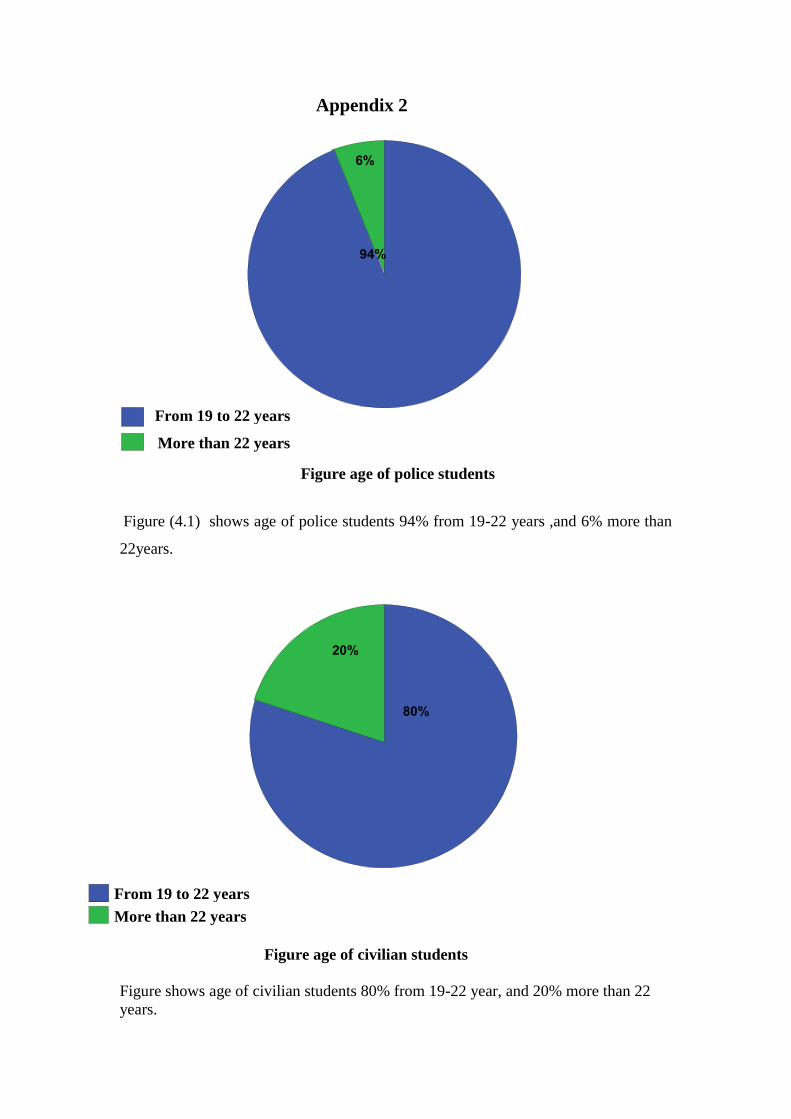
Figure age of police students
Figure (4.1) shows age of police students 94% from 19-22 years ,and 6% more than
22years.
Figure age of civilian students
Figure shows age of civilian students 80% from 19-22 year, and 20% more than 22
years.
6%
94%
From 19 to 22 years
More than 22 years
80%
20%
From 19 to 22 years
More than 22 years
Appendix 3
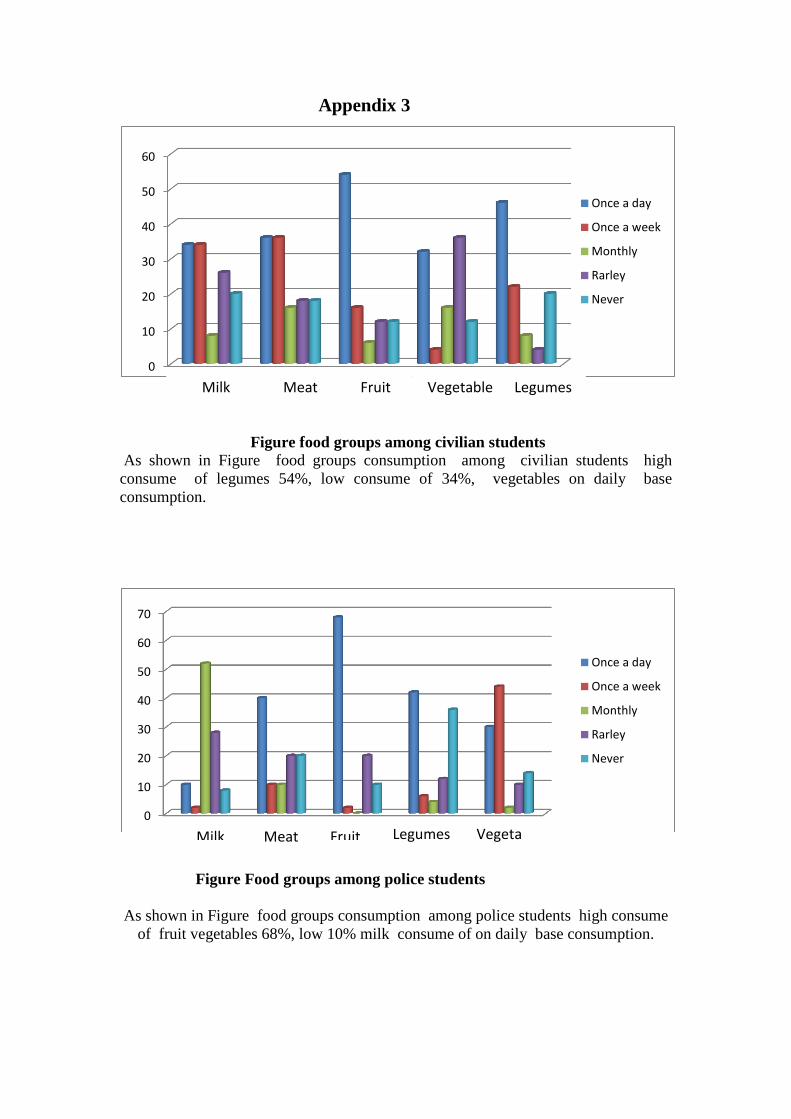
Figure food groups among civilian students
As shown in Figure food groups consumption among civilian students high
consume of legumes 54%, low consume of 34%, vegetables on daily base
consumption.
Figure Food groups among police students
As shown in Figure food groups consumption among police students high consume
of fruit vegetables 68%, low 10% milk consume of on daily base consumption.
0
10
20
30
40
50
60
Once a day
Once a week
Monthly
Rarley
Never
0
10
20
30
40
50
60
70
Once a day
Once a week
Monthly
Rarley
Never
Fruit Legumes Milk Meat Vegetable
Legumes Fruit Meat Vegetable
Milk

Appendix 4
Figure of Millenium11 scale
Technical Details Measurement
Method Weight: 300kg load
cell Height: Ultrasound
Fat: Bioelectric impedance
Measurement (BIM)

Appendix 5
Food Guide My plate for Adults
My plate showing the five groups (From the United States Department of (Agriculture
(USDA). Accessed June 2011 from http:\\www.hoose My plate. Govl).( Mahan et all,
2012)
Recommended Number of Food Guide Servings per Day
Vegetables and Fruit 8-10
Grain Products 8
Milk and Alternatives 2
Meat and Alternatives 3
How count Food Guide Servings in a meal?
250 mL (1 cup) mixed broccoli,
carrot and sweet red pepper
= 2 Vegetables and Fruit Food Guide Servings
75 g (2 1⁄2 oz.) lean beef = 1 Meat and Alternatives Food Guide Serving
250 mL (1 cup) brown rice = 2 Grain Products Food Guide Servings
5 mL (1 tsp) canola oil = part of your Oils and Fats intake for the day
250 mL (1 cup) 1% milk = 1 Milk and Alternatives Food Guide Serving
1 apple = 1 Vegetables and Fruit Food Guide Serving
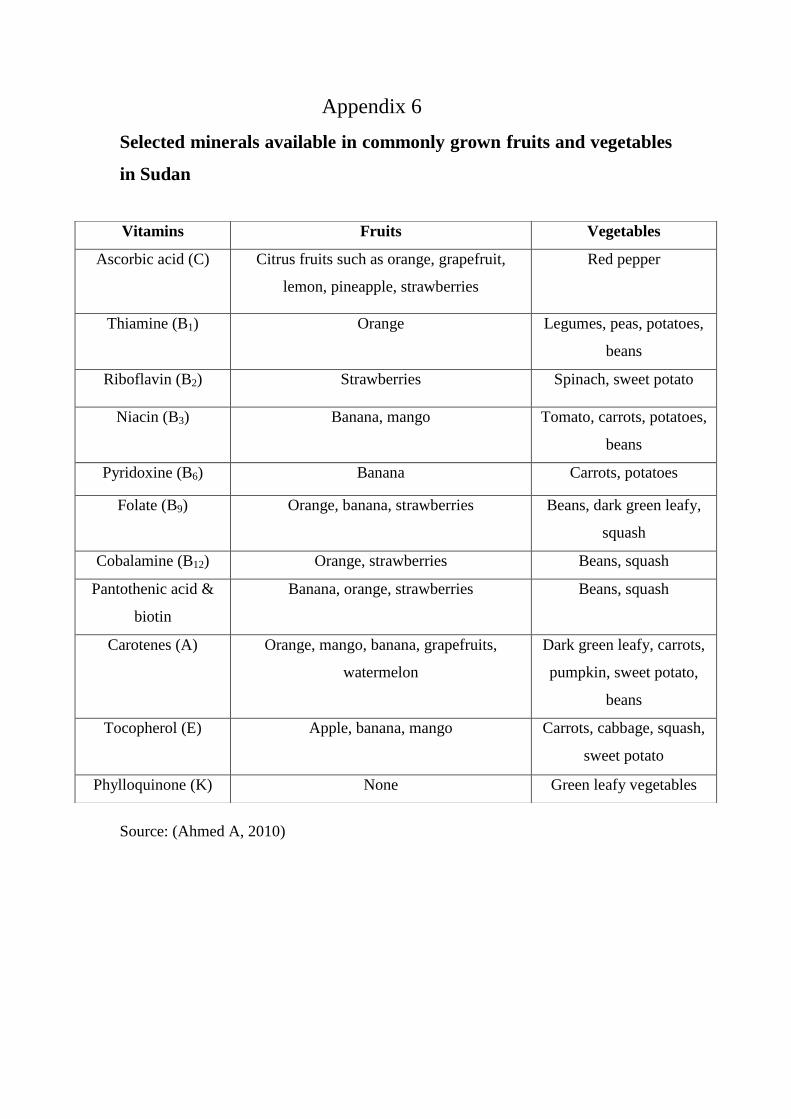
Appendix 6
Selected minerals available in commonly grown fruits and vegetables
in Sudan
Source: (Ahmed A, 2010)
Vitamins Fruits Vegetables
Ascorbic acid (C) Citrus fruits such as orange, grapefruit,
lemon, pineapple, strawberries
Red pepper
Thiamine (B1) Orange Legumes, peas, potatoes,
beans
Riboflavin (B2) Strawberries Spinach, sweet potato
Niacin (B3) Banana, mango Tomato, carrots, potatoes,
beans
Pyridoxine (B6) Banana Carrots, potatoes
Folate (B9) Orange, banana, strawberries Beans, dark green leafy,
squash
Cobalamine (B12) Orange, strawberries Beans, squash
Pantothenic acid &
biotin
Banana, orange, strawberries Beans, squash
Carotenes (A) Orange, mango, banana, grapefruits,
watermelon
Dark green leafy, carrots,
pumpkin, sweet potato,
beans
Tocopherol (E) Apple, banana, mango Carrots, cabbage, squash,
sweet potato
Phylloquinone (K) None Green leafy vegetables
Source: (Ahmed A, 2010)
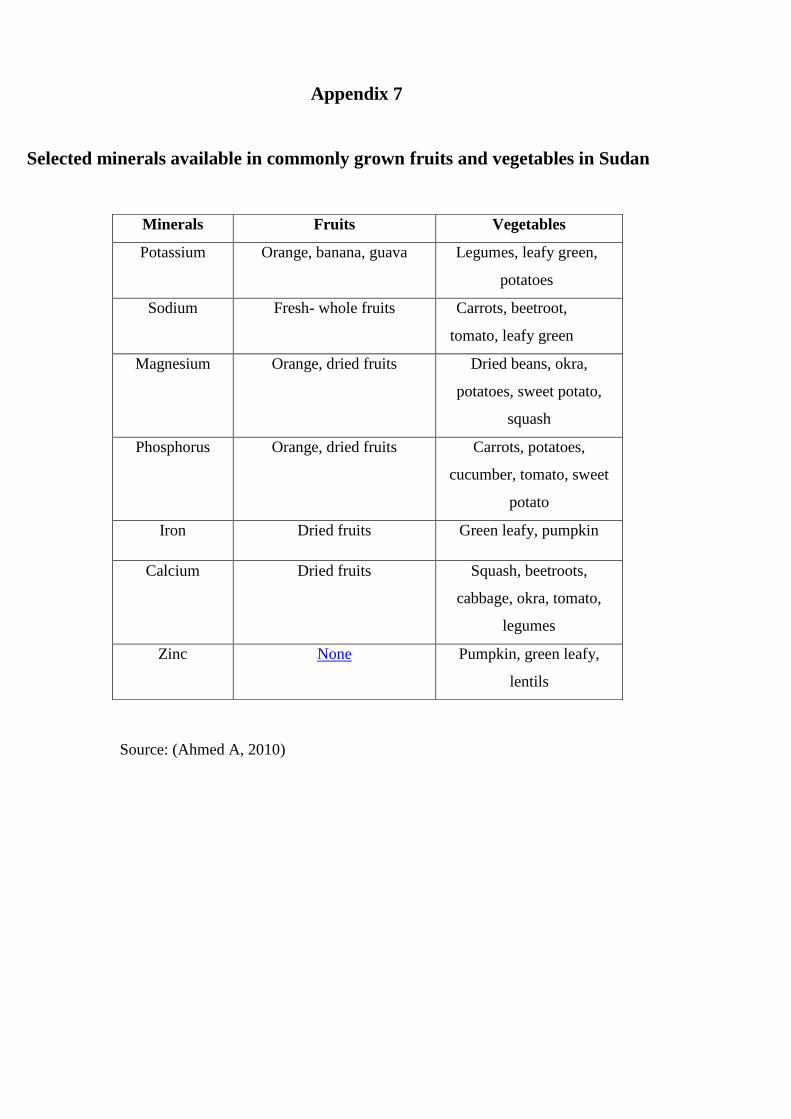
Minerals Fruits Vegetables
Potassium Orange, banana, guava Legumes, leafy green,
potatoes
Sodium Fresh- whole fruits Carrots, beetroot,
tomato, leafy green
Magnesium Orange, dried fruits Dried beans, okra,
potatoes, sweet potato,
squash
Phosphorus Orange, dried fruits Carrots, potatoes,
cucumber, tomato, sweet
potato
Iron Dried fruits Green leafy, pumpkin
Calcium Dried fruits Squash, beetroots,
cabbage, okra, tomato,
legumes
Zinc None Pumpkin, green leafy,
lentils
Appendix 7
Selected minerals available in commonly grown fruits and vegetables in Sudan
Appendix 8
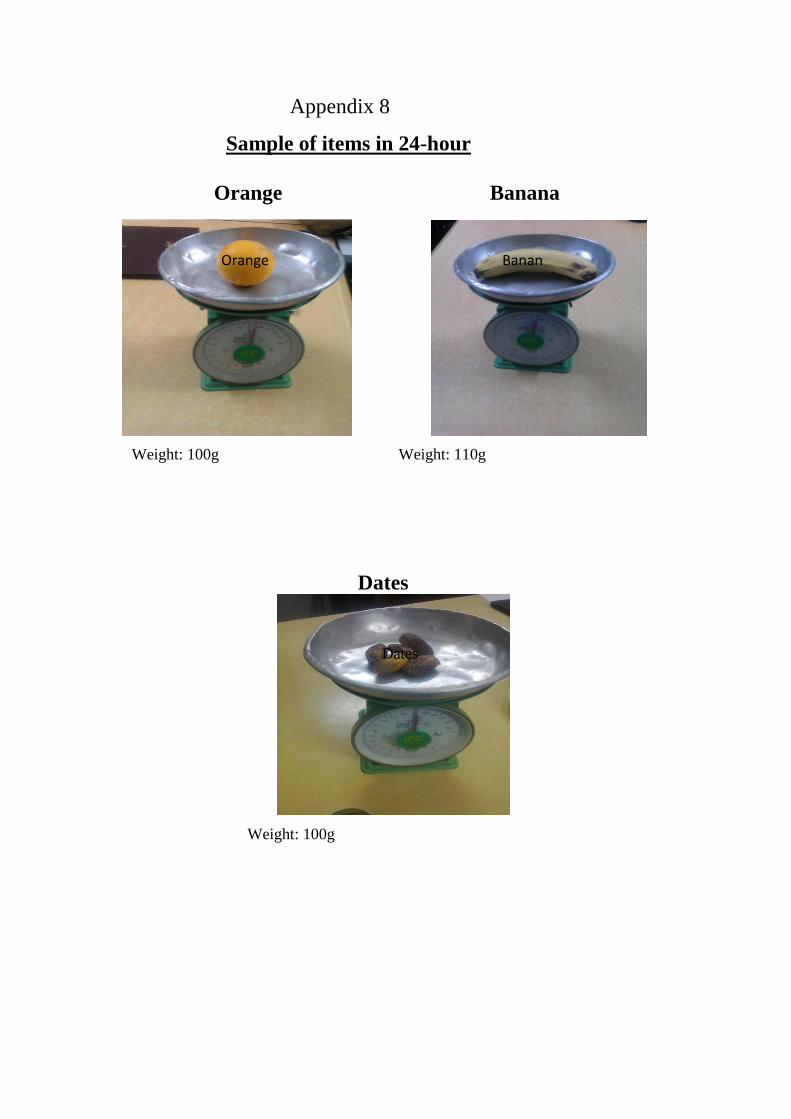
Sample of items in 24-hour
Weight: 100g Weight: 110g
Dates
Weight: 100g
Orange
Orange Banana
Dates
Banana

Sandwich burger
Weight ; 200g
Sandwich content from:
2 pieces burger egg
Weight : 50g Weight: 50g
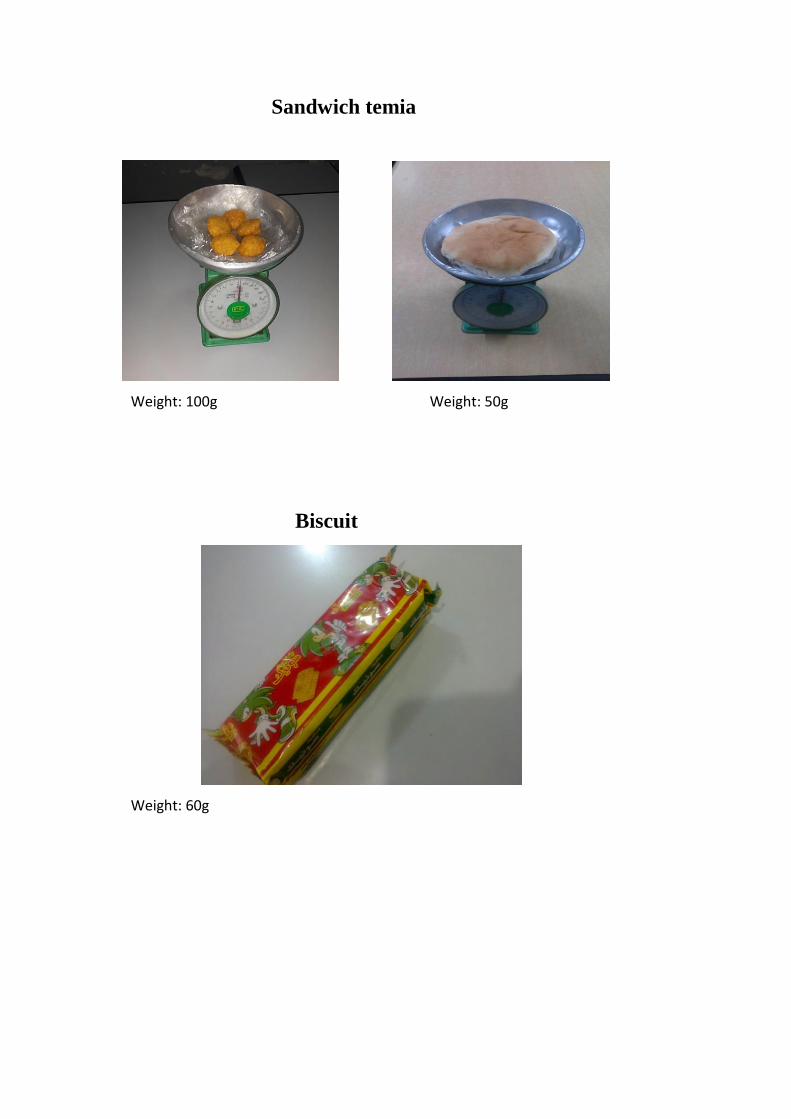
Sandwich temia
Weight: 100g Weight: 50g
Biscuit
Weight: 60g