The national funding formula for schools and high needs ... · The final national funding formula...
51
The national funding formula for schools and high needs Policy document September 2017
Transcript of The national funding formula for schools and high needs ... · The final national funding formula...

The national funding formula for schools and high needs Policy document September 2017

2
Contents
Foreword 3
Chapter 1: background and information 5
Chapter 2: structure of the school funding system 7
A ‘soft’ schools formula 7
The pupil premium plus 9
Chapter 3: a national funding formula for schools 10
Introduction 10
The final national funding formula 11
Pupil-led funding (basic per-pupil funding and additional needs funding) 12
School-led funding 17
Area cost adjustment 20
Transition to the formula in 2018-19 and 2019-20 23
Impact of the national funding formula 25
Chapter 4: a national funding formula for high needs 30
Background 30
Additional high needs funding for 2018-19 and 2019-20 30
Final design of the high needs funding formula 31
Impact of the high needs funding formula 37
Flexibility to move funding from schools into high needs 38
Chapter 5: a national funding formula for central school services 39
Background 39
Chapter 6: implementation and next steps 41
Arrangements for allocating funding in 2018-19 41
Arrangements for allocating funding in 2019-20 45
Next steps 48

3
Foreword
I want every child in England to have the opportunity to achieve their full potential for themselves and for our country. Too often it is someone’s background that determines what they can achieve, rather than their talent or hard work. Children and young people from disadvantaged backgrounds remain far less likely to receive the support and opportunities that they need to set them on the path to success. Those
who are able but poor are often overtaken by children who had a more advantaged start in life. This is not a new problem, and we know that there is no quick fix for social mobility. But we will not shirk from addressing this generational challenge so that we can make Britain a country that truly works for everyone.
This government has already taken significant steps towards creating an education system that will help achieve this: more schools are currently judged as good or outstanding by Ofsted than ever before, and the attainment gap between disadvantaged pupils and their better-off counterparts is closing. However, the existing, unfair funding system undermines further progress. Schools serving pupils with similar characteristics are given significantly different levels of funding with little or no justification. It is right that we hold all our schools to the same standards; but it cannot be right that some schools have so much less to invest in teachers and resources than other schools with similar pupils and needs.
That is why our manifesto promised to make funding fairer, and we are delivering on that promise. The national funding formulae we are introducing for schools, and for pupils with high needs, will help to make sure that all of our children get the high quality education they deserve. It represents the biggest improvement in the approach to the school funding system for decades; and it is a step that previous governments have failed to take for far too long.
We have consulted widely and considered the impact of the formula on schools across the country, and have taken the views of schools and communities into account to make sure that funding will be distributed in the fairest and most effective way. Alongside this, we are investing an additional £1.3 billion for schools and high needs, on top of our previous spending plans, across the next two years to support transition to the formulae. In 2018-19 and 2019-20, this means that we can maintain real terms per pupil funding for schools and high needs. We are delivering on the Government’s manifesto pledge to make school funding fairer and will ensure that all areas and schools benefit as a result of our formula. And we can set a formula that:
• maximises pupil-led funding, so that the lowest funded schools have their needs properly recognised;

4
• protects funding for disadvantaged pupils and those with additional needs; and,
• ensures stability by providing for some gains for all schools, alongside rapid gains for those that are underfunded.
The additional funding also means that we can make similar increases to high needs funding, and every local authority will receive more than they planned to spend on high needs from their 2017-18 dedicated schools grant.
The formula will rightly result in a significant boost directed towards the least well-funded schools, rural schools, and those schools with high numbers of pupils starting with low attainment. The formula redresses the historic inequities in funding that have existed for too long, whilst maintaining stability so that schools are not disadvantaged in the process. After too many years in which the funding system has placed our schools on an unfair playing field, we are finally making a decisive move towards fair funding.
Of course, how schools spend their money is just as important as the fair allocation of funding. Parents and taxpayers expect schools to look carefully at how they can use their funding so that as much resource as possible is focused on enabling great teachers to improve outcomes for pupils. My department will continue to increase the support offered to schools to maximise their efficiency – both for individual schools and across the system as a whole.
The national funding formulae for schools and high needs and the increased investment we are making in schools will help us to continue improving standards and create a world-class education system. It sits alongside our reforms in early years and technical education and is a vital element of our commitment to social mobility. On this firm foundation, we will all – government and schools, teachers and parents – be able to build a schools system that finally allows every child to achieve their potential, no matter what their background.
Rt Hon Justine Greening

5
Chapter 1: background and information 1. Since 2010, we have been reforming the school funding system so that it is
fairer, simpler and more transparent. Our consistent aim has been a system that means schools and local authorities will be funded on an up-to-date assessment of need that reflects the characteristics of their pupils. In 2013-14, we took action to make the local funding system simpler and easier to understand and in 2015-16, we provided an ongoing £390 million boost to the least well-funded local areas. The national funding formulae for schools and pupils with high needs that we are introducing in 2018-19, alongside our additional investment in schools of £1.3 billion on top of the budget set at Spending Review 2015, represent the next and most significant step on this journey.
2. In spring 2016, we consulted on the principles that should underpin the school and high needs funding system, and the factors that our new national funding formulae should contain. We then held an extensive consultation – launched in December 2016 – on the details of the formulae, setting out the relative weighting between the factors, the unit values for each and illustrating the impact the resulting formulae would have. Through these consultations, we have also gathered views on how the formulae should be implemented and how the funding system should operate.
3. The responses to our consultations have all been carefully considered and we have now made our final decisions on the funding system and the national funding formulae that will be introduced from April 2018. Our analysis of the responses to the schools and high needs consultations and the formal government response are published alongside this document.
4. The national funding formulae that we are putting in place will enable us to create a funding system that is:
a. Fair and supports opportunity – so that it reflects current pupil characteristics and not historic allocations that are based on out-of-date data. It will support schools and local authorities to extend opportunity to all pupils and to promote social mobility.
b. Efficient – so that resources are matched to need.
c. Getting more funding to the frontline – we want to empower school leaders to maximise the resources available for teaching.
d. Transparent – we are publishing the full detail of how our national funding formulae have been calculated and illustrating the impact they will have on every school and local authority in the country.

6
e. Simple - we have kept the national funding formulae as simple as possible, while ensuring we are striking the right balance between simplicity and accuracy to ensure funding is properly aligned to need.
f. Predictable – the national funding formulae have been set to the end of the current spending period. We are providing clarity over how funding will be allocated in 2018-19 and how we expect to transition towards the formula. We are also illustrating indicative allocations for 2019-20.
5. The national funding formulae will replace the current outdated postcode lottery with a system that will distribute funding fairly and consistently. They are transparent and based on up to date data. The funding illustrations we are publishing alongside this document will enable everyone to see how much funding each school attracts through the formula and how much each local area will receive.
6. This document explains the changes we are making to the school funding system to support the introduction of the national funding formulae. It sets out the detail of the final formulae, explains their impact, and how they will be implemented. For additional detail on the principles underpinning the formulae, or the rationale for specific factors, please refer to the first stage and second stage consultations.

7
Chapter 2: structure of the school funding system 7. As we set out in the first stage of our consultation, and confirmed in the
operational guide to local authorities we published in August, we are changing the structure of the dedicated schools grant (DSG). The DSG is the main grant that the government allocates to local authorities for education provision in their areas. With the exception of the pupil premium plus grant for looked after children (see more information below), other grants outside the DSG such as the main pupil premium and universal infant free school meal funding are unaffected by these changes.
8. The DSG is currently divided into three notional blocks: schools, high needs and early years. From 2018-19 we are introducing a fourth block: the central school services block. The central school services block will fund local authorities for the statutory duties that they hold for both maintained schools and academies. It brings together:
a. funding for ongoing responsibilities, such as admissions, previously top-sliced by each local authority from its schools block allocation;
b. funding previously allocated through the retained duties element of the education services grant (ESG); and
c. Residual funding for historic commitments, previously top-sliced by the local authority from the schools block.
9. The funding local authorities receive in each block (schools, high needs, early years and central school services) will be determined by a specific national funding formula. National funding formulae will be used to allocate local authorities’ schools, high needs and central school services blocks for the first time in 2018-19. The detail on each of these formulae are set out in the relevant chapters of this document. Funding for early years has been allocated through a national funding formula since 2017-18. This document does not cover the early years formula.
A ‘soft’ schools formula 10. It remains our long-term intention that schools’ budgets should be set on the
basis of a single, national formula (a ‘hard’ national funding formula). But we recognise that this represents a significant change, and the importance of stability for schools was a consistent theme during both stages of the consultation. So, as confirmed to parliament in July, in 2018-19 and 2019-20 the schools formula will be a so called ‘soft’ approach.
11. Under a ‘soft’ system, we use the national funding formula to set notional budgets for each school. These are aggregated to give the total schools block

8
budget for each local authority1. You can see the notional budget for each school, and the aggregated schools block funding for each local authority, published alongside this document. For the next two years, local authorities will continue to set a local formula to distribute their schools block funding, in consultation with their local schools and their schools forum. Each local area will therefore be funded on a fair and equitable basis, according to the national funding formula.
12. Local authorities will then distribute their block allocation between maintained schools and academies and, although it will be a local decision, we are adjusting the rules governing the setting of local formulae so that the national formula can be more closely mirrored. Changes to those arrangements are set out in the schools revenue funding operational guide. Further details on how funding allocations will operate in 2018-19 and 2019-20, and next steps beyond that, can be found in chapter 6.
Moving funding between the blocks
13. We confirmed in our response to the first stage consultation that the schools block will be ring-fenced from 2018-19. This means that the vast majority of schools block funding allocated to local authorities must be passed directly to schools. But as outlined to parliament in July, local authorities will have limited flexibility to transfer funding to other areas, such as high needs, where this best matches local circumstances. Such transfers are limited to 0.5% of authorities’ total schools block, and can only be made with the agreement of the schools forum.
14. When seeking agreement to transfer any funding out of their schools block, local authorities will be expected to demonstrate to their schools forum that they have consulted locally with all maintained schools and academies. Local authorities should set out clearly the reasons for the transfer and, if the transfer is to their high needs budget, how it sits with the local authority’s long-term planning for provision for children and young people with SEN and disabilities. There will be a process for considering any reasonable requests for exceptions to these rules. Further detail on transfers of funding from the schools block can be found in the schools schools revenue funding operational guide.
15. Whilst the other blocks are not subject to limits on transfers (other than the early years pass-through requirement), local authorities are strongly
1 Published notional school budgets for local authority maintained schools are based on 2017-18 Authority Proforma Tool data. Published notional school budgets for academies and free schools are based on 2017/18 General Annual Grant data. Published local authority budgets are based on 2017-18 Authority Proforma Tool data for all schools. Local authority schools block budgets for 2018-19 will be finalised in December using updated pupil numbers.

9
encouraged to consult their schools and agree with their schools forum any other proposal to move funding between blocks.
16. We intend to update the School and Early Years Finance (England) Regulations and conditions of grant associated with the DSG to reflect the new system for 2018-19.
The pupil premium plus 17. In the stage one national funding formula consultation response we confirmed
that we would target support for looked-after children and children who were previously looked after through the pupil premium plus, rather than include a looked-after children factor in the national funding formula. This was welcomed by respondents.
18. We have transferred the total amount spent through looked-after children (LAC) factors in local formulae in 2017-18 from the DSG to the pupil premium plus budget. As a result of this transfer, the 2018-19 pupil premium plus rate will be £2,300.
10
Chapter 3: a national funding formula for schools
Introduction
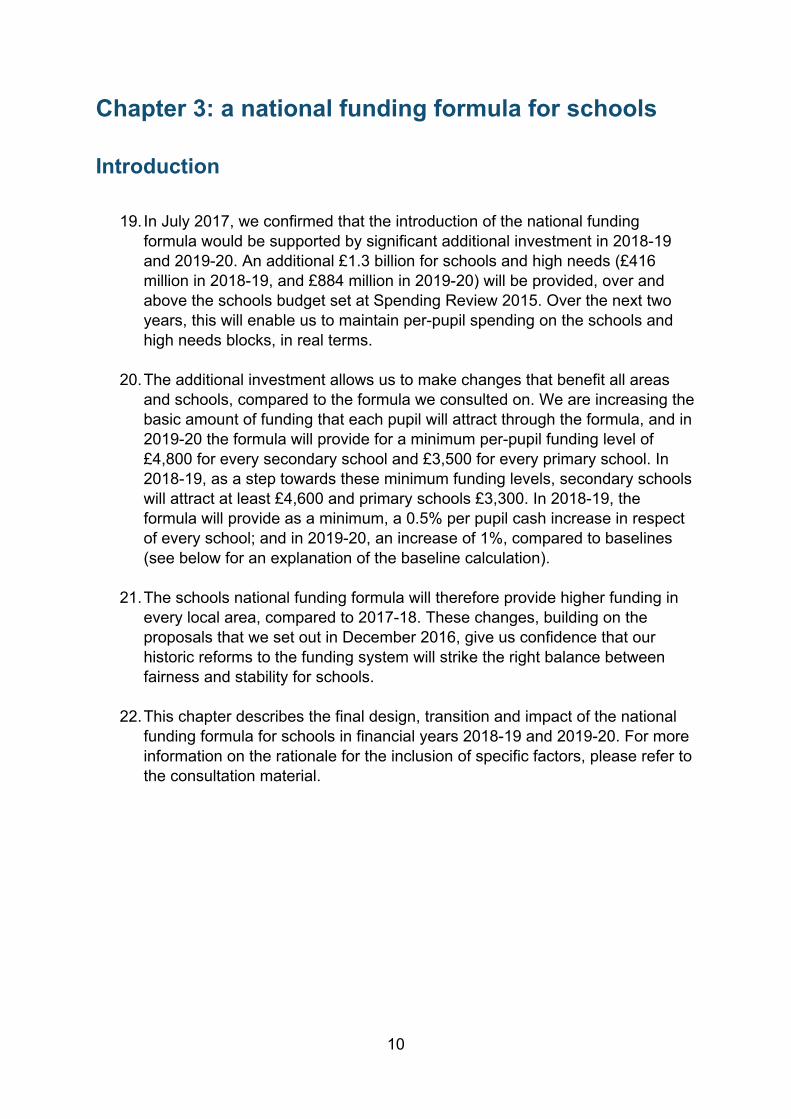
19. In July 2017, we confirmed that the introduction of the national funding formula would be supported by significant additional investment in 2018-19 and 2019-20. An additional £1.3 billion for schools and high needs (£416 million in 2018-19, and £884 million in 2019-20) will be provided, over and above the schools budget set at Spending Review 2015. Over the next two years, this will enable us to maintain per-pupil spending on the schools and high needs blocks, in real terms.
20. The additional investment allows us to make changes that benefit all areas and schools, compared to the formula we consulted on. We are increasing the basic amount of funding that each pupil will attract through the formula, and in 2019-20 the formula will provide for a minimum per-pupil funding level of £4,800 for every secondary school and £3,500 for every primary school. In 2018-19, as a step towards these minimum funding levels, secondary schools will attract at least £4,600 and primary schools £3,300. In 2018-19, the formula will provide as a minimum, a 0.5% per pupil cash increase in respect of every school; and in 2019-20, an increase of 1%, compared to baselines (see below for an explanation of the baseline calculation).
21. The schools national funding formula will therefore provide higher funding in every local area, compared to 2017-18. These changes, building on the proposals that we set out in December 2016, give us confidence that our historic reforms to the funding system will strike the right balance between fairness and stability for schools.
22. This chapter describes the final design, transition and impact of the national funding formula for schools in financial years 2018-19 and 2019-20. For more information on the rationale for the inclusion of specific factors, please refer to the consultation material.

11
The final national funding formula
23. Figure 1 shows the 14 factors that will comprise the national funding formula for schools. The minimum per-pupil level is an additional factor to the 13 included in our original proposals. Figure 3 (at the end of this section) shows the unit values, total funding and proportion of funding for each factor in the formula. This section considers each factor in turn and how we have reached final decisions.
Figure 1: Factors in the schools national funding formula
Figure 1: This illustrates the factors that will be taken into account when calculating schools block DSG funding allocations through the national funding formula. It is not designed to scale. Funding for factors in italics will be allocated to local authorities in 2018-19 on the basis of historic spend.
Primary to secondary funding ratio
24. A key consideration in the formula is the ratio of funding between the primary and secondary phases. Since 2013-14, this ratio has remained relatively stable in local authority formulae at an average of around 1:1.29. This means that funding per pupil is on average 29% higher overall in the secondary phase than in the primary phase, and we proposed to reflect that average in the national funding formula.
25. We received various representations throughout the consultation about the ratio, but there is no compelling evidence or consensus at present that suggests the overall balance should be shifted towards primary or secondary. We have therefore decided to use the national average ratio in setting the unit values in the national funding formula. This proposal had the greatest support from those who responded to the relevant question in the consultation, compared to shifting the ratio in either direction.

12
26. It is important to be clear that this is a national weighting used to determine the unit values in the formula overall. The actual ratio observed in the funding each individual local authority is allocated through the formula will depend on the characteristics of the pupils in that area, for example the proportion of primary to secondary pupils. The choices made locally about the structure of education provision will also make a difference, for example an area with a high proportion of small primary schools may have a ratio that is more generous to primary schools than an area with the same population split, but fewer, larger primary schools. As a result, it is not the case that a uniform 1:1.29 ratio will be seen nationwide.
Pupil-led funding (basic per-pupil funding and additional needs funding)
27. A key design principle of our formula is that we are maximising the proportion of funding allocated to pupil-led factors (rows A and B of Figure 1) compared to the current funding system. This is so that as much funding as possible is distributed in relation to pupils and their characteristics. In 2017-18, local authorities plan to allocate 89.6% of their funding through pupil-led factors. In the national funding formula, this will be 90.7%.
28. The great majority of pupil-led funding is used to provide a basic amount for every pupil, including securing a minimum per-pupil level for every school. The rest provides funding for pupils with additional needs. Whilst some respondents to the consultation suggested the amount for additional needs should be reduced, we believe it is important and right to protect the funding actually directed towards pupils with additional needs by local authorities. To ensure we are doing this, the national funding formula allocates a greater proportion for additional needs than is explicitly allocated by local authorities currently. This is because in areas of high deprivation, some local authorities choose to set high basic per-pupil funding and relatively low deprivation funding, because all their schools typically have a high proportion of disadvantaged pupils.
29. We have listened to concerns raised through the consultation about the impact of maximising pupil-led funding and allocating a greater proportion for additional needs than is explicitly allocated by local authorities currently. In particular, many respondents raised concerns about the implications of these proposals for small schools and those with lower levels of additional need. We have used the additional £1.3 billion investment over the next two years to make changes that will benefit all schools, in particular by increasing basic per-pupil funding. Further information on these changes and the balance between basic per-pupil and additional needs funding is set out in more detail in the section below.
13
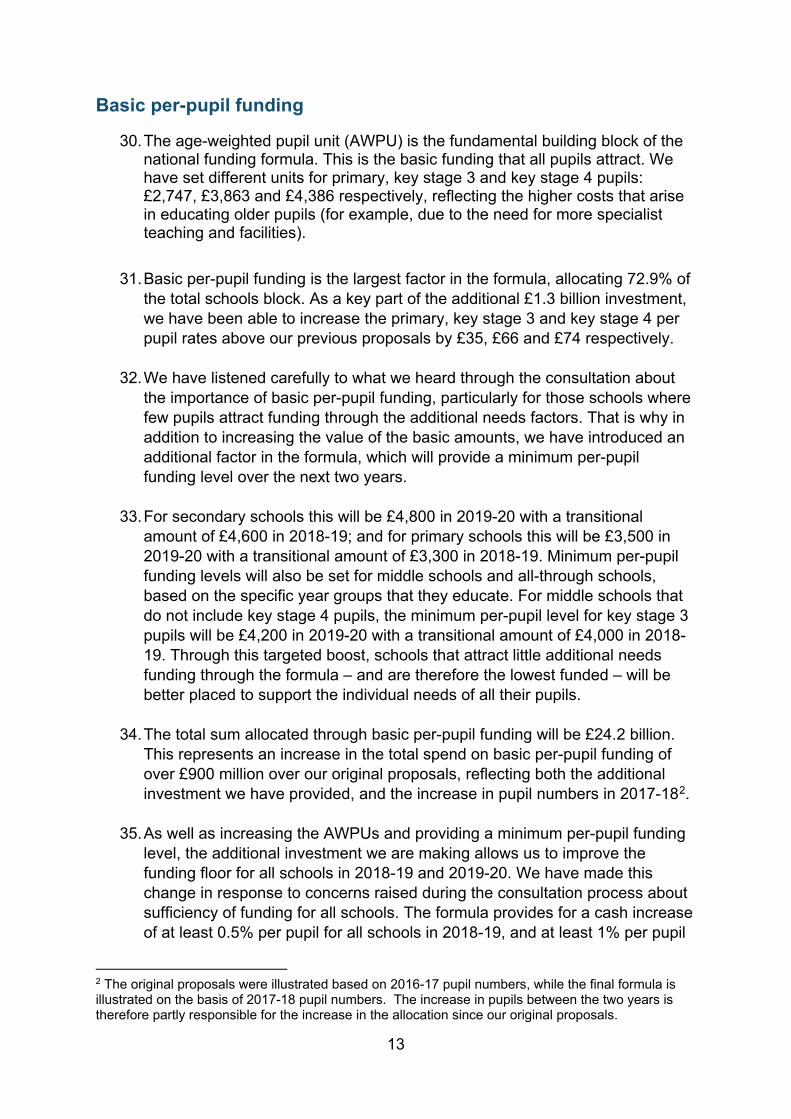
Basic per-pupil funding
30. The age-weighted pupil unit (AWPU) is the fundamental building block of the national funding formula. This is the basic funding that all pupils attract. We have set different units for primary, key stage 3 and key stage 4 pupils: £2,747, £3,863 and £4,386 respectively, reflecting the higher costs that arise in educating older pupils (for example, due to the need for more specialist teaching and facilities).
31. Basic per-pupil funding is the largest factor in the formula, allocating 72.9% of the total schools block. As a key part of the additional £1.3 billion investment, we have been able to increase the primary, key stage 3 and key stage 4 per pupil rates above our previous proposals by £35, £66 and £74 respectively.
32. We have listened carefully to what we heard through the consultation about the importance of basic per-pupil funding, particularly for those schools where few pupils attract funding through the additional needs factors. That is why in addition to increasing the value of the basic amounts, we have introduced an additional factor in the formula, which will provide a minimum per-pupil funding level over the next two years.
33. For secondary schools this will be £4,800 in 2019-20 with a transitional amount of £4,600 in 2018-19; and for primary schools this will be £3,500 in 2019-20 with a transitional amount of £3,300 in 2018-19. Minimum per-pupil funding levels will also be set for middle schools and all-through schools, based on the specific year groups that they educate. For middle schools that do not include key stage 4 pupils, the minimum per-pupil level for key stage 3 pupils will be £4,200 in 2019-20 with a transitional amount of £4,000 in 2018-19. Through this targeted boost, schools that attract little additional needs funding through the formula – and are therefore the lowest funded – will be better placed to support the individual needs of all their pupils.
34. The total sum allocated through basic per-pupil funding will be £24.2 billion. This represents an increase in the total spend on basic per-pupil funding of over £900 million over our original proposals, reflecting both the additional investment we have provided, and the increase in pupil numbers in 2017-182.
35. As well as increasing the AWPUs and providing a minimum per-pupil funding level, the additional investment we are making allows us to improve the funding floor for all schools in 2018-19 and 2019-20. We have made this change in response to concerns raised during the consultation process about sufficiency of funding for all schools. The formula provides for a cash increase of at least 0.5% per pupil for all schools in 2018-19, and at least 1% per pupil
2 The original proposals were illustrated based on 2016-17 pupil numbers, while the final formula is illustrated on the basis of 2017-18 pupil numbers. The increase in pupils between the two years is therefore partly responsible for the increase in the allocation since our original proposals.

14
by 2019-20, compared to 2017-18 baselines (with the exception of new and growing schools, for which we use ‘if full’ baselines, as explained below). This replaces the floor we originally proposed in the formula, which would have allowed schools to see a reduction in funding of up to 3% per pupil. This is the minimum extra amount that the formula will allocate to each school – the majority of schools will attract greater per pupil gains in each of these years.
36. For all schools except those that are new and growing, the 2017-18 baselines for the purposes of the gains cap and funding floor are calculated by reference to the school’s pupil led funding, and any difference between the school’s historic lump sum and sparsity funding and national funding formula lump sum and sparsity funding. A more detailed explanation is set out in the national funding formula technical note.
37. For new and growing schools we will calculate the 1% cash increase compared to the baseline funding they would have received in 2017-18 if they were full. Schools that are new attract high per-pupil funding while they are growing, because the lump sum they attract is initially a larger proportion of their budget than it would be if they were full. As these schools grow to their full pupil complement, their per-pupil funding will naturally fall (although their total funding will rise). In line with the approach proposed in the second stage consultation, we have therefore used an ‘if full’ baseline to calculate whether such schools need protection, in recognition of this effect.
Funding for pupils with additional needs
38. The consultation responses confirmed the importance of funding for pupils with additional needs – deprivation, low prior attainment, English as an additional language and mobility. Evidence shows that pupils with these characteristics are more likely to fall behind, and to need extra support to reach their full potential. It is vital that schools are supported to tackle these issues, if we are to improve social mobility. We have accordingly set values and weightings for these that:
a. Protect the actual funding directed towards pupils with additional needs by local authorities, taking appropriate account of some local authorities’ decisions to set high basic per-pupil funding and relatively low deprivation funding, because all their schools typically have a high proportion of disadvantaged pupils; and
b. Distribute that funding more fairly than currently and in line with the evidence on attainment.

15
Deprivation
39. The formula allocates £3.0 billion for deprived pupils – this represents 9.1% of total funding3. As we set out in our consultation, pupil deprivation will be identified through two indicators: eligibility for free school meals (FSM) (where this will be current eligibility and historic eligibility through the Ever6 measure), and the level of deprivation in the postcode where the pupil lives (measured using IDACI4). In the consultation, both measures received some support, but there were also concerns raised about the accuracy of both FSM and IDACI in measuring deprivation. No single deprivation measure will adequately fund deprivation, which is why we continue to believe we should use a basket of indicators in order to ensure that schools attract adequate funding for deprivation. By using both income and area based measures we are able to reach a broad range of pupils (more than 44%) including those further up the income scale in ordinary working families. This compares with 26.6% that would be reached using FSM eligibility alone.
40. The final formula protects the values of deprivation factors at the levels we proposed originally. Pupils attracting funding through the IDACI factor are divided into 6 bands, reflecting the relative levels of deprivation of the areas they live in (bands A to F, with band A representing the most deprived areas). In our original proposals, we set the IDACI band C and D values the same, because the steps between the bands were based on local authority formulae from 2016-17 which did not differentiate between bands C and D.
41. We have reflected on the IDACI banding following our analysis of the consultation responses and stakeholder engagement, and in particular on the concerns raised about the accuracy of the measure in capturing deprivation. We have therefore made a sensible minor technical adjustment to increase the band C unit value slightly, so that it sits halfway between bands B and D. This will better reflect the higher levels of deprivation faced by children living in band C areas, compared to those in band D areas. Unit values for all the deprivation indicators can be seen in Figure 3.
Low prior attainment
42. Prior attainment data is an important tool for schools to identify pupils who are likely to need extra support. Research has shown that a pupil’s prior attainment is the strongest predictor of their likely later attainment.5
3 We have protected spending on additional needs from the December consultation. The percentage of spend on additional needs is therefore lower than in December because we have increased the overall budget. 4 Income deprivation affecting children index (IDACI) measures the proportion of children in an area living in income-deprived families, including those in receipt of Working Tax Credit or Child Tax Credit with an equalised income below 60 per cent of the national median before housing costs. This measure is used to provide funding for schools based on the relative socio-economic deprivation of the areas in which their pupils live. 5 Taggert B and others, UCL Institute of of Education, University College London, Birkbeck, University of London, University of Oxford, ‘Effective pre-school, primary and secondary education (EPPSE 3-

16
43. We are allocating 7.4% of the total national funding formula (£2.5 billion) in
respect of pupils with low prior attainment. Within additional needs funding, the national funding formula places a heavier emphasis on low prior attainment than current local authority allocations of £1.4 billion (4.3%) while keeping the overall level of investment in additional needs consistent with the average of current local authority practice. Some respondents raised concerns about the risk of adverse incentives related to this factor; however we think that this risk is very small and mitigated by the robust accountability system. We believe it is right that pupils with low prior attainment attract more funding through the national funding formula because of the strength of evidence of its value as an indicator of educational need, above and beyond deprivation.
44. A pupil who does not achieve the expected level in the Early Years Foundation Stage Profile on entry to primary school will attract an additional £1,050 a year through the formula, throughout their time in primary school. A pupil who does not achieve the expected level at key stage 2 will attract an additional £1,550 a year while in secondary education. These are the same unit values as those proposed in our original formula.
45. The low prior attainment funding unit value is currently the same for all pupils, whether they narrrowly missed the standard or were at the bottom of their cohort. As proposed in the second stage consultation, we will consider whether tiering this factor in the longer term might improve our targeting of funding to those with the highest level of need.
English as an additional language
46. Pupils who speak English as an additional language (EAL) will also attract additional funding through the national funding formula. It is important that pupils with EAL attract additional funding because of the costs that can be associated with providing them with support at school. A pupil with EAL will attract funding if they have entered the state education system during the last three years.
47. The national funding formula will allocate £404 million through the EAL factor – this represents 1.2% of the total formula spend.
48. Not all local authorities currently use an EAL factor in local formulae, or apply it in the same way. In 2017-18, £296 million (0.9%) was allocated by 139 local authorities through EAL factors. Because we are extending the coverage of the factor across the country and applying it consistently without reducing the average per pupil spend, the overall allocation and proportion of additional needs funding directed towards EAL is slightly higher.
16+)’, 2008; Sutherland A, Ilie S, Vignoles A, RAND Europe and the University of Cambridge ‘Factors associated with achievement: key stages 2 and 4’, November 2015 https://www.gov.uk/government/publications/factors-associated-with-achievement-key-stages-2-and-4

17
49. A primary school pupil will attract an additional £515 and a secondary school pupil will attract an additional £1,385. These are the same values we proposed in the original formula.
50. The school census now requires schools to report annually on the written and spoken English language proficiency of their individual EAL pupils, using a five-point scale that ranges from “new to English” to “fluent”. This census data may allow us to identify pupils who are in the early stages of English proficiency, and who therefore need more support, more accurately than the current EAL measure. We will keep the data under review and assess its appropriateness for inclusion in the funding system in future.
Mobility
51. The mobility factor in the national funding formula is intended to support schools that have a high proportion of pupils joining the school mid-way through the academic year. Where there is a high proportion of mobile pupils, costs can be significant for schools.
52. As we explained in our consultation, national data on mobility is not yet sufficiently robust to be used to allocate funding on a formulaic basis. We will instead allocate funding to local authorities on a historic spend basis. In 2018-19, the formula will provide local authorities with a cash sum that reflects the amount they distributed through their mobility factor in 2017-18.
53. In 2018-19, the formula allocates around £22 million for mobility. As proposed in the second stage consultation, we will continue to work on developing an accurate and robust indictor of mobility, in consultation with key stakeholders, to replace the use of historic spending patterns for this factor in future.
School-led funding Lump sum
54. Every school will attract a lump sum of £110,000 through the formula. The total spend on the lump sum is £2.3 billion and represents 6.8% of the total schools block. The purpose of the lump sum is to make a contribution to the costs that do not vary with pupil numbers, and to give schools (especially small schools) certainty that they will attract a fixed amount each year in addition to their pupil-led funding.
55. We have considered the level of the lump sum carefully, particularly in the context of maximising pupil-led funding and encouraging efficiency. We have also looked closely at the evidence for varying the level of the lump sum for primary and secondary schools. In 2017-18, the majority of local authorities apply the same lump sum for primary and secondary schools. Among the local authorities that do vary the lump sum by phase, there is not a clear pattern to the variation or indeed which phase attracts the higher sum.
56. The majority of respondents to this consultation question supported a higher value for the lump sum for both primary schools and secondary schools,

18
primarily because of concerns about the viability of small schools and those schools that do not attract sufficient funding through the additional needs factors. We have responded to the concerns raised about these schools through the wider changes we have set out in this document (such as the minimum per-pupil funding levels).
57. We therefore believe that £110,000 for both primary and secondary schools strikes the right balance in the formula. Additionally, when the lump sum is coupled with the sparsity factor, detailed below, we are confident that this provides sufficient support for the small and remote schools that play an essential role in rural communities. A small, rural primary school will attract up to £135,000, in total, through the lump sum and sparsity factors. The average gain for primary schools in rural areas is 3.8% and the average gain for primary schools in sparse rural areas is 6.7%. Furthermore, the decision to introduce a positive funding floor will protect schools whose historical lump sum payments were higher than £110,000, as the difference in their lump sum will be included in their baselines.
Sparsity
58. We recognise that some schools are necessarily small because they are remote and do not have the same opportunities to grow or make efficiency savings as other schools. These schools can be especially important to their local communities and ensure children do not have to travel long distances to school. Together with the lump sum, the sparsity factor in the formula is designed to provide important support for these schools.
59. Eligibility for sparsity funding depends on the distance the pupils in the school would have to travel to their next nearest school and the average number of pupils per year group.
60. The formula allocates £26 million through the sparsity factor. Primary schools qualifying will attract up to £25,000 and secondary schools (including middle and all-through schools) up to £65,000. The funding is tapered to avoid cliff edges, where small pupil number changes would otherwise result in schools moving from significant additional funding to no sparsity funding. The funding taper is illustrated in Figure 2 below. There is also a floor in the sparsity factor so that the smallest remote schools attract the full sparsity sum.
61. As noted above, we have set the level of sparsity funding in the national funding formula with reference to the lump sum. This means that, overall, while we reduce reliance on funding that is not pupil-led and encourage efficiency, we continue to target significant additional resources to small schools in remote areas.
62. We recognise the concerns raised through the consultation on the use of ‘as-the-crow-flies’ distances in calculating eligibility for the sparsity funding, and are mindful that this measure could be improved. We will work with local authorities and schools to explore how this methodology can be refined in future. We want to be sure that any changes to the definitions or measurements will improve how well the sparsity factor targets need. In the

19
meantime, local authorities will continue to have some flexibility over how the sparsity factor works in local formulae.
63. More detail on the operation of the sparsity factor in the national funding formula is set out in the schools national funding formula technical note.
Figure 2: The sparsity sum taper for each phase
Figure 2: This graph shows the proportion of the sparsity sum a school will receive, by school type.
Premises
64. The national funding formula will allocate funding to reflect some of the costs associated with a school’s premises and overheads, as well as their pupils’ characteristics. Premises-related funding will be allocated through four factors: rates, split-sites, private finance initiative (PFI) and exceptional circumstances.
65. In 2018-19, the formula will allocate what local authorities plan to spend on rates, split-sites and exceptional circumstances in their local formulae in 2017-18. Funding for PFI will be allocated on the same basis, but uprated annually in line with RPIX6 – reflecting the indexation of PFI contracts and evidence received through the consultations. The total planned spend on these premises factors in 2017-18 is £610 million. This represents 1.8% of the total national funding formula.
6 RPIX is the retail price index all items excluding mortgage interest. For more information, please see https://www.ons.gov.uk/economy/inflationandpriceindices/timeseries/chmk/mm23

20
66. We will say more in due course about how we will fund the premises factors in 2019-20 and what our options are for funding them through a ‘hard’ formula in the longer term. We will need to work with local authorities and schools to consider options in detail and consider any interim improvements.
Growth
67. The national funding formula will also allocate funding to enable local authorities to respond where significant growth in pupil numbers occurs in-year and is not immediately recognised by the lagged funding system. This is important because local authorities need to ensure every child has access to a high quality school place.
68. Local authorities currently handle in-year growth in two different ways. They can create a growth fund by top-slicing DSG for allocation in-year; or they can adjust the pupil numbers used to calculate growing schools’ local formula allocations. They may also retain some funding to create a budget for good and outstanding schools with temporary falling rolls.
69. In 2018-19, the growth factor will be allocated on the basis of what each local authority plans to spend, in total, on growth in 2017-18 – this totals £174 million and represents 0.5% of the total formula spend. This total is the sum of the total local growth fund, funding allocated through pupil number adjustments, and the falling rolls fund.
70. As part of our consultation, we asked for views on funding in-year pupil growth by using lagged pupil growth data. We are mindful that whilst funding on the basis of historic planned spend is an improvement on the current system (which gives no recognition to growing areas), it is not a long-term solution, because it assumes future growth will follow the same pattern as historic growth.
71. There was not a strong consensus in the consultation about the most effective approach. We will continue to look at the options for funding growth in 2019-20 and beyond. We continue to believe there is merit in the use of lagged growth data, as it would provide early certainty in allocation and, over time, ensure every local authority is funded on the basis of the actual growth they experience. We will also explore further the options of using projections and in-year adjustments, or funding growth directly in real time.
Area cost adjustment 72. The national funding formula will reflect the variation in labour market costs
across the country. We will apply a hybrid area cost adjustment (ACA) which takes into account the general labour market trends and the particular salary variations in the teaching workforce.
73. The ACA is applied to qualifying schools’ allocations once the rest of the formula has been run – it inflates the allocation using a multiplier. Funding distributed according to historic funding levels, the minimum per-pupil funding, the 1% per pupil floor and premises funding are excluded from the ACA.

21
Nationally the ACA ranges between 1.00 and 1.18. For some schools, how much their allocation is adjusted depends on the local district area in which the school is located. Some local authorities – in ‘London Fringe’ areas – contain both districts that receive an ACA, and districts that do not. Whether schools in these local authorities receive an uplift will depend on their specific location.
74. Since we consulted on the proposed national funding formula in December 2016, we have updated the data we use to calculate the ACA to reflect the latest workforce census data (which affects the teachers’ pay element of the adjustment) and the latest published data on schools’ spending on pay and non-pay, which sets the balance between the teachers’ pay and general labour market elements of the ACA. This data update means that some schools and local areas will see a slightly different ACA multiplier applied to their funding allocation. The technical detail on how the ACA applies to individual notional allocations for schools is set out in the schools national funding formula technical note.

Figure 3 - The Final National Funding Formula
Funding Factors Unit values
Total Funding (including ACA)
Proportion of core total
Basic per-pupil funding £24,183m 72.9% Age Weighted Pupil Unit (AWPU): Primary £2,747 £12,595m 38.0% Age Weighted Pupil Unit (AWPU): Secondary - KS3 £3,863 £6,668m 20.1% Age Weighted Pupil Unit (AWPU): Secondary - KS4 £4,386 £4,734m 14.3% Minimum per pupil funding level NA £185m 0.6% Additional needs funding £5,906m 17.8% Deprivation £3,022m 9.1% Current FSM top up (Pupils currently claiming FSM at the last census): Primary £440 £291m 0.9% Current FSM top up (Pupils currently claiming FSM at the last census): Secondary £440 £173m 0.5%
FSM6 (Any pupil that has ever claimed FSM in the past 6 years): Primary £540 £626m 1.9% FSM6 (Any pupil that has ever claimed FSM in the past 6 years): Secondary £785 £641m 1.9% IDACI band F: Primary £200 £94m 0.3% IDACI band F: Secondary £290 £80m 0.2% IDACI band E: Primary £240 £101m 0.3% IDACI band E: Secondary £390 £95m 0.3% IDACI band D: Primary £360 £131m 0.4% IDACI band D: Secondary £515 £108m 0.3% IDACI band C: Primary £390 £123m 0.4% IDACI band C: Secondary £560 £102m 0.3% IDACI band B: Primary £420 £165m 0.5% IDACI band B: Secondary £600 £135m 0.4% IDACI band A: Primary £575 £88m 0.3% IDACI band A: Secondary £810 £69m 0.2% Low prior attainment £2,458m 7.4% Low prior attainment: Primary £1,050 £1,531m 4.6% Low prior attainment: Secondary £1,550 £928m 2.8% English as an additional language £404m 1.2% English as an additional language: Primary £515 £299m 0.9% English as an additional language: Secondary £1,385 £106m 0.3% Mobility £22m 0.1% School led funding £3,077m 9.3% Lump sum £2,267m 6.8% Lump sum: Primary £110,000 £1,892m 5.7% Lump sum: Secondary £110,000 £375m 1.1% Sparsity £26m 0.1% Sparsity: Primary £25,000 £21m 0.1% Sparsity: Secondary £65,000 £5m 0.0% Premises £610m 1.8% Explicit Growth £174m 0.5% Area Cost Adjustment: A multiplier that is applied to basic per pupil, additional needs and school led funding (ACA is already included in each of the factor subtotals)
£824m
Core Total (Excluding funding floor) £33,166m Funding Floor £624m Total (including funding floor) £33,790m
Figure 3: This table shows the unit values, total funding and proportion of funding for each factor in the formula. To note, total funding is rounded to the nearest £1m. Proportion of core total funding is rounded to the nearest 0.1%. The total funding and proportion of core total funding columns are based on implementing the formula in full, without transition, using 2017-18 authority proforma tool data and 2017/18 general annual grant data.

Transition to the formula in 2018-19 and 2019-20
Delivering gains
75. The national funding formula, the unit values and resulting weightings we have set out in this chapter will apply in 2018-19 and 2019-20.
76. As set out in the second stage consultation, there will be a maximum level of gain for most schools through the formula each year. The gains cap will be 3% per pupil in 2018-19 and a further 3% per pupil in 2019-20. For 2019-20, this is an increase over the 2.5% set out in our December 2016 proposals. Spending plans beyond 2019-20 will be set in a future Spending Review.
77. There are a small number of schools for which the baseline used for calulating the gains cap (as explained above is very low. These are typically very small schools that are receiving low lump sums through their local formula. These schools would be disadvantaged through the 3% gains cap methodology we are applying. These schools’ pupil-led baselines are so low that a 3% gains cap would result in very small cash increases7. We have reflected on this, particularly for small schools. We will therefore limit gains to the greater of 3% of a school’s baseline or 20% of their remaining formula cash gains. This variation to the gains cap methodology will provide for more reasonable year-on-year increases for 3.6% of schools in 2018-19. More information about how the gains cap methodology is applied is set out in the technical notes published alongside this policy document.
The minimum per-pupil level
78. While we are confident that this approach to gains is right for schools, we received many representations through the consultation that faster increases are required in respect of the lowest funded schools. We are committed to ensuring that the lowest funded schools attract the minimum per pupil funding levels we have set in the formula (£4,800 for secondary schools and £3,500 for primary schools) in 2019-20. As a transition to those amounts, secondary schools will attract a transitional minimum of £4,600 in 2018-19, and primary schools a transitional minimum of £3,300.
79. The minimum per-pupil levels and transitional amounts will therefore not be subject to the gains cap methodology we have outlined above. This is so that the lowest funded schools will attract a rapid boost in funding. These schools could therefore be allocated more than 3% per pupil in a year through the formula, in order to ensure that they attract the minimum per pupil level in 2019-20 (or the transitional amount in 2018-19). More detail on how we calculate the minimum per pupil level for each school is set out in the technical note to be published alongside this document.
80. Schools can see an illustration of how much they would attract to their local authority through the formula in 2018-19 with the gains cap, 0.5% floor and
7 For example, a small-baseline school with a small pupil count could be limited to total gains above their baseline of less than £500 per year under the 3% gains cap alone.

24
transitional funding applied, in the tables that we have published alongside this policy document.
The funding floor
81. The formula will provide for an increase of at least 0.5% per pupil in 2018-19 and at least 1% per pupil by 2019-20 in respect of all schools compared to their baselines. As we explained earlier in this chapter the baseline used will for most schools be their 2017-18 per-pupil funding, and for new and growing schools it will be their per-pupil funding if they were full.

25
Impact of the national funding formula 82. In 2018-19 and 2019-20, the schools block funding for each local authority will
be set by calculating notional allocations for each school according to the national funding formula. These will then be aggregated and used to calculate a total allocation for each local authority. Actual individual school budgets in 2018-19 and 2019-20 will be determined by the local formulae set by local authorities in consultation with schools and the schools forum. As we describe in chapter 2, this is a ‘soft’ funding formula. It means that the school-level data we have published in the tables and quoting in this section is illustrative and will not directly determine what individual schools will receive in their budgets in 2018-19 and 2019-20, which will be set by local authorities.
83. The section below assesses the impact of the national funding formula if fully implemented without transition, based on 2017-18 data.
Comparison with December 2016 proposals
84. As set out above, compared to our proposals in December 2016 and in the light of consultation responses, we have made the following changes to the formula:
a. Age-weighted pupil units are £35 higher for primary pupils, £66 higher for key stage 3 pupils and £74 higher for key stage 4 pupils;
b. There will be a minimum per-pupil funding level of £4,800 for secondary schools and £3,500 for primary schools in 2019-20 with transitional levels of £4,600 and £3,300 in 2018-19. These levels are not subject to the gains cap;
c. All schools will be allocated an increase of at least 0.5% per pupil in 2018-19, and at least 1% per pupil by 2019-20, compared to their baselines. This replaces the minus 3% per pupil floor originally proposed;
d. IDACI band C has been slightly increased so that it provides a higher funding rate than band D, with increases of £30 per eligible primary pupil and £45 per eligible secondary pupil;
e. We have updated the area cost adjustment to take account of more recent data; and
f. The gains cap has been raised to 3% in 2019-20.
85. We have also updated all school and local authority level illustrations to take account of 2017-18 pupil numbers and characteristics (the illustrations published in December 2016 were based on 2016-17 data). Consequently, the impact of the final formula on schools and local areas is inevitably different from our original illustrative proposals.
86. All schools will attract higher levels of funding under the national funding formula with 8,405 or 42.3% of all schools set to gain over 3% and 4,240 or 21.4% over 6%.

26
87. Under the formula originally proposed, 9,128 or 46% of all schools would have seen reductions in funding (limited to 3% per pupil through the funding floor), with 7,603 schools seeing reductions between 1% and 3% per pupil.
88. 41.3% of schools will attract protection through the more generous floor in the formula. 2,068 or 10.4% of schools will attract the minimum per-pupil levels8. Schools that benefit from the floor in their NFF allocations are those that would otherwise have seen losses, or gains below 1% per pupil. Schools that attract the minimum per-pupil level are the lowest funded.
89. There is no change in the overall national distribution of funding between primary and secondary schools, because we have kept the same national average primary to secondary ratio (1:1.29) in the final formula. In individual local areas, as set out above, the national funding formula will not necessarily deliver a 1:1.29 ratio; the precise ratio that the national funding formula provides locally will depend on particular local circumstances. If a local authority’s primary to secondary ratio is significantly different to the ratio in the national funding formula, one phase is likely to gain more than the other.
Impact on funding attracted by individual pupils
90. The introduction of a national funding formula will result in pupils attracting funding on a comparable basis wherever they are in the country. The formula is designed to ensure that the level of funding that schools attract will reflect the degree to which their pupils are likely to need extra help to overcome barriers to their success. Evidence shows that particular characteristics are strong predictors of later outcomes and schools with high proportions of children with additional needs face the greatest challenges in enabling every pupil to leave the school system equipped with the knowledge they need to succeed in adult life. However, we have recognised the concerns raised through the consultation process about the overall sufficiency of funding for all schools. That is why we have increased the basic per pupil funding that all pupils will attract through the national funding formula, compared to our consultation proposals, through increasing the values of the AWPUs; and why we have introduced an additional factor in the formula, which will provide a minimum per pupil funding level.
91. Figure 3 shows the amounts that different types of pupil will attract through the national funding formula. Note that pupils who qualify for more than one factor attract the relevant sum for each individual factor to their school’s notional allocation: thus a primary pupil eligible for FSM and with EAL attracts a total of £4,242: the basic per pupil amount (£2,747) the FSM 6 amount and current FSM top up (£980) and the EAL amount (£515).
8 Note that there is an interaction between the floor and the minimum per pupil levels. For eligible schools we apply the per pupil minimum first and only then apply the funding floor if the minimum per pupil level does not result in an increase of at least 1% per pupil on 2017-18 baselines by 2019-20. Please see the technical note for a detailed description of the calculation.

27
Schools that are likely to see the greatest gains under the formula
92. Schools that attract the greatest percentage gains in funding are spread around the country, reflecting that in all areas there are schools that are particularly disadvantaged by the historical succession of funding decisions. However, certain types of schools are more likely to attract more funding as a result of the proposed formula. These include: • The lowest funded schools. The increase in basic per-pupil funding will
ensure that schools that have historically received the lowest funding will attract significant gains. Schools that currently have the lowest levels of funding overall will gain on average 6.0%. Secondary schools which would have been lowest funded under our December proposals will gain on average 4.7%.
• Schools with a high number of pupils with low prior attainment. The formula allocates more funding through this factor than local authorities collectively do now, so schools with high levels of low prior attainment are more likely to attract relatively greater gains. Schools with the highest levels of low prior attainment will gain on average 3.8% in total. The schools with the highest levels of pupils with low prior attainment, but not in areas of high deprivation, gain on average 4.4%.
• Schools with pupils who live in areas with above average levels of deprivation but who have not been heavily targeted through historic funding decisions. The inclusion of a wide definition of deprivation through the IDACI area-level deprivation data allows us to target funding more widely, to those who are more likely to have additional needs. Combined with the increased emphasis on low prior attainment, this means the formula has a broader definition of additional need than the average of current local authority formulae. Outside London, these schools gain 3.2% through the formula on average.
• Rural schools. Schools in districts identified as rural by the Department
for Environment, Food and Rural Affairs will gain on average 3.9% under the formula through our combined proposals on the lump sum and sparsity. Of these, schools meeting the criteria for the sparsity factor will gain on average 5.0%, which ensures that the higher costs of these schools are recognised.
Schools that are likely to see lower gains under the formula
93. While all schools will attract more funding, some schools will attract relatively lower percentage gains than others. These schools are likely to be those in Inner London and some other urban areas that have particularly benefited from historic funding decisions and where the fall in the underlying levels of

28
deprivation over recent years has not previously been reflected by the funding system.
94. However, these schools will still attract the highest funding levels of all schools, and will continue to receive the greatest share of pupil premium funding of any region relative to their size. Inner London schools will attract £6,126 per-pupil funding on average, in contrast to the national average of £4,662. Manchester, Knowsley, Nottingham, Liverpool and Birmingham will be the highest funded local authority areas outside of London.
95. Another factor explaining relatively lower percentage gains for London is the calculation of area costs. Historically this used a general labour market (GLM) approach, assuming that the additional costs of recruiting teachers across the capital would parallel the additional costs of recruiting general workers. However, we know the differentials on teachers’ pay between London and the rest of the country are smaller than general labour market differentials and thus the historical GLM ACA gave higher levels of funding to London than could be justified by the actual costs faced by schools. Moving to the hybrid approach better reflects actual costs, slightly reducing the level of additional funding provided to London.
Impact at local authority level
96. All local authorities will receive a higher level of funding per-pupil than they did in 2017-18. The local authorities that will see the highest percentage gain will be those that have a high proportion of the types of schools outlined above. The level of funding that each local authority will attract under the national funding formula is set out in tables published alongside this document.
Figure 4: Impact of the national funding formula at local authority level
Percentage increase in per pupil funding under the NFF
Number of local authorities
0-1% 12 1-2% 29 2-3% 24 3-4% 27 4-5% 26 5-6% 9 6-7% 11 7+% 12
Figure 4: This table shows the percentage change in schools block funding per pupil for local authorities as a result of the national funding formula if fully implemented without transition. All local authorities will see some increase in funding.

29
Impact on protected characteristics
97. We have published an updated equalities impact assessment to reflect the final decisions on the national funding formulae, and the latest data and allocations, which will be published alongside this document. This considers the impact of the national funding formulae on people with protected characteristics and sets out our response to the relevant points raised during both stages of consultation.

30
Chapter 4: a national funding formula for high needs
Background 98. The government provides over £5.8 billion per annum to local authorities to
support children and young people with high needs. Currently we allocate the vast majority of this funding on the basis of what local authorities were spending in 2012-13, which in turn is derived from local authority decisions and spending patterns in 2005-06. This money is spent on special provision for children and young people with special educational needs (SEN) and disabilities in schools and other institutions, and on alternative provision; and on specialist support and other services provided directly by local authorities. We updated the distribution for 2017-18 to reflect 2016-17 spending levels, but this remains directly linked to spending levels rather than to any estimate of levels of need.
99. We are committed to moving to a more rational basis for distributing funding for children and young people with high needs, taking into account an up-to-date assessment of the level of need in each area. In the first stage consultation, we asked which factors should be included within the high needs national funding formula, and in December, we launched the second stage of our consultation on a national funding formula, in which we:
a. proposed the weightings of the high needs funding formula factors;
b. proposed a funding floor to protect local authorities from reductions in high needs funding; and
c. discussed what level of local flexibility we should allow local authorities to transfer funding into their high needs budgets.
100. This chapter outlines our decisions on the final design of the high needs national funding formula, following the responses we received on these proposals; how the formula will be implemented over the next two years; and the overall impact on local authorities. Our analysis of the responses to the high needs consultation and the formal government response is published alongside this document.
101. We have also published a technical note showing how each local authority’s 2018-19 allocation of high needs funding has been calculated. The high needs funding operational guide is also be published alongside this document.
Additional high needs funding for 2018-19 and 2019-20 102. We set out in chapter 1 the additional funding of £1.3 billion that we are making
available for schools and high needs across 2018-19 and 2019-20. Funding for both schools and high needs will now be maintained in real terms per-pupil over the next two years. This will enable us to implement the high needs national funding formula such that:

31
a. Local authorities that are under-funded will see gains of up to 3% per year in each of 2018-19 and 2019-20, and,
b. Local authorities will be protected from losing funding under the formula and will instead see minimum increases of 0.5% per head in 2018-19 and 1% per head in 2019-20, on their planned high needs spending levels from 2017-18 DSG, through the operation of a more generous funding floor than was proposed in December.
103. Overall, on top of the 2017-18 spending levels, we are providing an extra £124 million in the 2018-19 allocations. As set out in the consultation, we are also making a transfer of £91 million from the high needs block to the schools block as core per-pupil funding for pupils in special units and resourced provision in mainstream schools will be funded from the schools block (rather than the high needs block) from 2018-19. In addition to the allocations published alongside this document, we also will take account of any changes in the numbers of pupils in special schools in the autumn term of 2017, when we provide final allocations for local authorities in December 2017.
104. By giving local authorities information about their allocations of high needs funding at this stage, they can plan with more confidence, knowing how much the great majority of their high needs funding will be. Two smaller elements of the formula - the basic entitlement factor, and import/export adjustment, both of which are determined by pupil numbers – will be updated later so that allocations can be based on the latest available data. For these parts of the formula, we are publishing firm per pupil rates now, so that local authorities can use their own estimates to calculate for themselves their likely final allocations.
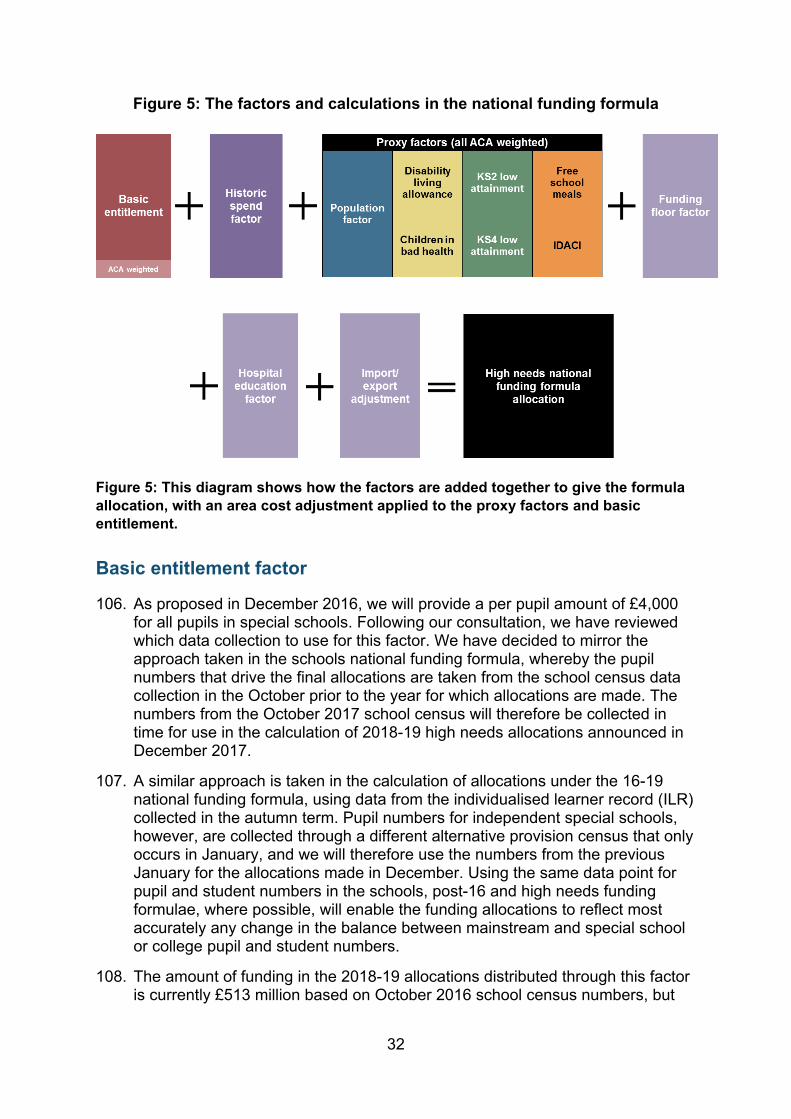
Final design of the high needs funding formula 105. Figure 5 sets out the basic design of the high needs funding formula, the
factors we have decided to include and the calculation steps in producing allocations for each local authority. Figure 6 shows the weightings and data inputs for each formula factor. Further detail on the formula is published in the technical note. Further information is also available in the impact of the high needs NFF table, so each local authority can understand how their allocation is calculated.
32
Figure 5: The factors and calculations in the national funding formula
Figure 5: This diagram shows how the factors are added together to give the formula allocation, with an area cost adjustment applied to the proxy factors and basic entitlement.
Basic entitlement factor
106. As proposed in December 2016, we will provide a per pupil amount of £4,000 for all pupils in special schools. Following our consultation, we have reviewed which data collection to use for this factor. We have decided to mirror the approach taken in the schools national funding formula, whereby the pupil numbers that drive the final allocations are taken from the school census data collection in the October prior to the year for which allocations are made. The numbers from the October 2017 school census will therefore be collected in time for use in the calculation of 2018-19 high needs allocations announced in December 2017.
107. A similar approach is taken in the calculation of allocations under the 16-19 national funding formula, using data from the individualised learner record (ILR) collected in the autumn term. Pupil numbers for independent special schools, however, are collected through a different alternative provision census that only occurs in January, and we will therefore use the numbers from the previous January for the allocations made in December. Using the same data point for pupil and student numbers in the schools, post-16 and high needs funding formulae, where possible, will enable the funding allocations to reflect most accurately any change in the balance between mainstream and special school or college pupil and student numbers.
108. The amount of funding in the 2018-19 allocations distributed through this factor is currently £513 million based on October 2016 school census numbers, but

33
this amount will change in response to the pupil numbers collected through the October 2017 school census and the ILR.
Historic spend factor
109. Following our consultation, we will proceed with allocating 50% on the basis of historic spending. This provides every local authority with an amount based on its existing high needs costs, and particularly those costs that may not be reflected by indicators of need used in the other formula factors. We recognise that some of the factors driving current costs will take time to change, as authorities review and develop their local offer, and decide carefully where to spend more and where to spend less. Including a historic spend factor in the formula helps to take account of this.
110. Earlier in 2017 we asked local authorities to provide information on the level of their planned spending on high needs in 2017-18. This information was collated, and the results of the exercise were published in August 2017. These spending baselines now form the basis of the historic spend factor amounts used in the formula. Following some adjustments explained in the technical note, the amount used in the calculation of each local authority’s high needs allocation is 50% of their spending baseline. This amount will remain the same in the calculation of high needs formula allocations for 2019-20. It will not be updated using data from 2018-19. The total amount of funding flowing through this factor is £2.7 billion.
Proxy factors
111. The remainder of the high needs block – £2.7 billion – will be distributed through the proxy factors. We proposed percentages for the proportion of funding going through each factor – which, overall, received good support. While some consultation respondents called for changes to the balance between overall population and the other proxy indicators (deprivation, low attainment, health and disability), there was no consensus or clear evidence in favour of a different approach, and we have therefore left the percentages as proposed when we consulted in December 2016.

34
Figure 6: High needs national funding formula factor weightings
Formula factor (and amount distributed in 2018-19)
Weightings Data we have used for
allocations SEN (90%)
AP (10%) Combined
1. Population (£1.4 billion) 50% 50% 50%
2-18 population projections for 2018 from the Office for National Statistics (ONS)
2. Deprivation (£541 million)
a. Free school meals (FSM) eligibility 8.3% 25% 10%
Number of children eligible for FSM as recorded in the January 2017 school census
b. Income deprivation affecting children index (IDACI) 8.3% 25% 10%
Number of children in bands A-F, using 2014 ONS population estimates
3. Low attainment (£406 million)
a. Key stage 2 (KS2) results
8.3% 0% 7.5%
Number of children not achieving level 3 or above in KS2 tests in 2012-15 and not attaining a scaled score in 2016
b. Key stage 4 results 8.3% 0% 7.5%
Number of children not achieving 5+ A* to G GCSEs in 2012-16
4. Health and disability (£406 million)
a. Children in bad health
8.3% 0% 7.5%
Number of children and young people in bad or very bad health, as reported in the 2011 population census
b. Disability living allowance (DLA) 8.3% 0% 7.5%
Number of children aged 0-16 for whom parents receive DLA as at November 2016
Figure 6: This table shows the weightings and data inputs for each formula factor.

35
Area cost adjustment
112. We have updated the ACA using the latest data, as explained in chapter 3, but using data specific to special schools. The ACA compensates local authorities where schools face the highest salary costs.
Population growth
113. Concern was expressed in the consultation about how population growth or increases in the number of children and young people with high needs would be reflected in the formula from year to year. Local authorities whose allocations were likely to be set by the funding floor would have found themselves in very different circumstances depending on whether the number of children supported by the high needs budget was rising or falling. We have therefore looked carefully at how to make the operation of the formula more responsive to demographic changes, and to make sure that the additional funding that we are making available for demographic growth is proportionately targeted to those authorities experiencing growth.
114. The use of population and other proxy factors in the formula will make sure that local authorities’ allocations will increase in proportion to their 2-18 population and the characteristics of that population. 2018-19 is the first year of the formula, so will be the starting point, with increases (or decreases) in population and changes in their characteristics driving funding changes in subsequent years. The basic entitlement factor will be adjusted in line with changes in pupil numbers in special schools, so any changes identified as a result of the October 2017 school census will be reflected in 2018-19, with adjustments in future years to reflect future changes.
115. However, to reflect the concerns mentioned above for those local authorities on the funding floor, and to reflect similar concerns that authorities would not see gains in proportion to their population changes, we have also decided to calculate the funding floor and gains on a per head of population basis. This means that those local authorities protected by the funding floor, and those gaining, both receive extra funding if their population is growing. This also fits better with the final approach we are taking on the schools national funding formula.
Funding floor
116. Overall, respondents agreed with our proposal for a 0% minimum funding floor, and agreed with the principle of protecting local authorities from reductions in funding as a result of the formula. However, as a result of the overall increase in funding for high needs that is now available for distribution, we are able to go beyond our original proposals, and:
a. raise the funding floor to provide an uplift of 0.5% in 2018-19 and 1.0% in 2019-20 over the relevant 2017-18 high needs spending baseline, mirroring what we are doing for schools funding;

36
b. ensure that the funding floor reflects any year on year increase in population by using a per-head calculation (as set out above);
c. prevent any local authority from losing funding if their overall 2-18 population is decreasing.
117. The detail of the calculation is explained in the technical note and further information can be found in the high needs impact table. It is important to note, however, that the funding floor calculation excludes the basic entitlement factor (see above) and import/export adjustment (see below). This ensures that the pupil and student movements from year to year that are captured by these elements of the formula translate fully into changes in funding. Consequently, it is possible that some local authorities protected by the funding floor will see their overall allocation of high needs funding increase by less than 0.5% and 1% in 2018-19 and 2019-20 respectively, if they have falling numbers of pupils or students in special schools.
Import/export adjustment
118. Apart from the basic entitlement factor (which reflects the number of children in special school places situated within a local authority, regardless of where the child lives), the high needs funding formula is designed to fund local authorities to meet the needs of children and young people who live in their area (regardless of where they are educated). The population and other proxy factors all use data inputs relating to the resident population rather than where they go to school or college.
119. Local authorities, however, face higher costs if they attract more pupils and students with high needs who live outside the local authority area into the school and college places that they fund (i.e. ‘imports’). Conversely, authorities that ‘export’ pupils and students to other local authority places face lower costs.
120. The import/export adjustment ensures the funding system reflects these differences in costs. It uses school census and ILR data on pupils and students who attract top-up funding. The calculation makes a comparison of the numbers occupying places in schools and colleges in the authority area, for which the local authority bears the cost of the places or core funding, and those for whom the authority pays top-up funding wherever they receive their education. Where those two numbers are in balance the costs are neutral and therefore no adjustment is required to the funding through the formula. Where there are more imports than exports, or vice versa, a positive or negative adjustment is made, using a unit value of £6,000. This represents the cost of the place funding, less the basic entitlement in special schools, or the equivalent in mainstream schools and post-16 institutions.
121. Accurate recording of the relevant information in the school census and ILR will be important to give local authorities confidence that their adjustment is being correctly calculated. The amount of the adjustment included in the high needs allocations published in September 2017 is based on the January 2017 school census and the 2016/17 ILR data collected in January/February 2017 (R06). Local authorities can see the overall numbers, as they could when we

37
published illustrative allocations in December 2016 for the consultation. In early October we will make available to local authorities the full data set so they can see the numbers that individual schools and colleges have provided. This will enable a discussion between local authorities and institutions about the numbers, and the basis for a mutually agreed number at the next school census or ILR data collection.
122. Having taken soundings from local authorities, and taking into account the issues that have arisen in the past relating to local authorities’ reluctance to pay for places occupied by pupils or students resident in other authority areas, we intend to minimise the lag between data and allocations in making this adjustment. We will therefore use January 2018 school census data and the 2017/18 R06 ILR data collected in February 2018 to make the final adjustment for 2018-19 allocations. This means that the import/export adjustment amounts in the September and December 2017 allocations of high needs funding will be provisional, and that the final adjustments will be made in a later DSG update.
Hospital education factor
123. As part of the exercise in early 2017 to collect 2017-18 planned spending information, we collected information about local authorities’ planned spending on hospital education. The amounts of planned spending on hospital education provided by local authorities were included in the baseline information published in August, and are the amounts used in the allocations of high needs funding published in September 2017.
124. We are increasing these amounts by 0.5% in the 2018-19 allocations and by 1.0% in the illustrative allocations for 2019-20, replicating the approach used in the funding floor calculation.
125. As in previous years, there will be an opportunity in autumn 2017 for local authorities to submit evidence of changes in health care provision that have a clear impact on the provision of hospital education and the consequent need for funding. The Education and Skills Funding Agency (ESFA) will provide more information about the notification of such changes. Any funding adjustments resulting from this process will be incorporated after the December 2017 announcement of high needs funding allocations, in later DSG updates.
126. We are continuing to work on better ways of distributing funds for hospital education, including education provided in child and adolescent mental health services (CAMHS), and will consult on proposals in due course.
Impact of the high needs funding formula 127. We have calculated allocations for 2018-19 and illustrative allocations for 2019-
20. The latter assume no change to population data or other data, and are therefore subject to later data updates.
128. The formula will affect the distribution of high needs funding between local authorities. Our assessment of the impact of the formula on individual pupils

38
and students with protected characteristics can be found in the equalities impact assessment.
129. The funding floor adjustment provides all local authorities with an increase of 1.0% per-head of population by 2019-20, compared with their 2017-18 adjusted baselines. The later updates to the basic entitlement factor and import/export adjustment may reduce the increase for some authorities where they are providing for fewer children and young people with high needs. Local authorities that have been historically underfunded according to the formula will see greater gains. Those gains are calculated on a per-head of population basis to make sure that those authorities with higher population increases will not lose out.
130. There will be differences between the gains that the formula will be providing to local authorities and the gains indicated in the illustrative allocations that were published in December 2016. These differences have resulted mainly from using the updated 2017-18 spending baselines, which will have reflected changes in spending from the baselines used in the consultation illustrations. If, for example, local authorities have moved funding into their high needs budgets, from schools or central school services funding, any gains under the new formula might not be as much as previously indicated.
Flexibility to move funding from schools into high needs 131. The second stage of the consultation recognised that a degree of flexibility
between the DSG funding blocks would be needed to ensure that local authorities could manage their high needs budget. Local authorities will therefore be able to transfer up to 0.5% of their schools block funding into their high needs budget, with the agreement of their schools forum. As set out in chapter 2, there will be a process for considering any reasonable requests for exceptions to these rules. Further detail on transfers of funding from the schools block can be found in the schools revenue funding operational guide.
132. It is important that any decision to transfer funding from schools to high needs is taken in the context of the local authority’s strategic approach to the planning of future provision for children and young people with SEN and disabilities, linked to the review and development of the local offer as required by the Children and Families Act 2014. Such activity has been helpful in enabling local authorities to manage their high needs budgets more effectively. Further information is available in the schools revenue funding operational guide.
133. We have provided funding for every local authority, and produced guidance and a benchmarking tool, to support authorities in this work. We will continue to look for ways to offer support, including publishing an update of the benchmarking tool as new data becomes available.

39
Chapter 5: a national funding formula for central school services
Background 134. In the first stage of consultation, we proposed to introduce a central school
services block within the DSG to reflect the ongoing local authority role in education. This will ensure local authorities can continue to carry out their important role in supporting the provision of excellent education for all children of compulsory school age. In the second stage of consultation, we confirmed we would proceed with the creation of the central school services block as planned.
135. The central school services block will be created from two existing funding streams: the DSG funding that is held centrally by the local authority for central services, and the retained duties element of the ESG, which is funding for duties which local authorities hold in respect of all schools.
136. Funding will cover two distinct elements which will be handled separately within the formula: ongoing responsibilities and historic commitments.
137. As set out in the second stage of consultation, we will distribute funding for ongoing responsibilities to local authorities using a simple formula which distributes 90% of funding according to a per-pupil factor and 10% of funding according to a deprivation factor. Both elements will be adjusted for area costs.
138. The central school services block will also provide funding for historic commitments. Funding will be allocated based on evidence, with the expectation that historic commitments will unwind over time, for example because a contract has reached its end point. The ESFA will monitor historic spend year-on-year and will challenge Section 251 returns where spend is not reducing as expected. We believe that this is the fairest and most appropriate way to provide funding for historic commitments, and the proposals received good support through the consultation. In keeping with current policy, no new commitments will be allowed.
Transition
139. Given the extremely wide range in current expenditure for ongoing responsibilities, it is important that we balance the rate of change against the need to make progress towards the formula.
140. The transition to the formula for ongoing responsibilities will be gradual – with gains and losses capped each year so that the formula is affordable and the transition is manageable. A protection will be in place in 2018-19 and 2019-20 that limits reductions to 2.5% per-pupil a year. The level of gains will be set annually and will depend on the precise composition of the central school services block in each year. In 2018-19, gains of up to 2.5% per pupil will be allowed.

40
141. Funding for historic commitments will be based on the actual cost of the commitment. Funding will reduce as commitments cease. There will therefore be no protection for historic commitments in the central school services block.
Impact
142. Under the central school services block formula, 87 local authority areas will see their funding increase. The local authorities that will gain are all in different regions and have made different decisions about how to fund central services. However, the amount of money currently spent in these areas is significantly lower than similar local authorities in other areas of the country, which is why on average they will have increased investment. Local authorities which have been spending considerably more than the central school services block allocates will see reductions in funding. However the protection will ensure that no local authority will face losses of more than 2.5% per pupil in 2018-19 or 2019-20.
143. As set out in the second stage of consultation, data shows that local authorities with similar characteristics spend very different amounts delivering the same services. We believe that higher spending local authorities should be able to adjust their spend to bring them in line with other local authorities that spend less delivering the same services and achieve similar outcomes.

41
Chapter 6: implementation and next steps 144. The preceding chapters have set out the detail of the national funding formulae
that will be used to calculate local authorities’ funding allocations for schools, high needs and central school services in 2018-19 and 2019-20. This chapter outlines how funding allocations will work in practice in 2018-19, and the next steps.
Arrangements for allocating funding in 2018-19 145. Alongside this policy document we have published tables that detail local
authorities’ 2018-19 allocations for each block of the DSG. This chapter provides more information on these allocations. We have also published detailed tables setting out step-by-step how these allocations have been calculated. Both of these can be found in the national funding formula summary table, which will be published alongside this document.
146. These allocations are based on adjusted baselines. Earlier this year we undertook an exercise with local authorities to ‘re-baseline’ the blocks of the DSG, so that, where local authorities had decided to move funding between their DSG blocks in 2017-18 compared to what they were allocated, we could
How figures are described
In this document, and throughout the tables and other published materials, we are using the following terminology to describe local authority and school allocation figures:
• Notional allocations illustrate what the schools national funding formula allocates in respect of each school in 2018-19. The final budgets that schools will actually receive will be determined by local authorities’ individual funding formulae and will be based on more up-to-date data.
• Provisional allocations are the local authority level block allocations that we have calculated based on the national funding formulae. It is this overall amount locally that the local authority then allocates to schools. These will be updated for the latest data, as they are each year. This is described in detail below in respect of each block of the DSG.
• Actual allocations are the fixed funding levels that we are confirming and which will not be updated for pupil numbers or other data changes. For the schools and central school services national funding formulae, these are expressed as per pupil units of funding.
• Illustrative funding levels are given for 2019-20 and if the formulae were fully implemented without transition. These are based on pupil number and characteristics data from 2017-18, and are therefore purely illustrative. They are not what schools or local authorities will attract in future years, as actual allocations will always be based on the latest data.

42
reflect this in the baselines we are using for the national funding formulae. These baselines were published in August.
147. Re-baselining ensures that the totals we are allocating nationally for each of the schools, high needs and central school services blocks in 2018-19 reflect what local authorities actually planned to spend from their DSG on each block in 2017-18. It also means that the protections we are applying to each block are against what authorities planned to spend in 2017-18 from their DSG. It should reduce the need for future transfers between blocks.
148. In August we published the schools revenue funding operational guide setting out the arrangements for local authorities’ school budget setting in 2018-19. Publication of the operational guide helped local authorities to begin designing and modelling their individual schools’ formulae over the summer, ahead of consultation with local schools in the autumn term. We will update this to reflect the full detail of the formula and will also publish a high needs funding operational guide later this month.
Allocating school block funding in 2018-19
149. Alongside this document, we are confirming per-pupil units of funding for each local authority based on the national funding formula9. These will allow local authorities to complete the design of their schools formulae and agree this locally over the coming months. As in previous years, these per-pupil units of funding will be multiplied by the latest pupil numbers from the October 2017 census. Total cash schools block allocations will then be confirmed in December 2017 as usual.
150. The major difference this year is that we are giving local authorities separate primary and secondary per-pupil units of funding and a separate central school services block. Splitting the calculation by phase in this way allows us to more accurately reflect changes in the distribution of primary and secondary pupils locally, which is particularly important as the demographic growth in pupil numbers reaches the more costly secondary phase. The actual per-pupil primary units of funding (PUF) and actual per-pupil secondary unit of funding (SUF) for each local authority can be found in the impact of the schools NFF table, published alongside this document.
151. In calculating these per-pupil units of funding we have:
a. Used the schools national funding formula to calculate a notional allocation for every school for 2018-19. This is the amount of money the formula would allocate to that school including: gains of up to 3% for those schools attracting increases in their funding; the minimum gain of 0.5% for all schools through the funding floor; and the minimum per pupil funding levels. Note that these notional allocations are
9 We published a guaranteed minimum amount per pupil in August, alongside the operational guide. These were based on local authority baselines for 2017-18, and therefore provided the minimum amount that each authority would receive. The actual per pupil units of funding we are now confirming give each local authority an increase based on the national funding formulae.

43
calculated using pupil number and characteristics data from the October 2016 census;
b. Aggregated the notional allocations for all primary schools in each local authority to give a provisional primary total for that authority, and the same for all secondary schools to give a provisional secondary total;
c. Excluded the ‘implicit’ growth in these totals, as growth is being funded separately. This essentially captures growth funding that local authorities have allocated through adjusting the pupil count for some schools in their Authority Proforma Tool (APT) return. Further detail on how we have calculated “implicit” growth for each school and authority can be found in the technical notes published alongside this document; and
d. Divided the provisional primary total for each local authority by the primary pupil count for that authority from the October 2016 census to give the actual PUF. And divided the provisional secondary total by the secondary pupil count to give the actual SUF.
152. We have then separately calculated an actual cash amount for each local authority in respect of those formula factors that are being allocated on a historic basis in 2018-19: premises, mobility and growth. This cash amount is what the authority told the Department they were spending on these factors in 2017-18, plus an uplift for inflation on PFI. More detail on how these factors are being calculated for 2018-19 can be found in chapter 3.
153. The provisional primary and secondary totals have been combined with this fixed cash amount for the historical factors to give the provisional 2018-19 schools block allocation for each local authority. These can be found in the NFF summary table, to be published with this document. Further detail on all these calculations can be found in the technical note.
154. As set out above, in the autumn we will use data from the October 2017 census to calculate an actual schools block allocation for each local authority. We will multiply each authority’s PUF by its new primary pupil count to give an actual primary total. We will multiply each authority’s SUF by its new secondary pupil count to give an actual secondary total. These totals will be combined together with the fixed cash amount (which will be unchanged) to give an actual schools block allocation for each authority, which we will publish in December.
155. Once we have published actual schools block allocations in December, local authorities will then confirm final 2018-19 allocations to maintained schools in line with the usual timetable, and the ESFA will determine academy allocations for 2018/19 based on the relevant local formula. Local authorities are responsible for complying with the ESFA’s Authority Proforma Tool process. This process, together with the requirements for local formulae, are detailed in the operational guide which was published in August.
156. The distribution of funding to individual schools in 2018-19 will therefore be determined locally, and will not necessarily reflect the notional allocations published alongside this document. In particular, as set out above, the published notional school allocations are calculated on the basis of pupil

44
characteristics data and pupil numbers from the October 2016 school census. When local authorities determine final school budgets, they will do so on the basis of more current characteristics data and pupil numbers from the October 2017 census. This means that if a local authority decides to move their local formula values in line with the national funding formula, schools whose characteristics have changed between October 2016 and October 2017 would not see the same budget resulting. For instance, if a school sees a drop in the proportion of pupils with additional needs, their funding per pupil would decrease appropriately to reflect this.
157. Local authorities will continue to set a minimum funding guarantee (MFG) in their local formulae to protect schools from excessive year on year changes. Greater flexibility is being introduced in 2018-19 to allow authorities to set the MFG between 0% and minus 1.5% per pupil following local consultation – rather than it being set nationally at minus 1.5% per pupil, as in previous years. This protects schools from excessive turbulence, but ensures local authorities have the flexibility to move towards the national funding formula. Further detail is set out in the school revenue operational guide.
Allocating high needs funding in 2018-19
158. We have also published allocations of high needs funding, indicating the vast majority of the actual amount that each local authority will receive in 2018-19.
159. The allocations include gains of at least 0.5% per head for all local authorities, and up to 3% per head for those local authorities due to gain funding under the formula.
160. The basic entitlement factor and import/export adjustment in the high needs formula are the two elements that will be updated with latest pupil numbers. They are calculated with an actual per-pupil rate. The rest of the published allocations are actual fixed amounts for each local authority, subject only to changes to hospital education notified by authorities. This means that, for the first time, we have been able to provide detail and certainty on high needs funding allocations in advance of the December DSG announcement. Further detail on the allocations and updates can be found in chapter 4.
Allocating central school services funding in 2018-19
161. Alongside this document, we have published local authorities’ provisional central school services block allocations for 2018-19. This is made up of an actual per-pupil rate for ongoing responsibilities, based on the central schools services block national formula and an actual fixed cash amount for historic commitments, based on authorities’ historic spend.
162. As with the schools block, the published provisional allocations use the October 2016 pupil count to calculate the provisional total for ongoing responsibilities. In December, final allocations will be calculated by multiplying the actual per pupil rate by the October 2017 pupil count.
45
163. Local authorities will be responsible for consulting their schools forums on how to allocate their central school services block funding, details of which are set out in the operational guide. The operational guide also sets out restrictions on how authorities can spend their allocations, and that authorities have flexibility to move money from their central school services block into other DSG blocks if they wish.
Arrangements for allocating funding in 2019-20 164. The process for allocating funding in 2019-20 will be largely as set out above.
The national funding formulae will be used to calculate local authorities’ allocations for schools, high needs and central school services in the same way as for 2018-19, using the latest available data. We will calculate actual units of funding for the schools block and central school services blocks, and these will be used to calculate final allocations based on the October 2018 pupil count. The high needs block will have an actual allocation for the vast majority of the allocation followed by later updates for the basic entitlement factor and import/export adjustment calculations.
165. The illustrative funding figures we have published alongside this document for 2019-20 are calculated using the national funding formulae, but are based on current data. Local authorities can use these illustrations as a guide to their likely funding level for 2019-20 to help them plan their budgets to a longer timescale than has been possible before. Schools may wish to use these illustrations as a guide to what their school might attract to their local authority in 2019-20, noting that in 2019-20, under a ‘soft’ formula, their budget will be determined by a local formula and the characteristics of their pupils may be different.
166. In calculating allocations it is important to note that the funding floor will continue to protect schools (for the schools block) and local authorities (for the high needs and central school services blocks) against their 2017-18 baseline. The calculation of gains and other transitional protections will work on a year-on-year basis and will start from the 2018-19 notional allocations.
167. For the historic commitments element of the central school services block, we will allocate funding on the basis of planned spend in 2018-19; however, ESFA will continue to monitor planned spend on historic commitments and will challenge Section 251 returns where spend is not reducing as expected.
168. As we set out in the school revenue funding operational guide we will not be repeating the baseline exercise for 2019-20, so any transfers authorities make between their DSG blocks will therefore be for one year only.
169. Authorities will design and agree local formulae to distribute funding to their schools. We will set out the rules that will govern this process in 2019-20 next year, including the rules on authorities’ flexibility to move funding between the DSG blocks

46
Support for efficiency in schools
170. Overall funding for schools and its distribution is obviously important, but how that funding is used in practice is just as vital. Alongside our substantial investment, we are committed to helping schools improve outcomes for pupils and promote social mobility by getting the best value from all of their resources. Effective school leaders know this is a key part of their role – core to school improvement, not an add-on or extra. Parents and taxpayers across the country expect nothing less.
171. We want to help and support all schools to make better financial decisions and improve their productivity. Since the School Efficiency and Financial Health programme was first launched in January 2016, the department has been working with schools to develop the additional practical support, deals and tools that help all schools improve their efficiency. Some of our actions and interventions operate across the school system as a whole. Other actions are more focused on individual schools or groups of schools.
172. To support efficiency improvements across the school system, we will:
• Transform the funding system. The national funding formula will ensure that money is allocated in line with need, and in a way that is transparent, predictable and will help schools to plan ahead strategically.
• Improve the infrastructure of the school estate. We will continue to invest in upgrading school buildings, including to reduce running costs. We will take a strategic approach to managing surplus places, balancing the benefits and costs of additional school places.
• Support partnership working. We will support multi-academy trusts, federations and other school partnerships to maximise the benefits of sharing resources and economies of scale.
173. To help individual schools increase their efficiency, we will provide support focused on major areas of spend. We will:
• Help schools to get the best value from their non-staff expenditure. Our high level analysis indicates that if the 25% of schools spending the highest amounts on each category of non-staff expenditure were instead spending at the level of the rest, this could save over £1 billion. This would then be available for reinvestment in frontline teaching. We will continue work to deliver the ambitious initiatives set out in the Schools’ Buying Strategy (published in January 2017), to help schools get the best value for money from their non-staff expenditure and secure these savings. This includes negotiating the best value National Deals on key areas of spend and piloting two regional Buying Hubs, which will provide advice and guidance to help schools with complex buying. The National Deals are already delivering savings for schools and, going forward we will expand the coverage of the Deals currently available. We expect schools to justify to their governors and trustees if and why they choose not to take advantage of the initiatives that we are making available.
• Support schools in managing their workforce. Staff pay is the single largest item in a school budget and typically represents over 70% of

47
school expenditure. We will provide support to schools – on issues like managing teacher workload, implementing flexible working, the recruitment of supply staff and the effective deployment of support staff – so that as much resource as possible is focused on enabling teachers to improve outcomes for pupils.
174. We will also work with schools to make it easier for them to understand and compare their use of resources with other schools, and intervene when schools are at risk of falling in to financial difficulty. We will:
• Improve data and the transparency of information, so that governors and trustees can hold schools to account for the way they spend their resources. Benchmarking and comparisons, which make schools aware of the performance of schools that are similar to them, can be a powerful tool for change. They can also provide a basis for governors and trustees to challenge school leaders on how resources are used and on the school’s relative performance. We already make benchmarking data publicly available, as well as providing the Benchmarking Report Card directly to schools. Through tools such as the Schools Financial Value Standard, we provide a common framework for all schools to assess and understand their overall efficiency and financial management. We will take this further by creating consistent metrics across the sector for schools to assess their levels of efficiency and hold themselves to account, including piloting benchmarking data on schools workforce.
• Continue to develop schools’ capability for effective financial management. School business professionals say that they often feel professionally isolated in their roles and can lack the levers to bring about school-wide change. We will enhance the supply of, upskill and raise the status of school business professionals. We will support school business professionals to work with their local communities and networks to get the best value from their school’s assets.
• Provide hands-on support to schools at risk. It is right for the department to intervene – directly with academies, or working with local authorities in the case of maintained schools – when a school is at risk of falling into financial difficulty. We will deploy experienced efficiency experts to provide direct support to these schools.

48
Figure 7
Figure 7: Summary of support on efficiency and financial health
Next steps 175. This document sets out the national funding formulae for distributing schools
and high needs funding on a more rational basis. These formulae will be the basis for allocations in 2018-19 and 2019-20, supported by the additional investment announced to parliament in July. Spending plans beyond that will be set out in a future Spending Review.
Next steps on the schools national funding formula
176. As we made clear in both our second stage consultation and throughout this document, there are elements of the schools national funding formula where our data and indicators could continue to improve. We will continue to work with stakeholders and experts across the sector in doing so. In particular, we will develop factors as follows:
• Low prior attainment – we will consider further longer term changes to improve targeting of funding to need, including the possibility of tiering the secondary low prior attainment factor;
• Growth – we will explore options for funding growth in the future including the use of projections and in-year adjustment;
• Mobility – we will continue working with stakeholders on developing an accurate and robust indicator of mobility to replace the use of historic spending patterns for this factor in the future;
Across the System as a Whole
Transform the funding system
Improve the infrastructure of the school estate
Support partnership working between schools
School-Level Support
Areas of spend Help schools to get the best
value from their non-staff expenditure
Support schools in managing their workforce
Cross cutting Improve data and the transparency
of information
Continue to develop schools’ capability for
effective financial management
Provide hands-on support to schools at risk

49
• Premises including PFI – we will work with local authorities to understand their planned spend on premises factors between 2017-18 and 2018-19 and explore how funding of PFI could be improved in the future;
• Sparsity – we recognise the concerns raised on the use of ‘as-the-crow-flies’ distance measures in calculating eligibility for sparsity funding and will work with local authorities and schools to explore how this measure could be refined in the future;
• EAL – we will explore the potential for using the school census data to more accurately identify pupils who are in the early stages of English proficiency.
177. We have been clear that local authorities will continue to determine school budgets for 2018-19 and 2019-20. We recognise that the introduction of a schools national funding formula is a major reform that has been many years in the making. It is important that we allow this reform to bed in, and learn from what local authorities do in their local formulae as a result of these significant changes. We will keep authorities’ local formulae under review and assess the impact of our reforms on individual schools’ funding levels over the coming years. It remains our aim that all schools should be funded on a consistent basis across the country, and therefore our objective remains to move to a ‘hard’ national funding formula in time.
Next steps on high needs funding
178. As we set out in our previous consultations, to inform future development of the high needs funding formula, we will undertake more research to look at the factors that are driving costs, and whether there are new or different proxy indicators that could be used to improve the formula. In the light of this research, we plan to review the formula for high needs within four years.
179. We signalled in the previous consultation documents some further areas of high needs funding on which there was scope for further development and improvement.
180. The overall amount of funding distributed through the high needs national funding formula does not currently include any place funding for special free schools. The budget for this is held centrally by the department. We have decided not to introduce changes to this arrangement for 2018-19, but are considering potential changes to the handling of special and alternative provision free schools’ place funding in due course. Taking into account the development of policy on alternative provision, we will also explore more widely whether any consequential funding changes should be considered.
181. We have also acknowledged that there may be a case for considering future changes to the way that high needs funding is distributed to colleges, schools and other institutions catering for students aged 16 to 25 who have high needs. Concerns about this aspect of high needs funding were expressed in the responses to the consultation on the national funding formula. We recognise the need to proceed with care, addressing the underlying issues in the context

50
of wider changes to further education, and in due course will decide on what changes to propose, and what the timetable for any changes should be.
Next steps on central school services funding
182. The total amount of funding in the central school services block is based on the ongoing responsibilities held by local authorities. If we make changes to local authorities’ legal obligations in future, the total amount of funding for the central school services block will need to change to reflect this.
183. We will also consider how to treat funding released from the historic commitments element of the central school services block and will confirm our approach at a later date.

51
Crown copyright 2017
This publication (not including logos) is licensed under the terms of the Open Government Licence v3.0 except where otherwise stated. Where we have identified any third party copyright information you will need to obtain permission from the copyright holders concerned.
To view this licence:
visit www.nationalarchives.gov.uk/doc/open-government-licence/version/3 email [email protected] write to Information Policy Team, The National Archives, Kew, London, TW9 4DU
About this publication:
enquiries www.education.gov.uk/contactus download www.gov.uk/government/publications
Reference: DFE-00259-2017
Follow us on Twitter: @educationgovuk
Like us on Facebook: facebook.com/educationgovuk