THE NATIONAL EDUCATION GOALS REPORT
358
THE NATIONAL EDUCATION GOALS REPORT Building a Nation of Learners 1997
Transcript of THE NATIONAL EDUCATION GOALS REPORT

THE NATIONAL EDUCATION
GOALS REPORT
Building a Nationof Learners
1997
i, ii, & Chapter 1 10/30/97 12:06 PM Page i

ii
National Education Goals Panel
The National Education Goals Panel (NEGP) is a unique bipartisan and intergovernmental body of federal and state officials created in July 1990 to assess and report state and national progress toward achieving the National Education Goals. In 1994, the Goals Panel became
a fully independent federal agency charged with monitoring and speeding progress toward the eight National Education Goals. Under the legislation, the Panel is charged with a variety
of responsibilities to support systemwide reform, including:
• Reporting on national and state progress toward the Goals over a 10-year period;• Working to establish a system of high academic standards and assessments;• Identifying actions for federal, state, and local governments to take; and• Building a nationwide, bipartisan consensus to achieve the Goals.
Panel members include eight Governors, four members of Congress, four state legislators, and two members appointed by the President.
The Goals Panel strives to make the National Education Goals Report useful to a variety of audiences. Please provide any comments you may have about this report to us by
using the response card in the back of this document.
This report is available on-line at http://www.negp.gov
Additional copies are available at no charge from:
National Education Goals Panel 1255 22nd Street, NW, Suite 502
Washington, DC 20037 Phone: (202) 724-0015
Fax: (202) 632-0957
Suggested citation: National Education Goals Panel. (1997). The National Education Goals report: Building a nation of learners, 1997.Washington, DC: U.S. Government Printing Office.
For sale by the U.S. Government Printing OfficeSuperintendent of Documents, Mail Stop: SSOP, Washington, DC 20402-9328
ISBN 0-16-048793-5
i, ii, & Chapter 1 10/30/97 12:06 PM Page ii

iii
Data Highlights
National progress on the 26 core indicators is slightly better than the progress that was character-ized in the 1996 Goals Report. National performance has improved significantly* in six areas:
■ The proportion of infants born with one or more health risks has decreased (Goal 1 indicator).
■ More 2-year-olds have been fully immunized against preventable childhood diseases (Goal 1 indicator).
■ More families are reading and telling stories to their children on a regular basis (Goal 1 indicator).
■ Mathematics achievement has improved among students in Grades 4, 8, and 12 (Goal 3 indicator).
■ More students are receiving degrees in mathematics and science. This is true for femalesand minorities, as well as for all students (Goal 5 indicator).
■ Incidents of threats and injuries to students at school have decreased (Goal 7 indicator).
In seven areas national performance has declined:
■ Reading achievement at Grade 12 has declined (Goal 3 indicator).■ The percentage of secondary school teachers who hold a degree in their main
teaching assignment has decreased (Goal 4 indicator).■ Fewer adults with a high school diploma or less are participating in adult education,
compared to those who have postsecondary education (Goal 6 indicator).■ Student drug use has increased (Goal 7 indicator).■ Attempted sales of drugs at school have increased (Goal 7 indicator).■ Threats and injuries to public school teachers have increased (Goal 7 indicator).■ More teachers are reporting that disruptions in their classrooms interfere with their
teaching (Goal 7 indicator).
* In this report, “significance” refers to statistical significance and indicates that the observed differences are not likely to have occurred by chance.
i, ii, & Chapter 1 10/30/97 12:06 PM Page iii

iv
In seven areas no significant changes in national performance have occurred. Since the Goals were established, we have not:
■ reduced the gap in preschool participation rates between high- and low-income families (Goal 1 indicator);
■ improved the high school completion rate (Goal 2 indicator);■ improved reading achievement at Grades 4 and 8 (Goal 3 indicator);■ reduced the gap in college enrollment rates and college completion rates between
White and minority students (Goal 6 indicators);■ reduced the percentage of students who report using alcohol (Goal 7 indicator);■ reduced student reports of classroom disruptions that interfere with their learning
(Goal 7 indicator); or■ increased the percentage of parents who report being involved in activities in their
child’s school (Goal 8 indicator).
Since baselines were established for the state** indicators, significant improvements have occurred in the following areas:
■ Forty states reduced the percentage of infants born with one or more health risks (Goal 1 indicator).
■ Fifty-four jurisdictions increased the number of mothers receiving prenatal care in the first trimester of pregnancy (Goal 1 indicator).
■ The proportion of children with disabilities participating in preschool rose in 46 states (Goal 1 indicator).
■ Twenty-seven jurisdictions increased the percentage of 8th graders scoring at the Proficient or Advanced levels on the NAEP mathematics assessment. In no jurisdiction did the percentage decrease (Goal 3 indicator).
■ In all states but one, the proportion of Advanced Placement examinations receiving a grade of 3 or higher increased (Goal 3 indicator).
■ Forty-seven jurisdictions increased the percentage of all students who received a degree in mathematics or science. In addition, 33 jurisdictions increased the percentage of minority students and 43 jurisdictions increased the percentage of female students who received a degree in mathematics or science (Goal 5 indicator).
■ In nine out of 12 states, the percentage of students enrolling in postsecondary education increased (Goal 6 indicator).
■ In 32 states, the percentage of U.S. citizens who voted increased (Goal 6 indicator).
In other areas, the news is not as encouraging:
■ In 47 jurisdictions, the number of children born with low birthweight increased (Goal 1 indicator).
■ In nine of 18 states, the high school dropout rate increased (Goal 2 indicator).
Data Highlights
** The term “state” is used to refer to the 50 states and the District of Columbia. The term “jurisdiction” is used to refer to the 50 states, the District of Columbia, and the territories.
i, ii, & Chapter 1 10/30/97 12:06 PM Page iv

v
■ In 13 of 19 jurisdictions, the percentage of public high school students who reported using marijuana increased. In no jurisdiction did the percentage decrease (Goal 7 indicator).
■ In nine of 13 jurisdictions, more students reported being offered, sold, or given an illegal drug at school. No jurisdiction showed a decrease in the percentage of students who reportedthat drugs were available on school property (Goal 7 indicator).
■ In 37 states, more teachers reported that student disruptions in their classrooms interfered with their teaching (Goal 7 indicator).
Performance has not changed markedly over time in the following areas:
■ Immunizations. Forty-five states showed no change in the proportion of 2-year-olds immunized (Goal 1 indicator).
■ High School Completion. Thirty-eight states experienced no change in the percentage of 18- to 24-year-olds who held a high school diploma (Goal 2 indicator).
■ 4th Grade Reading. In 37 jurisdictions, the percentage of 4th graders scoring at the Proficient or Advanced levels on the NAEP reading assessment did not change (Goal 3 indicator).
■ 4th Grade Mathematics. In 32 jurisdictions, the percentage of 4th graders scoring at the Proficient or Advanced levels on the NAEP mathematics assessment did not change (Goal 3 indicator).
■ Teacher Preparation and Professional Development. In more than 40 states, there was no change in the percentage of teachers who reported that they held a degree or held a teaching certificate in their main teaching assignment. In 33 states, no change was reported in the proportion of beginning public school teachers who participated in a formal teacherinduction process (Goal 4 indicators).
■ Registering to Vote. In 32 states, there was no change in the percentage of U.S. citizens registered to vote (Goal 6 indicator).
■ Alcohol Consumption. Only one jurisdiction out of 20 had a decrease in the percentage of public school 10th graders who reported having 5 or more drinks in a row (Goal 7 indicator).
■ Student Victimization. Of the 13 jurisdictions that reported data, none reduced the percentageof students who reported being threatened or injured with a weapon on school property (Goal 7 indicator).
■ School Safety. Of the 14 jurisdictions reporting data, none reduced the percentage of students who reported that they did not feel safe at school (Goal 7 indicator).
■ Fights and Carrying Weapons at School. No progress was made in any state in decreasing the percentage of students who reported participating in a physical fight on school property. In addition, in only two jurisdictions was there a decrease in the percentage of students whoreported carrying weapons on school property (Goal 7 indicators).
■ Parental Involvement. In more than 40 states, no change was reported in the level of parentinvolvement from either the teacher’s or principal’s perspective. Similarly, public school princi-pals in 34 states reported that there was no increase in the influence the parent association intheir school had on school policy (Goal 8 indicators).
Data Highlights
i, ii, & Chapter 1 10/30/97 12:06 PM Page v

vi
i, ii, & Chapter 1 10/30/97 12:06 PM Page vi

Foreword
On behalf of the National Education Goals Panel, I am pleased to present the 1997 National Education GoalsReport. This report is the seventh in a series designed to measure the amount of progress made by the nation and
the states toward the eight National Education Goals.
This year’s Goals Report highlights student achievement in mathematics and science, two of the core academicsubjects in which we expect all students to demonstrate competency. The promising news is that more of our studentsin Grades 4, 8, and 12 are considered proficient or advanced in mathematics than students were six years earlier. In addition, more of our college graduates are receiving degrees in mathematics and science. We attribute much of this success to the work that states and professional organizations have done to set rigorous academic standards for students.
But as gratifying as these improvements are, we know that more must be done if we hope to raise the mathematicsand science skills of all our students to world-class levels. Although our 4th graders were outperformed in science onlyby Korea in a recent international assessment, the United States was slightly above the international average in 4thgrade mathematics and 8th grade science, and below the international average in 8th grade mathematics. In fact, themathematics scores of our very best 8th grade students were similar to the scores of only average students in Singapore.That is why the National Education Goals Panel proposes three steps in this year’s report to raise the achievementlevels of our young people: set tougher standards that are comparable to the best in the world; align all components ofthe education system with the standards; and strengthen our teachers’ subject matter knowledge and teaching skills.
The National Education Goals Panel has always advocated challenging academic standards as a means of measur-ing and improving student achievement. As important as this is, more must be done if schools are to help studentsreach challenging standards. It is our belief that this Goals Report brings us closer to understanding how to get there.
Sincerely,
James B. Hunt, Jr., Chair (1997)National Education Goals Panel, and Governor of North Carolina
vii
Governors
John EnglerGovernor of Michigan
William GravesGovernor of Kansas
Paul E. PattonGovernor of Kentucky
Roy RomerGovernor of Colorado
Tommy G. ThompsonGovernor of Wisconsin
Cecil UnderwoodGovernor of West Virginia
Christine Todd WhitmanGovernor of New Jersey
Members of the Administration
Carol H. RascoSenior Advisor to the Secretary, U.S. Department of Education
Richard W. RileySecretary of Education
Members of Congress
Jeff BingamanU.S. Senator, New Mexico
William F. GoodlingU.S. Representative, Pennsylvania
Jim JeffordsU.S. Senator, Vermont
Dale E. KildeeU.S. Representative, Michigan
State Legislators
G. Spencer CoggsState Representative, Wisconsin
Ronald CowellState Representative, Pennsylvania
Mary Lou CowlishawState Representative, Illinois
Douglas R. JonesState Representative, Idaho
i, ii, & Chapter 1 10/30/97 12:07 PM Page vii

viii
i, ii, & Chapter 1 10/30/97 12:07 PM Page viii

ix
Preface
Earlier this year, we spoke to policymakers, researchers, and parents from across the country about past Goals Reports.We wanted to know not only if they found the documents relevant and useful, but how we could make the Goals
Report better. We asked them questions such as: What information did you use? Were the charts and graphs easy tointerpret? Does the document communicate effectively? and, How can the document be improved?
Some of the most important feedback we received was that our audience wanted more explicit state comparisons.They wanted to know the range of state scores. They wanted to be able to compare one state’s results with anotherstate’s results, and they wanted to understand a “top” state’s policies or programs that seem to be affecting their results.And they still wanted to know how a particular state was doing compared to its own baseline.
Our response to this feedback is in two parts — that which is contained in this printed document, and that whichis accessible on our web site. We believe that they complement each other. In this Goals Report, you will find on eachstate page the range of state scores for each indicator, the median value for each indicator, and the U.S. performance(in those cases where the U.S. data are comparable to the state data). Users who would like to make additional com-parisons across the states on the indicators can do so by accessing our web site at http://www.negp.gov. There you willbe able to search by indicator and easily identify the “top” states. In addition, our web site will allow you to choosethe states you wish to compare on various indicators. And in early 1998, our NEGP Monthly (which is accessible onour web site) will explore Goal-related policies and programs of top achieving states on several of the indicatorsdescribed in this report.
It is our hope that these changes will make this document more useful to you. Please feel free to provide us withcomments. A response form is included in the back of this report for that purpose.
We would like to thank those who participated in our focus groups for their time, energy, and ideas. Special thanksalso go to members of our Working Group, especially members of the Reporting Committee: John Barth, CarolHedges, G. Thomas Houlihan, Sherry Kaiman, Tim Kelly, Lynda McCulloch, Drew Petersen, Mary Rollefson,Alexander Russo, Patty Sullivan, Lisa Weil, Dwayne Williams, and Linda Wilson. The 1997 National Education GoalsReport would not have been possible without their dedication and assistance.
Ken NelsonExecutive DirectorNational Education Goals Panel
i, ii, & Chapter 1 10/30/97 12:07 PM Page ix

x
i, ii, & Chapter 1 10/30/97 12:07 PM Page x

TABLE OF CONTENTS
Page
Data Highlights ........................................................................................................................................ iii
Foreword ................................................................................................................................................... vii
Preface ...................................................................................................................................................... ix
The National Education Goals ............................................................................................................... xiv
Chapter 1: Mathematics and Science Achievement for the 21st Century ....................................... 1
Chapter 2: How Are We Doing at the National Level? ..................................................................... 25
Guide to Reading the U.S. Pages ....................................................................................................... 29
U.S. Scorecard ..................................................................................................................................... 30
Exhibits
Goal 1: Ready to LearnExhibit 1: Children’s Health Index ................................................................................................. 35Exhibit 2: Immunizations ................................................................................................................ 36Exhibit 3: Family-Child Reading and Storytelling ......................................................................... 37Exhibit 4: Preschool Participation .................................................................................................. 38
Goal 2: School CompletionExhibit 5: High School Completion ............................................................................................... 39
Goal 3: Student Achievement and CitizenshipExhibit 6: Reading Achievement .................................................................................................... 40Exhibit 7: Writing Achievement .................................................................................................... 42Exhibit 8: Mathematics Achievement ............................................................................................ 43Exhibit 9: Science Achievement ...................................................................................................... 45Exhibit 10: History Achievement ..................................................................................................... 47Exhibit 11: Geography Achievement ............................................................................................... 49
Goal 4: Teacher Education and Professional DevelopmentExhibit 12: Teacher Preparation ....................................................................................................... 51Exhibit 13: Teacher Professional Development ................................................................................ 52
Goal 5: Mathematics and ScienceExhibit 14: International Mathematics Achievement ..................................................................... 53Exhibit 15: International Science Achievement ............................................................................. 55Exhibit 16: Mathematics and Science Degrees ................................................................................ 57
Goal 6: Adult Literacy and Lifelong LearningExhibit 17: Adult Literacy ................................................................................................................ 58Exhibit 18: Participation in Adult Education .................................................................................. 59Exhibit 19: Participation in Higher Education ................................................................................ 60
xi
i, ii, & Chapter 1 10/30/97 12:07 PM Page xi

Goal 7: Safe, Disciplined, and Alcohol- and Drug-free SchoolsExhibit 20: Overall Student Drug and Alcohol Use ........................................................................ 61Exhibit 21: Sale of Drugs at School .................................................................................................. 62Exhibit 22: Student and Teacher Victimization ............................................................................... 63Exhibit 23: Disruptions in Class by Students ................................................................................... 64
Goal 8: Parental ParticipationExhibit 24: Schools’ Reports of Parent Attendance at Parent-Teacher Conferences ..................... 65Exhibit 25: Schools’ Reports of Parent Involvement in School Policy Decisions .......................... 66Exhibit 26: Parents’ Reports of Their Involvement in School Activities ....................................... 67
TablesTable 1: Disparities in the Children’s Health Index, by race/ethnicity ........................................... 35Table 2: Disparities in high school completion, by race/ethnicity ................................................... 39Table 3: Disparities in reading achievement, by race/ethnicity and by sex ..................................... 41Table 4: Disparities in mathematics achievement, by race/ethnicity and by sex ............................ 44Table 5: Disparities in science achievement, by race/ethnicity and by sex ....................................... 46Table 6: Disparities in history achievement, by race/ethnicity and by sex ...................................... 48Table 7: Disparities in geography achievement, by race/ethnicity and by sex ................................ 50
Chapter 3: How Are We Doing at the State Level? ............................................................................ 69
Guide to Reading the State Pages .................................................................................................... 72Alabama .............................................................................................................................................. 76Alaska ................................................................................................................................................. 80Arizona ............................................................................................................................................... 84Arkansas ............................................................................................................................................. 88California ............................................................................................................................................ 92Colorado ............................................................................................................................................. 96Connecticut ........................................................................................................................................ 100Delaware ............................................................................................................................................. 104District of Columbia ........................................................................................................................... 108Florida ................................................................................................................................................. 112Georgia ............................................................................................................................................... 116Hawaii ................................................................................................................................................. 120Idaho ................................................................................................................................................... 124Illinois ................................................................................................................................................. 128Indiana ................................................................................................................................................ 132Iowa .................................................................................................................................................... 136Kansas ................................................................................................................................................. 140Kentucky ............................................................................................................................................. 144Louisiana ............................................................................................................................................. 148Maine .................................................................................................................................................. 152Maryland ............................................................................................................................................. 156Massachusetts ..................................................................................................................................... 160Michigan ............................................................................................................................................. 164Minnesota ........................................................................................................................................... 168Mississippi ........................................................................................................................................... 172Missouri .............................................................................................................................................. 176Montana ............................................................................................................................................. 180Nebraska ............................................................................................................................................. 184Nevada ................................................................................................................................................ 188New Hampshire .................................................................................................................................. 192New Jersey .......................................................................................................................................... 196
xii
i, ii, & Chapter 1 10/30/97 12:07 PM Page xii

New Mexico ....................................................................................................................................... 200New York ............................................................................................................................................ 204North Carolina ................................................................................................................................... 208North Dakota ..................................................................................................................................... 212Ohio .................................................................................................................................................... 216Oklahoma ........................................................................................................................................... 220Oregon ................................................................................................................................................ 224Pennsylvania ....................................................................................................................................... 228Rhode Island ....................................................................................................................................... 232South Carolina ................................................................................................................................... 236South Dakota ...................................................................................................................................... 240Tennessee ............................................................................................................................................ 244Texas ................................................................................................................................................... 248Utah .................................................................................................................................................... 252Vermont .............................................................................................................................................. 256Virginia ............................................................................................................................................... 260Washington ........................................................................................................................................ 264West Virginia ...................................................................................................................................... 268Wisconsin ........................................................................................................................................... 272Wyoming ............................................................................................................................................ 276American Samoa ................................................................................................................................ 280Guam .................................................................................................................................................. 284Northern Marianas ............................................................................................................................. 288Puerto Rico ......................................................................................................................................... 292Virgin Islands ...................................................................................................................................... 296
TablesTable 8: Advanced Placement (AP) Performance .............................................................................. 300
Appendix A: Data Collection Schedules ................................................................................................. 305
Appendix B: Technical Notes and Sources for the National Core Indicators ................................... 311
Appendix C: Technical Notes and Sources for the State Indicators .................................................. 323
Appendix D: Acknowledgements .......................................................................................................... 333
National Education Goals Panel Staff ................................................................................................... 339
xiii
i, ii, & Chapter 1 10/30/97 12:07 PM Page xiii

xiv
The National Education Goals
Goal 1: Ready to Learn
By the year 2000, all children in America will start school ready to learn.
Objectives:
■ All children will have access to high-quality and developmentally appropriatepreschool programs that help prepare children for school.
■ Every parent in the United States will be a child’s first teacher and devote time eachday to helping such parent’s preschool child learn, and parents will have access to thetraining and support parents need.
■ Children will receive the nutrition, physical activity experiences, and health careneeded to arrive at school with healthy minds and bodies, and to maintain the mentalalertness necessary to be prepared to learn, and the number of low-birthweight babieswill be significantly reduced through enhanced prenatal health systems.
Goal 2: School Completion
By the year 2000, the high school graduation rate will increase to at least 90 percent.
Objectives:
■ The Nation must dramatically reduce its school dropout rate, and 75 percent of the students who do drop out will successfully complete a high school degree or its equivalent.
■ The gap in high school graduation rates between American students from minoritybackgrounds and their non-minority counterparts will be eliminated.
i, ii, & Chapter 1 10/30/97 12:07 PM Page xiv

xv
Goal 3: Student Achievement and Citizenship
By the year 2000, all students will leave grades 4, 8, and 12 having demonstratedcompetency over challenging subject matter including English, mathematics, science,foreign languages, civics and government, economics, arts, history, and geography, and every school in America will ensure that all students learn to use their minds well, so they may be prepared for responsible citizenship, further learning, and productiveemployment in our Nation’s modern economy.
Objectives:
■ The academic performance of all students at the elementary and secondary level willincrease significantly in every quartile, and the distribution of minority students in each quartile will more closely reflect the student population as a whole.
■ The percentage of all students who demonstrate the ability to reason, solve problems,apply knowledge, and write and communicate effectively will increase substantially.
■ All students will be involved in activities that promote and demonstrate goodcitizenship, good health, community service, and personal responsibility.
■ All students will have access to physical education and health education to ensure they are healthy and fit.
■ The percentage of all students who are competent in more than one language willsubstantially increase.
■ All students will be knowledgeable about the diverse cultural heritage of this Nationand about the world community.
Goal 4: Teacher Education and Professional Development
By the year 2000, the Nation’s teaching force will have access to programs for thecontinued improvement of their professional skills and the opportunity to acquire theknowledge and skills needed to instruct and prepare all American students for the next century.
Objectives:
■ All teachers will have access to preservice teacher education and continuingprofessional development activities that will provide such teachers with the knowledgeand skills needed to teach to an increasingly diverse student population with a variety of educational, social, and health needs.
■ All teachers will have continuing opportunities to acquire additional knowledge andskills needed to teach challenging subject matter and to use emerging new methods,forms of assessment, and technologies.
■ States and school districts will create integrated strategies to attract, recruit, prepare,retrain, and support the continued professional development of teachers, administrators,and other educators, so that there is a highly talented work force of professionaleducators to teach challenging subject matter.
i, ii, & Chapter 1 10/30/97 12:07 PM Page xv

xvi
■ Partnerships will be established, whenever possible, among local educational agencies, institutions of higher education, parents, and local labor, business, andprofessional associations to provide and support programs for the professionaldevelopment of educators.
Goal 5: Mathematics and Science
By the year 2000, United States students will be first in the world in mathematics andscience achievement.
Objectives:
■ Mathematics and science education, including the metric system of measurement, will be strengthened throughout the system, especially in the early grades.
■ The number of teachers with a substantive background in mathematics and science,including the metric system of measurement, will increase by 50 percent.
■ The number of United States undergraduate and graduate students, especially womenand minorities, who complete degrees in mathematics, science, and engineering willincrease significantly.
Goal 6: Adult Literacy and Lifelong Learning
By the year 2000, every adult American will be literate and will possess the knowledge and skills necessary to compete in a global economy and exercise the rights andresponsibilities of citizenship.
Objectives:
■ Every major American business will be involved in strengthening the connectionbetween education and work.
■ All workers will have the opportunity to acquire the knowledge and skills, from basic to highly technical, needed to adapt to emerging new technologies, work methods, andmarkets through public and private educational, vocational, technical, workplace, orother programs.
■ The number of quality programs, including those at libraries, that are designed to servemore effectively the needs of the growing number of part-time and midcareer studentswill increase substantially.
■ The proportion of the qualified students, especially minorities, who enter college, who complete at least two years, and who complete their degree programs will increase substantially.
■ The proportion of college graduates who demonstrate an advanced ability to thinkcritically, communicate effectively, and solve problems will increase substantially.
■ Schools, in implementing comprehensive parent involvement programs, will offer more adult literacy, parent training and lifelong learning opportunities to improve the ties between home and school, and enhance parents’ work and home lives.
i, ii, & Chapter 1 10/30/97 12:07 PM Page xvi

xvii
Goal 7: Safe, Disciplined, and Alcohol- and Drug-free Schools
By the year 2000, every school in the United States will be free of drugs, violence, and theunauthorized presence of firearms and alcohol and will offer a disciplined environmentconducive to learning.
Objectives:
■ Every school will implement a firm and fair policy on use, possession, and distribution of drugs and alcohol.
■ Parents, businesses, governmental and community organizations will work together toensure the rights of students to study in a safe and secure environment that is free ofdrugs and crime, and that schools provide a healthy environment and are a safe havenfor all children.
■ Every local educational agency will develop and implement a policy to ensure that allschools are free of violence and the unauthorized presence of weapons.
■ Every local educational agency will develop a sequential, comprehensive kindergartenthrough twelfth grade drug and alcohol prevention education program.
■ Drug and alcohol curriculum should be taught as an integral part of sequential,comprehensive health education.
■ Community-based teams should be organized to provide students and teachers withneeded support.
■ Every school should work to eliminate sexual harassment.
Goal 8: Parental Participation
By the year 2000, every school will promote partnerships that will increase parentalinvolvement and participation in promoting the social, emotional, and academic growth of children.
Objectives:
■ Every State will develop policies to assist local schools and local educational agencies to establish programs for increasing partnerships that respond to the varying needs of parents and the home, including parents of children who are disadvantaged orbilingual, or parents of children with disabilities.
■ Every school will actively engage parents and families in a partnership which supportsthe academic work of children at home and shared educational decisionmaking atschool.
■ Parents and families will help to ensure that schools are adequately supported and willhold schools and teachers to high standards of accountability.
i, ii, & Chapter 1 10/30/97 12:07 PM Page xvii

xviii
i, ii, & Chapter 1 10/30/97 12:07 PM Page xviii

1
This summer marked one of the mostmiraculous scientific achievements in thehistory of the United States. On July 4,
1997, a team of U.S. engineers and scientistssucceeded in landing a spacecraft on the surfaceof Mars for the first mobile exploration ofanother planet. The team members at missioncontrol nervously held their breath to seewhether 17-foot airbags would provide suffi-cient cushion for the spacecraft during an inno-vative landing that had never before beenattempted. The airbags worked. The landingwas precise. And out rolled a robot namedSojourner, the size of a microwave oven,designed to explore and transmit images of theMartian surface to scientists in California, 119million miles away.
The success of the Pathfinder expeditionhas captured the American public’s interest inscience in a way that has not been seen sincethe 1969 Apollo moon landing. Some say thatthe Pathfinder scientists themselves deservemuch of the credit for generating public interestby wearing 3-D glasses during news conferencesand giving the Martian rocks names like Yogi,Barnacle Bill, and Scooby-Doo.1 They made sci-ence fun, and their excitement was apparentlycontagious. Twenty-five World Wide Web sitesset up by NASA to broadcast the images relayedfrom Mars recorded 220 million hits the firstfive days.2 During the weekend followingPathfinder’s landing, 7,000 people a day werereported to have visited the Planetary Society’s“Planetfest” about Mars in downtown Pasade-na.3 And Mattel sold out 1,500 toy models ofthe Pathfinder spacecraft and its Sojourner
rover in less than an hour at a stand set up atNASA’s Pasadena campus.4
With the success of the Pathfinder mission,the American public can rest assured that ourposition as a world leader in aeronauticsremains secure. But how does the United Statescompare in other scientific, mathematical, andtechnological fields? Are we a leader? And willwe still be a leader fifty years fromnow, given our students’ currentlevels of skill and training?
In the early 1980’s, businessleaders warned that U.S. stu-dents’ mathematics and scienceskills were so low in comparisonto other nations that the veryeconomic stability of the U.S.was in question. In 1983, theUnited States was dubbed “anation at risk.”5 Experts cau-tioned that unless students’mathematics and science skillsquickly improved, the nation could expect arapid decline in the pool of workers who hadthe technological skills necessary to keep theU.S. globally competitive. Singapore hadbecome a world leader in the microchip indus-try. Japan and Korea were building cheaper,more energy-efficient automobiles. Germanyand Taiwan were approaching the United Statesin total exports. Increasing the strength of U.S.students’ mathematics and science skills wasconsidered so vital to our national interest thatthe President and the nation’s Governors agreedin 1990 that one of the nation’s top educationgoals should be to increase mathematics and
Chapter 1: Mathematics and ScienceAchievement for the 21stCentury
In the early 1980’s,experts cautioned thatunless students’ mathe-matics and science skillsquickly improved, thenation could expect arapid decline in the poolof workers who had thetechnological skills necessary to keep theU.S. globally competitive.
i, ii, & Chapter 1 10/30/97 12:07 PM Page 1

2
science skills dramatically by the end of thecentury. The goal was to be more than competi-tive — the goal was to be first in the world:
Goal 5: Mathematics and Science
By the year 2000, United States students willbe first in the world in mathematics and sci-ence achievement.
Since then, voluntary nationwide standardshave been developed by subject area experts toidentify what all students should know and beable to do in mathematics and science.6 Scoresof states and local school districts have followedsuit. As we approach the year 2000, the Ameri-can public is eager to know what progress isbeing made. How far is the U.S. from being aworld leader in mathematics and science? Whatwill it take to get us where we want to be?
International comparisons of mathematics andscience achievement
Assessments conducted over the past thirty years have shown U.S. performance to be extremely weak in both mathematics and science. In 1990, only 12-15% of 4th, 8th, and12th graders were considered proficient inmathematics on a nationally administered U.S.achievement test, the National Assessment ofEducational Progress (NAEP).7 The followingyear, U.S. students also fared poorly on theInternational Assessment of Educational
Progress (IAEP), which assessed mathematicsand science abilities of 13-year-olds in 20 coun-tries and 9-year-olds in 14 countries. U.S. 13-year-olds’ average mathematics and sciencescores were significantly lower than those of stu-dents in Korea, Taiwan, the Soviet Union,Hungary, France, Canada, Switzerland, Israel,and Slovenia.8
Even when comparisons were limited to asubset of nations that compared only comprehen-sive student populations, the results were notmuch better. Results based on 10 countries for 9-year-olds and 14 countries for 13-year-oldsrevealed that although U.S. 9-year-olds rankedthird in science, 13-year-olds were second to last.In mathematics, U.S. 9-year-olds were also sec-ond to last, while U.S. 13-year-olds were rock-bottom.9
Has our lackluster performance improvedover time? Results from a recent internationalstudy are just beginning to answer that ques-tion. In 1995, the most comprehensive interna-tional study of mathematics and scienceachievement to date was conducted, the ThirdInternational Mathematics and Science Study,or TIMSS.10 TIMSS tested half a million stu-dents in 41 countries in 30 different languages.Participating countries included some of theUnited States’ chief economic competitors andtrading partners, such as Japan, Germany, Cana-da, Korea, Singapore, and Hong Kong.
Figure 1
Mathematics Content Areas Tested by TIMSS
Grade 4 Grade 8Data representation, analysis, and probability X XGeometry X XWhole numbers XFractions and proportionality XPatterns, relations, and functions XMeasurement, estimation, and number sense XFractions and number sense XAlgebra XMeasurement XProportionality X
Sources: U.S. Department of Education, National Center for Education Statistics. (1997). Pursuing excellence: A study of U.S. fourth-grade mathematics and science achievement in international context, NCES 97-255. Washington, DC: U.S. Government Printing Office.
U.S. Department of Education, National Center for Education Statistics. (1996). Pursuing excellence: A study of U.S. eighth-grademathematics and science teaching, learning, curriculum, and achievement in international context, NCES 97-198. Washington, DC:U.S. Government Printing Office.
i, ii, & Chapter 1 10/30/97 12:07 PM Page 2

3
Three age groups were tested in the partici-pating countries, corresponding roughly toGrades 4, 8, and 12 in the United States. Twen-ty-six nations took part in the mathematics andscience assessments at Grade 4, while all 41 par-ticipated at Grade 8. Both public and privateschools participated, and the same studentswere tested in both mathematics and science.TIMSS drew random samples of virtually allstudents in the participating countries, not justthose enrolled in mathematics and sciencecourses. Nearly all countries in TIMSS accom-plished high participation rates, and did notexempt large portions of their student bodiesfrom testing.*
An international curriculum analysis wasconducted prior to test development to ensurethat the test items reflected what was covered inthe mathematics and science courses taught inthe participating countries and did not overem-phasize what was taught in only a few. In mathe-matics, six content areas were tested at Grades 4and 8 (see Figure 1). In science, four contentareas were tested at Grade 4, and five contentareas were tested at Grade 8 (see Figure 2). Theassessments required one and one-half hours tocomplete, and included both multiple-choiceand open-ended questions at each grade (seeexamples in Figure 3).
TIMSS used multiple approaches to providea context for the assessment results, since edu-cation policies, practices, and attitudes werelikely to differ among the participating coun-
tries. In addition to the student assessments,TIMSS collected information through ques-tionnaires administered to teachers, students,and school administrators; comparisons ofmathematics and science curriculum guides andtextbooks; videotapes of mathematics instruc-tion in 8th grade classrooms in the UnitedStates, Japan, and Germany; and detailed casestudies of education policies in the same threecountries. To date, results have been released for4th graders and 8th graders, with 12th graders’results scheduled for release in 1998. A linkingstudy designed to compare the mathematics andscience performance of individual states onNAEP with participating TIMSS countries isalso under way.
How did we do?
Overall, the international standing of U.S.4th graders was stronger than that of U.S. 8thgraders in both mathematics and science. Andat both grade levels, the international standingof U.S. students was better in science than itwas in mathematics. At both grades, there was amixture of good and bad news about U.S. stu-dent performance.
Figures 4-7 show how the U.S. performed inrelation to each of the other TIMSS partici-pants. The authors of the TIMSS studies caution that it would not be accurate to rankthe countries strictly by their average scores. (It would be erroneous, for example, to con-clude that the U.S. ranked 12th out of 26 in 4th grade mathematics.) This is because the
* A small number of countries deviated from strict international quality control requirements regarding random selection, participationrates, etc. Their results are marked in the TIMSS findings as a caution to the reader.
Figure 2
Science Content Areas Tested by TIMSS
Grade 4 Grade 8Earth science X XLife science X XEnvironment and the nature of science X XPhysical science XChemistry XPhysics X
Sources: U.S. Department of Education, National Center for Education Statistics. (1997). Pursuing excellence: A study of U.S. fourth-grade mathematics and science achievement in international context, NCES 97-255. Washington, DC: U.S. Government Printing Office.
U.S. Department of Education, National Center for Education Statistics. (1996). Pursuing excellence: A study of U.S. eighth-grademathematics and science teaching, learning, curriculum, and achievement in international context, NCES 97-198. Washington, DC:U.S. Government Printing Office.
i, ii, & Chapter 1 10/30/97 12:07 PM Page 3

4
Figure 3
Sample TIMSS Items – Grade 4
Mathematics — Grade 4
Measurement, Estimation, and Number Sense
A thin wire 20 centimeters long is formed into a rectangle. If the width of this rectangle is 4 centimeters, what is its length?
A. 5 centimeters✔ B. 6 centimeters
C. 12 centimetersD. 16 centimeters
Percentage of 4th graders who answered this item correctly
International Average U.S. Canada England Germany* Japan Korea Singapore23% 23% 23% 29% — 32% 38% 46%
*Germany did not participate in TIMSS at Grade 4.
Science — Grade 4
Physical Science
Percentage of 4th graders who answered this item correctly
International Average U.S. Canada England Germany* Japan Korea Singapore37% 43% 46% 42% — 72% 75% 45%
*Germany did not participate in TIMSS at Grade 4.
Sources: Martin, M.O., et al. (1997, June). Science achievement in the primary school years: IEA’s third international mathematicsand science study (TIMSS). Chestnut Hill, MA: Boston College.Mullis, I.V.S., et al. (1997, June). Mathematics achievement in the primary school years: IEA’s third international mathematics andscience study (TIMSS). Chestnut Hill, MA: Boston College.
i, ii, & Chapter 1 10/30/97 12:07 PM Page 4

5
Figure 3 (continued)
Sample TIMSS Items – Grade 8
Mathematics — Grade 8
Data Representation, Analysis, and Probability
Percentage of 8th graders who answered this item correctly
International Average U.S. Canada England Germany* Japan Korea Singapore19% 18% 24% 20% 14% 47% 50% 55%
*Germany did not meet international age/grade specifications.
Science — Grade 8
Chemistry
Which is NOT an example of a chemical change?
✔ A. Boiling waterB. Rusting ironC. Burning woodD. Baking bread
Percentage of 8th graders who answered this item correctly
International Average U.S. Canada England Germany* Japan Korea Singapore31% 43% 38% 41% 25% 54% 48% 62%
*Germany did not meet international age/grade specifications.
Sources: Beaton, A.E., et al. (1996, November). Science achievement in the middle school years: IEA’s third international mathemat-ics and science study (TIMSS). Chestnut Hill, MA: Boston College.Beaton, A.E., et al. (1996, November). Mathematics achievement in the middle school years: IEA’s third international mathematicsand science study (TIMSS). Chestnut Hill, MA: Boston College.
i, ii, & Chapter 1 10/30/97 12:07 PM Page 5

6
Figure 4
Grade 4 - Mathematics
Average Scores of Nations Participating In TIMSS
Singapore 625Korea 611Japan 597Hong Kong 587(Netherlands) 577Czech Republic 567(Austria) 559
552 (Slovenia)550 Ireland548 (Hungary)546 (Australia)545 United States532 Canada531 (Israel)529 International average
(Latvia [LSS]) 525Scotland° 520England*° 513Cyprus, Norway 502New Zealand 499Greece 492(Thailand) 490Portugal 475Iceland 474Iran, Islamic Republic 429(Kuwait) 400
➜
Notes:1. Nations not meeting international guidelines are shown in parentheses.2. Nations in which more than 10% of the population was excluded from testing are shown with a *. Latvia is designated
LSS because only Latvian-speaking schools were tested, which represents less than 65% of the population.3. Nations in which a participation rate of 75% of the schools and students combined was achieved only after replace-
ments for refusals were substituted, are shown with a °.4. The international average is the average of the national averages of the 26 nations.
Source: Mullis, I.V.S., et al. (1997, June). Mathematics achievement in the primary school years: IEA’s third interna-tional mathematics and science study (TIMSS), Table 1.1. Chestnut Hill, MA: Boston College. (as reported in U.S.Department of Education, National Center for Education Statistics. (1997). Pursuing excellence: A study of U.S.fourth-grade mathematics and science achievement in international context, NCES 97-255. Washington, DC: U.S.Government Printing Office.)
Countries higher than the U.S.
Countries similar to the U.S.
Countries lower than the U.S.
i, ii, & Chapter 1 10/30/97 12:07 PM Page 6

7
Figure 5
Grade 4 - Science
Average Scores of Nations Participating In TIMSS
Notes:1. Nations not meeting international guidelines are shown in parentheses.2. Nations in which more than 10% of the population was excluded from testing are shown with a *. Latvia is designated
LSS because only Latvian-speaking schools were tested, which represents less than 65% of the population.3. Nations in which a participation rate of 75% of the schools and students combined was achieved only after replace-
ments for refusals were substituted, are shown with a °.4. The international average is the average of the national averages of the 26 nations.
Source: Martin, M.O., et al. (1997, June). Science achievement in the primary school years: IEA’s third internationalmathematics and science study (TIMSS). Chestnut Hill, MA: Boston College. (as reported in U.S. Department ofEducation, National Center for Education Statistics. (1997). Pursuing excellence: A study of U.S. fourth-grade math-ematics and science achievement in international context, NCES 97-255. Washington, DC: U.S. Government PrintingOffice.)
Korea 597574 Japan565 United States, (Austria)562 (Australia)557 (Netherlands), Czech Republic
England*° 551Canada 549Singapore 547(Slovenia) 546Ireland 539Scotland° 536Hong Kong 533(Hungary) 532New Zealand 531Norway 530International Average 524(Latvia [LSS]) 512(Israel), Iceland 505Greece 497Portugal 480Cyprus 475(Thailand) 473Iran, Islamic Republic 416(Kuwait) 401
Countries higher than the U.S.
Countries similar to the U.S.
Countries lower than the U.S.
➜
i, ii, & Chapter 1 10/30/97 12:07 PM Page 7

8
Figure 6
Grade 8 - Mathematics
Average Scores of Nations Participating In TIMSS
Notes:1. Nations not meeting international guidelines are shown in parentheses.2. Nations in which more than 10% of the population was excluded from testing are shown with a *. Latvia is designated
LSS because only Latvian-speaking schools were tested, which represents less than 65% of the population.3. Nations in which a participation rate of 75% of the schools and students combined was achieved only after replace-
ments for refusals were substituted, are shown with a °.4. The international average is the average of the national averages of the 41 nations.5. The country average for Sweden may appear to be out of place; however, statistically, its placement is correct.Source: Beaton, A.E., et al. (1996, November). Mathematics achievement in the middle school years: IEA’s third interna-tional mathematics and science study (TIMSS). Chestnut Hill, MA: Boston College. (as reported in U.S. Department ofEducation, National Center for Education Statistics. (1996). Pursuing excellence: A study of U.S. eighth-grade mathematicsand science teaching, learning, curriculum, and achievement in international context, NCES 97-198. Washington, DC: U.S.Government Printing Office.)
➜
Singapore 643Korea 607Japan 605Hong Kong 588Belgium-Flemish° 565Czech Republic 564Slovak Republic 547Switzerland° 545(Netherlands), (Slovenia) 541(Bulgaria) 540(Austria) 539France 538Hungary 537Russian Federation 535(Australia) 530Ireland, Canada 527(Belgium-French) 526
522 (Thailand), (Israel)*Sweden 519
513 International Average509 (Germany)*°508 New Zealand506 England*°503 Norway502 (Denmark)500 United States°498 (Scotland)493 Latvia [LSS]°487 Spain, Iceland484 (Greece)482 (Romania)
Lithuania* 477Cyprus 474Portugal 454Iran, Islamic Republic 428(Kuwait) 392(Colombia) 385(South Africa) 354
Countries higher than the U.S.
Countries similar to the U.S.
Countries lower than the U.S.
i, ii, & Chapter 1 10/30/97 12:07 PM Page 8

9
Singapore 607Czech Republic 574Japan 571Korea, (Bulgaria) 565(Netherlands), (Slovenia) 560(Austria) 558Hungary 554
552 England*°550 Belgium-Flemish°
545 (Australia)544 Slovak Republic538 Russian Federation, Ireland535 Sweden534 United States°531 (Germany),*° Canada527 Norway525 New Zealand, (Thailand)524 (Israel)*522 Hong Kong, Switzerland°517 (Scotland)
Spain 517International Average 516France 498(Greece) 497Iceland 494(Romania) 486Latvia [LSS]° 485Portugal 480(Denmark) 478Lithuania* 476(Belgium-French) 471Iran, Islamic Republic 470Cyprus 463(Kuwait) 430(Colombia) 411(South Africa) 326
Figure 7
Grade 8 - Science
Average Scores of Nations Participating In TIMSS
Notes:1. Nations not meeting international guidelines are shown in parentheses.2. Nations in which more than 10% of the population was excluded from testing are shown with a *. Latvia is designated
LSS because only Latvian-speaking schools were tested, which represents less than 65% of the population.3. Nations in which a participation rate of 75% of the schools and students combined was achieved only after replace-
ments for refusals were substituted, are shown with a °.4. The international average is the average of the national averages of the 41 nations.5. The country average for Scotland (or Spain) may appear to be out of place; however, statistically, its placement is correct.
Source: Beaton, A.E., et al. (1996, November). Science achievement in the middle school years: IEA’s third internationalmathematics and science study (TIMSS). Chestnut Hill, MA: Boston College. (as reported in U.S. Department of Education,National Center for Education Statistics. (1996). Pursuing excellence: A study of U.S. eighth-grade mathematics and scienceteaching, learning, curriculum, and achievement in international context, NCES 97-198. Washington, DC: U.S. GovernmentPrinting Office.)
➜
Countries higher than the U.S.
Countries similar to the U.S.
Countries lower than the U.S.
i, ii, & Chapter 1 10/30/97 12:07 PM Page 9

10
scores represent samples of students, and notentire student populations. All samples containa small amount of measurement error and areonly estimates of the range within which anation’s true score would fall. The estimateswould be slightly higher or slightly lower if a different sample of students were chosen for testing. Therefore, it is more appropriate to talk about TIMSS participants’ performancein terms of clusters of countries which per-formed significantly higher than, significantlylower than, or not significantly different from aparticular country.**
Summary of Grade 4 results
Only one country, Korea, outperformed theU.S. in science at Grade 4. In both mathemat-ics and science, U.S. 4th graders’ scores wereabove the international average. In mathemat-ics, they scored higher than 12 countries, lowerthan 7, and not significantly different from 6. Inscience, they scored higher than 19 countries,lower than 1, and not significantly differentfrom 5. With the exception of Japanese scoresin mathematics, U.S. students’ performance wascomparable to or higher than that of students inother Group of Seven, or G-7 nations, whichare our major trading partners(i.e., Canada,England, Japan).
U.S. 4th graders outperformed their peers inboth subjects in 9 of the other 25 participatingcountries (Cyprus, England, Greece, Iceland,Islamic Republic of Iran, New Zealand, Norway,Portugal, and Scotland). Only Korea outper-formed the U.S. in both mathematics and sci-ence at Grade 4.
The U.S. scored above the internationalaverage in 5 out of 6 mathematics content areas(whole numbers; fractions and proportionality;data representation, analysis, and probability;geometry; and patterns, relations, and func-tions) and below the international average inone content area (measurement, estimation,and number sense). The U.S. scored above theinternational average in all four science contentareas at Grade 4 (earth science; life science;environment and the nature of science; andphysical science).
If an international talent search were con-ducted in science to select the top 10% of allstudents in the participating countries com-bined, 16% of U.S. 4th graders would be includ-ed. No country had a significantly greater per-centage of students who met this target. Inmathematics, 9% of U.S. 4th graders would beincluded. However, this share is substantiallylower than the 39% of students from Singapore,
** In this report, “significance” refers to statistical significance and indicates that the observed differences are not likely to have occurredby chance.
Highlights
Grade 4
• Only one country, Korea, outperformed U.S. 4th graders in science.
• U.S. scores were above the international average in both mathematics and science.
• U.S. 4th graders outperformed their peers in 12 out of 25 countries in mathematics, and in 19out of 25 countries in science.
• If an international talent search were conducted in science to select the top 10% of all stu-dents in the participating countries combined, 16% of U.S. 4th graders would be included. Nocountry had a significantly greater percentage of students who met this target.
• If a similar talent search were conducted in mathematics, 9% of U.S. 4th graders would beincluded among the top 10% worldwide. However, this share is substantially lower than the39% of students from Singapore, 26% of students from Korea, and 23% of students from Japanwho would be selected.
Source: U.S. Department of Education, National Center for Education Statistics. (1997). Pursuing excellence: A study of U.S. fourth-grade mathematics and science achievement in international context, NCES 97-255. Washington, DC: U.S. Government Printing Office.
i, ii, & Chapter 1 10/30/97 12:07 PM Page 10

26% of students from Korea, and 23% of stu-dents from Japan who would rank among thetop 10% worldwide.
U.S. boys and girls performed similarly inmathematics at Grade 4, but girls scored signifi-cantly lower in science. This was true for thecontent areas of earth science and physical sci-ence, as well as the overall science score.
Summary of Grade 8 results
U.S. 8th graders scored above the interna-tional average in science, but below the interna-tional average in mathematics. At Grade 8, themathematics scores of the very best U.S. stu-dents were similar to the scores of only averagestudents in Singapore.
In mathematics, U.S. 8th graders scored high-er than 7 countries, lower than 20, and not signifi-cantly different from 13. In science, they scoredhigher than 15 countries, lower than 9, and notsignificantly different from 16. When compared toour chief economic partners, the U.S. is in the bot-tom half in mathematics and around the middle inscience. There was no significant difference inmathematics or science scores between U.S. boysand girls at Grade 8.
U.S. 8th graders outperformed their peers inboth mathematics and science in 4 of the other 40participating countries (Cyprus, Iran, Lithuania,and Portugal). However, 5 nations outperformedthe U.S. in both subjects (Singapore, Korea,Japan, Czech Republic, and Hungary).
The U.S. scored at about the internationalaverage in 3 out of 6 mathematics content areas(algebra; data representation, analysis, and proba-bility; and fractions and number sense), and belowthe international average in the remaining 3 areas(geometry; measurement; and proportionality).
The U.S. scored above the international aver-age in 3 out of 5 science content areas (earth sci-ence, life science, and environment and thenature of science) and at about the internationalaverage in the remaining two (chemistry andphysics).
If an international talent search were con-ducted in science to select the top 10% of allstudents in the participating countries com-bined, 13% of U.S. 8th graders would be includ-ed. However, only 5% of U.S. 8th graders wouldbe included among the top 10% worldwide whowere tested in mathematics. This compares to45% of students from Singapore and 32% of stu-dents from Japan.
11
Highlights
Grade 8
• The United States scored above the international average in science at Grade 8, but below the international average in mathematics.
• U.S. 8th graders outperformed their peers in 7 out of 40 countries in mathematics, and in 15 out of 40 countries in science.
• Half of the participating countries (20 out of 40) outperformed the United States in mathematics at Grade 8.
• If an international talent search were conducted in science to select the top 10% of all students in the participating countries combined, 13% of U.S. 8th graders would be included.However, only 5% of U.S. 8th graders would be included among the top 10% worldwide inmathematics. This compares to 45% of students from Singapore and 32% of students from Japan.
• When compared to our chief economic partners, the United States is in the bottom half inmathematics and around the middle in science.
• At Grade 8, the mathematics scores of the very best U.S. students were similar to the scores ofaverage students in Singapore.
Source: U.S. Department of Education, National Center for Education Statistics. (1996). Pursuing excellence: A study of U.S. eighth-grade mathematics and science teaching, learning, curriculum, and achievement in international context, NCES 97-198. Washington,DC: U.S. Government Printing Office.
i, ii, & Chapter 1 10/30/97 12:07 PM Page 11
12
What explains the international differences instudent achievement?
Two puzzling patterns emerge from theTIMSS findings:1. U.S. students perform better in science than in
mathematics.2. Our international standing declines between
Grades 4 and 8 in both mathematics and science.
How do we explain these findings? Whatcauses our students to score higher in sciencethan in mathematics? And what happens inU.S. schools between Grades 4 and 8 thataccounts for our slip in performance? What arethe highest-performing countries doing to pre-pare their students that we are not? Preliminaryevidence from TIMSS suggests that althoughthe answers to these questions are not simple,two factors that we can do something about arevery important in helping explain these find-ings: what is taught, and how it is taught.
At the 4th grade level, TIMSS researchershave not yet found strong evidence of any par-ticular factors that contribute heavily to differ-ences in performance among the participating
countries. However, at the 8th grade level, wecan draw stronger conclusions about differencesin performance, since sources of data includedvideotapes of selected mathematics classroomsand case studies of education policies, as well asbackground questionnaires. The multiplesources of information revealed several key dif-ferences among countries in terms of curricu-lum, instruction, and teacher training:
Curriculum• What is taught in U.S. mathematics classes
at Grade 8 — the curriculum — is lessadvanced and less focused than the curriculaof other TIMSS countries.
Instruction• While most U.S. mathematics teachers are
aware of education reforms that have beenrecommended by mathematics experts, theyexhibit many of these teaching behaviors lessfrequently than Japanese teachers.
Teacher training• Beginning teachers in the U.S. are less likely
than those in Germany and Japan to receiveregular support and practical training
International Differences in Curriculum,
Instruction, and Teacher Training
• The content covered in 8th-grade mathematics classes in the United States is generally cov-ered in the 7th grade in other countries. What is most likely to be taught to U.S. 8th graders is“general mathematics,” or arithmetic (fractions, decimals, computational skills, etc.). Only onein four U.S. 8th graders takes algebra.
• The topics covered in 8th-grade mathematics classes in the United States are less focused thanthe topics covered in Germany and Japan.
• Mathematics classes in U.S. 8th-grade classrooms require less high-level thought than classesin Germany and Japan.
• While most U.S. mathematics teachers are aware of education reforms that have been recom-mended by mathematics experts, they exhibit many of these teaching behaviors less frequentlythan Japanese teachers.
• U.S. mathematics and science teachers have more college education than teachers in nearlyall other participating TIMSS countries. However, U.S. teachers are less likely than Germanand Japanese teachers to receive beneficial training and support at the beginning of their teach-ing careers through apprenticeship programs.Sources: U.S. Department of Education, National Center for Education Statistics. (1997). Pursuing excellence: A study of U.S. fourth-grade mathematics and science achievement in international context, NCES 97-255. Washington, DC: U.S. Government Printing Office.
U.S. Department of Education, National Center for Education Statistics. (1996). Pursuing excellence: A study of U.S. eighth-grademathematics and science teaching , learning, curriculum, and achievement in international context, NCES 97-198. Washington, DC:U.S. Government Printing Office.
i, ii, & Chapter 1 10/30/97 12:07 PM Page 12

through apprenticeships and other kinds ofopportunities to interact with, and learnfrom, more experienced teachers.
Curriculum
TIMSS findings are consistent with whatwe already know about curriculum and assess-ment. That is, students do not perform well ifthey are tested on subject matter that they havenot been taught. Nowhere is this more clearlydemonstrated than in 8th grade mathematics.In both Germany and Japan, all 8th gradersenroll in mathematics classes with a heavyemphasis on algebra and geometry. In the U.S.,8th graders are generally grouped by ability intodifferent levels of mathematics classes.11 What is most likely to be taught to U.S. 8th graders is “general mathematics,” or arithmetic (frac-tions, decimals, computational skills, etc.).Only one in four U.S. 8th graders takes algebra
(see Figure 8).12 The percentage ranges from10% in the lowest states to 53% in the higheststates (see Figure 9).13 Geometry is almost nevertaught at Grade 8. In fact, the content coveredin 8th-grade mathematics classes in the U.S. isgenerally covered in the 7th grade in othercountries. Accordingly, U.S. mathematics text-books cover less demanding content than Ger-man and Japanese textbooks, which devotemore space to algebra and geometry.14
In addition to being less challenging, theU.S. curriculum sacrifices depth for breadth.TIMSS researchers have characterized the U.S.curriculum as “a mile wide and an inch deep.”15
After carefully reviewing the most commonmathematics and science textbooks used in dif-ferent countries, researchers concluded that theU.S. curriculum covers too many topics superfi-cially, and does not allow students sufficienttime to develop in-depth understanding of
13
43%
27%
25%
5%
Pre-algebra
General 8th grade mathematics
OtherAlgebra
Source: U.S. Department of Education, National Center for Education Statistics. (in press). NAEP 1996 mathematics cross-state data compendium for the grade 4 and grade 8 assessment. Findings from the state assessment in mathematics of theNational Assessment of Educational Progress, NCES 97-495. Washington, DC: U.S. Government Printing Office.
Figure 8
Percentage of U.S. 8th graders enrolled in various mathematics courses, 1996.
i, ii, & Chapter 1 10/30/97 12:07 PM Page 13

14
New YorkLouisiana
TennesseeMississippi
HawaiiArkansas
North DakotaKentucky
IowaAlabama
IndianaVermont
New MexicoMontana
WyomingWisconsin
TexasNebraska
MaineU.S.
West VirginiaWashington
ArizonaAlaska
South CarolinaMissouri
FloridaCalifornia
OregonConnecticut
ColoradoVirginia
North CarolinaMichigan
GeorgiaRhode Island
MinnesotaDelaware
MassachusettsMaryland
UtahDistrict of Columbia 53%
42%41%41%
39%34%
32%29%29%29%29%
28%28%28%
27%27%27%
27%26%26%26%26%
25%25%
25%25%25%
23%22%22%22%
21%20%20%20%20%
10%
0% 20% 40% 60% 80% 100%
14%
18%18%18%18%
Figure 9
Percentage of public school 8th graders1 enrolled in algebra, 1996
1 The following states either did not participate in the 1996 NAEP mathematics assessment or they did not meetguidelines for public school participation in Grade 8: Idaho, Illinois, Kansas, Nevada, New Hampshire, New Jersey,Ohio, Oklahoma, Pennsylvania, and South Dakota.Source: U.S. Department of Education, National Center for Education Statistics. (in press). NAEP 1996 mathematicscross-state data compendium for the grade 4 and grade 8 assessment. Findings from the state assessment in mathe-matics of the National Assessment of Educational Progress, NCES 97-495. Washington, DC: U.S. Government PrintingOffice.
i, ii, & Chapter 1 10/30/97 12:07 PM Page 14

15
mathematics and science concepts. This weak-ness is reflected in classroom practice. Video-tapes of mathematics classrooms revealed thatU.S. mathematics lessons typically attempt tocover more topics and include more activitiesthan lessons in Germany and Japan.16
Instruction
For years, U.S. mathematics experts haveargued that teachers must change the way theyteach mathematics if we expect studentachievement to improve. In 1989, the NationalCouncil of Teachers of Mathematics (NCTM)became the first group of education experts inthe U.S. to develop new voluntary nationwidestandards which challenge conventional wis-dom about what is taught in mathematics andhow it is taught.17 The NCTM standards call forfar more rigorous content so that all studentswill achieve at higher levels in mathematics.They also place heavy emphasis on developingproblem-solving, communication, and reason-ing skills.
When TIMSS researchers asked U.S. math-ematics teachers whether they were aware ofcurrent ideas about mathematics teaching and
learning, 95% said that they were. And whenTIMSS researchers asked teachers whose math-ematics lessons were videotaped whether theirlessons reflected current thinking about mathe-matics teaching and learning, almost 75% saidthat they did.18
Yet the U.S. teachers seldom focused onmathematical thinking and problem-solvingduring their videotaped lessons. Experts whoanalyzed the sequencing of material and thecomplexity of reasoning required of students ina random sample of lesson transcripts from theUnited States, Germany, and Japan concludedthat U.S. lessons required less high-level mathe-matical thought than those in the other twocountries (see Figure 10).19 Nearly one-third ofthe Japanese lessons and nearly one-fourth ofthe German lessons were judged to be of highquality, compared to none of the U.S. lessons. Infact, the lowest rating for lesson quality wasgiven to 87% of U.S. lessons, 40% of Germanlessons, and only 13% of Japanese lessons.
Teacher training
Encouraging news from TIMSS is that U.S.mathematics and science teachers have more
Figure 10
Percentage of 8th grade mathematics lessons rated by experts as low-, medium-, and high-quality
Source: Third International Mathematics and Science Study; unpublished tabulations, Videotape Classroom Study, UCLA,1996. (as reported in National Center for Education Statistics. (1996). Pursuing excellence: A study of U.S. eighth-grademathematics and science teaching, learning, curriculum, and achievement in international context, NCES 97-198.Washington, DC: U.S. Government Printing Office.)
0%
20%
40%
60%
80%
100%
U.S.JapanGermany
High
Medium
Low40% 37%
23%
13%
57%
30%
87%
13%
0%
i, ii, & Chapter 1 10/30/97 12:07 PM Page 15

years of university training than teachers innearly all other participating TIMSS countries.However, U.S. teachers differ from their col-leagues in Germany and Japan in the amount offormal and informal training and support thatthey receive once they finish their universitydegrees. Compared to teachers in these twocountries, beginning U.S. teachers are less like-ly to participate in formal apprenticeship pro-grams as they enter the teaching profession.Such apprenticeships typically pair new teach-ers with expert mentor teachers who can assistand support them during a structured initialperiod of on-the-job training, in which theirteaching load is reduced. While this practicedoes occur in some U.S. school districts, it is notuniversal. In addition, TIMSS found that U.S.teachers teach more classes per week and havefewer informal opportunities to learn from otherteachers than teachers in Japan do.
Although U.S. teachers have spent moretime in college than teachers in most other par-ticipating TIMSS countries, this does notensure that teachers have adequate subject-mat-ter knowledge in the field which they are actu-ally assigned to teach. Out-of-field teaching, apractice in which teachers are assigned to teachcourses outside their area of specialization, isnot uncommon in the United States. It is par-ticularly prevalent at the secondary level and inthe fields of mathematics and science. During1993-1994, nearly one in three public highschool mathematics teachers (32%) did nothave even a minor in mathematics; nearly onein four science teachers (22%) did not haveeven a minor in science.20 In mathematics, thepercentage ranged from 12% to 57% in individ-ual states (see Figure 11). In science, the per-centage ranged from 6% to 39% in individual
states (see Figure 12). Chances were evengreater that a student would be assigned an out-of-field teacher if he or she attended a high-poverty school.21
The bottom line
We can draw three important conclusionsfrom the recent TIMSS findings:
1. While our performance in 4th grade scienceshows that the Goal of being first in theworld in mathematics and science is attain-able, other areas show that we are far frombeing a world leader.
U.S. students scored above the internation-al average in science at Grades 4 and 8, and inmathematics at Grade 4. But is this goodenough? Do we want our children to be merelyabove average, or do we want them to excel?
2. We will not reach the Goal if we do notexpect more from our students.
Preliminary evidence suggests that neitherour textbooks nor the content of our mathemat-ics and science classes is sufficiently challeng-ing. We demand less high-level thought fromour students than other countries do, and ourinstruction is less focused. Instead of a centralset of knowledge and skills that we expect allstudents to know and be able to do, our teachersare trying to cover too many topics, resulting inonly superficial understanding.
3. We will not reach the Goal if we do not create the conditions that will enable ourteachers to teach well.
We permit untrained teachers in our chil-dren’s classrooms through a variety of policies,such as granting waivers, issuing emergency cre-dentials, and allowing out-of-field teaching. We
16
Who is Teaching Mathematics and Science
To Your Child?
• During 1993-1994, nearly one in three public high school mathematics teachers (32%) did not have even a minor in mathematics. The percentage ranged from 12% to 57% in individual states.20
• During 1993-1994, nearly one in four public high school science teachers (22%) did nothave even a minor in science. The percentage ranged from 6% to 39% in individual states.20
• Chances were even greater that a student would be assigned an out-of-field teacher in mathematics and science courses if he or she attended a high-poverty school.21
i, ii, & Chapter 1 10/30/97 12:07 PM Page 16

17
12%
12%
14%
16%
16%
22%
22%
23%
23%
24%24%
24%
24%
25%27%
27%
28%
29%29%29%
29%
31%
31%
31%32%32%33%
33%
33%
33%
34%
34%34%
35%
36%36%
37%38%
38%39%
43%43%
46%48%
49%
54%54%
56%57%
0% 20% 40% 60% 80% 100%
Iowa
OregonHawaii
LouisianaIdaho
AlaskaWashington
DelawareCalifornia
Arizona
TennesseeMassachusetts
Colorado
New JerseyMaine
New MexicoMichigan
VirginiaUtah
Nevada
WisconsinOhio
North CarolinaArkansas
West VirginiaU.S.
Oklahoma
Kentucky
KansasSouth Carolina
Mississippi
MarylandIllinois
Florida
WyomingSouth Dakota
GeorgiaTexas
New York
MontanaAlabama
Nebraska
ConnecticutNew Hampshire
IndianaNorth Dakota
Minnesota
Pennsylvania
Missouri
Figure 11
Percentage of public secondary teachers1 who taught one or more mathematics classes without at least a minor in mathematics, 1993-1994
1 Too few cases for a reliable estimate for the District of Columbia, Rhode Island, and Vermont.Source: U.S. Department of Education, National Center for Education Statistics, Public School Teacher Surveys of theSchools and Staffing Survey, 1993-1994, unpublished tabulations prepared by Westat, August 1997.
i, ii, & Chapter 1 10/30/97 12:07 PM Page 17

18
North Dakota
Louisiana
Tennessee
Georgia
Kentucky
Virginia
North Carolina
California
New Jersey
Maine
Mississippi
Alaska
Wisconsin
West Virginia
Ohio
South Dakota
Illinois
U.S.
Oklahoma
Michigan
Utah
Florida
Arizona
South Carolina
New Mexico
Missouri
Kansas
Idaho
Alabama
Wyoming
Texas
Montana
Pennsylvania
Nebraska
Massachusetts
Connecticut
Oregon
New York
Maryland
Indiana
Washington
Arkansas
Colorado
Iowa
Minnesota6%
37%
36%
35%
32%
31%
31%
29%
29%
28%
28%
26%
24%
24%
23%
23%
22%
22%
22%
21%
21%
20%
19%
19%
18%
18%
18%
18%
17%
17%
17%
16%
16%
16%
14%
13%
13%
13%
13%
11%
11%
10%
9%
8%
0% 20% 40% 60% 80% 100%
39%
Figure 12
Percentage of public secondary teachers1 who taught one or more science classes without at least a minor in science, 1993-1994
1 Too few cases for a reliable estimate for Delaware, the District of Columbia, Hawaii, Nevada, New Hampshire,Rhode Island, and Vermont.Source: U.S. Department of Education, National Center for Education Statistics, Public School Teacher Surveys of theSchools and Staffing Survey, 1993-1994, unpublished tabulations prepared by Westat, August 1997.
i, ii, & Chapter 1 10/30/97 12:07 PM Page 18

19
do not provide the kinds of practical trainingand support for our teachers that other coun-tries provide. Despite the fact that most U.S.teachers are aware of current education reforms,too few are translating them into practice. Itshould come as no surprise that lesson qualityand student achievement are both lower thandesirable.
What should we do about it?
The National Education Goals Panel firmlybelieves that we can and must address thesedeficiencies. But policymakers, educators, busi-ness leaders, parents, and the public must worktogether to do three things if we want to raisemathematics and science achievement toworld-class levels.
Step 1. Set tougher standards for students inmathematics and science that are comparableto the best in the world.
By now all states but one have been activelyengaged in the process of setting more challeng-ing standards for their students.22 Twenty-eightof the nation’s largest urban districts alsorecently reported that they were in the processof developing or adopting their own standards.23
Researchers caution, however, that“although it is clear that most states have beenactively working on their standards, it shouldnot yet be taken for granted that the standardsare uniformly of high quality across the states...in some states the standards are clear and read-able, but in others they lack internal coherence,are poorly formatted, are susceptible to misin-terpretation, or are otherwise of lower quality.”24
It should also not be taken for granted thatcurrent state and local standards are as chal-lenging as those set in other countries. While itis fairly common to find that states havereviewed standards and assessments developedby other states to see how theirs compare, fewstates have attempted any type of internationalcomparisons. Only 12 states report that theyactually examined standards, tests, or curricularmaterials from other countries when designingtheir own standards.25 And those states that didattempt to review materials from other coun-tries were generally limited to information fromEnglish-speaking countries, since translatedmaterials were not readily available.
Until recently, there was no single placewhere states and local communities could turn
for help to see whether they had set their stan-dards high enough, what they could learn fromthe experience of others, or how their standardscompared to the best in the world. This year anindependent, nongovernmental organization,“Achieve,” was created by Governors and busi-ness leaders to provide this type of assistance tostates and communities.
Achieve is in the process of establishing abenchmarking service to help state leaders eval-uate their standards against those of high-performing states and nations. For further infor-mation about this and other services ofAchieve, see its Website (www.achieve.org) orwrite to Achieve, 1280 Massachusetts Avenue,Suite 410, Cambridge, MA 02138 or call (617)496-6300.
Step 2. Align other components of theeducation system with the standards, includ-ing curricula, instruction, textbooks, assess-ments, and school policies.
Setting higher expectationsis a necessary, but not sufficient,step to increase student achieve-ment. Once a state or a commu-nity has agreed upon its stan-dards, other components of theeducation system will very likelyneed some fine-tuning so thatthey are not working at cross-purposes.
For example, courses that require minimalstudent effort will need to be replaced withhigher-level mathematics and science coursesthat prepare all students to meet the standards.New curriculum frameworks may need to bewritten to translate the essential concepts thatall students are expected to know into samplelessons and practical classroom activities thatteachers can use in their classrooms. States mayneed to review teacher licensure policies, andteachers already in the workforce may requireadditional training to learn new content, usenew technology, or implement a wider variety ofeffective instructional approaches. Textbooksmay need to be replaced with other instruction-al materials that help teachers focus lessons on alimited number of topics, develop them indepth, and link them in coherent ways to otherdisciplines. Assessment systems may need to berevised so that tests actually measure whether ornot students have mastered the skills andknowledge specified in the standards. And grad-uation requirements may have to be changed to
By now all states but one have been activelyengaged in the processof setting more challeng-ing standards for theirstudents.
i, ii, & Chapter 1 10/30/97 12:07 PM Page 19

20
make standards count, so that diplomas areawarded on the basis of what students havelearned, not simply the number of hours spentin school.
Will these kinds of reforms actually lead toworld-class levels of mathematics and scienceachievement? Evidence from Minnesota sug-gests that they will. Minnesota participated as a“mini-nation” in the 1995 TIMSS assessment,testing nearly 5,000 students with the samemathematics and science assessments adminis-tered in the participating TIMSS countries.26 Bydrawing a large, state-representative sample ofstudents for testing, Minnesotans can now com-pare their students’ performance directly to theaverage mathematics and science scores of stu-dents in the United States and in the other par-ticipating TIMSS countries.
What they found is very instructive. Onlyone country, Singapore, outperformed Minnesota8th graders in science. And in earth science,
Minnesota tied Singapore for thehighest score. Mathematics was adifferent story, however. Al-though Minnesota is consistentlyone of the highest performingstates in mathematics on NAEP,Minnesotans found that best inthe U.S. is not the same as best inthe world. Although Minnesota8th graders scored above the U.S.average and above the interna-tional average in mathematics,
their performance placed them in the middle ofthe participating TIMSS countries. As was thecase for the U.S. as a whole, “eighth grademathematics in Minnesota is seventh grademathematics by international standards.”27
Why was the relative standing of Minneso-ta’s 8th graders so markedly different in mathe-matics and science? The answer can be traced todifferences in standards for what studentsshould know and be able to do and the align-ment of other education components withthem. In Minnesota, there is statewide agree-ment that 8th grade science instruction shouldfocus on earth science. Tracking is seldom usedin science to separate students of different abili-ties. Eighth grade science teachers receive spe-cial training in earth science, limit the numberof topics covered during the school year to four,and cover each topic in depth. Most teachersuse the same or similar textbooks, supplementedwith inquiry-oriented science kits and otherappropriate materials.
In mathematics, however, there is no corre-sponding statewide consensus on what studentsshould know and be able to do by the end of 8thgrade in mathematics. More than half of theschools in Minnesota sort students by abilityinto three to five levels of mathematics classes.Algebra and pre-algebra are reserved for thehighest achievers, while the rest are enrolled ingeneral mathematics courses that limit theiropportunities to learn rigorous content. Com-pared to science courses in Minnesota, mathe-matics courses attempt to cover far more topicsthan would seem desirable (an average of 3.5per lesson). And although Minnesota mathe-matics teachers are better trained in their fieldthan their colleagues in other countries andmost are familiar with current mathematicsreforms, they rarely engage students in activitiesrecommended by mathematics experts, such asconducting investigations and working on pro-jects. Like U.S. teachers in general, Minnesotamathematics teachers have limited opportuni-ties to observe other teachers and meet withthem to plan lessons or discuss mathematics.
The resulting differences in internationalstanding in 8th grade mathematics and scienceshow that “U.S. students can be the best in theworld when we give them a curriculum that isfocused and coherent and that is delivered byteachers well trained in the content beingoffered at that level. [But] even the same stu-dents who performed as the world’s best in earthscience do not do well in mathematics whenthey are given a mathematics curriculum that isa ‘mile wide and an inch deep.’”28
Step 3. Strengthen teachers’ subject matterknowledge and teaching skills in mathematicsand science and move state teacher policiesmore in line with instructional goals embed-ded in state standards.
The highest standards, the most rigorouscourses, the most focused curricula and text-books, and the most challenging assessmentswill still fail to raise U.S. mathematics and sci-ence achievement to world-class levels unlesswe also strengthen the preparation and ongoingprofessional development of our teachers.Research consistently shows that teacher exper-tise is one of the most important factors in rais-ing student achievement.29 One of the mostextensive analyses of data on teachers foundthat differences in expertise (as measured bycollege degrees, years of teaching experience,and scores on teacher licensing examinations)accounted for nearly 40% of the differences
U.S. students can be the best in the worldwhen we give them acurriculum that isfocused and coherentand that is delivered by teachers well trainedin the content beingoffered at that level.
i, ii, & Chapter 1 10/30/97 12:07 PM Page 20

21
in student test scores — more than any otherfactor, including parent education, familyincome, and other socioeconomic characteris-tics.30 Moreover, a review of 60 studies foundthat investing in support for teacher expertisewas found to be the most cost-effective way toincrease student achievement.31
Research also consistently shows that thequality of teacher training matters enormously.It comes as no surprise that teachers who aretrained in both their subject area and in teach-ing skills and who are fully certified are ratedmore highly and are more successful at raisingstudent achievement than teachers with inade-quate preparation.32
Yet alarming numbers of individuals arehired and assigned to teach in our schools with-out the credentials, training, and in-depth sub-ject matter knowledge required to be an expertteacher. This situation is allowed to occurbecause there is enormous variation in statepolicies on teacher licensing and standards foraccreditation of teacher training institutions, aswell as requirements for hiring and assigningteachers to classrooms.33 Some states require abachelor’s degree in the subject to be taught,while others require less than a minor. Somestates require extensive assessments of teachers’subject matter knowledge and teaching skills,while others test only basic reading, writing,and mathematics. Most states do not requiretheir teacher training institutions to be profes-sionally accredited by the National Council forAccreditation of Teacher Education. And fourout of five states allow temporary or emergencyteaching licenses to be granted to individualswho have not fully met state standards. Aspointed out by the National Commission onTeaching & America’s Future,
Although no state will allow a person to fixplumbing, guard swimming pools, style hair,
write wills, design a building, or practice med-icine without completing training and passingan examination, more than 40 states allowschool districts to hire teachers on emergencylicenses who have not met these basic require-ments. States pay more attention to the quali-fications of veterinarians treating the nation’scats and dogs than to those of teachers educat-ing the nation’s children and youth.34
The National Commission on Teaching & America’s Future has proposed five recom-mendations to improve and professionalizeteaching:35
1. Get serious about standards, for both stu-dents and teachers. There must be agreementon what teachers should know and be able to doin order to help students meet higher academicstandards. To that end, the Commission pro-poses strategies such as requiring that allteacher training institutions be professionallyaccredited, and that teacher licensing be basedon demonstrated performance, including testsof subject matter knowledge and teachingknowledge and skill.
2. Reinvent teacher preparation and profes-sional development. Among the proposedstrategies are organizing teacher education andprofessional development around standards,and creating and funding mentoring programsfor all beginning teachers.
3. Fix teacher recruitment and put qualifiedteachers in every classroom. To ensure thatstudents in all districts, not just wealthy ones,are taught by well-trained teachers, the Com-mission urges states and local school districts toimplement strategies that will increase the abil-ity of low-wealth districts to pay for qualifiedteachers, insist that districts hire only qualifiedteachers, and aggressively recruit high-need
How Can We Raise Mathematics and Science Achievement
to World-Class Levels?
1. Set tougher standards for students in mathematics and science that are comparable tothe best in the world.
2. Align other components of the education system with the standards, including curric-ula, instruction, textbooks, assessments, and school policies.
3. Strengthen teachers’ subject matter knowledge and teaching skills in mathematicsand science and move state teacher policies more in line with instructional goalsembedded in state standards.
i, ii, & Chapter 1 10/30/97 12:07 PM Page 21

22
teachers and provide incentives for teaching inshortage areas.
4. Encourage and reward teacher knowledgeand skill. The Commission encourages states anddistricts to develop strategies to reward teachersfor strengthening their skills at every stage oftheir careers, including setting goals and enact-ing incentives for experienced teachers to seekadvanced certification through the NationalBoard for Professional Teaching Standards.
5. Create schools that are organized for stu-dent and teacher success. Ways in which thiscan be done include investing more in teachersand technology and less in nonteaching person-nel, and providing grants to schools for teacher
learning linked to school improve-ment.
Some states have already imple-mented these kinds of educationreforms as part of their efforts toraise student achievement. Con-necticut and North Carolina havedeveloped some of the most com-prehensive approaches. Connecti-cut raised minimum salaries for
beginning teachers, set tougher standards forteacher licensing, created new performance-based examinations, implemented a mentoringprogram for beginning teachers, invested intraining for the mentor teachers, and requiredteachers to earn a master’s degree in educationto obtain a continuing license.36 Connecticutalso provided grants to universities to redesignteacher education programs and eliminated per-manent teaching licenses, requiring instead thatteachers continue to earn credits for courseworkor other forms of professional development forrelicensure.37
North Carolina’s approach included raisingminimum salaries, requiring all schools of educa-tion to be accredited, implementing a mentoringprogram for beginning teachers, recruitingprospective teachers to enter teacher prepara-tion programs by offering financial support fortheir training, creating professional develop-ment academies, and offering veteran teachers anarray of incentives to encourage them to seekadvanced certification from the National Boardfor Professional Teaching Standards.38
Did these investments yield tangibleresults? The evidence suggests that they did.There are more teachers in North Carolina who
are Board-certified than in any other state. AndNorth Carolina students have made some of thelargest gains in the nation in reading and math-ematics since teacher reforms were implement-ed. Connecticut students also made substantialgains and continue to score among the topstates in the U.S. in reading and mathematics,despite an increase in poverty in the state. AndConnecticut now has teacher surpluses insteadof teacher shortages.39
Conclusions
Is the United States first in the world inmathematics and science achievement? Notyet. But we have reason to believe that we canbe. Although we are not where we need to be inmathematics, or in science at the later grades,the U.S. was among the top nations in theworld in 4th grade science, outperformed onlyby Korea. Moreover, the TIMSS results for Min-nesota show that when 8th graders were pre-sented a focused, coherent science curriculumtaught by well-trained teachers, they were out-performed only by Singapore in science. Theseresults suggest that with concentrated effort, theU.S. could dramatically improve students’mathematics and science skills. But it willrequire increased attention to the academicstandards to which we hold ourselves; the align-ment of those standards with curriculum,instruction, textbooks, assessments, and schoolpolicies; and the preparation, ongoing training,and support that we provide to our nation’smathematics and science teachers.
The students we train now will be the doc-tors, engineers, mathematicians, chemists, andcomputer scientists of the 21st century. Somemay very well be the rocket scientists who are incharge of future missions to Mars. While thereis no doubt that America needs students enter-ing these professions to have excellent mathe-matics and science skills, increasing evidencesuggests that the vast majority of jobs in the21st century will require higher levels of mathe-matical and technical skills in order for workersto be successful. This means that we mustexpect more of all of our students, not just thoseplanning to attend college or major in mathe-matics or science. Only then can we be assuredthat the technological expertise and the mathe-matics and science skills of the students we trainnow will be sufficient to meet the challenges ofthe 21st century.
Is the United States first in the world in mathematics and science achievement?Not yet. But we havereason to believe that we can be.
i, ii, & Chapter 1 10/30/97 12:07 PM Page 22

23
1 Turner, R. Newsweek. Who needs astronauts? July 21, 1997,p. 33, Volume CXXX, No. 3.
2 Begley, S. Newsweek. The stars of Mars. July 21, 1997, pp. 26-32, Volume CXXX, No. 3.
3 Sawyer, K. Washington Post. Martian rover makes detailedrock analysis. July 8, 1997, p. A6.
4 Ibid.
5 National Commission on Excellence in Education. (1983). Anation at risk: The imperative for educational reform. Washington,DC: U.S. Government Printing Office.
6 National Council of Teachers of Mathematics. (1989,March). Curriculum and evaluation standards for school mathematics.Reston, VA: author.
National Council of Teachers of Mathematics. (1991,March). Professional standards for teaching mathematics. Reston,VA: author.
American Association for the Advancement of Science.(1993). Benchmarks for science literacy. New York: Oxford Univer-sity Press.
National Research Council. (1996). National science educa-tion standards. Washington, DC: National Academy Press.
7 Reese, C.M., Miller, K.E., Mazzeo, J., & Dossey, J.A. (1997).NAEP 1996 mathematics report card for the nation and the states.Washington, DC: National Center for Education Statistics.
8 LaPointe, A.E., Askew, J.M., & Mead, N.A. (1992). Learningmathematics. Princeton, NJ: Educational Testing Service, Centerfor the Assessment of Educational Progress.
LaPointe, A.E., Askew, J.M., & Mead, N.A. (1992). Learningscience. Princeton, NJ: Educational Testing Service, Center forthe Assessment of Educational Progress.
9 Bybee, R.W., et al. (1994). Science: Measuring U.S. students’success. Princeton, NJ: Educational Testing Service. (as reportedin National Science Foundation. (1996, January). Indicators of sci-ence & mathematics education: 1995. Arlington, VA: author.)
Dossey, J.A., et al. (1994). Mathematics: How do U.S. studentsmeasure up? Princeton, NJ: Educational Testing Service. (asreported in National Science Foundation. (1996, January). Indica-tors of science & mathematics education: 1995. Arlington, VA:author.)
10 U.S. Department of Education, National Center for Educa-tion Statistics. (1997). Pursuing excellence: A study of U.S. fourth-grade mathematics and science achievement in international context,NCES 97-255. Washington, DC: U.S. Government PrintingOffice.
11 U.S. Department of Education, National Center for Educa-tion Statistics. (1996). Pursuing excellence: A study of U.S.eighth-grade mathematics and science teaching, learning, curriculum, andachievement in international context, NCES 97-198. Washington,DC: U.S. Government Printing Office.
12 Reese, C.M., Miller, K.E., Mazzeo, J., & Dossey, J.A. (1997).NAEP 1996 mathematics report card for the nation and the states.Washington, DC: National Center for Education Statistics.
13 Ibid.
14 Schmidt, W.H., McKnight, C.C., & Raizen, S.A. (1997). Asplintered vision: An investigation of U.S. science and mathematicseducation. Dordrecht, the Netherlands: Kluwer Academic Pub-lishers.
15 Ibid.
16 Third International Mathematics and Science Study; unpub-lished tabulations, Videotape Classroom Study, UCLA, 1996. (asreported in U.S. Department of Education, National Center forEducation Statistics. (1996). Pursuing excellence: A study of U.S.eighth-grade mathematics and science teaching, learning, curriculum,and achievement in international context, NCES 97-198. Washing-ton, DC: U.S. Government Printing Office.)
17 National Council of Teachers of Mathematics. (1989,March). Curriculum and evaluation standards for school mathematics.Reston, VA: author.
18 U.S. Department of Education, National Center for Educa-tion Statistics. (1996). Pursuing excellence: A study of U.S. eighth-grade mathematics and science teaching, learning, curriculum, andachievement in international context, NCES 97-198. Washington,DC: U.S. Government Printing Office.
19 Third International Mathematics and Science Study; unpub-lished tabulations, Videotape Classroom Study, UCLA, 1996. (asreported in U.S. Department of Education, National Center forEducation Statistics. (1996). Pursuing excellence: A study of U.S.eighth-grade mathematics and science teaching, learning, curriculum,and achievement in international context, NCES 97-198. Washing-ton, DC: U.S. Government Printing Office.
20 U.S. Department of Education, National Center for Educa-tion Statistics, Public School Teacher Surveys of the Schools andStaffing Survey, 1993-94, unpublished tabulations prepared byWestat, August 1997.
21 U.S. Department of Education, National Center for Educa-tion Statistics. (1996). The condition of education, 1996. Washing-ton, DC: U.S. Government Printing Office.
22 American Federation of Teachers. (1997). Making standardsmatter, 1997. Washington, DC: author.
23 Council of the Great City Schools. (1996, June). Becomingthe best: Standards and assessment development in the Great CitySchools. Washington, DC: author.
24 Zucker, A.A. (1997, July). Reflections on state efforts to improvemathematics and science education in light of findings from TIMSS,pp. 12-13. Paper prepared for the National Education GoalsPanel, Washington, DC.
25 American Federation of Teachers. (1996). Making standardsmatter, 1996. Washington, DC: author.
26 SciMathMN. (1997). Minnesota TIMSS report: A preliminarysummary of results for the Third International Mathematics and Science Study. St. Paul, MN: author.
27 Ibid, p. 1.
28 Schmidt, W.H. (1997, March 10). Press statement uponrelease of Minnesota TIMSS report: A preliminary summary of resultsfor the Third International Mathematics and Science Study, p. 2.
29 See Darling Hammond, L., & Loewenberg Ball, D. (1997,July). Teaching for high standards: What policymakers need to knowand be able to do. Paper prepared for the National Education GoalsPanel, Washington, DC.
30 Ferguson, R.F. (1991, Summer). Paying for public education:New evidence of how and why money matters. Harvard Journal onLegislation 28:465-498.
31 Greenwald, R., Hedges, L.V., & Laine, R.D. (1996, Fall). Theeffect of school resources in student achievement. Review of Edu-cational Research 66: 361-396.
32 Darling Hammond, L., & Loewenberg Ball, D. (1997, July).Teaching for high standards: What policymakers need to know and beable to do. Paper prepared for the National Education Goals Panel,Washington, DC.
33 Ibid.
34 National Commission on Teaching & America’s Future. (1996,September). What matters most: Teaching for America’s future, pp.14-15. New York: Teachers College, Columbia University.
35 Ibid.
36 Darling Hammond, L., & Loewenberg Ball, D. (1997, July).Teaching for high standards: What policymakers need to know and beable to do. Paper prepared for the National Education Goals Panel,Washington, DC.
37 Massell, D. (1997, July). Clarifying questions about persistenceand change: Standards-based reform in nine states. Paper prepared forthe National Education Goals Panel, Washington, DC.
38 Darling Hammond, L., & Loewenberg Ball, D. (1997, July).Teaching for high standards: What policymakers need to know and beable to do. Paper prepared for the National Education Goals Panel,Washington, DC.
39 Ibid.
i, ii, & Chapter 1 10/30/97 12:07 PM Page 23

24
i, ii, & Chapter 1 10/30/97 12:07 PM Page 24

25
Chapter 1 of this report described in detailwhere the United States stands with respect
to the fifth National Education Goal, mathe-matics and science achievement. This chapteraddresses national progress across all eightGoals, as measured by 26 core indicators.National progress on the 26 core indicators isslightly better than the progress that was char-acterized in the 1996 Goals Report. Nationalperformance has improved significantly* in sixareas:
• The proportion of infants born with one ormore health risks has decreased (Goal 1 indi-cator).
• More 2-year-olds have been fully immunizedagainst preventable childhood diseases (Goal 1 indicator).
• More families are reading and telling storiesto their children on a regular basis (Goal 1indicator).
• Mathematics achievement has improvedamong students in Grades 4, 8, and 12 (Goal 3indicator).
• More students are receiving degrees in math-ematics and science. This is true for femalesand minorities, as well as for all students(Goal 5 indicator).
• Incidents of threats and injuries to studentsat school have decreased (Goal 7 indicator).
In seven areas national performance hasdeclined:
• Reading achievement at Grade 12 hasdeclined (Goal 3 indicator).
• The percentage of secondary school teacherswho hold a degree in their main teachingassignment has decreased (Goal 4 indicator).
• Fewer adults with a high school diploma orless are participating in adult education,compared to those who have postsecondaryeducation (Goal 6 indicator).
• Student drug use has increased(Goal 7 indicator).
• Attempted sales of drugs atschool have increased (Goal 7indicator).
• Threats and injuries to public school teachershave increased (Goal 7 indicator).
• More teachers are reporting that disruptionsin their classrooms interfere with their teach-ing (Goal 7 indicator).
In seven areas no significant changes innational performance have occurred. Since theGoals were established, we have not:
• reduced the gap in preschool participationrates between high- and low-income families(Goal 1 indicator);
National performancehas improved in six areas and declined in seven.
Chapter 2: How Are We Doing at the National Level?
* In this report, “significance” refers to statistical significance and indicates that the observed differences are not likely to have occurredby chance.
Chapter 2 10/30/97 12:09 PM Page 25

26
• improved the high school completion rate(Goal 2 indicator);
• improved reading achievement at Grades 4and 8 (Goal 3 indicator);
• reduced the gap in college enrollment ratesand college completion rates between Whiteand minority students (Goal 6 indicators);
• reduced the percentage of students whoreport using alcohol (Goal 7 indicator);
• reduced student reports of classroom disrup-tions that interfere with their learning (Goal 7indicator); or
• increased the percentage of parents whoreport being involved in activities in theirchild’s school (Goal 8 indicator).
In addition, there are still a number of areaswhere we do not yet have a second data point todetermine whether performance has improvedor declined. For example:
• We do not know whether more students arecompetent in writing, science, history, andgeography.
• We do not know whether more teachers areparticipating in professional developmentprograms.
• We cannot be certain whether our perfor-mance on international mathematics and science assessments has improved.
• We cannot report whether more adults areable to perform complex literacy tasks thatwill enable them to compete successfully in a
global economy.
•We cannot tell whether moreschools are reporting that parentsare attending parent-teacherconferences or that parent inputis considered when makingschool policy decisions.
The 1997 U.S. scorecard, which summarizesnational progress on the 26 core indicators,begins on page 30.
Exhibits for each of the 26 indicators beginon page 35.
Progress on Filling in the Data Gaps —The Past, the Present, and FutureChallenges
The National Education Goals Panel is com-mitted to providing the nation and each statewith the most recent information with which tomonitor progress toward the Goals. However,some states still lack comparable data for a fewindicators, which constrains the Panel’s abilityto provide full progress reports for those states.In addition, as was the case at the nationallevel, in some areas we cannot determinewhether state-level performance has improvedor fallen further behind, because at present asecond data point does not exist to compareagainst our baseline performance.
The Past
Inability to measure educational progress insome areas has long been a concern of the GoalsPanel. The Panel has regularly turned to expertadvice and recommendations for the best waysto measure progress toward the Goals, evenwhen such data were not currently available orwould require new data collections. In 1995, thePanel created a Data and Reporting Task Force.The purpose of this Task Force was to identifyand recommend strategies for filling data gaps —strategies that would make creative use of exist-ing data collections, plan smaller follow-upstudies to original surveys, and extend existingnational data collections to the state level.
In 1996, the Panel developed a StrategicPlan for Data Collection based on the recom-mendations of the Task Force. This plan con-sisted of three steps: set data priorities (at boththe national and state levels); inform state offi-cials of actions they can take to help fill some of the data gaps; and explore the possibility of reporting individual states’ data in separate publications.
The Present
Where have these efforts brought us? Whathave we learned?
Data PrioritiesIn late summer of 1996, the Goals Panel met
with the Commissioner of the National Centerfor Education Statistics (NCES) to discuss the
In seven areas no significant changes innational performancehave occurred.
Chapter 2 10/30/97 12:09 PM Page 26

27
Panel’s data priorities. The Panel indicated theneed for:
• an additional national and state-level NationalAssessment of Educational Progress (NAEP)mathematics assessment before the year 2000;
• an additional state-level NAEP readingassessment; and
• a second national and state-level NAEP sci-ence assessment.
Lower priorities included:
• a household survey at the national and statelevels to measure progress on several indica-tors;
• a small-scale version of the National AdultLiteracy Survey that would allow for stateparticipation; and
• national NAEP assessments in economicsand foreign languages.
Since that meeting, the Goals Panel haslearned that NCES plans to conduct a variety ofsurveys and assessments in the coming years tomeet these identified needs, including:
• national and state-level assessments in math-ematics and science (2000), and in reading(1998);
• a household survey at the national level tomeasure family-child reading and story-telling, preschool participation, adult educa-tion participation, and parental involvement(1999);
• a small-scale version of the Third Inter-national Mathematics and Science Study(1998-1999); and
• an additional adult literacy survey (2002).
National and state-level data collectionschedules can be found in Appendix A.
State ActivitiesLast year, the Panel requested that all Gover-
nors and chief state school officers participate in three data collections to help fill some of the data gaps. The Panel called upon states toparticipate voluntarily in NAEP (which wouldprovide information on student achievement);
comply with the uniform definition of“dropout” in NCES’ Common Core of Data(CCD); and participate voluntarily in theYouth Risk Behavior Survey (YRBS) conductedby the Centers for Disease Control and Preven-tion (which would provide information on indi-cators such as drug use and safety). Progress hasbeen made in all three areas.
NAEP is the key indicator that the Paneluses to monitor progress toward Goal 3, studentachievement and citizenship. In 1988, Congressadded a new dimension to NAEP by authorizingvoluntary participation of publicschools in state-level assess-ments. In the first administrationin 1990, 40 states and territoriesparticipated in the mathematicsassessment. During the mostrecent mathematics assessmentin 1996, 45 states and territoriesparticipated. In addition, 45states and territories participatedin the first science assessment in1996.
To monitor progress toward Goal 2 at thestate level, the Panel uses the dropout statisticfrom the CCD. The CCD provides basic dataon all schools and school districts in the nationthrough state administrative record systems,using a common set of definitions and reportingmetrics that can be used by all states. Althoughall states participate in the CCD surveys, somestates do not submit data for every item request-ed or use the common definition. The 1991-1992 school year was the first for which statesreported school district level data on the num-bers and types of dropouts. For that year, 13states and the District of Columbia reporteddata that met the CCD uniform definition of“dropout.” Among the states that reporteddropouts for the 1993-1994 school year, 24states and the District of Columbia adhered tothe standard definition and collection proce-dures. These data are presented in this report.
To monitor progress toward Goal 7 at thestate level, the Panel uses data from the YRBS,a component of the Centers for Disease Controland Prevention’s Youth Risk Behavior Surveil-lance System — a system designed to measurepriority health risk behaviors that contribute to the leading causes of mortality, morbidity,and social problems among youth. The first
In the first state-levelNAEP mathematicsassessment in 1990, 40 states and territoriesparticipated. During themost recent mathematicsassessment in 1996, 45states and territoriesparticipated.
Chapter 2 10/30/97 12:09 PM Page 27

28
survey was administered in 1991, from whichwe report data for 10 states and territories. Datafor 25 states and territories from the 1995 surveyare included in this year’s report.
Future Challenges
Although these accomplishments represent agreat deal of progress, there is still much workthat needs to be done, especially at the state
level. For instance, we still do nothave comparable state data onthree national core indicators:family-child reading and story-telling, preschool participation,
and adult education participation. And althoughmore states are participating in the NAEP andYRBS collections and complying with the uni-form definition of “dropout” in the CCD, pro-jections of state participation rates in futureadministrations of these data collections do notindicate an increase in state participation.
To fill these gaps in data, the Goals Panel willcontinue to encourage individual states to par-ticipate in key data collections, and will contin-ue to work with NCES and other data providersto offer our users a more comprehensive look atnational and state progress toward the Goals.
There is still much workto be done to fill in thedata gaps, especially atthe state level.
From the start, measuring Goal 1 — the readiness goal — has proven to be difficult. No direct measurecurrently exists to tell us the proportion of the nation’s children who are ready to learn when they startschool. Instead, the Panel reports annually on the progress of the nation and the states at meeting thehealth, family, and preschool objectives associated with Goal 1.
The Goals Panel recognized that it was important to build consensus about what it means for a child to beready to learn when he/she starts school. Based on the advice of its Goal 1 advisory group — a group ofearly childhood experts, university officials, and state officials — the Goals Panel adopted a broad defini-tion of readiness which entails five dimensions of children’s early learning and development: health andphysical development; emotional well-being and social competence; approaches to learning; communica-tion skills; and cognition and general knowledge.
The National Center for Education Statistics will soon conduct an Early Childhood Longitudinal Study(ECLS) which builds on these five dimensions. The study will collect data on a national sample of youngchildren to describe (1) children's status when they enter school; (2) their transition into school; and (3)their progress through fifth grade. Data will be collected directly from children, their parents/guardians,teachers, and schools, and will address the five dimensions of children's early learning and development.
In 1994, the U.S. Congress charged the Goals Panel to support its Goal 1 advisory group to: “Create clearguidelines regarding the nature, functions, and uses of early childhood assessments, including assessmentformats that are appropriate for use in culturally and linguistically diverse communities, based on modelelements of school readiness.” The Goal 1 advisory group will soon report their recommendations andprinciples for early childhood assessments to the Panel. This work builds upon a 1996 survey of state andlocal practices in the assessment of young children and recent developments in these assessments.
Measuring Progress Toward Goal 1
Chapter 2 10/30/97 12:09 PM Page 28

29
Update Progress?Baseline
1. Children's Health Index: Has the U.S. reduced the percentageof infants born with 1 or more health risks? (1990, 1995) 37% 34% %%
6. Reading Achievement: Has the U.S. increased the percentage of students who meet the Goals Panel's performance standard in reading? (1992, 1994)• Grade 4 29% 30%ns &&$$• Grade 8 29% 30%ns &&$$• Grade 12 40% 36% ''
10. History Achievement: Has the U.S. increased the percentage of students who meet the Goals Panel’s performance standard in U.S. history? (1994)• Grade 4 17% —• Grade 8 14% —• Grade 12 11% —
1 Data in this column represent our starting points. Baselines were established as close as possible to 1990, the year that the National Education Goals were adopted.
2 Data in this column represent our current level of performance and are the most recent data available.
3 Progress represents progress from the baseline year to the most recent update year.
4 Progress is shown by an arrow. Arrows which point upward indicate that we have made progress. Arrows which point downward indicate that we have fallen further behind. Horizontal arrows indicate that performance has not changed or that the change was not statistically significant.
5 The source of the data and any technical notes for each national core indicator are referenced by this number in Appendix B.
6 The date(s) in parentheses indicates the year(s) in which data were collected for the national core indicator. If there are two dates, the first indicates the baseline year and the second indicates the most recent year in which data were collected.
7 ns means that a change from the baseline year to the most recent year was not statistically significant.
8 — means data not available. See Appendix A.
Guide to Reading the U.S. Pages
4
7
8
5
6
12 3
Chapter 2 10/30/97 12:09 PM Page 29

30
— Data not available. See Appendix A.ns Interpret with caution. Change was
not statistically significant.
See page 29 for a Guide to Reading the U.S. Pages.See Appendix B for technical notes and sources.
Update Progress?Baseline
GOAL 1
UNITED STATES
GOAL 2
GOAL 3
Ready to Learn
1. Children’s Health Index: Has the U.S. reduced the percentage of infants born with 1 or more health risks? (1990, 1995) 37% 34% %%
Late or no prenatal care, low maternal weight gain, smoking during pregnancy, and drinking alcohol duringpregnancy—the four health risks that are measured by the Children's Health Index—can directly affectnewborns' physical health.
2. Immunizations: Has the U.S. increased the percentage of 2-year-olds who have been fully immunized against preventable childhood diseases? (1994, 1996) 75% 78% %%
One of the most important preventive actions parents can take to see that their children receive the healthcare needed to arrive at school with healthy minds and bodies is to make certain that they are fully immu-nized against preventable childhood diseases.
3. Family-Child Reading and Storytelling: Has the U.S. increased the percentage of 3- to 5-year-olds whose parents read to them or tell them stories regularly? (1993, 1996) 66% 72% %%
Early, regular reading to children is one of the most important activities parents can do with their childrento improve their readiness for school, serve as their child’s first teachers, and instill a love of books andreading.
4. Preschool Participation: Has the U.S. reduced the gap in preschool participation between 3- to 5-year-olds from high- and low-income families? (1991, 1996) 28 points 29 points
ns&&$$
High-quality preschool programs can accelerate the development of all children, and poor children in particular. However, children from low-income families are the least likely to attend early care and education programs.
School Completion
5. High School Completion: Has the U.S. increased the percentage of 18- to 24-year-olds who have a high school credential? (1990, 1996) 86% 86% &&$$
While possession of a high school diploma no longer guarantees easy access to jobs, lack of a diploma orits equivalent almost certainly means that an individual will experience difficulty entering the labor marketand will be at pronounced educational, social, and economic disadvantages throughout his or her life.
Student Achievement and Citizenship
Although all of the National Education Goals are important, increasing student achievement in the coresubject areas will be the ultimate test of successful education reform.
6. Reading Achievement: Has the U.S. increased the percentage of students who meet the Goals Panel’s performance standard in reading? (1992, 1994)• Grade 4 29% 30%
ns&&$$
• Grade 8 29% 30%ns
&&$$• Grade 12 40% 36% ''
Chapter 2 10/30/97 12:09 PM Page 30

31
— Data not available. See Appendix A.ns Interpret with caution. Change was
not statistically significant.
See page 29 for a Guide to Reading the U.S. Pages.See Appendix B for technical notes and sources.
Update Progress?BaselineUNITED STATESGOAL 3
GOAL 4
Student Achievement and Citizenship (continued)
7. Writing Achievement: Has the U.S. increased the percentage of students who can produce basic, extended, developed, or elaborated responses to narrative writing tasks? (1992) • Grade 4 55% —• Grade 8 78% —• Grade 12 — —
8. Mathematics Achievement: Has the U.S. increased the percentage of students who meet the Goals Panel’s performance standard in mathematics? (1990, 1996)• Grade 4 13% 21% %%• Grade 8 15% 24% %%• Grade 12 12% 16% %%
9. Science Achievement: Has the U.S. increased the percentage of students who meet the Goals Panel’s performance standard in science? (1996)• Grade 4 29% —• Grade 8 29% —• Grade 12 21% —
10. History Achievement: Has the U.S. increased the percentage of students who meet the Goals Panel’s performance standard in U.S. history? (1994) • Grade 4 17% —• Grade 8 14% —• Grade 12 11% —
11. Geography Achievement: Has the U.S. increased the percentage of students who meet the Goals Panel’s performance standard in geography? (1994) • Grade 4 22% —• Grade 8 28% —• Grade 12 27% —
Teacher Education and Professional Development
12. Teacher Preparation: Has the U.S. increased the percentage of secondary school teachers who hold an undergraduate or graduate degree in their main teaching assignment? (1991, 1994) 66% 63% ''
Teachers who are trained in both their subject area and in teaching skills and who are fully certified are more successful at raising student achievement than teachers with inadequate preparation.
13. Teacher Professional Development: Has the U.S. increased the percentage of teachers reporting that they participated in professional development programs on 1 or more topics since the end of the previous school year? (1994) 85% —
Investing in professional development is one of the most cost-effective ways to raise student achievement.Professional development is most effective when it is connected to what teachers do in their classrooms,and when it focuses on instructional content, how students learn, and how best to teach.
Chapter 2 10/30/97 12:09 PM Page 31

32
Update Progress?Baseline
— Data not available. See Appendix A.ns Interpret with caution. Change was
not statistically significant.
See page 29 for a Guide to Reading the U.S. Pages.See Appendix B for technical notes and sources.
UNITED STATESGOAL 5
GOAL 6
Mathematics and Science
If the United States is to ensure a competitive workforce which possesses the necessary scientific andtechnological skills to fill the jobs of the future and compete in a global economy, we must develop themathematics and science skills of all of our students, not simply the very best.
14. International Mathematics Achievement: Has the U.S. improved its standing oninternational mathematics assessments? (1995)• Grade 4 7 out of 25 countries scored above the U.S.• Grade 8 20 out of 40 countries scored above the U.S.• Grade 12 — —
15. International Science Achievement: Has the U.S. improved its standing on international science assessments? (1995)• Grade 4 1 out of 25 countries scored above the U.S.• Grade 8 9 out of 40 countries scored above the U.S.• Grade 12 — —
16. Mathematics and Science Degrees: Has the U.S. increased mathematics and science degrees as a percentage of all degrees awarded to: (1991, 1995)• all students? 39% 42% %%• minorities (Blacks, Hispanics, American Indians/Alaskan Natives)? 39% 40% %%• females? 35% 37% %%
Adult Literacy and Lifelong Learning
17. Adult Literacy: Has the U.S. increased the percentage of adults who score at or above Level 3 in prose literacy? (1992) 52% —
Individuals demonstrating higher levels of literacy are more likely to be employed, work more weeks in ayear, and earn higher wages than individuals demonstrating low levels of literacy.
18. Participation in Adult Education: Has the U.S. reduced the gap in adult education participation between adults who have a high school diploma or less, and those who have additional postsecondary education or technical training? (1991, 1995) 27 points 32 points ''
Adults with a high school diploma or less need additional training the most in order to upgrade their current levels of skills and qualify for better jobs, but they tend to be among those least likely to participate in adult education.
19. Participation in Higher Education: Has the U.S. reduced the gap between White and Black high school graduates who:• enroll in college? (1990, 1995) 14 points 13 points
ns&&$$
• complete a college degree? (1992, 1996) 16 points 19 pointsns&&$$
Has the U.S. reduced the gap between White and Hispanic high school graduates who:• enroll in college? (1990, 1995) 11 points 14 points
ns&&$$
• complete a college degree? (1992, 1996) 15 points 20 pointsns&&$$
Adults who complete college degrees can expect substantially higher lifetime earnings than those who do not attend college or those who complete coursework without eventually earning a degree.
Chapter 2 10/30/97 12:09 PM Page 32
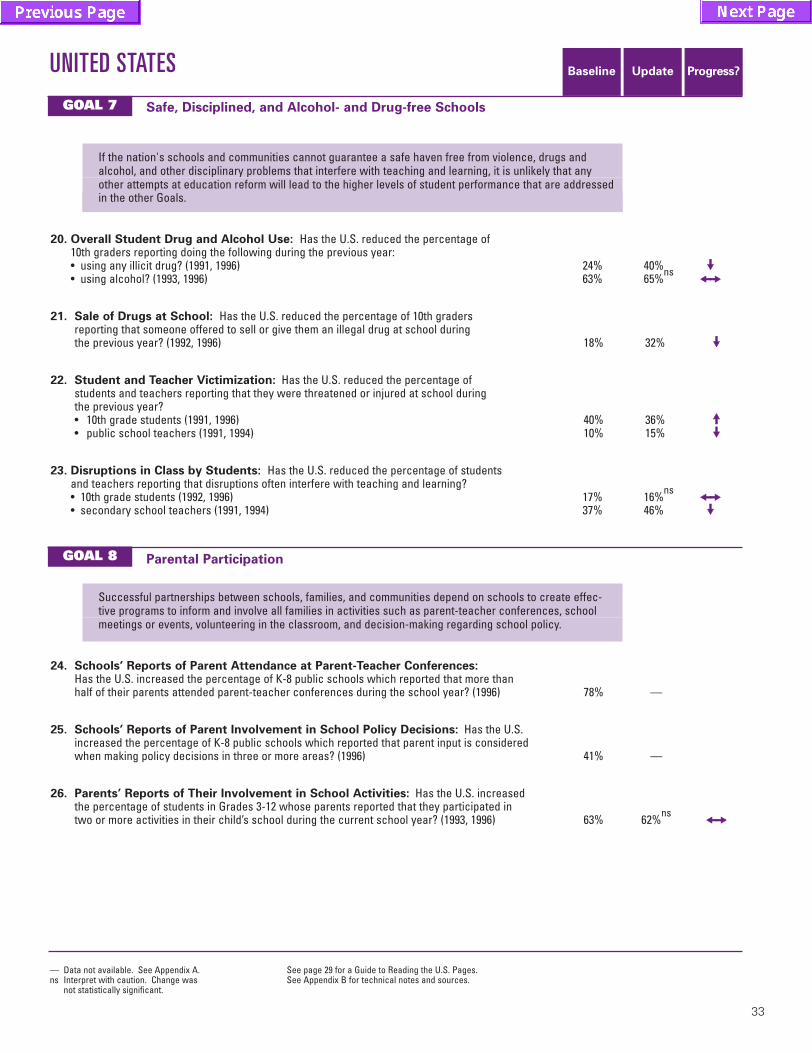
33
Update Progress?Baseline
— Data not available. See Appendix A.ns Interpret with caution. Change was
not statistically significant.
See page 29 for a Guide to Reading the U.S. Pages.See Appendix B for technical notes and sources.
UNITED STATESGOAL 7
GOAL 8
Safe, Disciplined, and Alcohol- and Drug-free Schools
If the nation's schools and communities cannot guarantee a safe haven free from violence, drugs and alcohol, and other disciplinary problems that interfere with teaching and learning, it is unlikely that anyother attempts at education reform will lead to the higher levels of student performance that are addressedin the other Goals.
20. Overall Student Drug and Alcohol Use: Has the U.S. reduced the percentage of 10th graders reporting doing the following during the previous year:• using any illicit drug? (1991, 1996) 24% 40% ''• using alcohol? (1993, 1996) 63% 65%
ns&&$$
21. Sale of Drugs at School: Has the U.S. reduced the percentage of 10th graders reporting that someone offered to sell or give them an illegal drug at school during the previous year? (1992, 1996) 18% 32% ''
22. Student and Teacher Victimization: Has the U.S. reduced the percentage of students and teachers reporting that they were threatened or injured at school during the previous year? • 10th grade students (1991, 1996) 40% 36% %%• public school teachers (1991, 1994) 10% 15% ''
23. Disruptions in Class by Students: Has the U.S. reduced the percentage of students and teachers reporting that disruptions often interfere with teaching and learning?• 10th grade students (1992, 1996) 17% 16%
ns&&$$
• secondary school teachers (1991, 1994) 37% 46% ''
Parental Participation
Successful partnerships between schools, families, and communities depend on schools to create effec-tive programs to inform and involve all families in activities such as parent-teacher conferences, schoolmeetings or events, volunteering in the classroom, and decision-making regarding school policy.
24. Schools’ Reports of Parent Attendance at Parent-Teacher Conferences:Has the U.S. increased the percentage of K-8 public schools which reported that more than half of their parents attended parent-teacher conferences during the school year? (1996) 78% —
25. Schools’ Reports of Parent Involvement in School Policy Decisions: Has the U.S. increased the percentage of K-8 public schools which reported that parent input is considered when making policy decisions in three or more areas? (1996) 41% —
26. Parents’ Reports of Their Involvement in School Activities: Has the U.S. increased the percentage of students in Grades 3-12 whose parents reported that they participated in two or more activities in their child’s school during the current school year? (1993, 1996) 63% 62%
ns&&$$
Chapter 2 10/30/97 12:09 PM Page 33

34
Interpreting the Exhibits
The amount of accelerated progress thatmust be made if we expect to reach our targets isexplicitly shown in 26 exhibits which follow. In order to interpret the graphs correctly, thereader should take note of the following:
1. Baseline measures of progress were estab-lished as close as possible to 1990, the yearthat the National Education Goals wereadopted.
2. For some of the national core indicators,baselines could not be established until aslate as 1996, either because data were notcollected prior to that time, or becausechanges in survey questions or methodologyyielded noncomparable data.
3. Most of the national indicators are notupdated annually. Footnotes on each graphindicate when data will be collected again.(See also Appendix A for the national datacollection schedule.)
4. Although this report includes the mostrecent data available, there is sometimes a lag of several years between the time thatdata are collected and the time that they areavailable for inclusion in the annual GoalsReport. For example, the most recent birthcertificate data available to construct theChildren’s Health Index for this 1997 GoalsReport were collected in 1995.
5. On each of the bar graphs, a path from thebaseline to the target is represented by a grey
shaded area behind the bars. The grey shad-ed areas indicate where we should try to pushour performance each year if we expect toreach the Goal by the end of the decade.Since progress is seldom perfectly linear, weshould expect some ups and downs from yearto year. What is most important is whetherperformance is moving in the right directionand whether it is within, or is at leastapproaching, the grey shaded area.
6. The graphs themselves should be interpretedwith caution. Data are based on representa-tive national surveys, and changes in perfor-mance could be attributable to samplingerror. The reader should consult the high-light box next to each graph to determinewhether the change is statistically significantand we are confident that real change hasoccurred. Further information on samplingcan be found in the technical notes inAppendix B.
7. Finally, the achievement levels, as presentedin Exhibits 6, 8, 9, 10, and 11, represent auseful way of categorizing overall perfor-mance on NAEP. They are also consistentwith the Panel’s efforts to report such perfor-mance against a high-criterion standard.However, both the National AssessmentGoverning Board and NCES regard theachievement levels as developmental; thereader of this report is advised to interpretthe achievement level results with caution.Further information can be found in thetechnical notes in Appendix B.
Chapter 2 10/30/97 12:09 PM Page 34

35
0%
20%
40%
60%
80%
100%
20001999199819971996199519941993199219911990
Year Data Collected*
37% 36% 35% 35% 34% 34%
0%
Source: National Center for Health Statistics and WestatThis exhibit updates information presented in the 1996 Goals Report.
Exhibit 1
Children’s Health IndexPercentage1 of infants born in the United States with 1 or more health risks2
1 Percentages are based on the number of births used to calculate the health index, not the actual number ofbirths. See technical notes in Appendix B.
2 Risks are late (in third trimester) or no prenatal care, low maternal weight gain (less than 21 pounds), mothersmoked during pregnancy, or mother drank alcohol during pregnancy.
* Data for the Children’s Health Index will be collected annually through the year 2000.
Table 1Disparities (in percentage points) between White and minority infants
born in the United States with 1 or more health risks
1990 1995 Change
American Indian/Alaskan Native 14 13 –1
Black 9 6 –3
The United States was alsosuccessful in reducing disparities between Whiteand minority infants born withone or more health risks. For example, in 1990, the gapbetween Black and Whiteinfants born with one ormore health risks was 9percentage points. In 1995,this disparity had decreasedto 6 percentage points.
This table updates information presented in the 1996 Goals Report.
Goal 1: Ready to Learn
The United States wassuccessful in reducing theproportion of infants born with one or more health risksbetween 1990 and 1995, from37% to 34%. This reductionrepresents a difference of atleast 61,900 children whowere born with a healthierstart in life.
%%
Chapter 2 10/30/97 12:09 PM Page 35

36
0%
20%
40%
60%
80%
100%
20001999199819971996199519941993199219911990
Year Data Collected*
78%
100%
75% 76%
Source: Centers for Disease Control and Prevention and Abt AssociatesThis exhibit updates information presented in the 1996 Goals Report.
Exhibit 2
ImmunizationsPercentage of 2-year-olds1 fully immunized against preventablechildhood diseases2
1 Children 19 to 35 months of age.2 Four doses of diphtheria-tetanus-pertussis vaccine, three doses of polio vaccine, and one dose of measles or
measles/mumps/rubella vaccine.
* Although data on immunizations were collected prior to 1994, the data collection method changed substantiallyfor the 1994 data collection. Therefore, 1994 is established as the baseline year for immunizations. These datawill be collected annually through the year 2000.
Seventy-five percent of all 2-year-olds were fullyimmunized against prevent-able childhood diseases in1994. By 1996, the propor-tion had increased to 78%.
%%
Goal 1: Ready to Learn
Chapter 2 10/30/97 12:09 PM Page 36

37
0%
20%
40%
60%
80%
100%
20001999199819971996199519941993199219911990
Year Data Collected*
66%
72% 72%
100%
Source: National Center for Education Statistics and WestatThis exhibit repeats information presented in the 1996 Goals Report.
Exhibit 3
Family-Child Reading and StorytellingPercentage of 3- to 5-year-olds1 whose parents2 read to themor tell them stories regularly3
1 Excluding those enrolled in kindergarten.2 Parent or another family member.3 Response of "read to every day" or "told a story three or more times a week."
* Although data on family-child reading and storytelling were collected in 1991, the wording of the reading itemchanged substantially between the 1991 survey and the 1993 survey. Therefore, 1993 is established as thebaseline year for family-child reading and storytelling. These data will be collected again in 1999.
Goal 1: Ready to Learn
Only two-thirds ofpreschoolers were read to or told stories regularly in1993. By 1996, the proportionhad increased to 72%.
%%
Chapter 2 10/30/97 12:09 PM Page 37

38
0
20
40
60
80
100
20001999199819971996199519941993199219911990
Year Data Collected*
28 28 27 29
0
ns
Source: National Center for Education Statistics and WestatThis exhibit repeats information presented in the 1996 Goals Report.
Exhibit 4
Preschool ParticipationDisparity (in percentage points) in preschool1 participation ratesbetween 3- to 5-year-olds2 from high-income3 families and 3- to5-year-olds from low-income4 families
1 Includes nursery schools, prekindergarten programs, preschools, day care centers, and Head Start.2 Excluding those enrolled in kindergarten.3 High income is defined as family income of $50,000 or more.4 Low income is defined as family income of $10,000 or less.ns Interpret with caution. Change from the baseline was not statistically significant.
* Data on preschool participation will be collected again in 1999.
Goal 1: Ready to Learn
In 1991, 45% of 3- to 5-year-olds from low-income familieswere enrolled in preschoolprograms, compared to 73%of those from high-incomefamilies. The 28-percentage-point difference in participa-tion rates had not improved by 1996.
&&$$
Chapter 2 10/30/97 12:09 PM Page 38

39
Year Data Collected*
0%
20%
40%
60%
80%
100%
20001999199819971996199519941993199219911990
85% 86% 86% 86%85%86%86%
90%
High school diploma Alternative credential
Source: Bureau of the Census, National Center for Education Statistics, and MPR Associates, Inc.This exhibit updates information presented in the 1996 Goals Report.
Exhibit 5
High School CompletionPercentage of 18- to 24-year-olds1 with a high school credential2
1 Does not include those still enrolled in high school.2 Includes traditional high school diploma and alternative credential.
* These data will be collected annually through the year 2000.
Table 2Disparities (in percentage points) between White and minority
18- to 24-year-olds who completed a high school diploma or an
alternative credential
1990 1996 Change
Black 6 9 +3 ns
Hispanic 31 30 -1 ns
ns Interpret with caution. Change from the baseline was not statistically significant.This table updates information presented in the 1996 Goals Report.
Disparities in high schoolcompletion rates betweenWhite and minority youngadults did not improvebetween 1990 and 1996. Forexample, in 1990, the gapbetween Hispanic and White18- to 24-year-olds who hada high school credential was31 points. Six years later thegap had not decreased.
Goal 2: School Completion
In 1990, 86% of 18- to 24-year-olds had completed a highschool credential. By 1996,the overall completion ratehad not increased. In 1996,the proportion of young adultswho completed an alternativecredential was twice as bigas it was in 1990.
&&$$
Chapter 2 10/30/97 12:09 PM Page 39

40
20001999199819971996199519941993199219911990
100%
80%
60%
40%
20%
0%
29% 30%ns
30%ns
Grade 4
Year Data Collected*
20001999199819971996199519941993199219911990
100%
80%
60%
40%
20%
0%
29%
Grade 8
Year Data Collected*
20001999199819971996199519941993199219911990
100%
80%
60%
40%
20%
0%
40%36%
Grade 12
Year Data Collected*
100%
100%
100%
Source: National Center for Education StatisticsThis exhibit repeats information presented in the 1996 Goals Report.
Exhibit 6
Reading AchievementPercentage of students who met the Goals Panel‘s performancestandard1 in reading
1 The Goals Panel’s performance standard is “mastery over challenging subject matter” as indicated byperformance at the Proficient or Advanced levels on the National Assessment of Educational Progress (NAEP).These levels were established by the National Assessment Governing Board (NAGB) and reported by theNational Center for Education Statistics (NCES) in NAEP publications. A more complete description of the performance standard can be found in Appendix B.
ns Interpret with caution. Change from the baseline was not statistically significant.
* Student achievement levels in reading were not established until 1992. Data on reading achievement will be collected again in 1998.
Goal 3: Student Achievement and Citizenship
In 1992, approximately threeout of ten 4th and 8th gradersand four out of ten 12thgraders met the Goals Panel’sperformance standard inreading. Reading achieve-ment remained unchangedamong 4th and 8th graders,and decreased significantlyamong 12th graders by 1994.
Grade 4 &&$$Grade 8 &&$$
Grade 12 ''
Chapter 2 10/30/97 12:09 PM Page 40
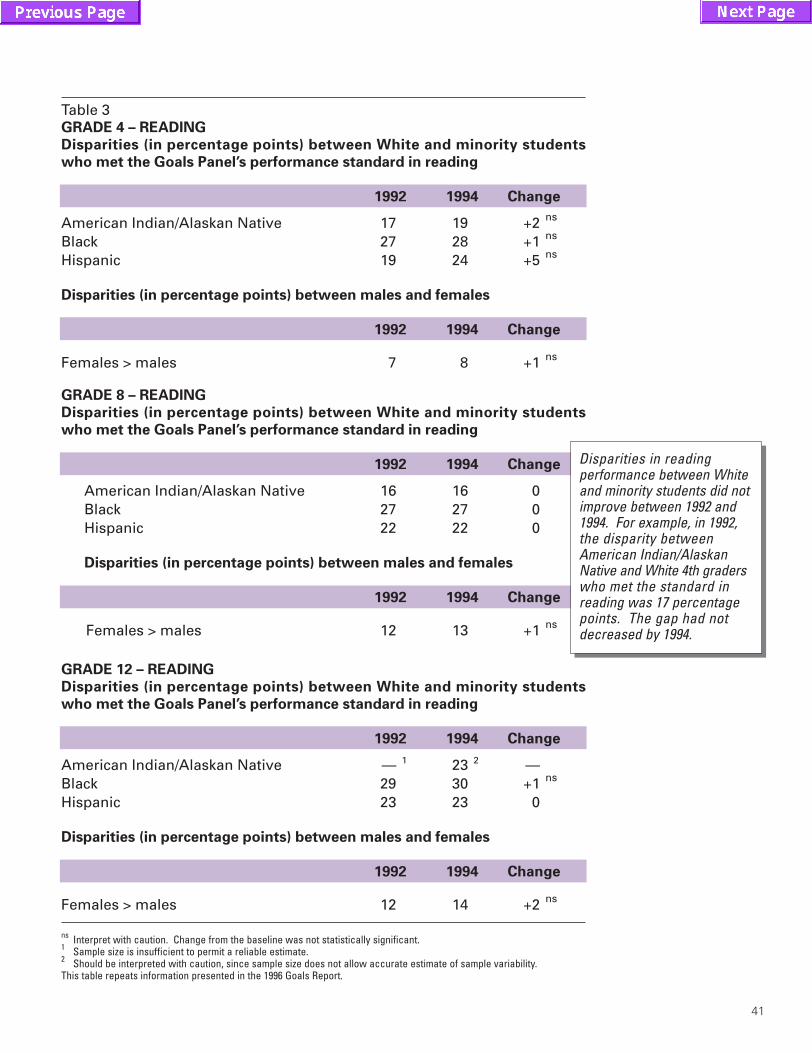
41
Table 3GRADE 4 – READING
Disparities (in percentage points) between White and minority students
who met the Goals Panel’s performance standard in reading
1992 1994 Change
American Indian/Alaskan Native 17 19 +2 ns
Black 27 28 +1 ns
Hispanic 19 24 +5 ns
Disparities (in percentage points) between males and females
1992 1994 Change
Females > males 7 8 +1 ns
GRADE 8 – READING
Disparities (in percentage points) between White and minority students
who met the Goals Panel’s performance standard in reading
1992 1994 Change
American Indian/Alaskan Native 16 16 0Black 27 27 0Hispanic 22 22 0
Disparities (in percentage points) between males and females
1992 1994 Change
Females > males 12 13 +1 ns
GRADE 12 – READING
Disparities (in percentage points) between White and minority students
who met the Goals Panel’s performance standard in reading
1992 1994 Change
American Indian/Alaskan Native — 1 23 2 —Black 29 30 +1 ns
Hispanic 23 23 0
Disparities (in percentage points) between males and females
1992 1994 Change
Females > males 12 14 +2 ns
ns Interpret with caution. Change from the baseline was not statistically significant.1 Sample size is insufficient to permit a reliable estimate.2 Should be interpreted with caution, since sample size does not allow accurate estimate of sample variability.This table repeats information presented in the 1996 Goals Report.
Disparities in readingperformance between Whiteand minority students did notimprove between 1992 and1994. For example, in 1992,the disparity betweenAmerican Indian/AlaskanNative and White 4th graderswho met the standard inreading was 17 percentagepoints. The gap had notdecreased by 1994.
Chapter 2 10/30/97 12:09 PM Page 41

42
20001999199819971996199519941993199219911990
100%
80%
60%
40%
20%
0%
55%
100%Grade 4
20001999199819971996199519941993199219911990
100%
80%
60%
40%
20%
0%
78%
100%Grade 8Year Data Collected*
Year Data Collected*
Source: National Center for Education StatisticsThis exhibit repeats information presented in the 1996 Goals Report.
Exhibit 7
Writing AchievementPercentage of students who can produce basic, extended,developed, or elaborated responses1 to narrative writing tasks
1 A more complete description of the six-level scale used to evaluate student writing can be found in Appendix B.
* Student achievement levels in writing have not been established. This information is from the NAEP WritingPortfolio Study, and there are no current plans to conduct another study again before the year 2000.
In 1992, over half of 4thgraders and over three-fourths of 8th graders could produce basic,extended, developed, orelaborated responses tonarrative writing tasks.
Goal 3: Student Achievement and Citizenship
Chapter 2 10/30/97 12:09 PM Page 42

43
20001999199819971996199519941993199219911990
100%
80%
60%
40%
20%
0%
18%13%
21%
Grade 4
Year Data Collected*
20001999199819971996199519941993199219911990
100%
80%
60%
40%
20%
0%
15%21% 24%
Grade 8
Year Data Collected*
20001999199819971996199519941993199219911990
100%
80%
60%
40%
20%
0%
12%15% 16%
Grade 12
Year Data Collected*
100%
100%
100%
Source: National Center for Education StatisticsThis exhibit updates information presented in the 1996 Goals Report.
Exhibit 8
Mathematics AchievementPercentage of students who met the Goals Panel‘s performancestandard1 in mathematics
1 The Goals Panel’s performance standard is “mastery over challenging subject matter” as indicated byperformance at the Proficient or Advanced levels on the National Assessment of Educational Progress (NAEP).These levels were established by the National Assessment Governing Board (NAGB) and reported by theNational Center for Education Statistics (NCES) in NAEP publications. A more complete description of theperformance standard can be found in Appendix B.
* Data on mathematics achievement will be collected again in 2000.
Goal 3: Student Achievement and Citizenship
In 1990, only one out ofevery seven students inGrade 8, and only one out of every eight studentsin Grades 4 and 12, had met the Goals Panel'sperformance standard in mathematics. By 1996,mathematics achievementhad increased significantlyin all three grades.
Grade 4 %%Grade 8 %%
Grade 12 %%
Chapter 2 10/30/97 12:09 PM Page 43

44
Table 4GRADE 4 – MATHEMATICS
Disparities (in percentage points) between White and minority students
who met the Goals Panel’s performance standard in mathematics
1990 1996 Change
American Indian/Alaskan Native 11 20 +9Black 15 23 +8Hispanic 11 20 +9
Disparities (in percentage points) between males and females
1990 1996 Change
Females < males 1 5 +4 ns
GRADE 8 – MATHEMATICS
Disparities (in percentage points) between White and minority students
who met the Goals Panel’s performance standard in mathematics
1990 1996 Change
American Indian/Alaskan Native 131 18 1 +5 ns
Black 14 27 +13 ns
Hispanic 14 22 +8 ns
Disparities (in percentage points) between males and females
1990 1996 Change
Females < males 3 2 -1 ns
GRADE 12 – MATHEMATICS
Disparities (in percentage points) between White and minority students
who met the Goals Panel’s performance standard in mathematics
1990 1996 Change
American Indian/Alaskan Native —2 171 —Black 12 16 +4 ns
Hispanic 10 14 +4 ns
Disparities (in percentage points) between males and females
1990 1996 Change
Females < males 6 4 -2 ns
ns Interpret with caution. Change from the baseline was not statistically significant.1 Statistical tests involving this value should be interpreted with caution. Standard error estimates may not be accurately
determined and/or the sampling distribution of the statistic does not match statistical test assumptions.2 Sample size is insufficient to permit a reliable estimate.This table updates information presented in the 1996 Goals Report.
Between 1990 and 1996, the gaps in mathematicsperformance widenedbetween Hispanic and Whitestudents and between Blackand White students in Grades4 and 8. For example, in1990, the gap between Blackand White 8th graders whomet the standard in mathe-matics was 14 percentagepoints. The gap had widenedto a 27-percentage-pointdifference by 1996.
Chapter 2 10/30/97 12:10 PM Page 44

45
100%
80%
60%
40%
20%
0%
21%
Grade 4
Year Data Collected*
20001999199819971996199519941993199219911990
100%
80%
60%
40%
20%
0%
29%
Grade 8
Year Data Collected*
100%
80%
60%
40%
20%
0%
16%
Grade 12
Year Data Collected*
100%
20001999199819971996199519941993199219911990
29%
100%
20001999199819971996199519941993199219911990
100%
80%
60%
40%
20%
0%
21%
100%100%
Source: National Assessment Governing Board
Exhibit 9
Science AchievementPercentage of students who met the Goals Panel‘s performancestandard1 in science
1 The Goals Panel’s performance standard is “mastery over challenging subject matter” as indicated byperformance at the Proficient or Advanced levels on the National Assessment of Educational Progress (NAEP).These levels were established by the National Assessment Governing Board (NAGB). A more completedescription of the performance standard can be found in Appendix B.
* Student achievement levels in science were not established until 1996. Data on science achievement will becollected again in 2000.
Goal 3: Student Achievement and Citizenship
In 1996, one out of every fivestudents in Grade 12, andnearly one out of every threestudents in Grades 4 and 8,met the Goals Panel's perfor-mance standard in science.
Chapter 2 10/30/97 12:10 PM Page 45

46
Table 5GRADE 4 – SCIENCE
Disparities (in percentage points) between White and minority students
who met the Goals Panel’s performance standard in science
1996
American Indian/Alaskan Native 11Black 30Hispanic 28
Disparities (in percentage points) between males and females
1996
Females < males 4
GRADE 8 – SCIENCE
Disparities (in percentage points) between White and minority students
who met the Goals Panel’s performance standard in science
1996
American Indian/Alaskan Native 13Black 32Hispanic 26
Disparities (in percentage points) between males and females
1996
Females < males 4
GRADE 12 – SCIENCE
Disparities (in percentage points) between White and minority students
who met the Goals Panel’s performance standard in science
1996
American Indian/Alaskan Native 17Black 23Hispanic 20
Disparities (in percentage points) between males and females
1996
Females < males 8
In 1996, the proportions ofWhite and minority studentswho met the Goals Panel'sperformance standard in science differed by 11 to 32 percentage points. For example, the differencebetween the percentages of White and Black 4th grade students who met the standard in science was 30 percentage points.
Chapter 2 10/30/97 12:10 PM Page 46

47
100%
80%
60%
40%
20%
0%
17%
Grade 4
14%
Grade 8
Year Data Collected*Grade 12
Year Data Collected*
100%
20001999199819971996199519941993199219911990
Year Data Collected* 100%
0%
11%
100%100%
100%
80%
60%
40%
20%
0%
20001999199819971996199519941993199219911990
100%
80%
60%
40%
20%
20001999199819971996199519941993199219911990
Source: National Center for Education StatisticsThis exhibit repeats information presented in the 1996 Goals Report.
Exhibit 10
History AchievementPercentage of students who met the Goals Panel’s performance standard1 in U.S. history
1 The Goals Panel’s performance standard is “mastery over challenging subject matter” as indicated byperformance at the Proficient or Advanced levels on the National Assessment of Educational Progress (NAEP).These levels were established by the National Assessment Governing Board (NAGB) and reported by theNational Center for Education Statistics (NCES) in NAEP publications. A more complete description of theperformance standard can be found in Appendix B.
* Student achievement levels in U.S. history were not established until 1994. There are no current plans tocollect these data again before the year 2000.
In 1994, approximately one in six 4th graders, one inseven 8th graders, and only one out of every ten12th graders, met the GoalsPanel’s performance standard in U.S. history.
Goal 3: Student Achievement and Citizenship
Chapter 2 10/30/97 12:10 PM Page 47

48
Table 6GRADE 4 – HISTORY
Disparities (in percentage points) between White and minority students
who met the Goals Panel’s performance standard in U.S. history
1994
American Indian/Alaskan Native 13Black 18Hispanic 16
Disparities (in percentage points) between males and females
1994
Females < males 2
GRADE 8 – HISTORY
Disparities (in percentage points) between White and minority students
who met the Goals Panel’s performance standard in U.S. history
1994
American Indian/Alaskan Native1 12Black 13Hispanic 12
Disparities (in percentage points) between males and females
1994
Females < males 2
GRADE 12 – HISTORY
Disparities (in percentage points) between White and minority students
who met the Goals Panel’s performance standard in U.S. history
1994
American Indian/Alaskan Native1 8Black 11Hispanic 9
Disparities (in percentage points) between males and females
1994
Females < males 3
In 1994, the proportions ofWhite and minority studentswho met the Goals Panel’sperformance standard in U.S. history differed by 8 to 18percentage points. Forexample, the differencebetween the percentages ofWhite and American Indian/Alaskan Native 4th graderswho met the standard inhistory was 13 percentagepoints. Achievement gapsbetween White and minoritystudents were smaller inhigher grades.
1 Should be interpreted with caution, since sample size does not allow accurate estimate of sample variability.This table repeats information presented in the 1996 Goals Report.
Chapter 2 10/30/97 12:10 PM Page 48

49
100%
80%
60%
40%
20%
0%
22%
Grade 4
Year Data Collected*
20001999199819971996199519941993199219911990
100%
80%
60%
40%
20%
0%
28%
Grade 8
Year Data Collected*
100%
80%
60%
40%
20%
0%
Grade 12
Year Data Collected*
100%
20001999199819971996199519941993199219911990
100%
200019991998199719961995199419931992199119900%
27%
100%100%
Source: National Center for Education StatisticsThis exhibit repeats information presented in the 1996 Goals Report.
Exhibit 11
Geography AchievementPercentage of students who met the Goals Panel’s performance standard1 in geography
1 The Goals Panel’s performance standard is “mastery over challenging subject matter” as indicated byperformance at the Proficient or Advanced levels on the National Assessment of Educational Progress (NAEP).These levels were established by the National Assessment Governing Board (NAGB) and reported by theNational Center for Education Statistics (NCES) in NAEP publications. A more complete description of theperformance standard can be found in Appendix B.
* Student achievement levels in geography were not established until 1994. There are no current plans to collect these data again before the year 2000.
In 1994, approximately one in four 4th, 8th, and 12thgraders met the GoalsPanel’s performance standard in geography.
Goal 3: Student Achievement and Citizenship
Chapter 2 10/30/97 12:10 PM Page 49
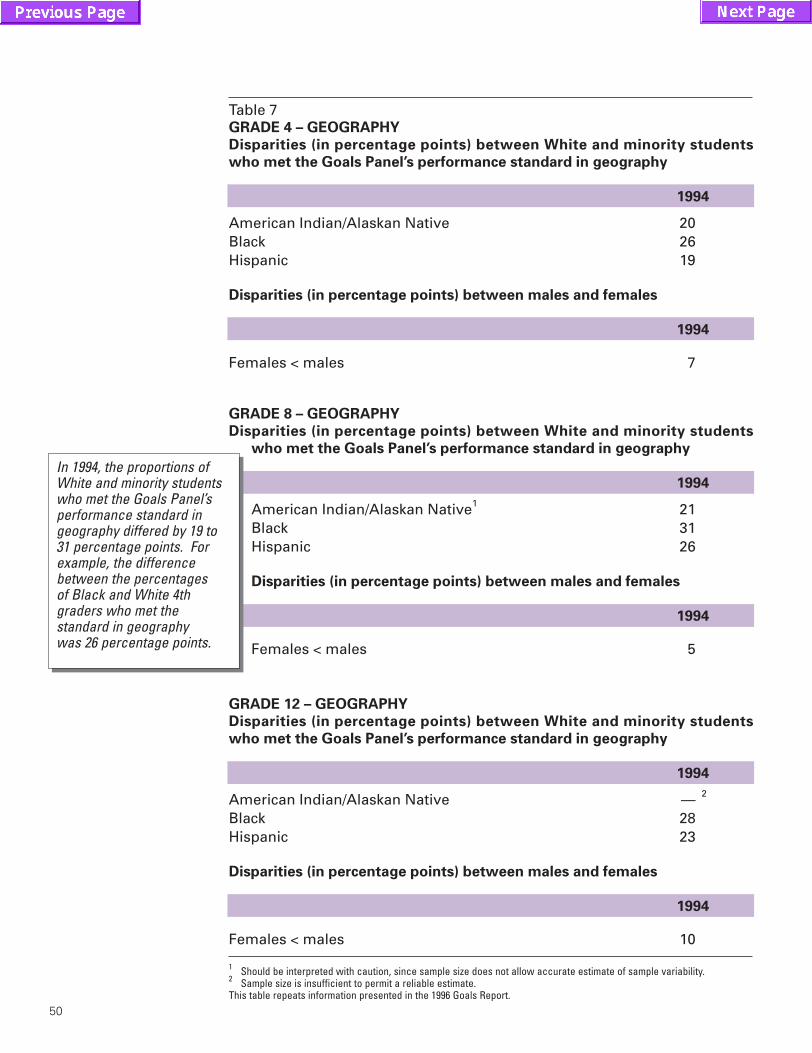
50
Table 7GRADE 4 – GEOGRAPHY
Disparities (in percentage points) between White and minority students
who met the Goals Panel’s performance standard in geography
1994
American Indian/Alaskan Native 20Black 26Hispanic 19
Disparities (in percentage points) between males and females
1994
Females < males 7
GRADE 8 – GEOGRAPHY
Disparities (in percentage points) between White and minority students
who met the Goals Panel’s performance standard in geography
1994
American Indian/Alaskan Native1 21Black 31Hispanic 26
Disparities (in percentage points) between males and females
1994
Females < males 5
GRADE 12 – GEOGRAPHY
Disparities (in percentage points) between White and minority students
who met the Goals Panel’s performance standard in geography
1994
American Indian/Alaskan Native — 2
Black 28Hispanic 23
Disparities (in percentage points) between males and females
1994
Females < males 10
In 1994, the proportions ofWhite and minority studentswho met the Goals Panel’sperformance standard ingeography differed by 19 to31 percentage points. Forexample, the differencebetween the percentages of Black and White 4thgraders who met the standard in geography was 26 percentage points.
1 Should be interpreted with caution, since sample size does not allow accurate estimate of sample variability.2 Sample size is insufficient to permit a reliable estimate.This table repeats information presented in the 1996 Goals Report.
Chapter 2 10/30/97 12:10 PM Page 50

51
0%
20%
40%
60%
80%
100%
20001999199819971996199519941993199219911990
Year Data Collected*
66%63%
100%
Source: National Center for Education Statistics and WestatThis exhibit repeats information presented in the 1996 Goals Report.
Exhibit 12
Teacher PreparationPercentage of secondary school teachers1 who hold anundergraduate or graduate degree2 in their main teachingassignment
1 Teachers include only those whose main teaching assignment was in mathematics, science, English, social studies, fine arts, foreign language, or special education.
2 Academic or education majors. Does not include minors or second majors.
* Data on teacher preparation will be collected again in 2000.
Goal 4: Teacher Education and Professional Development
In 1991, 66% of secondaryschool teachers held anundergraduate or graduatedegree in their main teachingassignment. By 1994, thispercentage had decreased to 63%.
''
Chapter 2 10/30/97 12:10 PM Page 51

52
0%
20%
40%
60%
80%
100%
20001999199819971996199519941993199219911990
Year Data Collected*
85%
100%
Source: National Center for Education Statistics and WestatThis exhibit repeats information presented in the 1996 Goals Report.
Exhibit 13
Teacher Professional DevelopmentPercentage of teachers who reported that they participated in in-service or professional development programs on 1 or moretopics1 since the end of the previous school year
1 Professional development topics included uses of educational technology, methods of teaching subject field, in-depth study in subject field, or student assessment.
* Data on teacher professional development will be collected again in 2000.
In 1994, 85% of teachersreported that they participated in in-service or professional developmentprograms on one or moretopics, such as uses of educational technology,methods of teaching subject field, in-depth study in subject field, or student assessment.
Goal 4: Teacher Education and Professional Development
Chapter 2 10/30/97 12:10 PM Page 52

53
Exhibit 14
International Mathematics AchievementAverage mathematics performance of U.S. 4th graders comparedwith students in other countries,1 1995*
Goal 5: Mathematics and Science
In a recent internationalmathematics assessment,U.S. 4th graders wereoutperformed by studentsin seven countries,performed the same asstudents in six countries,and performed signifi-cantly better thanstudents in 12 countries.U.S. 4th gradersperformed above theinternational average.
Source: National Center for Education StatisticsThis exhibit modifies information presented in the 1996 Goals Report.
Nations with Average Scores
Significantly Higher Than the U.S.
Nation Average
Singapore 625Korea 611Japan 597Hong Kong 587Netherlands 577Czech Republic 567Austria 559
Nations with Average Scores
Significantly Lower Than the U.S.
Nation Average
Latvia (LSS)2 525Scotland 520England 513Cyprus 502Norway 502New Zealand 499Greece 492Thailand 490Portugal 475Iceland 474Iran, Islamic Republic 429Kuwait 400
Nations with Average Scores Not
Significantly Different From the U.S.
Nation Average
Slovenia 552Ireland 550Hungary 548Australia 546United States 545
Canada 532Israel 531
International Average = 529
1 The Third International Mathematics and Science Study (TIMSS) required participating nations to adhere toextremely high technical standards. For a description of those nations that had difficulty meeting the standards, seeAppendix B.
2 Latvia is designated LSS because only Latvian-speaking schools were tested, which represents less than 65% ofthe population.
* There are no current plans to collect these data on 4th graders again before the year 2000.
Chapter 2 10/30/97 12:10 PM Page 53

54
Exhibit 14 continued
International Mathematics AchievementAverage mathematics performance of U.S. 8th graders comparedwith students in other countries,1 1995*
Goal 5: Mathematics and Science
Source: National Center for Education StatisticsThis exhibit modifies information presented in the 1996 Goals Report.
In 1995, U.S. 8th graderswere outperformed bystudents in 20 countries,performed the same asstudents in 13 countries,and performed signifi-cantly better thanstudents in sevencountries in mathematics.U.S. 8th gradersperformed below theinternational average.
Nations with Average Scores
Significantly Higher Than the U.S.
Nation Average
Singapore 643Korea 607Japan 605Hong Kong 588Belgium (Flemish)2 565Czech Republic 564Slovak Republic 547Switzerland 545Netherlands 541Slovenia 541Bulgaria 540Austria 539France 538Hungary 537Russian Federation 535Australia 530Ireland 527Canada 527Belgium (French)2 526Sweden3 519
Nations with Average Scores Not
Significantly Different From the U.S.
Nation Average
Thailand 522Israel 522Germany 509New Zealand 508England 506Norway 503Denmark 502United States 500
Scotland 498Latvia (LSS)4 493Spain 487Iceland 487Greece 484Romania 482
Nations with Average Scores
Significantly Lower Than the U.S.
Nation Average
Lithuania 477Cyprus 474Portugal 454Iran, Islamic Republic 428Kuwait 392Colombia 385South Africa 354
International Average = 513
1 The Third International Mathematics and Science Study (TIMSS) required participating nations to adhere toextremely high technical standards. For a description of those nations that had difficulty meeting the standards,see Appendix B.
2 The Flemish and French educational systems in Belgium participated separately.3 The country average for Sweden may appear to be out of place; however, statistically, its placement is correct.4 Latvia is designated LSS because only Latvian-speaking schools were tested, which represents less than 65% of
the population.
* There are plans to collect data on international mathematics achievement of 8th graders again in 1999.
Chapter 2 10/30/97 12:10 PM Page 54

55
Exhibit 15
International Science AchievementAverage science performance of U.S. 4th graders compared withstudents in other countries1, 1995*
Goal 5: Mathematics and Science
In an internationalscience assessmentadministered in 1995, U.S. 4th graders wereoutperformed by studentsin only one country, Korea. U.S. 4th gradersperformed the same asstudents in five countriesand performed signifi-cantly better than stu-dents from 19 countries.U.S. 4th gradersperformed above theinternational average.
Source: National Center for Education StatisticsThis exhibit modifies information presented in the 1996 Goals Report.
Nations with Average Scores
Significantly Higher Than the U.S.
Nation Average
Korea 597
Nations with Average Scores
Significantly Lower Than the U.S.
Nation Average
England 551Canada 549Singapore 547Slovenia 546Ireland 539Scotland 536Hong Kong 533Hungary 532New Zealand 531Norway 530Latvia (LSS)2 512Israel 505Iceland 505Greece 497Portugal 480Cyprus 475Thailand 473Iran, Islamic Republic 416Kuwait 401
Nations with Average Scores Not
Significantly Different From the U.S.
Nation Average
Japan 574United States 565
Austria 565Australia 562Netherlands 557Czech Republic 557
International Average = 524
1 The Third International Mathematics and Science Study (TIMSS) required participating nations to adhere toextremely high technical standards. For a description of those nations that had difficulty meeting the standards,see Appendix B.
2 Latvia is designated LSS because only Latvian-speaking schools were tested, which represents less than 65% ofthe population.
* There are no current plans to collect these data on 4th graders again before the year 2000.
Chapter 2 10/30/97 12:10 PM Page 55

56
Exhibit 15 continued
International Science AchievementAverage science performance of U.S. 8th graders compared withstudents in other countries,1 1995*
Goal 5: Mathematics and Science
U.S. 8th graders wereoutperformed by studentsin nine countries,performed the same asstudents in 16 countries,and performed signifi-cantly better thanstudents in 15 countriesin a 1995 internationalscience assessment. U.S. 8th gradersperformed above theinternational average.
Source: National Center for Education StatisticsThis exhibit modifies information presented in the 1996 Goals Report.
Nations with Average Scores
Significantly Higher Than the U.S.
Nation Average
Singapore 607Czech Republic 574Japan 571Korea 565Bulgaria 565Netherlands 560Slovenia 560Austria 558Hungary 554
Nations with Average Scores
Significantly Lower Than the U.S.
Nation Average
Spain3 517France 498Greece 497Iceland 494Romania 486Latvia (LSS)4 485Portugal 480Denmark 478Lithuania 476Belgium (French)2 471Iran, Islamic Republic 470Cyprus 463Kuwait 430Colombia 411South Africa 326
Nations with Average Scores Not
Significantly Different From the U.S.
Nation Average
England 552Belgium (Flemish)2 550Australia 545Slovak Republic 544Russian Federation 538Ireland 538Sweden 535United States 534
Germany 531Canada 531Norway 527New Zealand 525Thailand 525Israel 524Hong Kong 522Switzerland 522Scotland3 517
International Average = 516
1 The Third International Mathematics and ScienceStudy (TIMSS) required participating nations to adhereto extremely high technical standards. For a descrip-tion of those nations that had difficulty meeting thestandards, see Appendix B.
2 The Flemish and French educational systems inBelgium participated separately.
3 The country averages for Scotland and Spain mayappear to be out of place; however, statistically, theirplacement is correct.
4 Latvia is designated LSS because only Latvian-speak-ing schools were tested, which represents less than 65% of the population.
* There are plans to collect data on international mathematics achievement of 8th graders again in 1999.
Chapter 2 10/30/97 12:10 PM Page 56
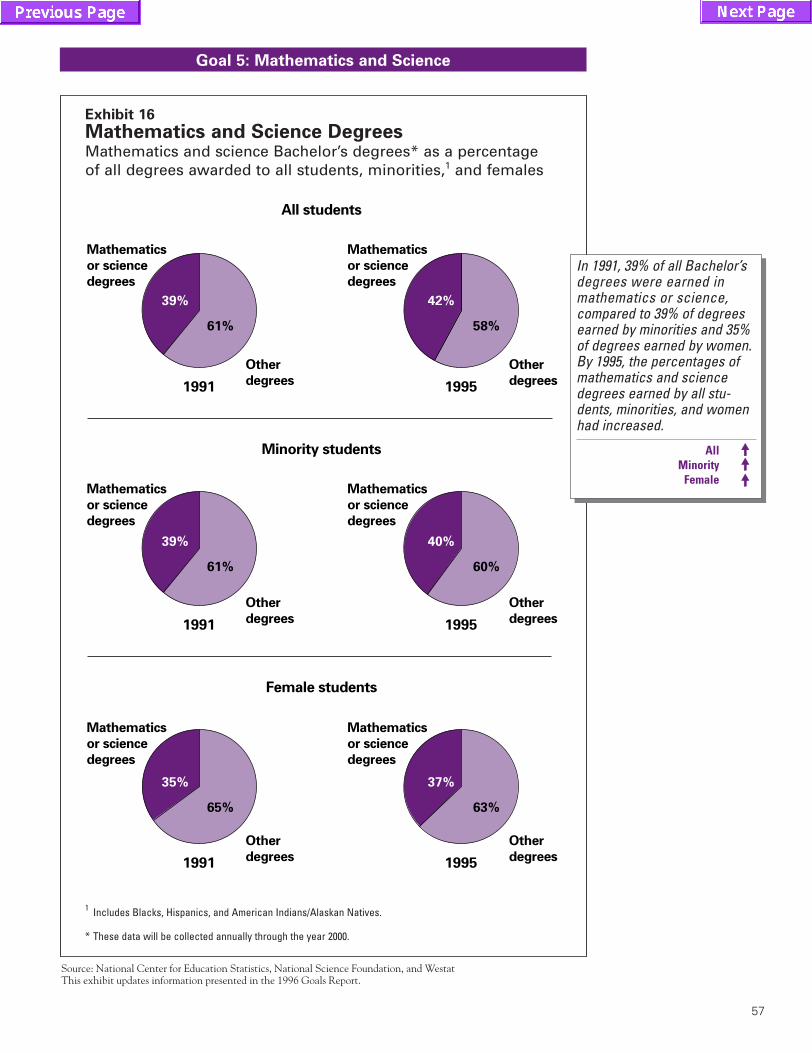
57
Mathematics
or science
degrees
Mathematics
or science
degrees
Mathematics
or science
degrees
Mathematics
or science
degrees
Mathematics
or science
degrees
Mathematics
or science
degrees
39%
61%
42%
58%
39%
61%
40%
60%
35%
65%
37%
63%
All students
Minority students
Female students
1991 1995
1991 1995
1991 1995
Other
degrees
Other
degrees
Other
degrees
Other
degrees
Other
degrees
Other
degrees
Source: National Center for Education Statistics, National Science Foundation, and WestatThis exhibit updates information presented in the 1996 Goals Report.
Exhibit 16
Mathematics and Science DegreesMathematics and science Bachelor’s degrees* as a percentage of all degrees awarded to all students, minorities,1 and females
1 Includes Blacks, Hispanics, and American Indians/Alaskan Natives.
* These data will be collected annually through the year 2000.
In 1991, 39% of all Bachelor’sdegrees were earned in mathematics or science,compared to 39% of degreesearned by minorities and 35%of degrees earned by women.By 1995, the percentages ofmathematics and sciencedegrees earned by all stu-dents, minorities, and womenhad increased.
All %%Minority %%
Female %%
Goal 5: Mathematics and Science
Chapter 2 10/30/97 12:10 PM Page 57

58
0%
20%
40%
60%
80%
100%
20001999199819971996199519941993199219911990
Year Data Collected*
52%
100%
Source: National Center for Education StatisticsThis exhibit repeats information presented in the 1996 Goals Report.
Exhibit 17
Adult LiteracyPercentage of adults aged 16 and older who scored at or aboveLevel 3
1in prose literacy
2on the National Adult Literacy Survey
1 Test results are reported on scales of 0 to 500 points. Scores are grouped into five levels, with Level 5 being most proficient and Level 1 being least proficient. Complete descriptions of each level can be found in Appendix B.
2 Prose literacy tasks require readers to understand and use information contained in texts such asnewspapers and pamphlets. Quantitative and document literacy tasks were also assessed.
* Data on adult literacy were not available prior to 1992. There are no current plans to collect these data again before the year 2000.
Nearly half of all Americanadults read and write at thetwo lowest of five levels of English proficiency; 52%scored at or above Level 3.Although adults who scorebelow Level 3 do have somelimited literacy skills, theyare not likely to be able to perform the range ofcomplex literacy tasks thatthe National Education GoalsPanel considers importantfor competing successfully in a global economy andexercising fully the rightsand responsibilities ofcitizenship.
Goal 6: Adult Literacy and Lifelong Learning
Chapter 2 10/30/97 12:10 PM Page 58

59
0
20
40
60
80
100
20001999199819971996199519941993199219911990
Year Data Collected*
27
32
0%
Source: National Center for Education Statistics and WestatThis exhibit repeats information presented in the 1996 Goals Report.
Exhibit 18
Participation in Adult EducationDisparity (in percentage points) between adults1 aged 17 andolder who have a high school diploma or less, and those whohave additional postsecondary education or technical training
1 Excluding those participating in full-time educational programs exclusively.
* Data on participation in adult education will be collected again in 1999.
Goal 6: Adult Literacy and Lifelong Learning
In 1991, the gap in adulteducation participation ratesbetween adults who had ahigh school diploma or lessand those with additionalpostsecondary education or technical training was 27percentage points. In 1995,the gap had increased to 32percentage points.
''
Chapter 2 10/30/97 12:10 PM Page 59
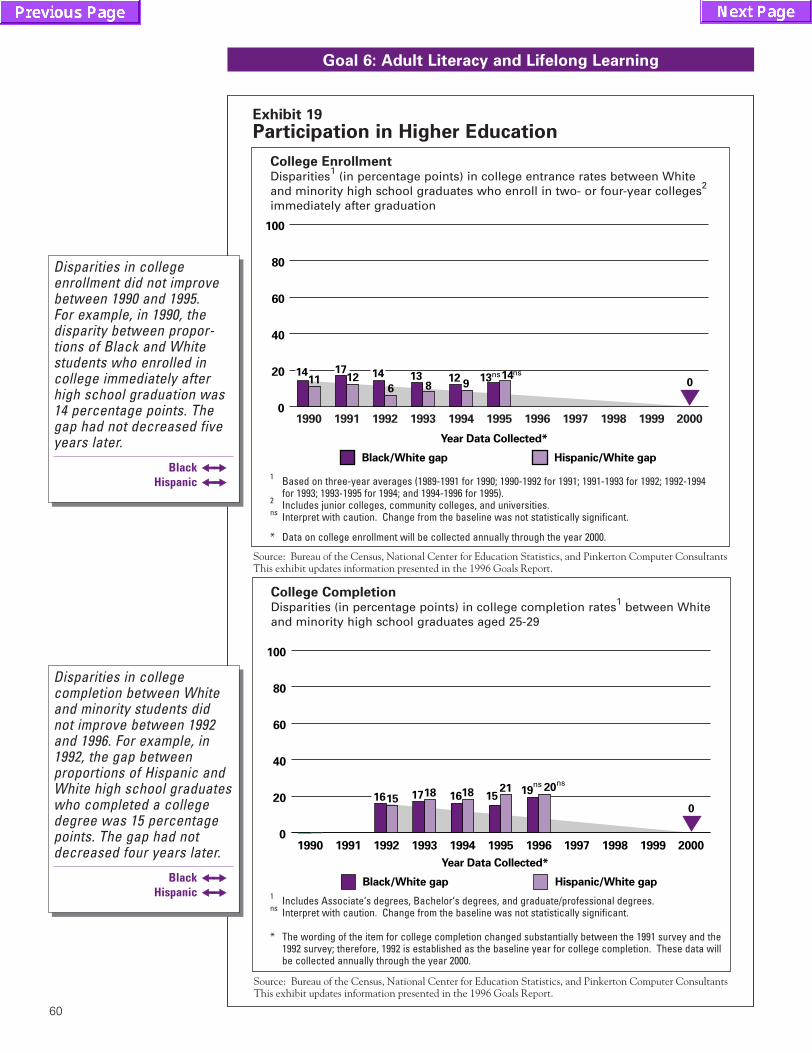
60
Exhibit 19
Participation in Higher Education
Source: Bureau of the Census, National Center for Education Statistics, and Pinkerton Computer ConsultantsThis exhibit updates information presented in the 1996 Goals Report.
0
20
40
60
80
100
20001999199819971996199519941993199219911990
011 126
138 9
13 1412 ns ns
Year Data Collected*
Black/White gap Hispanic/White gap
14 17 14
College EnrollmentDisparities1 (in percentage points) in college entrance rates between Whiteand minority high school graduates who enroll in two- or four-year colleges2
immediately after graduation
1 Based on three-year averages (1989-1991 for 1990; 1990-1992 for 1991; 1991-1993 for 1992; 1992-1994for 1993; 1993-1995 for 1994; and 1994-1996 for 1995).
2 Includes junior colleges, community colleges, and universities.ns Interpret with caution. Change from the baseline was not statistically significant.
* Data on college enrollment will be collected annually through the year 2000.
Source: Bureau of the Census, National Center for Education Statistics, and Pinkerton Computer ConsultantsThis exhibit updates information presented in the 1996 Goals Report.
0
20
40
60
80
100
20001999199819971996199519941993199219911990
01615 1718 18 19 20
16 1521
ns
Year Data Collected*
Black/White gap Hispanic/White gap
ns
College CompletionDisparities (in percentage points) in college completion rates1 between Whiteand minority high school graduates aged 25-29
1 Includes Associate‘s degrees, Bachelor‘s degrees, and graduate/professional degrees.ns Interpret with caution. Change from the baseline was not statistically significant.
* The wording of the item for college completion changed substantially between the 1991 survey and the1992 survey; therefore, 1992 is established as the baseline year for college completion. These data willbe collected annually through the year 2000.
Disparities in college completion between Whiteand minority students didnot improve between 1992and 1996. For example, in1992, the gap between proportions of Hispanic andWhite high school graduateswho completed a collegedegree was 15 percentagepoints. The gap had notdecreased four years later.
Black &&$$Hispanic &&$$
Goal 6: Adult Literacy and Lifelong Learning
Disparities in college enrollment did not improvebetween 1990 and 1995. For example, in 1990, the disparity between propor-tions of Black and Whitestudents who enrolled incollege immediately afterhigh school graduation was14 percentage points. Thegap had not decreased fiveyears later.
Black &&$$Hispanic &&$$
Chapter 2 10/30/97 12:10 PM Page 60

61
Exhibit 20
Overall Student Drug and Alcohol Use
Source: University of MichiganThis exhibit updates information presented in the 1996 Goals Report.
0%
20%
40%
60%
80%
100%
20001999199819971996199519941993199219911990
Year Data Collected*
0%
24% 24%27%
33%36%
40%
DrugsPercentage of 10th graders who reported using any illicit drug1 during the previous year
1 See Appendix B for complete description.
* Data on overall drug use by 10th graders will be collected annually through the year 2000.
Source: University of MichiganThis exhibit updates information presented in the 1996 Goals Report.
0%
20%
40%
60%
80%
100%
20001999199819971996199519941993199219911990
Year Data Collected*
0%
63% 64% 64% 65%ns
AlcoholPercentage of 10th graders who reported using alcohol during theprevious year
ns Interpret with caution. Change from the baseline was not statistically significant.
* Although data on student alcohol use were collected in 1991 and 1992, the wording of the itemchanged substantially between the 1992 survey and the 1993 survey. Therefore, 1993 is established as the baseline year. Data on overall alcohol use by 10th graders will be collected annually throughthe year 2000.
Goal 7: Safe, Disciplined, and Alcohol- and Drug-free Schools
Between 1991 and 1996, thepercentage of 10th graderswho reported that they hadused an illicit drug during the previous year increasedfrom 24% to 40%.
''
Between 1993 and 1996, there was no change in thepercentage of 10th graderswho reported that they hadused alcohol during the previous year.
&&$$
Chapter 2 10/30/97 12:10 PM Page 61
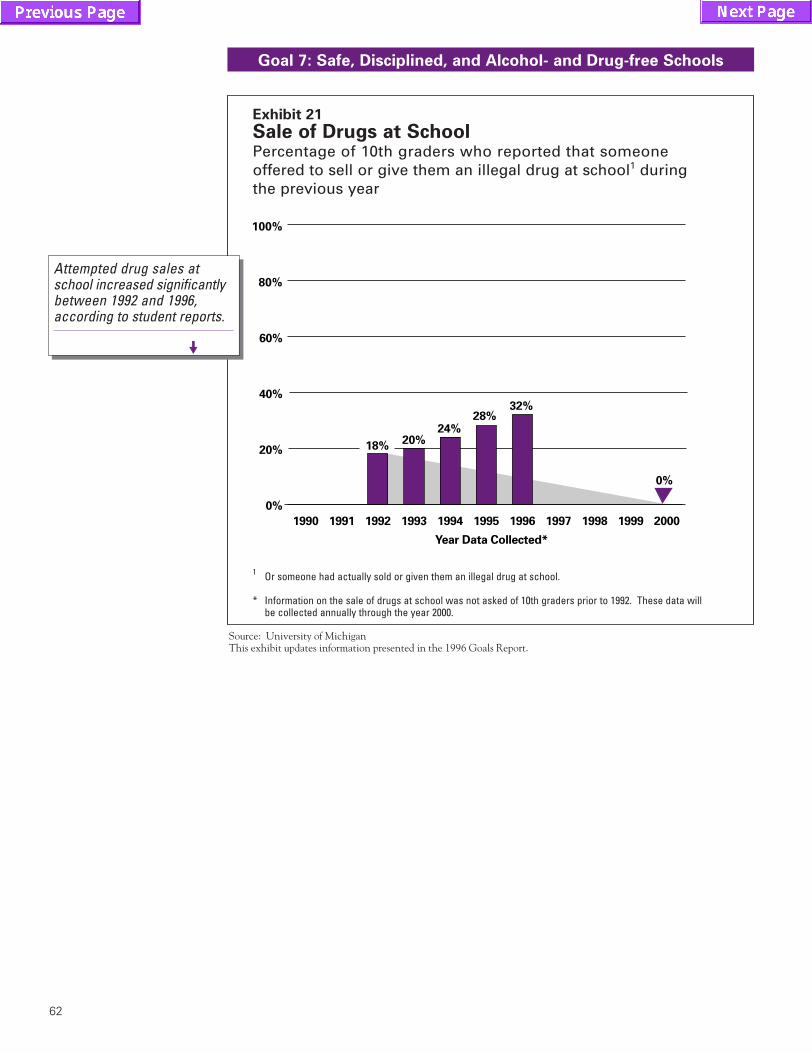
62
0%
20%
40%
60%
80%
100%
20001999199819971996199519941993199219911990
Year Data Collected*
18%20%
24%28%
32%
0%
Source: University of MichiganThis exhibit updates information presented in the 1996 Goals Report.
Exhibit 21
Sale of Drugs at SchoolPercentage of 10th graders who reported that someone offered to sell or give them an illegal drug at school1 during the previous year
1 Or someone had actually sold or given them an illegal drug at school.
* Information on the sale of drugs at school was not asked of 10th graders prior to 1992. These data will be collected annually through the year 2000.
Goal 7: Safe, Disciplined, and Alcohol- and Drug-free Schools
Attempted drug sales atschool increased significantlybetween 1992 and 1996,according to student reports.
''
Chapter 2 10/30/97 12:10 PM Page 62

63
Exhibit 22
Student and Teacher Victimization
Source: University of MichiganThis exhibit updates information presented in the 1996 Goals Report.
0%
20%
40%
60%
80%
100%
20001999199819971996199519941993199219911990
40%37% 35% 36% 35% 36%
0%
Year Data Collected*
StudentsPercentage of 10th graders who reported that they were threatened orinjured1 at school during the previous year
Source: National Center for Education Statistics and WestatThis exhibit repeats information presented in the 1996 Goals Report.
0%
20%
40%
60%
80%
100%
20001999199819971996199519941993199219911990
10%
15%
0%
Year Data Collected*
TeachersPercentage of public school teachers who reported that they were threatenedwith physical injury or physically attacked by a student from their school during the previous 12 months
1 With or without a weapon.
* Data on student victimization will be collected annually through the year 2000.
* Data on teacher victimization will be collected again in 2000.
Goal 7: Safe, Disciplined, and Alcohol- and Drug-free Schools
In 1991, 40% of 10th gradersreported that they had beenthreatened or injured atschool during the previousyear. By 1996, the percentagehad decreased to 36%.
%%
One out of every ten publicschool teachers reported in1991 that he or she had beenthreatened or physicallyattacked by a student from his or her school during theprevious year. By 1994, thatproportion had increased toabout one out of every seven.
''
Chapter 2 10/30/97 12:10 PM Page 63

64
Exhibit 23
Disruptions in Class by Students
0%
20%
40%
60%
80%
100%
20001999199819971996199519941993199219911990
17% 18% 17% 17% 16%
0%
Year Data Collected*
ns
1 Often = 6 times a week or more.ns Interpret with caution. Change from the baseline was not statistically significant.
* Information on disruptions in class was not asked of 10th graders prior to 1992. These data will be collected annually through the year 2000.
Source: University of MichiganThis exhibit updates information presented in the 1996 Goals Report.
Student ReportsPercentage of 10th graders who reported that during an average week, misbehavior by other students often1 interferes with their own learning
Source: National Center for Education Statistics and WestatThis exhibit repeats information presented in the 1996 Goals Report.
0%
20%
40%
60%
80%
100%
20001999199819971996199519941993199219911990
37%
46%
0%
Year Data Collected*
Teacher ReportsPercentage of all secondary school teachers who reported1 that student misbehavior interferes with their teaching
1 Responses of “agree” and “strongly agree” combined.
* Teacher reports on disruptions in class will be collected again in 2000.
Goal 7: Safe, Disciplined, and Alcohol- and Drug-free Schools
In 1991, 37% of all secondaryschool teachers felt that stu-dent misbehavior interferedwith their teaching. This percentage had risen to 46%by 1994.
''
In 1992, 17% of 10th gradersreported that other studentsinterfered with their ownlearning at least six times aweek. No reduction in classdisruptions was seen over the next four years.
&&$$
Chapter 2 10/30/97 12:10 PM Page 64

65
0%
20%
40%
60%
80%
100%
20001999199819971996199519941993199219911990
Year Data Collected*
78%
100%
Source: National Center for Education Statistics and WestatThis exhibit repeats information presented in the 1996 Goals Report.
Exhibit 24
Schools’ Reports of Parent Attendance at Parent-Teacher ConferencesPercentage of K-8 public schools1 which reported that more than half2 of their parents3 attended parent-teacher conferencesduring the school year
1 Survey respondents were principals or their designees.2 Responses of “more than half” and “most or all” combined.3 Includes only those public schools in which the school reported that it held regularly scheduled
schoolwide parent-teacher conferences during the year. (95% of elementary schools and 78% of middle schools reported doing so during 1995-1996.)
* Data on schools’ reports of parent attendance at parent-teacher conferences were not available prior to 1996. There are no current plans to collect these data again before the year 2000.
In 1996, 78% of publicelementary and middleschools reported that morethan half of their parentsattended regularly scheduledparent-teacher conferencesduring the school year.
Parents of students inelementary schools were more likely to attendparent-teacher conferencesthan parents of middleschool students, accordingto schools’ reports.
1996
Elementary . . . . . . . . . . . . . . 84%Middle . . . . . . . . . . . . . . . . . . . 47%
Goal 8: Parental Participation
Chapter 2 10/30/97 12:10 PM Page 65

66
0%
20%
40%
60%
80%
100%
20001999199819971996199519941993199219911990
Year Data Collected*
41%
100%
Source: National Center for Education Statistics and WestatThis exhibit repeats information presented in the 1996 Goals Report.
Exhibit 25
Schools’ Reports of Parent Involvement in School Policy DecisionsPercentage of K-8 public schools1 which reported that parent input is considered2 when making policy decisions in three or more areas3
1 Survey respondents were principals or their designees.2 Responses of “moderate extent” and “great extent” combined.3 Three or more of the following policy areas: allocation of funds; curriculum or overall instructional program;
the design of special programs; library books and materials; discipline policies and procedures; health-relatedtopics or policies; monitoring or evaluating teachers; or developing parent involvement activities.
* Data on schools’ reports of parent involvement in school policy decisions were not available prior to 1996.There are no current plans to collect these data again before the year 2000.
In 1996, 41% of publicelementary and middleschools reported that parentinput is considered whenmaking policy decisions inthree or more areas.
Goal 8: Parental Participation
Chapter 2 10/30/97 12:10 PM Page 66
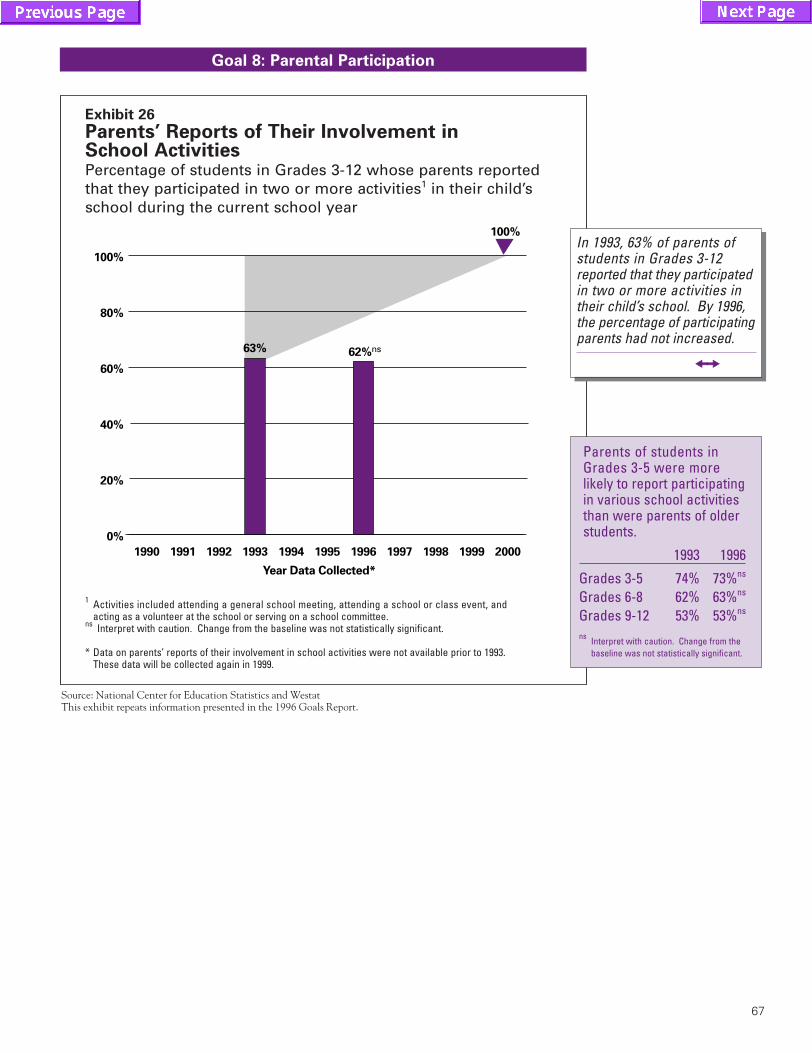
67
0%
20%
40%
60%
80%
100%
20001999199819971996199519941993199219911990
Year Data Collected*
63% 62%ns
100%
Source: National Center for Education Statistics and WestatThis exhibit repeats information presented in the 1996 Goals Report.
Exhibit 26
Parents’ Reports of Their Involvement in School ActivitiesPercentage of students in Grades 3-12 whose parents reportedthat they participated in two or more activities1 in their child’sschool during the current school year
1 Activities included attending a general school meeting, attending a school or class event, and acting as a volunteer at the school or serving on a school committee.
ns Interpret with caution. Change from the baseline was not statistically significant.
* Data on parents’ reports of their involvement in school activities were not available prior to 1993. These data will be collected again in 1999.
Goal 8: Parental Participation
In 1993, 63% of parents ofstudents in Grades 3-12reported that they participatedin two or more activities intheir child’s school. By 1996,the percentage of participatingparents had not increased.
&&$$
Parents of students inGrades 3-5 were more likely to report participatingin various school activitiesthan were parents of olderstudents.
1993 1996
Grades 3-5 74% 73%ns
Grades 6-8 62% 63%ns
Grades 9-12 53% 53%ns
ns Interpret with caution. Change from thebaseline was not statistically significant.
Chapter 2 10/30/97 12:10 PM Page 67

68
Chapter 2 10/30/97 12:10 PM Page 68

69
In order to provide more state-level informa-tion for the reader, Chapter 3 reports individ-
ual state progress on a slightly larger set of indi-cators than reported at the national level. Manyof the 33 state-level indicators are identical tothose at the national level. Each indicatorincludes a baseline measure (collected as closeas possible to 1990, the year the Goals wereadopted), the most recent update (if available),and an arrow indicating the direction ofchange. Again, arrows which point upwardindicate that we have made progress. Arrowswhich point downward indicate that we havefallen further behind. Horizontal arrows indi-cate that performance has not changed or thatthe change was not statistically significant.
The reader should note several important dif-ferences between the national and state data.Each indicator presented on the state pages isaccompanied by the range of state scores andthe median state score to show how the stateperformed in relation to others. In addition, theU.S. data are shown if the data are comparableat the national and state levels. A guide to read-ing the state pages begins on page 72.
In some cases, limited information is avail-able at the state level, which constrains thePanel’s ability to provide full progress reports forthose states. Data gaps exist because states maychoose not to participate in some data collec-tions for reasons such as cost or the amount oftime required for testing. For example, only 13states participated in the State Adult Literacy
Survey, which is the data source the Panel usesto monitor adult literacy proficiency at the statelevel. (State-level data collection schedules canbe found in Appendix A.)
Although states do collect Goal-relatedinformation individually (for example, studentachievement using their own state assessment),the data are not comparable across the states. Itis especially important that the Goals Panelreport comparable data in the annual GoalsReport, because non-comparable state data pro-vide no guarantee that changes over time arenot due to changes in sampling or the wordingof items. The Panel is committed to using acommon, reliable yardstick which will ensurethat differences over time are due to realchanges in performance.
Since baselines were established for thestate* indicators, significant** improvementshave occurred in the following areas:
• Forty states reduced the percentage of infantsborn with one or more health risks (Goal 1indicator).
• Fifty-four jurisdictions increased the numberof mothers receiving prenatal care in the firsttrimester of pregnancy (Goal 1 indicator).
• The proportion of children with disabilitiesparticipating in preschool rose in 46 states(Goal 1 indicator).
• Twenty-seven jurisdictions increased the percentage of 8th graders scoring at the
Chapter 3:
How Are We Doing at the State Level?
* In this chapter, the term “state” is used to refer to the 50 states and the District of Columbia. The term “jurisdiction” is used to referto the 50 states, the District of Columbia, and the territories.
** In this report, “significance” refers to statistical significance and indicates that the observed differences are not likely to have occurredby chance.
Chapter 3 10/30/97 12:13 PM Page 69

70
Proficient or Advanced levels on the NAEPmathematics assessment. In no jurisdiction didthe percentage decrease (Goal 3 indicator).
• In all states but one, the proportion ofAdvanced Placement examinations receiv-ing a grade of 3 or higher increased (Goal 3indicator).
• Forty-seven jurisdictions increased the per-centage of all students who received a degreein mathematics or science. In addition, 33 jur-isdictions increased the percentage of minor-ity students and 43 jurisdictions increasedthe percentage of female students whoreceived a degree in mathematics or science(Goal 5 indicator).
• In nine out of 12 states, the percentage ofstudents enrolling in postsecondary educa-tion increased (Goal 6 indicator).
• In 32 states, the percentage of U.S. citizenswho voted increased (Goal 6 indicator).
In other areas, the news is not as encouraging:
• In 47 jurisdictions, the number of childrenborn with low birthweight increased (Goal 1indicator).
• In nine of 18 states, the high school dropoutrate increased (Goal 2 indicator).
• In 13 of 19 jurisdictions, the percentage of pub-lic high school students who reported usingmarijuana increased. In no jurisdiction did thepercentage decrease (Goal 7 indicator).
• In nine of 13 jurisdictions, more studentsreported being offered, sold, or given an ille-gal drug at school. No jurisdiction showed adecrease in the percentage of students whoreported that drugs were available on schoolproperty (Goal 7 indicator).
• In 37 states, more teachers reported that stu-dent disruptions in their classrooms inter-fered with their teaching (Goal 7 indicator).
Performance has not changed markedly overtime in the following areas:
• Immunizations. Forty-five states showed nochange in the proportion of 2-year-oldsimmunized (Goal 1 indicator).
• High School Completion. Thirty-eight statesexperienced no change in the percentage of18- to 24-year-olds who held a high schooldiploma (Goal 2 indicator).
• 4th Grade Reading. In 37 jurisdictions, the percentage of 4th graders scoring at the Proficient or Advanced levels on the NAEP reading assessment did not change (Goal 3 indicator).
• 4th Grade Mathematics. In 32 jurisdictions,the percentage of 4th graders scoring at the Proficient or Advanced levels on theNAEP mathematics assessment did notchange (Goal 3 indicator).
• Teacher Preparation and Professional Devel-opment. In more than 40 states, there was no change in the percentage of teachers who reported that they held a degree or helda teaching certificate in their main teachingassignment. In 33 states, no change wasreported in the proportion of beginning public school teachers who participated in a formal teacher induction process (Goal 4indicators).
• Registering to Vote. In 32 states, there wasno change in the percentage of U.S. citizensregistered to vote (Goal 6 indicator).
• Alcohol Consumption. Only one jurisdictionout of 20 had a decrease in the percentage of public school 10th graders who reportedhaving 5 or more drinks in a row (Goal 7 indicator).
• Student Victimization. Of the 13 jurisdic-tions that reported data, none reduced thepercentage of students who reported beingthreatened or injured with a weapon onschool property (Goal 7 indicator).
• School Safety. Of the 14 jurisdictions report-ing data, none reduced the percentage of stu-dents who reported that they did not feel safeat school (Goal 7 indicator).
• Fights and Carrying Weapons at School. No progress was made in any state in decreas-ing the percentage of students who reportedparticipating in a physical fight on schoolproperty. In addition, in only two jurisdic-tions was there a decrease in the percentageof students who reported carrying weaponson school property (Goal 7 indicators).
• Parental Involvement. In more than 40states, no change was reported in the level ofparent involvement from either the teacher’sor principal’s perspective. Similarly, publicschool principals in 34 states reported thatthere was no increase in the influence the
Chapter 3 10/30/97 12:13 PM Page 70

71
parent association in their school had onschool policy (Goal 8 indicators).
In a number of areas, data gaps prevent usfrom knowing whether performance hasimproved or declined in individual states. Forexample:
• We do not know if the achievement of our8th graders has improved in science.
• We cannot tell if more teachers are partici-pating in professional development programson topics such as the use of educational technology.
• We do not know if more teachers are receiv-ing training to teach limited English profi-cient students.
• We cannot tell if more mathematics teachersare implementing education reforms in theirclassrooms that have been recommended by
experts, such as working in small groups,developing reasoning and analytical ability,or teaching algebra. We also cannot tell ifmore students have computers available intheir classrooms.
• We do not yet know how our states compareto countries that participated in the ThirdInternational Mathematics and ScienceStudy.
• We cannot report whether more adults areable to perform complex literacy tasks thatwill enable them to compete successfully in aglobal economy.
• We cannot tell if more teachers are beingthreatened by students from their schools.
The Goals Panel will continue to work withstates and other data providers to fill these gapsin future Goals Reports.
Chapter 3 10/30/97 12:13 PM Page 71

72
1. Reduced percentage of infants born with 1 or more health risks? (1990, 1995) 39% 36% %% 37% 34% %% 25-48% 24-42% 38% 35%
6. Increased high school completion rate? (1990, 1995) 82% 87% &&$$ 86% 86% &&$$ 77-96% 79-96% 87% 88%
7. Reduced high school dropout rate? (1994) 6% — * * 3-10% — 5% —
1 Data in this column represent our starting points. Baselines were estab-lished as close as possible to 1990, the year that the National EducationGoals were adopted.
2 Data in this column represent our current level of performance and are the most recent data available.
3 Progress represents progress from the baseline year to the most recent update year.
4 Progress is shown by an arrow. Arrows which point upward indicate that we have made progress. Arrows which point downward indicatethat we have fallen further behind. Horizontal arrows indicate thatperformance has not changed or that the change was not statistically significant.
5 The source of the data and any technical notes for each state indicator are referenced by this number in Appendix C.
6 A fuller description of the state indicators is provided on pages 73-75.
7 The date(s) in parentheses indicates the year(s) in which data were collected for the state indicator. If there are two dates, the first indicates the baseline year and the second indicates the most recent year in which data were collected.
8 — means data not available. See Appendix A.
Guide to Reading the State Pages
47 86
12 3
Alabama
baseline update progress?
Range of State Scores
baseline update
MedianScores†
baseline update
U.S.
baseline update progress?5
Chapter 3 10/30/97 12:13 PM Page 72

73
Indicators for the state pages are based on comparable state data col-lected by federal agencies such as the National Center for EducationStatistics, the National Center for Health Statistics, and the Centers for Disease Control and Prevention. The state pages do not include all Goal-related data that a state may collect. See page 69 for further information.
The state indicators are:
Goal 1: Ready to Learn
1. Children’s Health Index: Has the state reduced the percentage of infants born with 1 or more health risks? (1990, 1995)
2. Immunizations: Has the state increased the percentage of 2-year-olds who have been fully immunized against pre-ventable childhood diseases? (1994, 1996)
3. Low Birthweight: Has the state reduced the number ofinfants per 1,000 born with low birthweight, defined as lessthan 5.5 pounds? (1990, 1995)
4. Early Prenatal Care: Has the state increased the number of mothers per 1,000 who receive prenatal care in the firsttrimester of pregnancy? (1990, 1995)
5. Preschool Programs for Children with Disabilities:Has the state increased the number of children with disabilities par-ticipating in preschool, per 1,000 3- to 5-year-olds? (1991, 1996)
Goal 2: School Completion
6. High School Completion Rates: Has the state increasedthe percentage of 18- to 24-year-olds who have a high school credential? (1990, 1995)
7. High School Dropout Rates: Has the state reduced thepercentage of students in Grades 9-12 who leave school with-out completing a recognized secondary program? (1992, 1994)
Goal 3: Student Achievement and Citizenship
8. Reading Achievement: Has the state increased the per-centage of public school students who meet the Goals Panel’sperformance standard in reading in Grade 4? (1992, 1994)
9. Mathematics Achievement: Has the state increased the percentage of public school students who meet the Goals Panel’s performance standard in mathematics in Grade 4 (1992, 1996) and Grade 8 (1990, 1996)?
10. Science Achievement: Has the state increased the percentage of public school students who meet the Goals Panel’s performance standard in science in Grade 8? (1996)
11. Advanced Placement Performance: Has the stateincreased the number of Advanced Placement examinations(per 1,000 11th and 12th graders) receiving a grade of 3 orhigher? (1991, 1997)
Goal 4: Teacher Education and Professional Development
12. Teacher Preparation: Has the state increased teacherpreparation, as measured by the percentage of public secondaryschool teachers who hold • an undergraduate or graduate degree in their main teaching
assignment? (1991, 1994)• a teaching certificate in their main teaching assignment?
(1991, 1994)
Guide to Reading the State Pages (continued)
Chapter 3 10/30/97 12:13 PM Page 73

13. Teacher Professional Development: Has the stateincreased the professional development opportunities of teachers, as measured by the percentage of public school teachers reporting that they participated in in-service or professional development programs on 1 or more topics since the end of the previous school year? (1994)
14. Preparation to Teach Limited English Proficient (LEP)Students: Has the state increased the percentage of publicschool teachers with training to teach limited English proficient students? (1994)
15. Teacher Support: Has the state increased the percentage of public school teachers who report that during their first year of teaching they participated in a formal teacher induc-tion program to help beginning teachers by assigning them to a master or mentor teacher? (1991, 1994)
Goal 5: Mathematics and Science
16. International Mathematics and Science Achievement:Comparisons between those states that participated in the 1996National Assessment of Educational Progress (NAEP) mathematicsand science assessments and those countries that participated in the1995 Third International Mathematics and Science Study(TIMSS) will be reported in future Goals Reports.
17. Mathematics Instructional Practices: Has the stateincreased the percentage of public school 8th graders whosemathematics teachers report that they do the following inmathematics class? • have students work in small groups or with a partner at least
once a week? (1996)• address algebra and functions a lot? (1996)• address reasoning and analytical ability a lot? (1996)
18. Mathematics Resources: Has the state increased the percentage of public school 8th graders whose mathematicsteachers report they have computers available in their mathe-matics classrooms? (1996)
19. Mathematics and Science Degrees: Has the stateincreased mathematics and science degrees as a percentage of all degrees awarded to:• all students? (1991, 1995)• minorities (Blacks, Hispanics, American Indians/
Alaskan Natives)? (1991, 1995)• females? (1991, 1995)
Goal 6: Adult Literacy and Lifelong Learning
20. Adult Literacy: Has the state increased the percentage ofadults who score at or above Level 3 in prose literacy? (1992)
21. Voter Registration and Voting: Has the state increasedthe percentage of U.S. citizens who reported that they • registered to vote? (1988, 1992)• voted? (1988, 1992)
22. Participation in Higher Education: Has the stateincreased the percentage of high school graduates in the state who immediately enroll in 2- or 4-year colleges in any state? (1992, 1994)
Goal 7: Safe, Disciplined, and Alcohol- and Drug-free Schools
23. Student Marijuana Use: Has the state reduced the per-centage of public high school students who reported using marijuana at least once during the past 30 days? (1991, 1995)
Guide to Reading the State Pages (continued)
74
Chapter 3 10/30/97 12:13 PM Page 74

76
KEY
KEY
!! Significant progress
@@ Significant decline
## Change is not significant
8. Increased reading achievement in Grade 4? (1992, 1994) • 20% 23% ## 29% 30% ## 8-38% 8-41% 26% 27%9. Increased mathematics achievement •
• in Grade 4? (1992, 1996) 10% 11% ## 18% 21% !! 5-27% 3-31% 16% 20%• in Grade 8? (1990, 1996) 9% 12% ## 15% 24% !! 1-27% 5-34% 15% 22%
10. Increased science achievement in Grade 8? (1996) 18% — 29% — 5-41% — 27% —
ALABAMA
† Median is the middle score in a set of ranked scores.* Comparable national data are not available.— Data not available. See Appendix A.• Baseline years and most recent update years may differ by state
for this indicator. See Appendix C for more information.See pages 72-75 for a Guide to Reading the State Pages.See Appendix C for technical notes and sources.
GOAL 1
GOAL 2
GOAL 3
Alabama
baseline update progress?
Range of State Scores
baseline update
MedianScores†
baseline update
U.S.
baseline update progress?
1. Reduced percentage of infants born with 1 or more health risks? (1990, 1995) 39% 36% !! 37% 34% !! 25-48% 24-46% 38% 35%2. Increased percentage of 2-year-olds immunized? (1994, 1996) 75% 78% ## 75% 78% !! 61-88% 64-88% 76% 79%3. Reduced number of infants (per 1,000) born with low birthweight? (1990, 1995) 84 90 @@ 70 73 @@ 48-151 53-134 71 754. Increased number of mothers (per 1,000) receiving early prenatal care? (1990, 1995) 735 817 !! 758 813 !! 469-868 560-900 778 8285. Increased number of children with disabilities in preschool (per 1,000)? (1991, 1996) 41 47 !! * * 16-68 16-92 38 47
6. Increased high school completion rate? (1990, 1995) 82% 87% ## 86% 86% ## 77-96% 79-96% 87% 88%7. Reduced high school dropout rate? (1994) • 6% — * * 3-10% — 5% —
Ready to Learn
School Completion
Student Achievement and Citizenship
19951990
82%87%
100%
80%
60%
40%
20%
0%
ns
High School CompletionPercentage of all18- to 24-year-olds1
who have a highschool credential2(Indicator 6)
1 Does not include those still in high school.2 Includes traditional high school diploma and alternative credential.nsInterpret with caution. Change was not statistically significant.
0%
20%
40%
60%
80%
100%
19951990
39%36%
Children’sHealth IndexPercentage ofinfants born with 1or more healthrisks1 (Indicator 1)
1 Includes late (in third trimester) or no prenatal care, low maternal weightgain (less than 21 pounds), mother smoked during pregnancy, or motherdrank alcohol during pregnancy.
Scorecards #1 (AL-MS) 10/30/97 10:10 AM Page 76
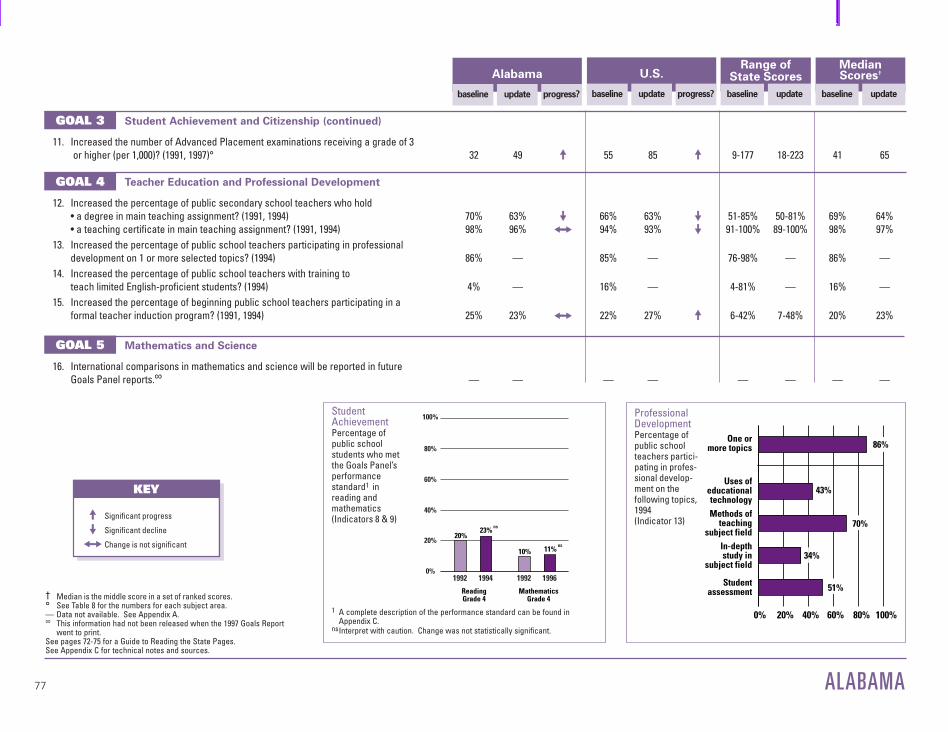
77
KEY
KEY
!! Significant progress
@@ Significant decline
## Change is not significant
† Median is the middle score in a set of ranked scores.° See Table 8 for the numbers for each subject area.— Data not available. See Appendix A.∞ This information had not been released when the 1997 Goals Report
went to print.See pages 72-75 for a Guide to Reading the State Pages.See Appendix C for technical notes and sources.
11. Increased the number of Advanced Placement examinations receiving a grade of 3or higher (per 1,000)? (1991, 1997)° 32 49 !! 55 85 !! 9-177 18-223 41 65
12. Increased the percentage of public secondary school teachers who hold • a degree in main teaching assignment? (1991, 1994) 70% 63% @@ 66% 63% @@ 51-85% 50-81% 69% 64%• a teaching certificate in main teaching assignment? (1991, 1994) 98% 96% ## 94% 93% @@ 91-100% 89-100% 98% 97%
13. Increased the percentage of public school teachers participating in professional development on 1 or more selected topics? (1994) 86% — 85% — 76-98% — 86% —
14. Increased the percentage of public school teachers with training to teach limited English-proficient students? (1994) 4% — 16% — 4-81% — 16% —
15. Increased the percentage of beginning public school teachers participating in a formal teacher induction program? (1991, 1994) 25% 23% ## 22% 27% !! 6-42% 7-48% 20% 23%
16. International comparisons in mathematics and science will be reported in future Goals Panel reports.∞ — — — — — — — —
ALABAMA
GOAL 3
GOAL 4
U.S.
baseline update progress?
Alabama
baseline update progress?
Range of State Scores
baseline update
MedianScores†
baseline update
Student Achievement and Citizenship (continued)
Teacher Education and Professional Development
GOAL 5 Mathematics and Science
ReadingGrade 4
MathematicsGrade 4
1996199219941992
20%23%
10% 11%
100%
80%
60%
40%
20%
0%
ns
ns
Student AchievementPercentage of public school students who metthe Goals Panel’sperformancestandard1 in reading and mathematics (Indicators 8 & 9)
1 A complete description of the performance standard can be found inAppendix C.
nsInterpret with caution. Change was not statistically significant.00% 20% 40% 60% 80% 100%
Uses ofeducationaltechnology
One ormore topics
Methods ofteaching
subject fieldIn-depthstudy in
subject field
Studentassessment
43%
34%
51%
86%
70%
Professional DevelopmentPercentage ofpublic schoolteachers partici-pating in profes-sional develop-ment on thefollowing topics,1994(Indicator 13)
Scorecards #1 (AL-MS) 10/30/97 10:10 AM Page 77

78
20. Increased adult literacy? (1992) — — 52% — 46-77% — 53% —21. Increased the percentage of U.S. citizens
• registered to vote? (1988, 1992) 74% 78% ## 70% 73% !! 58-95% 63-92% 71% 75%• voting? (1988, 1992) 57% 64% !! 61% 66% !! 50-74% 55-77% 62% 68%
22. Increased postsecondary enrollment? (1992, 1994) 56% 64% !! ** ** 33-68% 37-71% 53% 55%
ALABAMA
† Median is the middle score in a set of ranked scores.— Data not available. See Appendix A.** Indicators are not the same at the national and state level.See pages 72-75 for a Guide to Reading the State Pages.See Appendix C for technical notes and sources.
GOAL 5
GOAL 6
Alabama
baseline update progress?
Range of State Scores
baseline update
MedianScores†
baseline update
U.S.
baseline update progress?
17. Increased the percentage of public school 8th graders whose mathematics teachers • have students work in small groups or with a partner? (1996) 50% — 66% — 45-92% — 67% —• address Algebra and functions? (1996) 52% — 57% — 45-82% — 58% —• address reasoning and analytical ability? (1996) 39% — 52% — 39-64% — 48% —
18. Increased the percentage of public school 8th graders who have computers availablein their mathematics classroom? (1996) 33% — 30% — 7-54% — 30% —
19. Increased mathematics and science degrees awarded to• all students? (1991, 1995) 34% 38% !! 39% 42% !! 25-49% 15-53% 39% 42%• minorities (Black, Hispanic, American Indian/Alaskan Native)? (1991, 1995) 40% 37% @@ 39% 40% !! 22-64% 22-57% 39% 39%• females? (1991, 1995) 30% 34% !! 35% 37% !! 23-46% 13-47% 33% 36%
Mathematics and Science (continued)
Adult Literacy and Lifelong Learning
Addressreasoning & analytical
ability
AddressAlgebra and functions
Work insmall groups
or with apartner 1
2
2
52%
39%
50%
0% 20% 40% 60% 80% 100%
MathematicsInstructionPercentage ofpublic school 8thgraders whosemathematicsteachers do thefollowing, 1996(Indicator 17)
1 At least once a week.2 On a 4-point scale from “none” to “a lot,” defined as a response to the top point.
!! Significant progress
@@ Significant decline
## Change is not significant
KEY
Scorecards #1 (AL-MS) 10/30/97 10:10 AM Page 78

79
KEY
KEY
!! Significant progress
@@ Significant decline
## Change is not significant
† Median is the middle score in a set of ranked scores.** Indicators are not the same at the national and state level.— Data not available. See Appendix A.• Baseline years and most recent update years may differ by state
for this indicator. See Appendix C for more information.See pages 72-75 for a Guide to Reading the State Pages.See Appendix C for technical notes and sources.
23. Reduced marijuana use? (1991, 1995) • 10% 17% @@ ** ** 4-18% 7-32% 10% 23%24. Reduced alcohol use (5 or more drinks in a row)? (1991, 1995) • 30% 25% !! ** ** 17-43% 13-43% 30% 31%25. Reduced availability of drugs on school property? (1993, 1995) • 18% 28% @@ ** ** 11-31% 20-46% 22% 30%26. Reduced students threatened or injured with a weapon on school property? (1995) • 9% — ** ** 4-11% — 8% —27. Reduced physical fights on school property? (1993, 1995) • 14% 14% ## ** ** 13-39% 12-19% 16% 15%28. Reduced students carrying weapons on school property? (1993, 1995) • 13% 13% ## ** ** 8-18% 7-14% 12% 11%29. Reduced students not feeling safe at school? (1995) • 6% — ** ** 3-16% — 5% —30. Reduced teacher victimization? (1994) 14% — 15% — 8-26% — 14% —31. Reduced student disruptions? (1991, 1994) 40% 54% @@ 37% 46% @@ 23-60% 33-65% 37% 47%
32. Decreased schools with minimal parental involvement• Teacher’s perspective? (1991, 1994) 31% 32% ## ** ** 9-44% 13-50% 23% 27%• Principal’s perspective? (1991, 1994) 15% 17% ## ** ** 4-22% 3-27% 13% 13%
33. Increased influence of parent associations? (1991, 1994) 14% 21% ## ** ** 8-37% 12-50% 16% 22%
ALABAMA
GOAL 7
GOAL 8
U.S.
baseline update progress?
Alabama
baseline update progress?
Range of State Scores
baseline update
MedianScores†
baseline update
Safe, Disciplined and Alcohol- and Drug-free Schools
Parental Participation
17%
10%
30%
28%
25%
18%
1991 1993 1995
Usedmarijuana
Had 5 ormore drinks
in a row
Were offered, sold,or given an illegal drug
on school property
1
1
2
0% 20% 40% 60% 80% 100%
Alcohol- andDrug-freeSchoolsPercentage ofpublic high schoolstudents whoreported the fol-lowing(Indicators 23,24, & 25)
1 During the past 30 days.2 During the past 12 months.
0
20
40
60
80
1000% 20% 40% 60% 80% 100%
Establishingcurriculum
One ormore areas
Hiring newfull-timeteachers
Settingdiscipline
policy
7%
9%
21%ns
14%
2%
16%ns
2%
9%
1991 1994
ns
Parent-SchoolPartnershipsPercentage of public school principals whoreported that theparent associationhas influence1 onthe following areas(Indicator 33)
1 On a 6-point scale from no influence to a great deal of influence, defined asa response to the top two points.
nsInterpret with caution. Change was not statistically significant.
Scorecards #1 (AL-MS) 10/30/97 10:10 AM Page 79

80
KEY
KEY
!! Significant progress
@@ Significant decline
## Change is not significant
8. Increased reading achievement in Grade 4? (1992, 1994) • — — 29% 30% ## 8-38% 8-41% 26% 27%9. Increased mathematics achievement •
• in Grade 4? (1996) 21% — 21% — 3-31% — 20% —• in Grade 8? (1996) 30% — 24% — 5-34% — 22% —
10. Increased science achievement in Grade 8? (1996) 31% — 29% — 5-41% — 27% —
ALASKA
† Median is the middle score in a set of ranked scores.* Comparable national data are not available.— Data not available. See Appendix A.• Baseline years and most recent update years may differ by state
for this indicator. See Appendix C for more information.See pages 72-75 for a Guide to Reading the State Pages.See Appendix C for technical notes and sources.
GOAL 1
GOAL 2
GOAL 3
Alaska
baseline update progress?
Range of State Scores
baseline update
MedianScores†
baseline update
U.S.
baseline update progress?
1. Reduced percentage of infants born with 1 or more health risks? (1990, 1995) 37% 34% !! 37% 34% !! 25-48% 24-46% 38% 35%2. Increased percentage of 2-year-olds immunized? (1994, 1996) 73% 73% ## 75% 78% !! 61-88% 64-88% 76% 79%3. Reduced number of infants (per 1,000) born with low birthweight? (1990, 1995) 48 53 @@ 70 73 @@ 48-151 53-134 71 754. Increased number of mothers (per 1,000) receiving early prenatal care? (1990, 1995) 800 834 !! 758 813 !! 469-868 560-900 778 8285. Increased number of children with disabilities in preschool (per 1,000)? (1991, 1996) 44 60 !! * * 16-68 16-92 38 47
6. Increased high school completion rate? (1990, 1995) 89% 88% ## 86% 86% ## 77-96% 79-96% 87% 88%7. Reduced high school dropout rate? (1992, 1994) • — — * * 3-12% 3-10% 5% 5%
Ready to Learn
School Completion
Student Achievement and Citizenship
19951990
88%
100%
80%
60%
40%
20%
0%
89% ns
High School CompletionPercentage of all18- to 24-year-olds1
who have a highschool credential2(Indicator 6)
1 Does not include those still in high school.2 Includes traditional high school diploma and alternative credential.nsInterpret with caution. Change was not statistically significant.
0%
20%
40%
60%
80%
100%
19951990
37%34%
Children’sHealth IndexPercentage ofinfants born with 1or more healthrisks1 (Indicator 1)
1 Includes late (in third trimester) or no prenatal care, low maternal weightgain (less than 21 pounds), mother smoked during pregnancy, or motherdrank alcohol during pregnancy.
Scorecards #1 (AL-MS) 10/30/97 10:10 AM Page 80
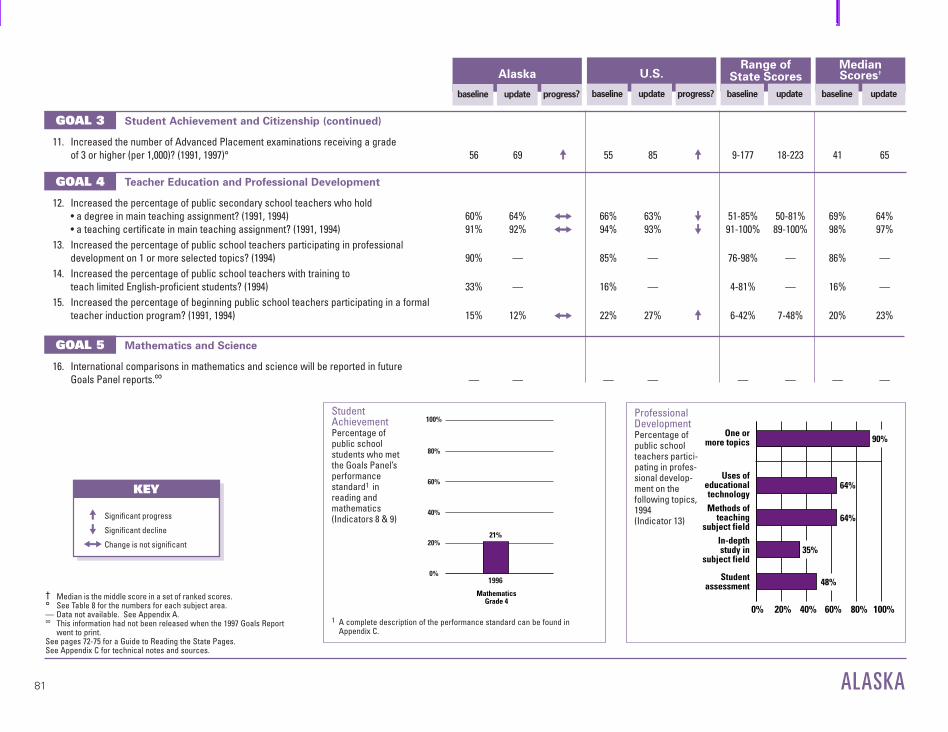
81
KEY
KEY
!! Significant progress
@@ Significant decline
## Change is not significant
† Median is the middle score in a set of ranked scores.° See Table 8 for the numbers for each subject area.— Data not available. See Appendix A.∞ This information had not been released when the 1997 Goals Report
went to print.See pages 72-75 for a Guide to Reading the State Pages.See Appendix C for technical notes and sources.
11. Increased the number of Advanced Placement examinations receiving a grade of 3 or higher (per 1,000)? (1991, 1997)° 56 69 !! 55 85 !! 9-177 18-223 41 65
12. Increased the percentage of public secondary school teachers who hold• a degree in main teaching assignment? (1991, 1994) 60% 64% ## 66% 63% @@ 51-85% 50-81% 69% 64%• a teaching certificate in main teaching assignment? (1991, 1994) 91% 92% ## 94% 93% @@ 91-100% 89-100% 98% 97%
13. Increased the percentage of public school teachers participating in professional development on 1 or more selected topics? (1994) 90% — 85% — 76-98% — 86% —
14. Increased the percentage of public school teachers with training to teach limited English-proficient students? (1994) 33% — 16% — 4-81% — 16% —
15. Increased the percentage of beginning public school teachers participating in a formal teacher induction program? (1991, 1994) 15% 12% ## 22% 27% !! 6-42% 7-48% 20% 23%
16. International comparisons in mathematics and science will be reported in future Goals Panel reports.∞ — — — — — — — —
ALASKA
GOAL 3
GOAL 4
GOAL 5
U.S.
baseline update progress?
Alaska
baseline update progress?
Range of State Scores
baseline update
MedianScores†
baseline update
Student Achievement and Citizenship (continued)
Teacher Education and Professional Development
Mathematics and Science
MathematicsGrade 4
1996
21%
100%
80%
60%
40%
20%
0%
Student AchievementPercentage of public school students who metthe Goals Panel’sperformancestandard1 in reading and mathematics (Indicators 8 & 9)
1 A complete description of the performance standard can be found inAppendix C.
0
20
40
60
80
100
0% 20% 40% 60% 80% 100%
Uses ofeducationaltechnology
One ormore topics
Methods ofteaching
subject fieldIn-depthstudy in
subject field
Studentassessment
64%
35%
48%
90%
64%
Professional DevelopmentPercentage ofpublic schoolteachers partici-pating in profes-sional develop-ment on thefollowing topics,1994(Indicator 13)
Scorecards #1 (AL-MS) 10/30/97 10:10 AM Page 81
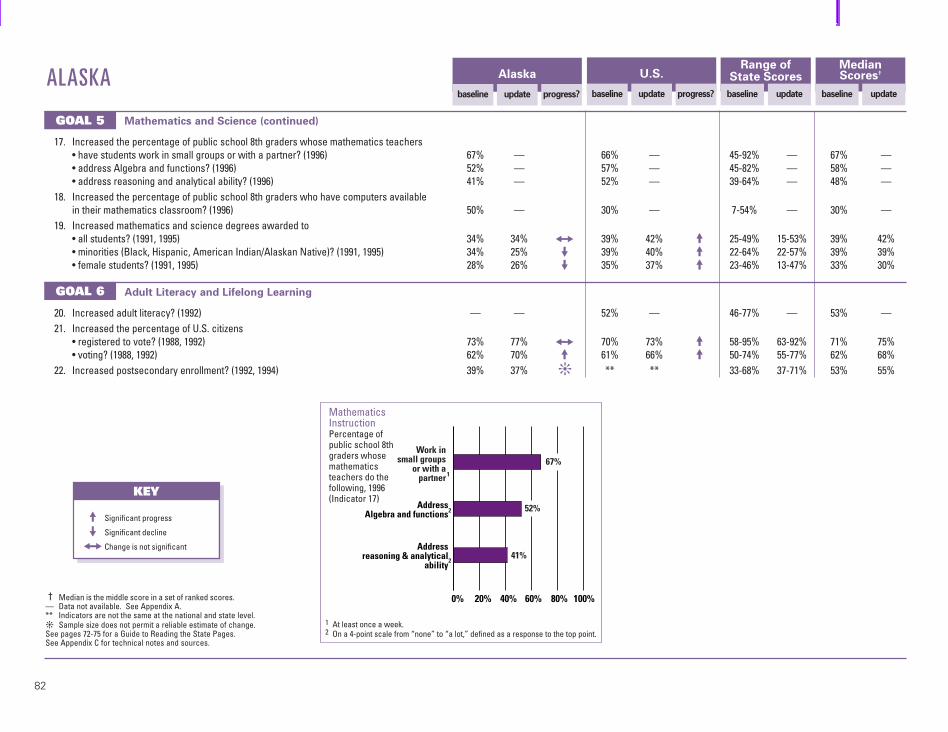
82
KEY
!! Significant progress
@@ Significant decline
## Change is not significant
20. Increased adult literacy? (1992) — — 52% — 46-77% — 53% —21. Increased the percentage of U.S. citizens
• registered to vote? (1988, 1992) 73% 77% ## 70% 73% !! 58-95% 63-92% 71% 75%• voting? (1988, 1992) 62% 70% !! 61% 66% !! 50-74% 55-77% 62% 68%
22. Increased postsecondary enrollment? (1992, 1994) 39% 37% ❊ ** ** 33-68% 37-71% 53% 55%
ALASKA
† Median is the middle score in a set of ranked scores.— Data not available. See Appendix A.** Indicators are not the same at the national and state level.❊ Sample size does not permit a reliable estimate of change.See pages 72-75 for a Guide to Reading the State Pages.See Appendix C for technical notes and sources.
GOAL 5
GOAL 6
Alaska
baseline update progress?
Range of State Scores
baseline update
MedianScores†
baseline update
U.S.
baseline update progress?
17. Increased the percentage of public school 8th graders whose mathematics teachers• have students work in small groups or with a partner? (1996) 67% — 66% — 45-92% — 67% —• address Algebra and functions? (1996) 52% — 57% — 45-82% — 58% —• address reasoning and analytical ability? (1996) 41% — 52% — 39-64% — 48% —
18. Increased the percentage of public school 8th graders who have computers available in their mathematics classroom? (1996) 50% — 30% — 7-54% — 30% —
19. Increased mathematics and science degrees awarded to• all students? (1991, 1995) 34% 34% ## 39% 42% !! 25-49% 15-53% 39% 42%• minorities (Black, Hispanic, American Indian/Alaskan Native)? (1991, 1995) 34% 25% @@ 39% 40% !! 22-64% 22-57% 39% 39%• female students? (1991, 1995) 28% 26% @@ 35% 37% !! 23-46% 13-47% 33% 30%
Mathematics and Science (continued)
Adult Literacy and Lifelong Learning
Addressreasoning & analytical
ability
AddressAlgebra and functions
Work insmall groups
or with apartner
0% 20% 40% 60% 80% 100%
67%
52%
41%
1
2
2
MathematicsInstructionPercentage ofpublic school 8thgraders whosemathematicsteachers do thefollowing, 1996(Indicator 17)
1 At least once a week.2 On a 4-point scale from “none” to “a lot,” defined as a response to the top point.
Scorecards #1 (AL-MS) 10/30/97 10:11 AM Page 82

83
KEY
!! Significant progress
@@ Significant decline
## Change is not significant
† Median is the middle score in a set of ranked scores.** Indicators are not the same at the national and state level.— Data not available. See Appendix A.• Baseline years and most recent update years may differ by state
for this indicator. See Appendix C for more information.See pages 72-75 for a Guide to Reading the State Pages.See Appendix C for technical notes and sources.
23. Reduced marijuana use? (1995) • 29% — ** ** 7-32% — 23% —24. Reduced alcohol use (more than 5 drinks in a row)? (1995) • 31% — ** ** 13-43% — 31% —25. Reduced availability of drugs on school property? (1995) • 34% — ** ** 20-46% — 30% —26. Reduced students threatened or injured with a weapon while on school property? (1995) • 9% — ** ** 4-11% — 8% —27. Reduced physical fights on school property? (1995) • 17% — ** ** 12-19% — 15% —28. Reduced students carrying weapons on school property? (1995) • 12% — ** ** 7-14% — 11% —29. Reduced students not feeling safe at school? (1995) • 4% — ** ** 3-16% — 5% —30. Reduced teacher victimization? (1994) 17% — 15% — 8-26% — 14% —31. Reduced student disruptions? (1991, 1994) 35% 46% @@ 37% 46% @@ 23-60% 33-65% 37% 47%
32. Decreased schools with minimal parental involvement• Teacher’s perspective? (1991, 1994) 25% 32% @@ ** ** 9-44% 13-50% 23% 27%• Principal’s perspective? (1991, 1994) 20% 22% ## ** ** 4-22% 3-27% 13% 13%
33. Increased influence of parent associations? (1991, 1994) 27% 43% !! ** ** 8-37% 12-50% 16% 22%
ALASKA
GOAL 7
GOAL 8
U.S.
baseline update progress?
Alaska
baseline update progress?
Range of State Scores
baseline update
MedianScores†
baseline update
Safe, Disciplined and Alcohol- and Drug-free Schools
Parental Participation
29%
34%
31%
1995
Usedmarijuana
Had 5 ormore drinks
in a row
Were offered, sold,or given an illegal drug
on school property
1
1
2
0% 20% 40% 60% 80% 100%
Alcohol- andDrug-freeSchoolsPercentage ofpublic high schoolstudents whoreported the fol-lowing(Indicators 23,24, & 25)
1 During the past 30 days.2 During the past 12 months.
0% 20% 40% 60% 80% 100%
Establishingcurriculum
One ormore areas
Hiring newfull-timeteachers
Settingdiscipline
policy
19%
13%
43%
27%
8%
30%
15%
21%
1991 1994
ns
ns
Parent-SchoolPartnershipsPercentage of public school principals whoreported that theparent associationhas influence1 onthe following areas(Indicator 33)
1 On a 6-point scale from no influence to a great deal of influence, defined asa response to the top two points.
nsInterpret with caution. Change was not statistically significant.
Scorecards #1 (AL-MS) 10/30/97 10:11 AM Page 83

84
KEY
KEY
!! Significant progress
@@ Significant decline
## Change is not significant
8. Increased reading achievement in Grade 4? (1992, 1994) • 21% 24% ## 29% 30% ## 8-38% 8-41% 26% 27%9. Increased mathematics achievement •
• in Grade 4? (1992, 1996) 13% 15% ## 18% 21% !! 5-27% 3-31% 16% 20%• in Grade 8? (1990, 1996) 13% 18% !! 15% 24% !! 1-27% 5-34% 15% 22%
10. Increased science achievement in Grade 8? (1996) 23% — 29% — 5-41% — 27% —
ARIZONA
† Median is the middle score in a set of ranked scores.* Comparable national data are not available.— Data not available. See Appendix A.• Baseline years and most recent update years may differ by state
for this indicator. See Appendix C for more information.See pages 72-75 for a Guide to Reading the State Pages.See Appendix C for technical notes and sources.
GOAL 1
GOAL 2
GOAL 3
Arizona
baseline update progress?
Range of State Scores
baseline update
MedianScores†
baseline update
U.S.
baseline update progress?
1. Reduced percentage of infants born with 1 or more health risks? (1990, 1995) 37% 33% !! 37% 34% !! 25-48% 24-46% 38% 35%2. Increased percentage of 2-year-olds immunized? (1994, 1996) 77% 72% ## 75% 78% !! 61-88% 64-88% 76% 79%3. Reduced number of infants (per 1,000) born with low birthweight? (1990, 1995) 64 68 @@ 70 73 @@ 48-151 53-134 71 754. Increased number of mothers (per 1,000) receiving early prenatal care? (1990, 1995) 675 721 !! 758 813 !! 469-868 560-900 778 8285. Increased number of children with disabilities in preschool (per 1,000)? (1991, 1996) 25 37 !! * * 16-68 16-92 38 47
6. Increased high school completion rate? (1990, 1995) 83% 86% ## 86% 86% ## 77-96% 79-96% 87% 88%7. Reduced high school dropout rate? (1992) • 11% — * * 3-12% — 5% —
Ready to Learn
School Completion
Student Achievement and Citizenship
19951990
86%
100%
80%
60%
40%
20%
0%
83%ns
High School CompletionPercentage of all18- to 24-year-olds1
who have a highschool credential2(Indicator 6)
1 Does not include those still in high school.2 Includes traditional high school diploma and alternative credential.nsInterpret with caution. Change was not statistically significant.
0%
20%
40%
60%
80%
100%
19951990
37%33%
Children’sHealth IndexPercentage ofinfants born with 1or more healthrisks1 (Indicator 1)
1 Includes late (in third trimester) or no prenatal care, low maternal weightgain (less than 21 pounds), mother smoked during pregnancy, or motherdrank alcohol during pregnancy.
Scorecards #1 (AL-MS) 10/30/97 10:11 AM Page 84

85
KEY
KEY
!! Significant progress
@@ Significant decline
## Change is not significant
† Median is the middle score in a set of ranked scores.° See Table 8 for the numbers for each subject area.— Data not available. See Appendix A.∞ This information had not been released when the 1997 Goals Report
went to print.See pages 72-75 for a Guide to Reading the State Pages.See Appendix C for technical notes and sources.
11. Increased the number of Advanced Placement examinations receiving a grade of 3 or higher (per 1,000)? (1991, 1997)° 43 60 !! 55 85 !! 9-177 18-223 41 65
12. Increased the percentage of public secondary school teachers who hold • a degree in main teaching assignment? (1991, 1994) 63% 58% ## 66% 63% @@ 51-85% 50-81% 69% 64%• a teaching certificate in main teaching assignment? (1991, 1994) 96% 95% ## 94% 93% @@ 91-100% 89-100% 98% 97%
13. Increased the percentage of public school teachers participating in professional development on 1 or more selected topics? (1994) 85% — 85% — 76-98% — 86% —
14. Increased the percentage of public school teachers with training to teach limited English-proficient students? (1994) 40% — 16% — 4-81% — 16% —
15. Increased the percentage of beginning public school teachers participating in a formal teacher induction program? (1991, 1994) 25% 30% !! 22% 27% !! 6-42% 7-48% 20% 23%
16. International comparisons in mathematics and science will be reported in future Goals Panel reports.∞ — — — — — — — —
ARIZONA
GOAL 3
GOAL 4
GOAL 5
U.S.
baseline update progress?
Arizona
baseline update progress?
Range of State Scores
baseline update
MedianScores†
baseline update
Student Achievement and Citizenship (continued)
Teacher Education and Professional Development
Mathematics and Science
ReadingGrade 4
MathematicsGrade 4
1996199219941992
21%24%
13% 15%
100%
80%
60%
40%
20%
0%
ns
ns
Student AchievementPercentage of public school students who metthe Goals Panel’sperformancestandard1 in reading and mathematics (Indicators 8 & 9)
1 A complete description of the performance standard can be found inAppendix C.
nsInterpret with caution. Change was not statistically significant.
0 20
40
60
80
100
0% 20% 40% 60% 80% 100%
Uses ofeducationaltechnology
One ormore topics
Methods ofteaching
subject fieldIn-depthstudy in
subject field
Studentassessment
46%
27%
54%
85%
56%
Professional DevelopmentPercentage ofpublic schoolteachers partici-pating in profes-sional develop-ment on thefollowing topics,1994(Indicator 13)
Scorecards #1 (AL-MS) 10/30/97 10:11 AM Page 85

86
KEY
!! Significant progress
@@ Significant decline
## Change is not significant
20. Increased adult literacy? (1992) — — 52% — 46-77% — 53% —21. Increased the percentage of U.S. citizens
• registered to vote? (1988, 1992) 66% 75% !! 70% 73% !! 58-95% 63-92% 71% 75%• voting? (1988, 1992) 57% 69% !! 61% 66% !! 50-74% 55-77% 62% 68%
22. Increased postsecondary enrollment? (1992, 1994) 45% 50% ❊ ** ** 33-68% 37-71% 53% 55%
ARIZONA
† Median is the middle score in a set of ranked scores.— Data not available. See Appendix A.** Indicators are not the same at the national and state level.❊ Sample size does not permit a reliable estimate of change.See pages 72-75 for a Guide to Reading the State Pages.See Appendix C for technical notes and sources.
GOAL 5
GOAL 6
Arizona
baseline update progress?
Range of State Scores
baseline update
MedianScores†
baseline update
U.S.
baseline update progress?
17. Increased the percentage of public school 8th graders whose mathematics teachers • have students work in small groups or with a partner? (1996) 75% — 66% — 45-92% — 67% —• address Algebra and functions? (1996) 56% — 57% — 45-82% — 58% —• address reasoning and analytical ability? (1996) 48% — 52% — 39-64% — 48% —
18. Increased the percentage of public school 8th graders who have computers available in their mathematics classroom? (1996) 33% — 30% — 7-54% — 30% —
19. Increased mathematics and science degrees awarded to• all students? (1991, 1995) 26% 34% !! 39% 42% !! 25-49% 15-53% 39% 42%• minorities (Black, Hispanic, American Indian/Alaskan Native)? (1991, 1995) 22% 30% !! 39% 40% !! 22-64% 22-57% 39% 39%• female students? (1991, 1995) 24% 29% !! 35% 37% !! 23-46% 13-47% 33% 36%
Mathematics and Science (continued)
Adult Literacy and Lifelong Learning
Addressreasoning & analytical
ability
AddressAlgebra and functions
Work insmall groups
or with apartner
0% 20% 40% 60% 80% 100%
75%
56%
48%
1
2
2
MathematicsInstructionPercentage ofpublic school 8thgraders whosemathematicsteachers do thefollowing, 1996(Indicator 17)
1 At least once a week.2 On a 4-point scale from “none” to “a lot,” defined as a response to the top point.
Scorecards #1 (AL-MS) 10/30/97 10:11 AM Page 86

87
KEY
!! Significant progress
@@ Significant decline
## Change is not significant
† Median is the middle score in a set of ranked scores.** Indicators are not the same at the national and state level.— Data not available. See Appendix A.• Baseline years and most recent update years may differ by state
for this indicator. See Appendix C for more information.See pages 72-75 for a Guide to Reading the State Pages.See Appendix C for technical notes and sources.
23. Reduced marijuana use? (1991, 1995) • — — ** ** 4-18% 7-32% 10% 23%24. Reduced alcohol use (more than 5 drinks in a row)? (1991, 1995) • — — ** ** 17-43% 13-43% 30% 31%25. Reduced availability of drugs on school property? (1993, 1995) • — — ** ** 11-31% 20-46% 22% 30%26. Reduced students threatened or injured with a weapon while on school property? (1993, 1995) • — — ** ** 6-15% 4-11% 8% 8%27. Reduced physical fights on school property? (1993, 1995) • — — ** ** 13-39% 12-19% 16% 15%28. Reduced students carrying weapons on school property? (1993, 1995) • — — ** ** 8-18% 7-14% 12% 11%29. Reduced students not feeling safe at school? (1993, 1995) • — — ** ** 3-23% 3-16% 6% 5%30. Reduced teacher victimization? (1994) 15% — 15% — 8-26% — 14% —31. Reduced student disruptions? (1991, 1994) 40% 46% ## 37% 46% @@ 23-60% 33-65% 37% 47%
32. Decreased schools with minimal parental involvement• Teacher’s perspective? (1991, 1994) 36% 37% ## ** ** 9-44% 13-50% 23% 27%• Principal’s perspective? (1991, 1994) 21% 16% ## ** ** 4-22% 3-27% 13% 13%
33. Increased influence of parent associations? (1991, 1994) 20% 32% !! ** ** 8-37% 12-50% 16% 22%
ARIZONA
GOAL 7
GOAL 8
U.S.
baseline update progress?
Arizona
baseline update progress?
Range of State Scores
baseline update
MedianScores†
baseline update
Safe, Disciplined and Alcohol- and Drug-free Schools
Parental Participation
0% 20% 40% 60% 80% 100%
Establishingcurriculum
One ormore areas
Hiring newfull-timeteachers
Settingdiscipline
policy
1991 1994
20%
32%
9%
11%
3%
9%
16%
25%
ns
Parent-SchoolPartnershipsPercentage of public school principals whoreported that theparent associationhas influence1 onthe following areas(Indicator 33)
1 On a 6-point scale from no influence to a great deal of influence, defined asa response to the top two points.
nsInterpret with caution. Change was not statistically significant.
Scorecards #1 (AL-MS) 10/30/97 10:11 AM Page 87

88
KEY
KEY
!! Significant progress
@@ Significant decline
## Change is not significant
8. Increased reading achievement in Grade 4? (1992, 1994) • 23% 24% ## 29% 30% ## 8-38% 8-41% 26% 27%9. Increased mathematics achievement •
• in Grade 4? (1992, 1996) 10% 13% ## 18% 21% !! 5-27% 3-31% 16% 20%• in Grade 8? (1990, 1996) 9% 13% !! 15% 24% !! 1-27% 5-34% 15% 22%
10. Increased science achievement in Grade 8? (1996) 22% — 29% — 5-41% — 27% —
ARKANSAS
† Median is the middle score in a set of ranked scores.* Comparable national data are not available.— Data not available. See Appendix A.• Baseline years and most recent update years may differ by state
for this indicator. See Appendix C for more information.See pages 72-75 for a Guide to Reading the State Pages.See Appendix C for technical notes and sources.
GOAL 1
GOAL 2
GOAL 3
Arkansas
baseline update progress?
Range of State Scores
baseline update
MedianScores†
baseline update
U.S.
baseline update progress?
1. Reduced percentage of infants born with 1 or more health risks? (1990, 1995) 42% 40% !! 37% 34% !! 25-48% 24-46% 38% 35%2. Increased percentage of 2-year-olds immunized? (1994, 1996) 71% 75% ## 75% 78% !! 61-88% 64-88% 76% 79%3. Reduced number of infants (per 1,000) born with low birthweight? (1990, 1995) 82 82 ## 70 73 @@ 48-151 53-134 71 754. Increased number of mothers (per 1,000) receiving early prenatal care? (1990, 1995) 708 766 !! 758 813 !! 469-868 560-900 778 828 5. Increased number of children with disabilities in preschool (per 1,000)? (1991, 1996) 45 70 !! * * 16-68 16-92 38 47
6. Increased high school completion rate? (1990, 1995) 87% 87% ## 86% 86% ## 77-96% 79-96% 87% 88%7. Reduced high school dropout rate? (1992, 1994) • 4% 5% @@ * * 3-12% 3-10% 5% 5%
Ready to Learn
School Completion
Student Achievement and Citizenship
19951990
87%
100%
80%
60%
40%
20%
0%
87%
High School CompletionPercentage of all18- to 24-year-olds1
who have a highschool credential2(Indicator 6)
1 Does not include those still in high school.2 Includes traditional high school diploma and alternative credential.
0%
20%
40%
60%
80%
100%
19951990
42% 40%
Children’sHealth IndexPercentage ofinfants born with 1or more healthrisks1 (Indicator 1)
1 Includes late (in third trimester) or no prenatal care, low maternal weightgain (less than 21 pounds), mother smoked during pregnancy, or motherdrank alcohol during pregnancy.
Scorecards #1 (AL-MS) 10/30/97 10:11 AM Page 88

89
KEY
KEY
!! Significant progress
@@ Significant decline
## Change is not significant
† Median is the middle score in a set of ranked scores.° See Table 8 for the numbers for each subject area.— Data not available. See Appendix A.∞ This information had not been released when the 1997 Goals Report
went to print.See pages 72-75 for a Guide to Reading the State Pages.See Appendix C for technical notes and sources.
11. Increased the number of Advanced Placement examinations receiving a grade of 3 or higher (per 1,000)? (1991, 1997)° 15 28 !! 55 85 !! 9-177 18-223 41 65
12. Increased the percentage of public secondary school teachers who hold • a degree in main teaching assignment? (1991, 1994) 62% 60% ## 66% 63% @@ 51-85% 50-81% 69% 64%• a teaching certificate in main teaching assignment? (1991, 1994) 98% 97% ## 94% 93% @@ 91-100% 89-100% 98% 97%
13. Increased the percentage of public school teachers participating in professional development on 1 or more selected topics? (1994) 84% — 85% — 76-98% — 86% —
14. Increased the percentage of public school teachers with training to teach limited English-proficient students? (1994) 6% — 16% — 4-81% — 16% —
15. Increased the percentage of beginning public school teachers participating in a formal teacher induction program? (1991, 1994) 15% 14% ## 22% 27% !! 6-42% 7-48% 20% 23%
16. International comparisons in mathematics and science will be reported in future Goals Panel reports.∞ — — — — — — — —
ARKANSAS
GOAL 3
GOAL 4
GOAL 5
U.S.
baseline update progress?
Arkansas
baseline update progress?
Range of State Scores
baseline update
MedianScores†
baseline update
Student Achievement and Citizenship (continued)
Teacher Education and Professional Development
Mathematics and Science
ReadingGrade 4
MathematicsGrade 4
1996199219941992
23% 24%
10%13%
100%
80%
60%
40%
20%
0%
ns
ns
Student AchievementPercentage of public school students who metthe Goals Panel’sperformancestandard1 in reading and mathematics (Indicators 8 & 9)
1 A complete description of the performance standard can be found inAppendix C.
nsInterpret with caution. Change was not statistically significant.
0 20
40
60
80
100
0% 20% 40% 60% 80% 100%
Uses ofeducationaltechnology
One ormore topics
Methods ofteaching
subject fieldIn-depthstudy in
subject field
Studentassessment
84%
33%
68%
27%
47%
Professional DevelopmentPercentage ofpublic schoolteachers partici-pating in profes-sional develop-ment on thefollowing topics,1994(Indicator 13)
Scorecards #1 (AL-MS) 10/30/97 10:11 AM Page 89

90
KEY
!! Significant progress
@@ Significant decline
## Change is not significant
20. Increased adult literacy? (1992) — — 52% — 46-77% — 53% —21. Increased the percentage of U.S. citizens
• registered to vote? (1988, 1992) 68% 67% ## 70% 73% !! 58-95% 63-92% 71% 75%• voting? (1988, 1992) 56% 58% ## 61% 66% !! 50-74% 55-77% 62% 68%
22. Increased postsecondary enrollment? (1992, 1994) 46% 48% ❊ ** ** 33-68% 37-71% 53% 55%
ARKANSAS
† Median is the middle score in a set of ranked scores.— Data not available. See Appendix A.** Indicators are not the same at the national and state level.❊ Sample size does not permit a reliable estimate of change.See pages 72-75 for a Guide to Reading the State Pages.See Appendix C for technical notes and sources.
GOAL 5
GOAL 6
Arkansas
baseline update progress?
Range of State Scores
baseline update
MedianScores†
baseline update
U.S.
baseline update progress?
17. Increased the percentage of public school 8th graders whose mathematics teachers • have students work in small groups or with a partner? (1996) 47% — 66% — 45-92% — 67% —• address Algebra and functions? (1996) 59% — 57% — 45-82% — 58% —• address reasoning and analytical ability? (1996) 39% — 52% — 39-64% — 48% —
18. Increased the percentage of public school 8th graders who have computers available in their mathematics classroom? (1996) 23% — 30% — 7-54% — 30% —
19. Increased mathematics and science degrees awarded to• all students? (1991, 1995) 32% 37% !! 39% 42% !! 25-49% 15-53% 39% 42%• minorities (Black, Hispanic, American Indian/Alaskan Native)? (1991, 1995) 31% 33% !! 39% 40% !! 22-64% 22-57% 39% 39%• female students? (1991, 1995) 28% 32% !! 35% 37% !! 23-46% 13-47% 33% 36%
Mathematics and Science (continued)
Adult Literacy and Lifelong Learning
Addressreasoning & analytical
ability
AddressAlgebra and functions
Work insmall groups
or with apartner
0% 20% 40% 60% 80% 100%
47%
59%
39%
1
2
2
MathematicsInstructionPercentage ofpublic school 8thgraders whosemathematicsteachers do thefollowing, 1996(Indicator 17)
1 At least once a week.2 On a 4-point scale from “none” to “a lot,” defined as a response to the top point.
Scorecards #1 (AL-MS) 10/30/97 10:11 AM Page 90

91
KEY
!! Significant progress
@@ Significant decline
## Change is not significant
† Median is the middle score in a set of ranked scores.** Indicators are not the same at the national and state level.— Data not available. See Appendix A.• Baseline years and most recent update years may differ by state
for this indicator. See Appendix C for more information.See pages 72-75 for a Guide to Reading the State Pages.See Appendix C for technical notes and sources.
23. Reduced marijuana use? (1995) • 23% — ** ** 7-32% — 23% —24. Reduced alcohol use (more than 5 drinks in a row)? (1995) • 32% — ** ** 13-43% — 31% —25. Reduced availability of drugs on school property? (1995) • 27% — ** ** 20-46% — 30% —26. Reduced students threatened or injured with a weapon while on school property? (1995) • 9% — ** ** 4-11% — 8% —27. Reduced physical fights on school property? (1995) • 17% — ** ** 12-19% — 15% —28. Reduced students carrying weapons on school property? (1995) • 11% — ** ** 7-14% — 11% —29. Reduced students not feeling safe at school? (1995) • 5% — ** ** 3-16% — 5% —30. Reduced teacher victimization? (1994) 15% — 15% — 8-26% — 14% —31. Reduced student disruptions? (1991, 1994) 34% 45% @@ 37% 46% @@ 23-60% 33-65% 37% 47%
32. Decreased schools with minimal parental involvement• Teacher’s perspective? (1991, 1994) 30% 29% ## ** ** 9-44% 13-50% 23% 27%• Principal’s perspective? (1991, 1994) 20% 22% ## ** ** 4-22% 3-27% 13% 13%
33. Increased influence of parent associations? (1991, 1994) 11% 17% ## ** ** 8-37% 12-50% 16% 22%
ARKANSAS
GOAL 7
GOAL 8
U.S.
baseline update progress?
Arkansas
baseline update progress?
Range of State Scores
baseline update
MedianScores†
baseline update
Safe, Disciplined and Alcohol- and Drug-free Schools
Parental Participation
Usedmarijuana
Had 5 ormore drinks
in a row
Were offered, sold,or given an illegal drug
on school property
1
1
2
0% 20% 40% 60% 80% 100%
1995
23%
32%
27%
Alcohol- andDrug-freeSchoolsPercentage ofpublic high schoolstudents whoreported the fol-lowing(Indicators 23,24, & 25)
1 During the past 30 days.2 During the past 12 months.
0% 20% 40% 60% 80% 100%
Establishingcurriculum
One ormore areas
Hiring newfull-timeteachers
Settingdiscipline
policy
1991 1994
11%
17%
6%
8%
2%
7%
14%
ns
ns
ns
Parent-SchoolPartnershipsPercentage of public school principals whoreported that theparent associationhas influence1 onthe following areas(Indicator 33)
1 On a 6-point scale from no influence to a great deal of influence, defined asa response to the top two points.
nsInterpret with caution. Change was not statistically significant.
Scorecards #1 (AL-MS) 10/30/97 10:11 AM Page 91

92
KEY
KEY
!! Significant progress
@@ Significant decline
## Change is not significant
8. Increased reading achievement in Grade 4? (1992, 1994) • 19% 18% ## 29% 30% ## 8-38% 8-41% 26% 27%9. Increased mathematics achievement •
• in Grade 4? (1992, 1996) 12% 11% ## 18% 21% !! 5-27% 3-31% 16% 20%• in Grade 8? (1990, 1996) 12% 17% !! 15% 24% !! 1-27% 5-34% 15% 22%
10. Increased science achievement in Grade 8? (1996) 20% — 29% — 5-41% — 27%
CALIFORNIA
† Median is the middle score in a set of ranked scores.* Comparable national data are not available.— Data not available. See Appendix A.• Baseline years and most recent update years may differ by state
for this indicator. See Appendix C for more information.See pages 72-75 for a Guide to Reading the State Pages.See Appendix C for technical notes and sources.
GOAL 1
GOAL 2
GOAL 3
California
baseline update progress?
Range of State Scores
baseline update
MedianScores†
baseline update
U.S.
baseline update progress?
1. Reduced percentage of infants born with 1 or more health risks? (1990, 1995) — — 37% 34% !! 25-48% 24-46% 38% 35%2. Increased percentage of 2-year-olds immunized? (1994, 1996) 74% 78% ## 75% 78% !! 61-88% 64-88% 76% 79%3. Reduced number of infants (per 1,000) born with low birthweight? (1990, 1995) 58 61 @@ 70 73 @@ 48-151 53-134 71 754. Increased number of mothers (per 1,000) receiving early prenatal care? (1990, 1995) 723 785 !! 758 813 !! 469-868 560-900 778 8285. Increased number of children with disabilities in preschool (per 1,000)? (1991, 1996) 28 32 !! * * 16-68 16-92 38 47
6. Increased high school completion rate? (1990, 1995) 77% 79% ## 86% 86% ## 77-96% 79-96% 87% 88%7. Reduced high school dropout rate? (1992, 1994) • 5% 5% ## * * 3-12% 3-10% 5% 5%
Ready to Learn
School Completion
Student Achievement and Citizenship
19951990
100%
80%
60%
40%
20%
0%
77% 79%ns
High School CompletionPercentage of all18- to 24-year-olds1
who have a highschool credential2(Indicator 6)
1 Does not include those still in high school.2 Includes traditional high school diploma and alternative credential.nsInterpret with caution. Change was not statistically significant.
Scorecards #1 (AL-MS) 10/30/97 10:11 AM Page 92

93
KEY
KEY
!! Significant progress
@@ Significant decline
## Change is not significant
† Median is the middle score in a set of ranked scores.° See Table 8 for the numbers for each subject area.— Data not available. See Appendix A.∞ This information had not been released when the 1997 Goals Report
went to print.See pages 72-75 for a Guide to Reading the State Pages.See Appendix C for technical notes and sources.
11. Increased the number of Advanced Placement examinations receiving a grade of 3 or higher (per 1,000)? (1991, 1997)° 90 130 !! 55 85 !! 9-177 18-223 41 65
12. Increased the percentage of public secondary school teachers who hold • a degree in main teaching assignment? (1991, 1994) 56% 51% ## 66% 63% @@ 51-85% 50-81% 69% 64%• a teaching certificate in main teaching assignment? (1991, 1994) 96% 95% ## 94% 93% @@ 91-100% 89-100% 98% 97%
13. Increased the percentage of public school teachers participating in professional development on 1 or more selected topics? (1994) 94% — 85% — 76-98% — 86% —
14. Increased the percentage of public school teachers with training to teach limited English-proficient students? (1994) 64% — 16% — 4-81% — 16% —
15. Increased the percentage of beginning public school teachers participating in a formal teacher induction program? (1991, 1994) 31% 35% !! 22% 27% !! 6-42% 7-48% 20% 23%
16. International comparisons in mathematics and science will be reported in future Goals Panel reports.∞ — — — — — — — —
CALIFORNIA
GOAL 3
GOAL 4
GOAL 5
U.S.
baseline update progress?
California
baseline update progress?
Range of State Scores
baseline update
MedianScores†
baseline update
Student Achievement and Citizenship (continued)
Teacher Education and Professional Development
Mathematics and Science
ReadingGrade 4
MathematicsGrade 4
1996199219941992
100%
80%
60%
40%
20%
0%
18%19%12% 11%
ns
ns
Student AchievementPercentage of public school students who metthe Goals Panel’sperformancestandard1 in reading and mathematics (Indicators 8 & 9)
1 A complete description of the performance standard can be found inAppendix C.
nsInterpret with caution. Change was not statistically significant.0 2
0
40
60
80
100
0% 20% 40% 60% 80% 100%
Uses ofeducationaltechnology
One ormore topics
Methods ofteaching
subject fieldIn-depthstudy in
subject field
Studentassessment
94%
53%
78%
40%
69%
Professional DevelopmentPercentage ofpublic schoolteachers partici-pating in profes-sional develop-ment on thefollowing topics,1994(Indicator 13)
Scorecards #1 (AL-MS) 10/30/97 10:11 AM Page 93
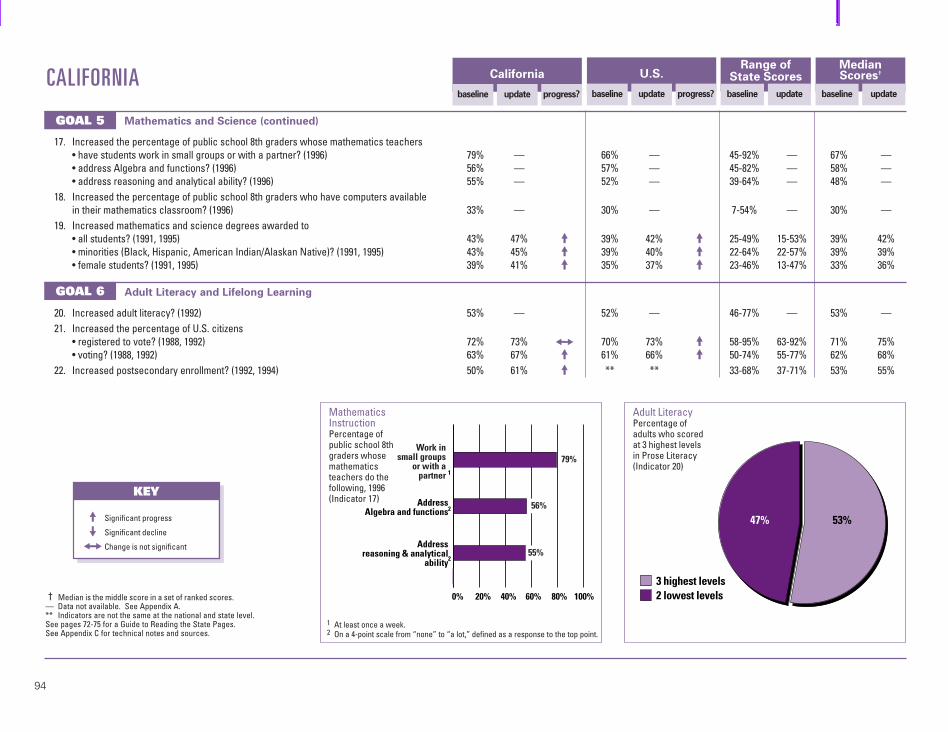
KEY
!! Significant progress
@@ Significant decline
## Change is not significant
20. Increased adult literacy? (1992) 53% — 52% — 46-77% — 53% —21. Increased the percentage of U.S. citizens
• registered to vote? (1988, 1992) 72% 73% ## 70% 73% !! 58-95% 63-92% 71% 75%• voting? (1988, 1992) 63% 67% !! 61% 66% !! 50-74% 55-77% 62% 68%
22. Increased postsecondary enrollment? (1992, 1994) 50% 61% !! ** ** 33-68% 37-71% 53% 55%
CALIFORNIA
† Median is the middle score in a set of ranked scores.— Data not available. See Appendix A.** Indicators are not the same at the national and state level.See pages 72-75 for a Guide to Reading the State Pages.See Appendix C for technical notes and sources.
GOAL 5
GOAL 6
California
baseline update progress?
Range of State Scores
baseline update
MedianScores†
baseline update
U.S.
baseline update progress?
17. Increased the percentage of public school 8th graders whose mathematics teachers • have students work in small groups or with a partner? (1996) 79% — 66% — 45-92% — 67% —• address Algebra and functions? (1996) 56% — 57% — 45-82% — 58% —• address reasoning and analytical ability? (1996) 55% — 52% — 39-64% — 48% —
18. Increased the percentage of public school 8th graders who have computers available in their mathematics classroom? (1996) 33% — 30% — 7-54% — 30% —
19. Increased mathematics and science degrees awarded to• all students? (1991, 1995) 43% 47% !! 39% 42% !! 25-49% 15-53% 39% 42%• minorities (Black, Hispanic, American Indian/Alaskan Native)? (1991, 1995) 43% 45% !! 39% 40% !! 22-64% 22-57% 39% 39%• female students? (1991, 1995) 39% 41% !! 35% 37% !! 23-46% 13-47% 33% 36%
Mathematics and Science (continued)
Adult Literacy and Lifelong Learning
Addressreasoning & analytical
ability
AddressAlgebra and functions
Work insmall groups
or with apartner
0% 20% 40% 60% 80% 100%
79%
56%
55%
1
2
2
MathematicsInstructionPercentage ofpublic school 8thgraders whosemathematicsteachers do thefollowing, 1996(Indicator 17)
1 At least once a week.2 On a 4-point scale from “none” to “a lot,” defined as a response to the top point.
53%47%
3 highest levels2 lowest levels
Adult LiteracyPercentage ofadults who scoredat 3 highest levelsin Prose Literacy(Indicator 20)
94
Scorecards #1 (AL-MS) 10/30/97 10:11 AM Page 94

95
KEY
!! Significant progress
@@ Significant decline
## Change is not significant
† Median is the middle score in a set of ranked scores.** Indicators are not the same at the national and state level.— Data not available. See Appendix A.• Baseline years and most recent update years may differ by state
for this indicator. See Appendix C for more information.See pages 72-75 for a Guide to Reading the State Pages.See Appendix C for technical notes and sources.
23. Reduced marijuana use? (1991, 1995) • — — ** ** 4-18% 7-32% 10% 23%24. Reduced alcohol use (more than 5 drinks in a row)? (1991, 1995) • — — ** ** 17-43% 13-43% 30% 31%25. Reduced availability of drugs on school property? (1993, 1995) • — — ** ** 11-31% 20-46% 22% 30%26. Reduced students threatened or injured with a weapon while on school property? (1993, 1995) • — — ** ** 6-15% 4-11% 8% 8%27. Reduced physical fights on school property? (1993, 1995) • — — ** ** 13-39% 12-19% 16% 15%28. Reduced students carrying weapons on school property? (1993, 1995) • — — ** ** 8-18% 7-14% 12% 11%29. Reduced students not feeling safe at school? (1993, 1995) • — — ** ** 3-23% 3-16% 6% 5%30. Reduced teacher victimization? (1994) 9% — 15% — 8-26% — 14% —31. Reduced student disruptions? (1991, 1994) 43% 43% ## 37% 46% @@ 23-60% 33-65% 37% 47%
32. Decreased schools with minimal parental involvement• Teacher’s perspective? (1991, 1994) 32% 32% ## ** ** 9-44% 13-50% 23% 27%• Principal’s perspective? (1991, 1994) 20% 11% !! ** ** 4-22% 3-27% 13% 13%
33. Increased influence of parent associations? (1991, 1994) 30% 36% ## ** ** 8-37% 12-50% 16% 22%
CALIFORNIA
GOAL 7
GOAL 8
U.S.
baseline update progress?
California
baseline update progress?
Range of State Scores
baseline update
MedianScores†
baseline update
Safe, Disciplined and Alcohol- and Drug-free Schools
Parental Participation
0% 20% 40% 60% 80% 100%
Establishingcurriculum
One ormore areas
Hiring newfull-timeteachers
Settingdiscipline
policy
1991 1994
30%
36%
8%
8%
6%
9%
25%
29%
ns
ns
ns
Parent-SchoolPartnershipsPercentage of public school principals whoreported that theparent associationhas influence1 onthe following areas(Indicator 33)
1 On a 6-point scale from no influence to a great deal of influence, defined asa response to the top two points.
nsInterpret with caution. Change was not statistically significant.
Scorecards #1 (AL-MS) 10/30/97 10:11 AM Page 95

96
KEY
KEY
!! Significant progress
@@ Significant decline
## Change is not significant
8. Increased reading achievement in Grade 4? (1992, 1994) • 25% 28% ## 29% 30% ## 8-38% 8-41% 26% 27%9. Increased mathematics achievement •
• in Grade 4? (1992, 1996) 17% 22% !! 18% 21% !! 5-27% 3-31% 16% 20%• in Grade 8? (1990, 1996) 17% 25% !! 15% 24% !! 1-27% 5-34% 15% 22%
10. Increased science achievement in Grade 8? (1996) 32% — 29% — 5-41% — 27% —
COLORADO
† Median is the middle score in a set of ranked scores.* Comparable national data are not available.— Data not available. See Appendix A.• Baseline years and most recent update years may differ by state
for this indicator. See Appendix C for more information.See pages 72-75 for a Guide to Reading the State Pages.See Appendix C for technical notes and sources.
GOAL 1
GOAL 2
GOAL 3
Colorado
baseline update progress?
Range of State Scores
baseline update
MedianScores†
baseline update
U.S.
baseline update progress?
1. Reduced percentage of infants born with 1 or more health risks? (1990, 1995) 33% 31% !! 37% 34% !! 25-48% 24-46% 38% 35%2. Increased percentage of 2-year-olds immunized? (1994, 1996) 75% 79% ## 75% 78% !! 61-88% 64-88% 76% 79%3. Reduced number of infants (per 1,000) born with low birthweight? (1990, 1995) 80 84 @@ 70 73 @@ 48-151 53-134 71 75 4. Increased number of mothers (per 1,000) receiving early prenatal care? (1990, 1995) 778 804 !! 758 813 !! 469-868 560-900 778 828 5. Increased number of children with disabilities in preschool (per 1,000)? (1991, 1996) 27 43 !! * * 16-68 16-92 38 47
6. Increased high school completion rate? (1990, 1995) 88% 88% ## 86% 86% ## 77-96% 79-96% 87% 88%7. Reduced high school dropout rate? (1992, 1994) • — — * * 3-12% 3-10% 5% 5%
Ready to Learn
School Completion
Student Achievement and Citizenship
19951990
88%
100%
80%
60%
40%
20%
0%
88%
High School CompletionPercentage of all18- to 24-year-olds1
who have a highschool credential2(Indicator 6)
1 Does not include those still in high school.2 Includes traditional high school diploma and alternative credential.
0%
20%
40%
60%
80%
100%
19951990
33%31%
Children’sHealth IndexPercentage ofinfants born with 1or more healthrisks1 (Indicator 1)
1 Includes late (in third trimester) or no prenatal care, low maternal weightgain (less than 21 pounds), mother smoked during pregnancy, or motherdrank alcohol during pregnancy.
Scorecards #1 (AL-MS) 10/30/97 10:11 AM Page 96

97
KEY
KEY
!! Significant progress
@@ Significant decline
## Change is not significant
† Median is the middle score in a set of ranked scores.° See Table 8 for the numbers for each subject area.— Data not available. See Appendix A.∞ This information had not been released when the 1997 Goals Report
went to print.See pages 72-75 for a Guide to Reading the State Pages.See Appendix C for technical notes and sources.
11. Increased the number of Advanced Placement examinations receiving a grade of 3 or higher (per 1,000)? (1991, 1997)° 72 87 !! 55 85 !! 9-177 18-223 41 65
12. Increased the percentage of public secondary school teachers who hold • a degree in main teaching assignment? (1991, 1994) 74% 66% @@ 66% 63% @@ 51-85% 50-81% 69% 64% • a teaching certificate in main teaching assignment? (1991, 1994) 93% 93% ## 94% 93% @@ 91-100% 89-100% 98% 97%
13. Increased the percentage of public school teachers participating in professional development on 1 or more selected topics? (1994) 88% — 85% — 76-98% — 86% —
14. Increased the percentage of public school teachers with training to teach limited English-proficient students? (1994) 21% — 16% — 4-81% — 16% —
15. Increased the percentage of beginning public school teachers participating in a formal teacher induction program? (1991, 1994) 20% 24% ## 22% 27% !! 6-42% 7-48% 20% 23%
16. International comparisons in mathematics and science will be reported in future Goals Panel reports.∞ — — — — — — — —
COLORADO
GOAL 3
GOAL 4
GOAL 5
U.S.
baseline update progress?
Colorado
baseline update progress?
Range of State Scores
baseline update
MedianScores†
baseline update
Student Achievement and Citizenship (continued)
Teacher Education and Professional Development
Mathematics and Science
ReadingGrade 4
MathematicsGrade 4
1996199219941992
100%
80%
60%
40%
20%
0%
28%25%
17%22%
ns
Student AchievementPercentage of public school students who metthe Goals Panel’sperformancestandard1 in reading and mathematics (Indicators 8 & 9)
1 A complete description of the performance standard can be found inAppendix C.
nsInterpret with caution. Change was not statistically significant.0 2
0
40
60
80
100
0% 20% 40% 60% 80% 100%
Uses ofeducationaltechnology
One ormore topics
Methods ofteaching
subject fieldIn-depthstudy in
subject field
Studentassessment
88%
55%
57%
32%
58%
Professional DevelopmentPercentage ofpublic schoolteachers partici-pating in profes-sional develop-ment on thefollowing topics,1994(Indicator 13)
Scorecards #1 (AL-MS) 10/30/97 10:11 AM Page 97

98
KEY
!! Significant progress
@@ Significant decline
## Change is not significant
20. Increased adult literacy? (1992) — — 52% — 46-77% — 53% —21. Increased the percentage of U.S. citizens
• registered to vote? (1988, 1992) 76% 77% ## 70% 73% !! 58-95% 63-92% 71% 75%• voting? (1988, 1992) 68% 71% ## 61% 66% !! 50-74% 55-77% 62% 68%
22. Increased postsecondary enrollment? (1992, 1994) 50% 52% ## ** ** 33-68% 37-71% 53% 55%
COLORADO
† Median is the middle score in a set of ranked scores.— Data not available. See Appendix A.** Indicators are not the same at the national and state level.See pages 72-75 for a Guide to Reading the State Pages.See Appendix C for technical notes and sources.
GOAL 5
GOAL 6
Colorado
baseline update progress?
Range of State Scores
baseline update
MedianScores†
baseline update
U.S.
baseline update progress?
17. Increased the percentage of public school 8th graders whose mathematics teachers • have students work in small groups or with a partner? (1996) 75% — 66% — 45-92% — 67% —• address Algebra and functions? (1996) 55% — 57% — 45-82% — 58% —• address reasoning and analytical ability? (1996) 45% — 52% — 39-64% — 48% —
18. Increased the percentage of public school 8th graders who have computers available in their mathematics classroom? (1996) 27% — 30% — 7-54% — 30% —
19. Increased mathematics and science degrees awarded to• all students? (1991, 1995) 48% 51% !! 39% 42% !! 25-49% 15-53% 39% 42%• minorities (Black, Hispanic, American Indian/Alaskan Native)? (1991, 1995) 46% 48% !! 39% 40% !! 22-64% 22-57% 39% 39%• female students? (1991, 1995) 43% 47% !! 35% 37% !! 23-46% 13-47% 33% 36%
Mathematics and Science (continued)
Adult Literacy and Lifelong Learning
Addressreasoning & analytical
ability
AddressAlgebra and functions
Work insmall groups
or with apartner
0% 20% 40% 60% 80% 100%
75%
55%
45%
1
2
2
MathematicsInstructionPercentage ofpublic school 8thgraders whosemathematicsteachers do thefollowing, 1996(Indicator 17)
1 At least once a week.2 On a 4-point scale from “none” to “a lot,” defined as a response to the top point.
Scorecards #1 (AL-MS) 10/30/97 10:11 AM Page 98

99
KEY
!! Significant progress
@@ Significant decline
## Change is not significant
† Median is the middle score in a set of ranked scores.** Indicators are not the same at the national and state level.— Data not available. See Appendix A.• Baseline years and most recent update years may differ by state
for this indicator. See Appendix C for more information.See pages 72-75 for a Guide to Reading the State Pages.See Appendix C for technical notes and sources.
23. Reduced marijuana use? (1995) • 29% — ** ** 7-32% — 23% —24. Reduced alcohol use (more than 5 drinks in a row)? (1995) • 35% — ** ** 13-43% — 31% —25. Reduced availability of drugs on school property? (1995) • 34% — ** ** 20-46% — 30% —26. Reduced students threatened or injured with a weapon while on school property? (1995) • 10% — ** ** 4-11% — 8% —27. Reduced physical fights on school property? (1995) • 16% — ** ** 12-19% — 15% —28. Reduced students carrying weapons on school property? (1995) • 12% — ** ** 7-14% — 11% —29. Reduced students not feeling safe at school? (1995) • 4% — ** ** 3-16% — 5% —30. Reduced teacher victimization? (1994) 14% — 15% — 8-26% — 14% —31. Reduced student disruptions? (1991, 1994) 40% 49% @@ 37% 46% @@ 23-60% 33-65% 37% 47%
32. Decreased schools with minimal parental involvement• Teacher’s perspective? (1991, 1994) 25% 26% ## ** ** 9-44% 13-50% 23% 27%• Principal’s perspective? (1991, 1994) 17% 8% !! ** ** 4-22% 3-27% 13% 13%
33. Increased influence of parent associations? (1991, 1994) 28% 50% !! ** ** 8-37% 12-50% 16% 22%
COLORADO
GOAL 7
GOAL 8
U.S.
baseline update progress?
Colorado
baseline update progress?
Range of State Scores
baseline update
MedianScores†
baseline update
Safe, Disciplined and Alcohol- and Drug-free Schools
Parental Participation
Usedmarijuana
Had 5 ormore drinks
in a row
Were offered, sold,or given an illegal drug
on school property
1
1
2
0% 20% 40% 60% 80% 100%
1995
29%
35%
34%
Alcohol- andDrug-freeSchoolsPercentage ofpublic high schoolstudents whoreported the fol-lowing(Indicators 23,24, & 25)
1 During the past 30 days.2 During the past 12 months.
0% 20% 40% 60% 80% 100%
Establishingcurriculum
One ormore areas
Hiring newfull-timeteachers
Settingdiscipline
policy
1991 1994
28%
50%
9%
15%
7%
22%
21%
40%
ns
Parent-SchoolPartnershipsPercentage of public school principals whoreported that theparent associationhas influence1 onthe following areas(Indicator 33)
1 On a 6-point scale from no influence to a great deal of influence, defined asa response to the top two points.
nsInterpret with caution. Change was not statistically significant.
Scorecards #1 (AL-MS) 10/30/97 10:11 AM Page 99

100
KEY
KEY
!! Significant progress
@@ Significant decline
## Change is not significant
8. Increased reading achievement in Grade 4? (1992, 1994) • 34% 38% ## 29% 30% ## 8-38% 8-41% 26% 27%9. Increased mathematics achievement •
• in Grade 4? (1992, 1996) 24% 31% !! 18% 21% !! 5-27% 3-31% 16% 20%• in Grade 8? (1990, 1996) 22% 31% !! 15% 24% !! 1-27% 5-34% 15% 22%
10. Increased science achievement in Grade 8? (1996) 36% — 29% — 5-41% — 27% —
CONNECTICUT
† Median is the middle score in a set of ranked scores.* Comparable national data are not available.— Data not available. See Appendix A.• Baseline years and most recent update years may differ by state
for this indicator. See Appendix C for more information.See pages 72-75 for a Guide to Reading the State Pages.See Appendix C for technical notes and sources.
GOAL 1
GOAL 2
GOAL 3
Connecticut
baseline update progress?
Range of State Scores
baseline update
MedianScores†
baseline update
U.S.
baseline update progress?
1. Reduced percentage of infants born with 1 or more health risks? (1990, 1995) 25% 25% ## 37% 34% !! 25-48% 24-46% 38% 35%2. Increased percentage of 2-year-olds immunized? (1994, 1996) 86% 88% ## 75% 78% !! 61-88% 64-88% 76% 79%3. Reduced number of infants (per 1,000) born with low birthweight? (1990, 1995) 66 71 @@ 70 73 @@ 48-151 53-134 71 754. Increased number of mothers (per 1,000) receiving early prenatal care? (1990, 1995) 849 878 !! 758 813 !! 469-868 560-900 778 828 5. Increased number of children with disabilities in preschool (per 1,000)? (1991, 1996) 41 51 !! * * 16-68 16-92 38 47
6. Increased high school completion rate? (1990, 1995) 90% 96% !! 86% 86% ## 77-96% 79-96% 87% 88%7. Reduced high school dropout rate? (1993, 1994) • 5% 5% ## * * 2-10% 3-10% 5% 5%
Ready to Learn
School Completion
Student Achievement and Citizenship
19951990
100%
80%
60%
40%
20%
0%
90%96%
High School CompletionPercentage of all18- to 24-year-olds1
who have a highschool credential2(Indicator 6)
1 Does not include those still in high school.2 Includes traditional high school diploma and alternative credential.
0%
20%
40%
60%
80%
100%
19951990
25% 25%
Children’sHealth IndexPercentage ofinfants born with 1or more healthrisks1 (Indicator 1)
1 Includes late (in third trimester) or no prenatal care, low maternal weightgain (less than 21 pounds), mother smoked during pregnancy, or motherdrank alcohol during pregnancy.
Scorecards #1 (AL-MS) 10/30/97 10:11 AM Page 100

101
KEY
KEY
!! Significant progress
@@ Significant decline
## Change is not significant
† Median is the middle score in a set of ranked scores.° See Table 8 for the numbers for each subject area.— Data not available. See Appendix A.∞ This information had not been released when the 1997 Goals Report
went to print.See pages 72-75 for a Guide to Reading the State Pages.See Appendix C for technical notes and sources.
11. Increased the number of Advanced Placement examinations receiving a grade of 3 or higher (per 1,000)? (1991, 1997)° 83 132 !! 55 85 !! 9-177 18-223 41 65
12. Increased the percentage of public secondary school teachers who hold • a degree in main teaching assignment? (1991, 1994) 76% 74% ## 66% 63% @@ 51-85% 50-81% 69% 64%• a teaching certificate in main teaching assignment? (1991, 1994) 99% 99% ## 94% 93% @@ 91-100% 89-100% 98% 97%
13. Increased the percentage of public school teachers participating in professional development on 1 or more selected topics? (1994) 92% — 85% — 76-98% — 86% —
14. Increased the percentage of public school teachers with training to teach limited English-proficient students? (1994) 17% — 16% — 4-81% — 16% —
15. Increased the percentage of beginning public school teachers participating in a formal teacher induction program? (1991, 1994) 13% 19% !! 22% 27% !! 6-42% 7-48% 20% 23%
16. International comparisons in mathematics and science will be reported in future Goals Panel reports.∞ — — — — — — — —
CONNECTICUT
GOAL 3
GOAL 4
GOAL 5
U.S.
baseline update progress?
Connecticut
baseline update progress?
Range of State Scores
baseline update
MedianScores†
baseline update
Student Achievement and Citizenship (continued)
Teacher Education and Professional Development
Mathematics and Science
ReadingGrade 4
MathematicsGrade 4
1996199219941992
100%
80%
60%
40%
20%
0%
38%34%
24%31%
ns
Student AchievementPercentage of public school students who metthe Goals Panel’sperformancestandard1 in reading and mathematics (Indicators 8 & 9)
1 A complete description of the performance standard can be found inAppendix C.
nsInterpret with caution. Change was not statistically significant.
0 20
40
60
80
100
0% 20% 40% 60% 80% 100%
Uses ofeducationaltechnology
One ormore topics
Methods ofteaching
subject fieldIn-depthstudy in
subject field
Studentassessment
92%
48%
72%
39%
63%
Professional DevelopmentPercentage ofpublic schoolteachers partici-pating in profes-sional develop-ment on thefollowing topics,1994(Indicator 13)
Scorecards #1 (AL-MS) 10/30/97 10:11 AM Page 101

102
20. Increased adult literacy? (1992) — — 52% — 46-77% — 53% —21. Increased the percentage of U.S. citizens
• registered to vote? (1988, 1992) 78% 82% ## 70% 73% !! 58-95% 63-92% 71% 75%• voting? (1988, 1992) 68% 77% !! 61% 66% !! 50-74% 55-77% 62% 68%
22. Increased postsecondary enrollment? (1992, 1994) 59% 59% ❊ ** ** 33-68% 37-71% 53% 55%
CONNECTICUT
† Median is the middle score in a set of ranked scores.— Data not available. See Appendix A.** Indicators are not the same at the national and state level.❊ Sample size does not permit a reliable estimate of change.See pages 72-75 for a Guide to Reading the State Pages.See Appendix C for technical notes and sources.
GOAL 5
GOAL 6
Connecticut
baseline update progress?
Range of State Scores
baseline update
MedianScores†
baseline update
U.S.
baseline update progress?
17. Increased the percentage of public school 8th graders whose mathematics teachers • have students work in small groups or with a partner? (1996) 63% — 66% — 45-92% — 67% —• address Algebra and functions? (1996) 64% — 57% — 45-82% — 58% —• address reasoning and analytical ability? (1996) 59% — 52% — 39-64% — 48% —
18. Increased the percentage of public school 8th graders who have computers available in their mathematics classroom? (1996) 20% — 30% — 7-54% — 30% —
19. Increased mathematics and science degrees awarded to• all students? (1991, 1995) 43% 50% !! 39% 42% !! 25-49% 15-53% 39% 42%• minorities (Black, Hispanic, American Indian/Alaskan Native)? (1991, 1995) 47% 52% !! 39% 40% !! 22-64% 22-57% 39% 39%• female students? (1991, 1995) 37% 47% !! 35% 37% !! 23-46% 13-47% 33% 36%
Mathematics and Science (continued)
Adult Literacy and Lifelong Learning
Addressreasoning & analytical
ability
AddressAlgebra and functions
Work insmall groups
or with apartner
0% 20% 40% 60% 80% 100%
63%
64%
59%
1
2
2
MathematicsInstructionPercentage ofpublic school 8thgraders whosemathematicsteachers do thefollowing, 1996(Indicator 17)
1 At least once a week.2 On a 4-point scale from “none” to “a lot,” defined as a response to the top point.
KEY
KEY
!! Significant progress
@@ Significant decline
## Change is not significant
Scorecards #1 (AL-MS) 10/30/97 10:11 AM Page 102

103
† Median is the middle score in a set of ranked scores.** Indicators are not the same at the national and state level.— Data not available. See Appendix A.• Baseline years and most recent update years may differ by state
for this indicator. See Appendix C for more information.See pages 72-75 for a Guide to Reading the State Pages.See Appendix C for technical notes and sources.
23. Reduced marijuana use? (1991, 1995) • — — ** ** 4-18% 7-32% 10% 23%24. Reduced alcohol use (more than 5 drinks in a row)? (1991, 1995) • — — ** ** 17-43% 13-43% 30% 31%25. Reduced availability of drugs on school property? (1993, 1995) • — — ** ** 11-31% 20-46% 22% 30%26. Reduced students threatened or injured with a weapon while on school property? (1993, 1995) • — — ** ** 6-15% 4-11% 8% 8%27. Reduced physical fights on school property? (1993, 1995) • — — ** ** 13-39% 12-19% 16% 15%28. Reduced students carrying weapons on school property? (1993, 1995) • — — ** ** 8-18% 7-14% 12% 11%29. Reduced students not feeling safe at school? (1993, 1995) • — — ** ** 3-23% 3-16% 6% 5%30. Reduced teacher victimization? (1994) 14% — 15% — 8-26% — 14% —31. Reduced student disruptions? (1991, 1994) 36% 47% @@ 37% 46% @@ 23-60% 33-65% 37% 47%
32. Decreased schools with minimal parental involvement• Teacher’s perspective? (1991, 1994) 19% 21% ## ** ** 9-44% 13-50% 23% 27%• Principal’s perspective? (1991, 1994) 9% 7% ## ** ** 4-22% 3-27% 13% 13%
33. Increased influence of parent associations? (1991, 1994) 18% 22% ## ** ** 8-37% 12-50% 16% 22%
CONNECTICUT
GOAL 7
GOAL 8
U.S.
baseline update progress?
Connecticut
baseline update progress?
Range of State Scores
baseline update
MedianScores†
baseline update
Safe, Disciplined and Alcohol- and Drug-free Schools
Parental Participation
0% 20% 40% 60% 80% 100%
Establishingcurriculum
One ormore areas
Hiring newfull-timeteachers
Settingdiscipline
policy
1991 1994
18%
22%
5%
8%
4%
6%
10%
17%ns
ns
ns
ns
Parent-SchoolPartnershipsPercentage of public school principals whoreported that theparent associationhas influence1 onthe following areas(Indicator 33)
1 On a 6-point scale from no influence to a great deal of influence, defined asa response to the top two points.
nsInterpret with caution. Change was not statistically significant.
KEY
KEY
!! Significant progress
@@ Significant decline
## Change is not significant
Scorecards #1 (AL-MS) 10/30/97 10:11 AM Page 103

104
8. Increased reading achievement in Grade 4? (1992, 1994) • 24% 23% ## 29% 30% ## 8-38% 8-41% 26% 27%9. Increased mathematics achievement •
• in Grade 4? (1992, 1996) 17% 16% ## 18% 21% !! 5-27% 3-31% 16% 20%• in Grade 8? (1990, 1996) 14% 19% !! 15% 24% !! 1-27% 5-34% 15% 22%
10. Increased science achievement in Grade 8? (1996) 21% — 29% — 5-41% — 27% —
DELAWARE
† Median is the middle score in a set of ranked scores.* Comparable national data are not available.— Data not available. See Appendix A.• Baseline years and most recent update years may differ by state
for this indicator. See Appendix C for more information.See pages 72-75 for a Guide to Reading the State Pages.See Appendix C for technical notes and sources.
GOAL 1
GOAL 2
GOAL 3
Delaware
baseline update progress?
Range of State Scores
baseline update
MedianScores†
baseline update
U.S.
baseline update progress?
1. Reduced percentage of infants born with 1 or more health risks? (1990, 1995) 40% 39% ## 37% 34% !! 25-48% 24-46% 38% 35%2. Increased percentage of 2-year-olds immunized? (1994, 1996) 81% 81% ## 75% 78% !! 61-88% 64-88% 76% 79%3. Reduced number of infants (per 1,000) born with low birthweight? (1990, 1995) 76 84 @@ 70 73 @@ 48-151 53-134 71 754. Increased number of mothers (per 1,000) receiving early prenatal care? (1990, 1995) 795 853 !! 758 813 !! 469-868 560-900 778 828 5. Increased number of children with disabilities in preschool (per 1,000)? (1991, 1996) 51 60 !! * * 16-68 16-92 38 47
6. Increased high school completion rate? (1990, 1995) 86% 89% ## 86% 86% ## 77-96% 79-96% 87% 88%7. Reduced high school dropout rate? (1993, 1994) • 4% 5% @@ * * 2-10% 3-10% 5% 5%
Ready to Learn
School Completion
Student Achievement and Citizenship
19951990
89%100%
80%
60%
40%
20%
0%
86%ns
High School CompletionPercentage of all18- to 24-year-olds1
who have a highschool credential2(Indicator 6)
1 Does not include those still in high school.2 Includes traditional high school diploma and alternative credential.nsInterpret with caution. Change was not statistically significant.
0%
20%
40%
60%
80%
100%
19951990
40% 39%ns
Children’sHealth IndexPercentage ofinfants born with 1or more healthrisks1 (Indicator 1)
1 Includes late (in third trimester) or no prenatal care, low maternal weightgain (less than 21 pounds), mother smoked during pregnancy, or motherdrank alcohol during pregnancy.
nsInterpret with caution. Change was not statistically significant.
KEY
KEY
!! Significant progress
@@ Significant decline
## Change is not significant
Scorecards #1 (AL-MS) 10/30/97 10:11 AM Page 104

105
† Median is the middle score in a set of ranked scores.° See Table 8 for the numbers for each subject area.— Data not available. See Appendix A.∞ This information had not been released when the 1997 Goals Report
went to print.See pages 72-75 for a Guide to Reading the State Pages.See Appendix C for technical notes and sources.
11. Increased the number of Advanced Placement examinations receiving a grade of 3 or higher (per 1,000)? (1991, 1997)° 73 108 !! 55 85 !! 9-177 18-223 41 65
12. Increased the percentage of public secondary school teachers who hold • a degree in main teaching assignment? (1991, 1994) 73% 71% ## 66% 63% @@ 51-85% 50-81% 69% 64%• a teaching certificate in main teaching assignment? (1991, 1994) 99% 94% @@ 94% 93% @@ 91-100% 89-100% 98% 97%
13. Increased the percentage of public school teachers participating in professional development on 1 or more selected topics? (1994) 86% — 85% — 76-98% — 86% —
14. Increased the percentage of public school teachers with training to teach limited English-proficient students? (1994) 9% — 16% — 4-81% — 16% —
15. Increased the percentage of beginning public school teachers participating in a formal teacher induction program? (1991, 1994) 20% 27% !! 22% 27% !! 6-42% 7-48% 20% 23%
16. International comparisons in mathematics and science will be reported in future Goals Panel reports.∞ — — — — — — — —
DELAWARE
GOAL 3
GOAL 4
GOAL 5
U.S.
baseline update progress?
Delaware
baseline update progress?
Range of State Scores
baseline update
MedianScores†
baseline update
Student Achievement and Citizenship (continued)
Teacher Education and Professional Development
Mathematics and Science
ReadingGrade 4
MathematicsGrade 4
1996199219941992
100%
80%
60%
40%
20%
0%
23%24%17% 16%
ns
ns
Student AchievementPercentage of public school students who metthe Goals Panel’sperformancestandard1 in reading and mathematics (Indicators 8 & 9)
1 A complete description of the performance standard can be found inAppendix C.
nsInterpret with caution. Change was not statistically significant.0 2
0
40
60
80
100
0% 20% 40% 60% 80% 100%
Uses ofeducationaltechnology
One ormore topics
Methods ofteaching
subject fieldIn-depthstudy in
subject field
Studentassessment
86%
49%
65%
30%
60%
Professional DevelopmentPercentage ofpublic schoolteachers partici-pating in profes-sional develop-ment on thefollowing topics,1994(Indicator 13)
KEY
KEY
!! Significant progress
@@ Significant decline
## Change is not significant
Scorecards #1 (AL-MS) 10/30/97 10:11 AM Page 105

106
20. Increased adult literacy? (1992) — — 52% — 46-77% — 53% —21. Increased the percentage of U.S. citizens
• registered to vote? (1988, 1992) 65% 73% !! 70% 73% !! 58-95% 63-92% 71% 75%• voting? (1988, 1992) 60% 68% !! 61% 66% !! 50-74% 55-77% 62% 68%
22. Increased postsecondary enrollment? (1992, 1994) 57% 65% ❊ ** ** 33-68% 37-71% 53% 55%
DELAWARE
† Median is the middle score in a set of ranked scores.— Data not available. See Appendix A.** Indicators are not the same at the national and state level.❊ Sample size does not permit a reliable estimate of change.See pages 72-75 for a Guide to Reading the State Pages.See Appendix C for technical notes and sources.
GOAL 5
GOAL 6
Delaware
baseline update progress?
Range of State Scores
baseline update
MedianScores†
baseline update
U.S.
baseline update progress?
17. Increased the percentage of public school 8th graders whose mathematics teachers • have students work in small groups or with a partner? (1996) 70% — 66% — 45-92% — 67% —• address Algebra and functions? (1996) 62% — 57% — 45-82% — 58% —• address reasoning and analytical ability? (1996) 51% — 52% — 39-64% — 48% —
18. Increased the percentage of public school 8th graders who have computers available in their mathematics classroom? (1996) 31% — 30% — 7-54% — 30% —
19. Increased mathematics and science degrees awarded to• all students? (1991, 1995) 46% 45% @@ 39% 42% !! 25-49% 15-53% 39% 42%• minorities (Black, Hispanic, American Indian/Alaskan Native)? (1991, 1995) 38% 35% @@ 39% 40% !! 22-64% 22-57% 39% 39%• female students? (1991, 1995) 40% 40% ## 35% 37% !! 23-46% 13-47% 33% 36%
Mathematics and Science (continued)
Adult Literacy and Lifelong Learning
Addressreasoning & analytical
ability
AddressAlgebra and functions
Work insmall groups
or with apartner
0% 20% 40% 60% 80% 100%
70%
62%
51%
1
2
2
MathematicsInstructionPercentage ofpublic school 8thgraders whosemathematicsteachers do thefollowing, 1996(Indicator 17)
1 At least once a week.2 On a 4-point scale from “none” to “a lot,” defined as a response to the top point.
KEY
KEY
!! Significant progress
@@ Significant decline
## Change is not significant
Scorecards #1 (AL-MS) 10/30/97 10:11 AM Page 106

107
† Median is the middle score in a set of ranked scores.** Indicators are not the same at the national and state level.— Data not available. See Appendix A.• Baseline years and most recent update years may differ by state
for this indicator. See Appendix C for more information.See pages 72-75 for a Guide to Reading the State Pages.See Appendix C for technical notes and sources.
23. Reduced marijuana use? (1991, 1995) • — — ** ** 4-18% 7-32% 10% 23%24. Reduced alcohol use (more than 5 drinks in a row)? (1991, 1995) • — — ** ** 17-43% 13-43% 30% 31%25. Reduced availability of drugs on school property? (1993, 1995) • — — ** ** 11-31% 20-46% 22% 30%26. Reduced students threatened or injured with a weapon while on school property? (1993, 1995) • — — ** ** 6-15% 4-11% 8% 8%27. Reduced physical fights on school property? (1993, 1995) • — — ** ** 13-39% 12-19% 16% 15%28. Reduced students carrying weapons on school property? (1993, 1995) • — — ** ** 8-18% 7-14% 12% 11%29. Reduced students not feeling safe at school? (1993, 1995) • — — ** ** 3-23% 3-16% 6% 5%30. Reduced teacher victimization? (1994) 20% — 15% — 8-26% — 14% —31. Reduced student disruptions? (1991, 1994) 48% 65% @@ 37% 46% @@ 23-60% 33-65% 37% 47%
32. Decreased schools with minimal parental involvement• Teacher’s perspective? (1991, 1994) 29% 27% ## ** ** 9-44% 13-50% 23% 27%• Principal’s perspective? (1991, 1994) 17% 7% ## ** ** 4-22% 3-27% 13% 13%
33. Increased influence of parent associations? (1991, 1994) 21% 28% ## ** ** 8-37% 12-50% 16% 22%
DELAWARE
GOAL 7
GOAL 8
U.S.
baseline update progress?
Delaware
baseline update progress?
Range of State Scores
baseline update
MedianScores†
baseline update
Safe, Disciplined and Alcohol- and Drug-free Schools
Parental Participation
0% 20% 40% 60% 80% 100%
Establishingcurriculum
One ormore areas
Hiring newfull-timeteachers
Settingdiscipline
policy
1991 1994
21%
28%
4%
5%
5%
6%
18%
25%
ns
ns
ns
ns
Parent-SchoolPartnershipsPercentage of public school principals whoreported that theparent associationhas influence1 onthe following areas(Indicator 33)
1 On a 6-point scale from no influence to a great deal of influence, defined asa response to the top two points.
nsInterpret with caution. Change was not statistically significant.
KEY
KEY
!! Significant progress
@@ Significant decline
## Change is not significant
Scorecards #1 (AL-MS) 10/30/97 10:11 AM Page 107
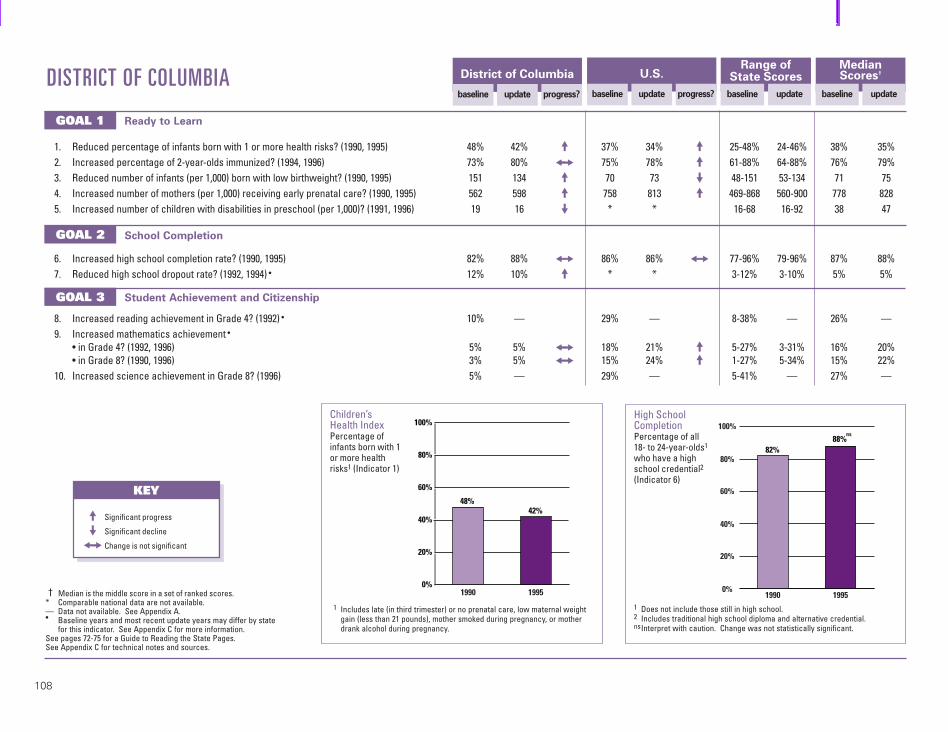
108
8. Increased reading achievement in Grade 4? (1992) • 10% — 29% — 8-38% — 26% —9. Increased mathematics achievement •
• in Grade 4? (1992, 1996) 5% 5% ## 18% 21% !! 5-27% 3-31% 16% 20%• in Grade 8? (1990, 1996) 3% 5% ## 15% 24% !! 1-27% 5-34% 15% 22%
10. Increased science achievement in Grade 8? (1996) 5% — 29% — 5-41% — 27% —
DISTRICT OF COLUMBIA
† Median is the middle score in a set of ranked scores.* Comparable national data are not available.— Data not available. See Appendix A.• Baseline years and most recent update years may differ by state
for this indicator. See Appendix C for more information.See pages 72-75 for a Guide to Reading the State Pages.See Appendix C for technical notes and sources.
GOAL 1
GOAL 2
GOAL 3
District of Columbia
baseline update progress?
Range of State Scores
baseline update
MedianScores†
baseline update
U.S.
baseline update progress?
1. Reduced percentage of infants born with 1 or more health risks? (1990, 1995) 48% 42% !! 37% 34% !! 25-48% 24-46% 38% 35%2. Increased percentage of 2-year-olds immunized? (1994, 1996) 73% 80% ## 75% 78% !! 61-88% 64-88% 76% 79%3. Reduced number of infants (per 1,000) born with low birthweight? (1990, 1995) 151 134 !! 70 73 @@ 48-151 53-134 71 75 4. Increased number of mothers (per 1,000) receiving early prenatal care? (1990, 1995) 562 598 !! 758 813 !! 469-868 560-900 778 828 5. Increased number of children with disabilities in preschool (per 1,000)? (1991, 1996) 19 16 @@ * * 16-68 16-92 38 47
6. Increased high school completion rate? (1990, 1995) 82% 88% ## 86% 86% ## 77-96% 79-96% 87% 88%7. Reduced high school dropout rate? (1992, 1994) • 12% 10% !! * * 3-12% 3-10% 5% 5%
Ready to Learn
School Completion
Student Achievement and Citizenship
19951990
88%100%
80%
60%
40%
20%
0%
82%
ns
High School CompletionPercentage of all18- to 24-year-olds1
who have a highschool credential2(Indicator 6)
1 Does not include those still in high school.2 Includes traditional high school diploma and alternative credential.nsInterpret with caution. Change was not statistically significant.
0%
20%
40%
60%
80%
100%
19951990
48%42%
Children’sHealth IndexPercentage ofinfants born with 1or more healthrisks1 (Indicator 1)
1 Includes late (in third trimester) or no prenatal care, low maternal weightgain (less than 21 pounds), mother smoked during pregnancy, or motherdrank alcohol during pregnancy.
KEY
KEY
!! Significant progress
@@ Significant decline
## Change is not significant
Scorecards #1 (AL-MS) 10/30/97 10:11 AM Page 108
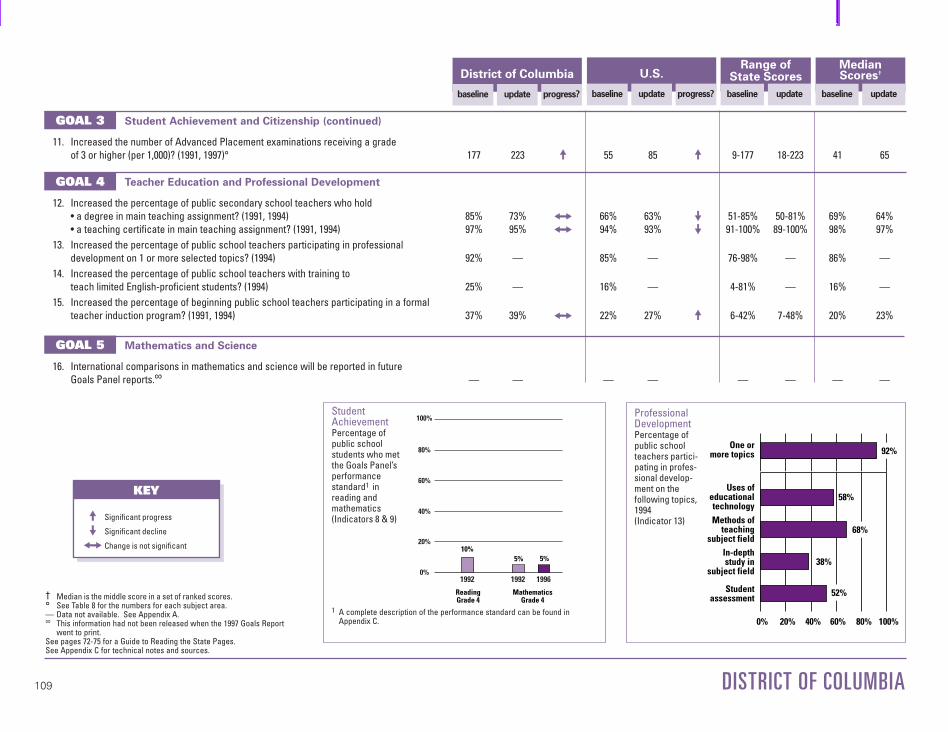
109
† Median is the middle score in a set of ranked scores.° See Table 8 for the numbers for each subject area.— Data not available. See Appendix A.∞ This information had not been released when the 1997 Goals Report
went to print.See pages 72-75 for a Guide to Reading the State Pages.See Appendix C for technical notes and sources.
11. Increased the number of Advanced Placement examinations receiving a grade of 3 or higher (per 1,000)? (1991, 1997)° 177 223 !! 55 85 !! 9-177 18-223 41 65
12. Increased the percentage of public secondary school teachers who hold • a degree in main teaching assignment? (1991, 1994) 85% 73% ## 66% 63% @@ 51-85% 50-81% 69% 64%• a teaching certificate in main teaching assignment? (1991, 1994) 97% 95% ## 94% 93% @@ 91-100% 89-100% 98% 97%
13. Increased the percentage of public school teachers participating in professional development on 1 or more selected topics? (1994) 92% — 85% — 76-98% — 86% —
14. Increased the percentage of public school teachers with training to teach limited English-proficient students? (1994) 25% — 16% — 4-81% — 16% —
15. Increased the percentage of beginning public school teachers participating in a formal teacher induction program? (1991, 1994) 37% 39% ## 22% 27% !! 6-42% 7-48% 20% 23%
16. International comparisons in mathematics and science will be reported in future Goals Panel reports.∞ — — — — — — — —
DISTRICT OF COLUMBIA
GOAL 3
GOAL 4
GOAL 5
U.S.
baseline update progress?
District of Columbia
baseline update progress?
Range of State Scores
baseline update
MedianScores†
baseline update
Student Achievement and Citizenship (continued)
Teacher Education and Professional Development
Mathematics and Science
ReadingGrade 4
MathematicsGrade 4
199619921992
100%
80%
60%
40%
20%
0%
10%5% 5%
Student AchievementPercentage of public school students who metthe Goals Panel’sperformancestandard1 in reading and mathematics (Indicators 8 & 9)
1 A complete description of the performance standard can be found inAppendix C. 0 2
0
40
60
80
100
0% 20% 40% 60% 80% 100%
Uses ofeducationaltechnology
One ormore topics
Methods ofteaching
subject fieldIn-depthstudy in
subject field
Studentassessment
92%
58%
68%
38%
52%
Professional DevelopmentPercentage ofpublic schoolteachers partici-pating in profes-sional develop-ment on thefollowing topics,1994(Indicator 13)KEY
KEY
!! Significant progress
@@ Significant decline
## Change is not significant
Scorecards #1 (AL-MS) 10/30/97 10:11 AM Page 109

110
20. Increased adult literacy? (1992) — — 52% — 46-77% — 53% —21. Increased the percentage of U.S. citizens
• registered to vote? (1988, 1992) 69% 81% !! 70% 73% !! 58-95% 63-92% 71% 75%• voting? (1988, 1992) 56% 72% !! 61% 66% !! 50-74% 55-77% 62% 68%
22. Increased postsecondary enrollment? (1992, 1994) 33% 71% ❊ ** ** 33-68% 37-71% 53% 55%
DISTRICT OF COLUMBIA
† Median is the middle score in a set of ranked scores.— Data not available. See Appendix A.** Indicators are not the same at the national and state level.❊ Sample size does not permit a reliable estimate of change.See pages 72-75 for a Guide to Reading the State Pages.See Appendix C for technical notes and sources.
GOAL 5
GOAL 6
District of Columbia
baseline update progress?
Range of State Scores
baseline update
MedianScores†
baseline update
U.S.
baseline update progress?
17. Increased the percentage of public school 8th graders whose mathematics teachers • have students work in small groups or with a partner? (1996) 92% — 66% — 45-92% — 67% —• address Algebra and functions? (1996) 64% — 57% — 45-82% — 58% —• address reasoning and analytical ability? (1996) 64% — 52% — 39-64% — 48% —
18. Increased the percentage of public school 8th graders who have computers available in their mathematics classroom? (1996) 42% — 30% — 7-54% — 30% —
19. Increased mathematics and science degrees awarded to• all students? (1991, 1995) 49% 53% !! 39% 42% !! 25-49% 15-53% 39% 42%• minorities (Black, Hispanic, American Indian/Alaskan Native)? (1991, 1995) 44% 47% !! 39% 40% !! 22-64% 22-57% 39% 39%• female students? (1991, 1995) 46% 44% @@ 35% 37% !! 23-46% 13-47% 33% 36%
Mathematics and Science (continued)
Adult Literacy and Lifelong Learning
Addressreasoning & analytical
ability
AddressAlgebra and functions
Work insmall groups
or with apartner
0% 20% 40% 60% 80% 100%
92%
64%
64%
1
2
2
MathematicsInstructionPercentage ofpublic school 8thgraders whosemathematicsteachers do thefollowing, 1996(Indicator 17)
1 At least once a week.2 On a 4-point scale from “none” to “a lot,” defined as a response to the top point.
KEY
KEY
!! Significant progress
@@ Significant decline
## Change is not significant
Scorecards #1 (AL-MS) 10/30/97 10:11 AM Page 110

111
† Median is the middle score in a set of ranked scores.** Indicators are not the same at the national and state level.— Data not available. See Appendix A.• Baseline years and most recent update years may differ by state
for this indicator. See Appendix C for more information.See pages 72-75 for a Guide to Reading the State Pages.See Appendix C for technical notes and sources.
23. Reduced marijuana use? (1993) • 18% — ** ** 7-21% — 14% —24. Reduced alcohol use (more than 5 drinks in a row)? (1993) • 16% — ** ** 9-44% — 28% —25. Reduced availability of drugs on school property? (1993) • 16% — ** ** 11-31% — 22% —26. Reduced students threatened or injured with a weapon while on school property? (1993) • 11% — ** ** 6-15% — 8% —27. Reduced physical fights on school property? (1993) • 18% — ** ** 13-39% — 16% —28. Reduced students carrying weapons on school property? (1993) • 16% — ** ** 8-18% — 12% —29. Reduced students not feeling safe at school? (1993) • 11% — ** ** 3-23% — 6% —30. Reduced teacher victimization? (1994) 26% — 15% — 8-26% — 14% —31. Reduced student disruptions? (1991, 1994) 60% 63% ## 37% 46% @@ 23-60% 33-65% 37% 47%
32. Decreased schools with minimal parental involvement• Teacher’s perspective? (1991, 1994) 44% 50% ## ** ** 9-44% 13-50% 23% 27%• Principal’s perspective? (1991, 1994) 14% 24% ## ** ** 4-22% 3-27% 13% 13%
33. Increased influence of parent associations? (1991, 1994) 34% 29% ## ** ** 8-37% 12-50% 16% 22%
DISTRICT OF COLUMBIA
GOAL 7
GOAL 8
U.S.
baseline update progress?
District of Columbia
baseline update progress?
Range of State Scores
baseline update
MedianScores†
baseline update
Safe, Disciplined and Alcohol- and Drug-free Schools
Parental Participation
Usedmarijuana
Had 5 ormore drinks
in a row
Were offered, sold,or given an illegal drug
on school property
1
1
2
0% 20% 40% 60% 80% 100%
1993
18%
16%
16%
Alcohol- andDrug-freeSchoolsPercentage ofpublic high schoolstudents whoreported the fol-lowing(Indicators 23,24, & 25)
1 During the past 30 days.2 During the past 12 months.
0% 20% 40% 60% 80% 100%
Establishingcurriculum
One ormore areas
Hiring newfull-timeteachers
Settingdiscipline
policy
1991 1994
34%
29%
16%
21%
8%
9%
19%
24%
ns
ns
ns
ns
Parent-SchoolPartnershipsPercentage of public school principals whoreported that theparent associationhas influence1 onthe following areas(Indicator 33)
1 On a 6-point scale from no influence to a great deal of influence, defined asa response to the top two points.
nsInterpret with caution. Change was not statistically significant.
KEY
KEY
!! Significant progress
@@ Significant decline
## Change is not significant
Scorecards #1 (AL-MS) 10/30/97 10:11 AM Page 111

112
8. Increased reading achievement in Grade 4? (1992, 1994) • 21% 23% ## 29% 30% ## 8-38% 8-41% 26% 27%9. Increased mathematics achievement •
• in Grade 4? (1992, 1996) 13% 15% ## 18% 21% !! 5-27% 3-31% 16% 20%• in Grade 8? (1990, 1996) 12% 17% !! 15% 24% !! 1-27% 5-34% 15% 22%
10. Increased science achievement in Grade 8? (1996) 21% — 29% — 5-41% — 27% —
FLORIDA
† Median is the middle score in a set of ranked scores.* Comparable national data are not available.— Data not available. See Appendix A.• Baseline years and most recent update years may differ by state
for this indicator. See Appendix C for more information.See pages 72-75 for a Guide to Reading the State Pages.See Appendix C for technical notes and sources.
GOAL 1
GOAL 2
GOAL 3
Florida
baseline update progress?
Range of State Scores
baseline update
MedianScores†
baseline update
U.S.
baseline update progress?
1. Reduced percentage of infants born with 1 or more health risks? (1990, 1995) 37% 31% !! 37% 34% !! 25-48% 24-46% 38% 35%2. Increased percentage of 2-year-olds immunized? (1994, 1996) 76% 78% ## 75% 78% !! 61-88% 64-88% 76% 79%3. Reduced number of infants (per 1,000) born with low birthweight? (1990, 1995) 74 77 @@ 70 73 @@ 48-151 53-134 71 754. Increased number of mothers (per 1,000) receiving early prenatal care? (1990, 1995) 724 826 !! 758 813 !! 469-868 560-900 778 828 5. Increased number of children with disabilities in preschool (per 1,000)? (1991, 1996) 30 45 !! * * 16-68 16-92 38 47
6. Increased high school completion rate? (1990, 1995) 83% 80% @@ 86% 86% ## 77-96% 79-96% 87% 88%7. Reduced high school dropout rate? (1992, 1994) • — — * * 3-12% 3-10% 5% 5%
Ready to Learn
School Completion
Student Achievement and Citizenship
19951990
80%
100%
80%
60%
40%
20%
0%
83%
High School CompletionPercentage of all18- to 24-year-olds1
who have a highschool credential2(Indicator 6)
1 Does not include those still in high school.2 Includes traditional high school diploma and alternative credential.
0%
20%
40%
60%
80%
100%
19951990
37%31%
Children’sHealth IndexPercentage ofinfants born with 1or more healthrisks1 (Indicator 1)
1 Includes late (in third trimester) or no prenatal care, low maternal weightgain (less than 21 pounds), mother smoked during pregnancy, or motherdrank alcohol during pregnancy.
KEY
KEY
!! Significant progress
@@ Significant decline
## Change is not significant
Scorecards #1 (AL-MS) 10/30/97 10:11 AM Page 112

113
† Median is the middle score in a set of ranked scores.° See Table 8 for the numbers for each subject area.— Data not available. See Appendix A.∞ This information had not been released when the 1997 Goals Report
went to print.See pages 72-75 for a Guide to Reading the State Pages.See Appendix C for technical notes and sources.
11. Increased the number of Advanced Placement examinations receiving a grade of 3 or higher (per 1,000)? (1991, 1997)° 81 96 !! 55 85 !! 9-177 18-223 41 65
12. Increased the percentage of public secondary school teachers who hold • a degree in main teaching assignment? (1991, 1994) 66% 62% ## 66% 63% @@ 51-85% 50-81% 69% 64%• a teaching certificate in main teaching assignment? (1991, 1994) 97% 94% ## 94% 93% @@ 91-100% 89-100% 98% 97%
13. Increased the percentage of public school teachers participating in professional development on 1 or more selected topics? (1994) 88% — 85% — 76-98% — 86% —
14. Increased the percentage of public school teachers with training to teach limited English-proficient students? (1994) 81% — 16% — 4-81% — 16% —
15. Increased the percentage of beginning public school teachers participating in a formal teacher induction program? (1991, 1994) 42% 48% !! 22% 27% !! 6-42% 7-48% 20% 23%
16. International comparisons in mathematics and science will be reported in future Goals Panel reports.∞ — — — — — — — —
FLORIDA
GOAL 3
GOAL 4
GOAL 5
U.S.
baseline update progress?
Florida
baseline update progress?
Range of State Scores
baseline update
MedianScores†
baseline update
Student Achievement and Citizenship (continued)
Teacher Education and Professional Development
Mathematics and Science
ReadingGrade 4
MathematicsGrade 4
1996199219941992
100%
80%
60%
40%
20%
0%
23%21%
13% 15%
ns
ns
Student AchievementPercentage of public school students who metthe Goals Panel’sperformancestandard1 in reading and mathematics (Indicators 8 & 9)
1 A complete description of the performance standard can be found inAppendix C.
nsInterpret with caution. Change was not statistically significant.0 2
0
40
60
80
100
0% 20% 40% 60% 80% 100%
Uses ofeducationaltechnology
One ormore topics
Methods ofteaching
subject fieldIn-depthstudy in
subject field
Studentassessment
88%
64%
68%
31%
46%
Professional DevelopmentPercentage ofpublic schoolteachers partici-pating in profes-sional develop-ment on thefollowing topics,1994(Indicator 13)KEY
KEY
!! Significant progress
@@ Significant decline
## Change is not significant
Scorecards #1 (AL-MS) 10/30/97 10:11 AM Page 113

114
20. Increased adult literacy? (1992) 51% — 52% — 46-77% — 53% —21. Increased the percentage of U.S. citizens
• registered to vote? (1988, 1992) 69% 69% ## 70% 73% !! 58-95% 63-92% 71% 75%• voting? (1988, 1992) 59% 62% ## 61% 66% !! 50-74% 55-77% 62% 68%
22. Increased postsecondary enrollment? (1992, 1994) 45% 49% !! ** ** 33-68% 37-71% 53% 55%
FLORIDA
† Median is the middle score in a set of ranked scores.— Data not available. See Appendix A.** Indicators are not the same at the national and state level.See pages 72-75 for a Guide to Reading the State Pages.See Appendix C for technical notes and sources.
GOAL 5
GOAL 6
Florida
baseline update progress?
Range of State Scores
baseline update
MedianScores†
baseline update
U.S.
baseline update progress?
17. Increased the percentage of public school 8th graders whose mathematics teachers • have students work in small groups or with a partner? (1996) 67% — 66% — 45-92% — 67% —• address Algebra and functions? (1996) 59% — 57% — 45-82% — 58% —• address reasoning and analytical ability? (1996) 53% — 52% — 39-64% — 48% —
18. Increased the percentage of public school 8th graders who have computers available in their mathematics classroom? (1996) 45% — 30% — 7-54% — 30% —
19. Increased mathematics and science degrees awarded to• all students? (1991, 1995) 34% 35% !! 39% 42% !! 25-49% 15-53% 39% 42%• minorities (Black, Hispanic, American Indian/Alaskan Native)? (1991, 1995) 36% 35% @@ 39% 40% !! 22-64% 22-57% 39% 39%• female students? (1991, 1995) 29% 32% !! 35% 37% !! 23-46% 13-47% 33% 36%
Mathematics and Science (continued)
Adult Literacy and Lifelong Learning
Addressreasoning & analytical
ability
AddressAlgebra and functions
Work insmall groups
or with apartner
0% 20% 40% 60% 80% 100%
67%
59%
53%
1
2
2
MathematicsInstructionPercentage ofpublic school 8thgraders whosemathematicsteachers do thefollowing, 1996(Indicator 17)
51%49%
3 highest levels2 lowest levels
Adult LiteracyPercentage ofadults who scoredat 3 highest levelsin Prose Literacy(Indicator 20)
KEY
KEY
!! Significant progress
@@ Significant decline
## Change is not significant
1 At least once a week.2 On a 4-point scale from “none” to “a lot,” defined as a response to the top point.
Scorecards #1 (AL-MS) 10/30/97 10:11 AM Page 114

115
† Median is the middle score in a set of ranked scores.** Indicators are not the same at the national and state level.— Data not available. See Appendix A.• Baseline years and most recent update years may differ by state
for this indicator. See Appendix C for more information.See pages 72-75 for a Guide to Reading the State Pages.See Appendix C for technical notes and sources.
23. Reduced marijuana use? (1991, 1995) • — — ** ** 4-18% 7-32% 10% 23%24. Reduced alcohol use (more than 5 drinks in a row)? (1991, 1995) • — — ** ** 17-43% 13-43% 30% 31%25. Reduced availability of drugs on school property? (1993, 1995) • — — ** ** 11-31% 20-46% 22% 30%26. Reduced students threatened or injured with a weapon while on school property? (1993, 1995) • — — ** ** 6-15% 4-11% 8% 8%27. Reduced physical fights on school property? (1993, 1995) • — — ** ** 13-39% 12-19% 16% 15%28. Reduced students carrying weapons on school property? (1993, 1995) • — — ** ** 8-18% 7-14% 12% 11%29. Reduced students not feeling safe at school? (1993, 1995) • — — ** ** 3-23% 3-16% 6% 5%30. Reduced teacher victimization? (1994) 21% — 15% — 8-26% — 14% —31. Reduced student disruptions? (1991, 1994) 46% 58% @@ 37% 46% @@ 23-60% 33-65% 37% 47%
32. Decreased schools with minimal parental involvement• Teacher’s perspective? (1991, 1994) 33% 33% ## ** ** 9-44% 13-50% 23% 27%• Principal’s perspective? (1991, 1994) 18% 22% ## ** ** 4-22% 3-27% 13% 13%
33. Increased influence of parent associations? (1991, 1994) 26% 34% ## ** ** 8-37% 12-50% 16% 22%
FLORIDA
GOAL 7
GOAL 8
U.S.
baseline update progress?
Florida
baseline update progress?
Range of State Scores
baseline update
MedianScores†
baseline update
Safe, Disciplined and Alcohol- and Drug-free Schools
Parental Participation
0% 20% 40% 60% 80% 100%
Establishingcurriculum
One ormore areas
Hiring newfull-timeteachers
Settingdiscipline
policy
1991 1994
26%
34%
13%
17%
3%
3%
21%
24%
ns
ns
ns
Parent-SchoolPartnershipsPercentage of public school principals whoreported that theparent associationhas influence1 onthe following areas(Indicator 33)
1 On a 6-point scale from no influence to a great deal of influence, defined asa response to the top two points.
nsInterpret with caution. Change was not statistically significant.
KEY
KEY
!! Significant progress
@@ Significant decline
## Change is not significant
Scorecards #1 (AL-MS) 10/30/97 10:11 AM Page 115
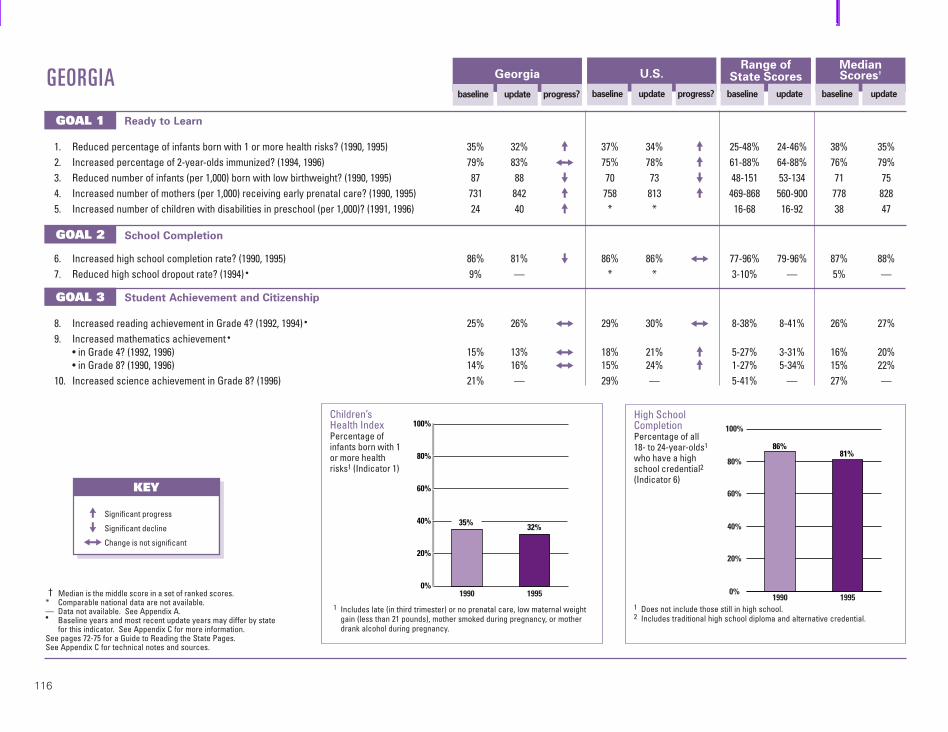
116
8. Increased reading achievement in Grade 4? (1992, 1994) • 25% 26% ## 29% 30% ## 8-38% 8-41% 26% 27%9. Increased mathematics achievement •
• in Grade 4? (1992, 1996) 15% 13% ## 18% 21% !! 5-27% 3-31% 16% 20%• in Grade 8? (1990, 1996) 14% 16% ## 15% 24% !! 1-27% 5-34% 15% 22%
10. Increased science achievement in Grade 8? (1996) 21% — 29% — 5-41% — 27% —
GEORGIA
† Median is the middle score in a set of ranked scores.* Comparable national data are not available.— Data not available. See Appendix A.• Baseline years and most recent update years may differ by state
for this indicator. See Appendix C for more information.See pages 72-75 for a Guide to Reading the State Pages.See Appendix C for technical notes and sources.
GOAL 1
GOAL 2
GOAL 3
Georgia
baseline update progress?
Range of State Scores
baseline update
MedianScores†
baseline update
U.S.
baseline update progress?
1. Reduced percentage of infants born with 1 or more health risks? (1990, 1995) 35% 32% !! 37% 34% !! 25-48% 24-46% 38% 35%2. Increased percentage of 2-year-olds immunized? (1994, 1996) 79% 83% ## 75% 78% !! 61-88% 64-88% 76% 79%3. Reduced number of infants (per 1,000) born with low birthweight? (1990, 1995) 87 88 @@ 70 73 @@ 48-151 53-134 71 75 4. Increased number of mothers (per 1,000) receiving early prenatal care? (1990, 1995) 731 842 !! 758 813 !! 469-868 560-900 778 828 5. Increased number of children with disabilities in preschool (per 1,000)? (1991, 1996) 24 40 !! * * 16-68 16-92 38 47
6. Increased high school completion rate? (1990, 1995) 86% 81% @@ 86% 86% ## 77-96% 79-96% 87% 88%7. Reduced high school dropout rate? (1994) • 9% — * * 3-10% — 5% —
Ready to Learn
School Completion
Student Achievement and Citizenship
19951990
81%
100%
80%
60%
40%
20%
0%
86%
High School CompletionPercentage of all18- to 24-year-olds1
who have a highschool credential2(Indicator 6)
1 Does not include those still in high school.2 Includes traditional high school diploma and alternative credential.
0%
20%
40%
60%
80%
100%
19951990
35% 32%
Children’sHealth IndexPercentage ofinfants born with 1or more healthrisks1 (Indicator 1)
1 Includes late (in third trimester) or no prenatal care, low maternal weightgain (less than 21 pounds), mother smoked during pregnancy, or motherdrank alcohol during pregnancy.
KEY
KEY
!! Significant progress
@@ Significant decline
## Change is not significant
Scorecards #1 (AL-MS) 10/30/97 10:12 AM Page 116

117
† Median is the middle score in a set of ranked scores.° See Table 8 for the numbers for each subject area.— Data not available. See Appendix A.∞ This information had not been released when the 1997 Goals Report
went to print.See pages 72-75 for a Guide to Reading the State Pages.See Appendix C for technical notes and sources.
11. Increased the number of Advanced Placement examinations receiving a grade of 3 or higher (per 1,000)? (1991, 1997)° 49 76 !! 55 85 !! 9-177 18-223 41 65
12. Increased the percentage of public secondary school teachers who hold • a degree in main teaching assignment? (1991, 1994) 67% 68% ## 66% 63% @@ 51-85% 50-81% 69% 64%• a teaching certificate in main teaching assignment? (1991, 1994) 98% 94% @@ 94% 93% @@ 91-100% 89-100% 98% 97%
13. Increased the percentage of public school teachers participating in professional development on 1 or more selected topics? (1994) 82% — 85% — 76-98% — 86% —
14. Increased the percentage of public school teachers with training to teach limited English-proficient students? (1994) 17% — 16% — 4-81% — 16% —
15. Increased the percentage of beginning public school teachers participating in a formal teacher induction program? (1991, 1994) 27% 31% ## 22% 27% !! 6-42% 7-48% 20% 23%
16. International comparisons in mathematics and science will be reported in future Goals Panel reports.∞ — — — — — — — —
GEORGIA
GOAL 3
GOAL 4
GOAL 5
U.S.
baseline update progress?
Georgia
baseline update progress?
Range of State Scores
baseline update
MedianScores†
baseline update
Student Achievement and Citizenship (continued)
Teacher Education and Professional Development
Mathematics and Science
ReadingGrade 4
MathematicsGrade 4
1996199219941992
100%
80%
60%
40%
20%
0%
26%25%
15% 13%
ns
ns
Student AchievementPercentage of public school students who metthe Goals Panel’sperformancestandard1 in reading and mathematics (Indicators 8 & 9)
1 A complete description of the performance standard can be found inAppendix C.
nsInterpret with caution. Change was not statistically significant.
0 20
40
60
80
100
0% 20% 40% 60% 80% 100%
Uses ofeducationaltechnology
One ormore topics
Methods ofteaching
subject fieldIn-depthstudy in
subject field
Studentassessment
82%
46%
60%
25%
37%
Professional DevelopmentPercentage ofpublic schoolteachers partici-pating in profes-sional develop-ment on thefollowing topics,1994(Indicator 13)KEY
KEY
!! Significant progress
@@ Significant decline
## Change is not significant
Scorecards #1 (AL-MS) 10/30/97 10:12 AM Page 117

118
20. Increased adult literacy? (1992) — — 52% — 46-77% — 53% —21. Increased the percentage of U.S. citizens
• registered to vote? (1988, 1992) 62% 63% ## 70% 73% !! 58-95% 63-92% 71% 75%• voting? (1988, 1992) 50% 55% !! 61% 66% !! 50-74% 55-77% 62% 68%
22. Increased postsecondary enrollment? (1992, 1994) 54% 59% !! ** ** 33-68% 37-71% 53% 55%
GEORGIA
† Median is the middle score in a set of ranked scores.— Data not available. See Appendix A.** Indicators are not the same at the national and state level.See pages 72-75 for a Guide to Reading the State Pages.See Appendix C for technical notes and sources.
GOAL 5
GOAL 6
Georgia
baseline update progress?
Range of State Scores
baseline update
MedianScores†
baseline update
U.S.
baseline update progress?
17. Increased the percentage of public school 8th graders whose mathematics teachers • have students work in small groups or with a partner? (1996) 66% — 66% — 45-92% — 67% —• address Algebra and functions? (1996) 61% — 57% — 45-82% — 58% —• address reasoning and analytical ability? (1996) 56% — 52% — 39-64% — 48% —
18. Increased the percentage of public school 8th graders who have computers available in their mathematics classroom? (1996) 41% — 30% — 7-54% — 30% —
19. Increased mathematics and science degrees awarded to• all students? (1991, 1995) 38% 40% !! 39% 42% !! 25-49% 15-53% 39% 42%• minorities (Black, Hispanic, American Indian/Alaskan Native)? (1991, 1995) 44% 43% @@ 39% 40% !! 22-64% 22-57% 39% 39%• female students? (1991, 1995) 33% 35% !! 35% 37% !! 23-46% 13-47% 33% 36%
Mathematics and Science (continued)
Adult Literacy and Lifelong Learning
Addressreasoning & analytical
ability
AddressAlgebra and functions
Work insmall groups
or with apartner
0% 20% 40% 60% 80% 100%
66%
61%
56%
1
2
2
MathematicsInstructionPercentage ofpublic school 8thgraders whosemathematicsteachers do thefollowing, 1996(Indicator 17)
KEY
KEY
!! Significant progress
@@ Significant decline
## Change is not significant
1 At least once a week.2 On a 4-point scale from “none” to “a lot,” defined as a response to the top point.
Scorecards #1 (AL-MS) 10/30/97 10:12 AM Page 118

119
† Median is the middle score in a set of ranked scores.** Indicators are not the same at the national and state level.— Data not available. See Appendix A.• Baseline years and most recent update years may differ by state
for this indicator. See Appendix C for more information.See pages 72-75 for a Guide to Reading the State Pages.See Appendix C for technical notes and sources.
23. Reduced marijuana use? (1991, 1993) • 11% 14% ## ** ** 4-18% 7-21% 10% 14%24. Reduced alcohol use (more than 5 drinks in a row)? (1991, 1993) • 27% 25% ## ** ** 17-43% 9-44% 30% 28%25. Reduced availability of drugs on school property? (1993) • 21% — ** ** 11-31% — 22% —26. Reduced students threatened or injured with a weapon on school property? (1993) • 9% — ** ** 6-15% — 8% —27. Reduced physical fights on school property? (1993) • 16% — ** ** 13-39% — 16% —28. Reduced students carrying weapons on school property? (1993) • 15% — ** ** 8-18% — 12% —29. Reduced students not feeling safe at school? (1993) • 7% — ** ** 3-23% — 6% —30. Reduced teacher victimization? (1994) 15% — 15% — 8-26% — 14% —31. Reduced student disruptions? (1991, 1994) 37% 46% @@ 37% 46% @@ 23-60% 33-65% 37% 47%
32. Decreased schools with minimal parental involvement• Teacher’s perspective? (1991, 1994) 30% 33% ## ** ** 9-44% 13-50% 23% 27%• Principal’s perspective? (1991, 1994) 16% 16% ## ** ** 4-22% 3-27% 13% 13%
33. Increased influence of parent associations? (1991, 1994) 11% 14% ## ** ** 8-37% 12-50% 16% 22%
GEORGIA
GOAL 7
GOAL 8
U.S.
baseline update progress?
Georgia
baseline update progress?
Range of State Scores
baseline update
MedianScores†
baseline update
Safe, Disciplined and Alcohol- and Drug-free Schools
Parental Participation
Usedmarijuana
Had 5 ormore drinks
in a row
Were offered, sold,or given an illegal drug
on school property
1
1
2
0% 20% 40% 60% 80% 100%
1991 1993
14%
11%
27%
25%
21%
ns
ns
Alcohol- andDrug-freeSchoolsPercentage ofpublic high schoolstudents whoreported the fol-lowing(Indicators 23,24, & 25)
1 During the past 30 days.2 During the past 12 months.nsInterpret with caution. Change was not statistically significant.
0% 20% 40% 60% 80% 100%
Establishingcurriculum
One ormore areas
Hiring newfull-timeteachers
Settingdiscipline
policy
1991 1994
11%
14%
5%
7%
1%
6%
11%
ns
ns
ns
Parent-SchoolPartnershipsPercentage of public school principals whoreported that theparent associationhas influence1 onthe following areas(Indicator 33)
1 On a 6-point scale from no influence to a great deal of influence, defined asa response to the top two points.
nsInterpret with caution. Change was not statistically significant.
KEY
KEY
!! Significant progress
@@ Significant decline
## Change is not significant
Scorecards #1 (AL-MS) 10/30/97 10:12 AM Page 119

120
8. Increased reading achievement in Grade 4? (1992, 1994) • 17% 19% ## 29% 30% ## 8-38% 8-41% 26% 27%9. Increased mathematics achievement •
• in Grade 4? (1992, 1996) 15% 16% ## 18% 21% !! 5-27% 3-31% 16% 20%• in Grade 8? (1990, 1996) 12% 16% !! 15% 24% !! 1-27% 5-34% 15% 22%
10. Increased science achievement in Grade 8? (1996) 15% — 29% — 5-41% — 27% —
HAWAII
† Median is the middle score in a set of ranked scores.* Comparable national data are not available.— Data not available. See Appendix A.• Baseline years and most recent update years may differ by state
for this indicator. See Appendix C for more information.See pages 72-75 for a Guide to Reading the State Pages.See Appendix C for technical notes and sources.
GOAL 1
GOAL 2
GOAL 3
Hawaii
baseline update progress?
Range of State Scores
baseline update
MedianScores†
baseline update
U.S.
baseline update progress?
1. Reduced percentage of infants born with 1 or more health risks? (1990, 1995) 30% 24% !! 37% 34% !! 25-48% 24-46% 38% 35%2. Increased percentage of 2-year-olds immunized? (1994, 1996) 86% 78% ## 75% 78% !! 61-88% 64-88% 76% 79%3. Reduced number of infants (per 1,000) born with low birthweight? (1990, 1995) 71 70 !! 70 73 @@ 48-151 53-134 71 75 4. Increased number of mothers (per 1,000) receiving early prenatal care? (1990, 1995) 735 837 !! 758 813 !! 469-868 560-900 778 828 5. Increased number of children with disabilities in preschool (per 1,000)? (1991, 1996) 16 23 !! * * 16-68 16-92 38 47
6. Increased high school completion rate? (1990, 1995) 93% 93% ## 86% 86% ## 77-96% 79-96% 87% 88%7. Reduced high school dropout rate? (1994) • 5% — * * 3-10% — 5% —
Ready to Learn
School Completion
Student Achievement and Citizenship
19951990
93%100%
80%
60%
40%
20%
0%
93%
High School CompletionPercentage of all18- to 24-year-olds1
who have a highschool credential2(Indicator 6)
1 Does not include those still in high school.2 Includes traditional high school diploma and alternative credential.
0%
20%
40%
60%
80%
100%
19951990
30%24%
Children’sHealth IndexPercentage ofinfants born with 1or more healthrisks1 (Indicator 1)
1 Includes late (in third trimester) or no prenatal care, low maternal weightgain (less than 21 pounds), mother smoked during pregnancy, or motherdrank alcohol during pregnancy.
KEY
KEY
!! Significant progress
@@ Significant decline
## Change is not significant
Scorecards #1 (AL-MS) 10/30/97 10:12 AM Page 120

121
† Median is the middle score in a set of ranked scores.° See Table 8 for the numbers for each subject area.— Data not available. See Appendix A.∞ This information had not been released when the 1997 Goals Report
went to print.See pages 72-75 for a Guide to Reading the State Pages.See Appendix C for technical notes and sources.
11. Increased the number of Advanced Placement examinations receiving a grade of 3 or higher (per 1,000)? (1991, 1997)° 87 90 !! 55 85 !! 9-177 18-223 41 65
12. Increased the percentage of public secondary school teachers who hold • a degree in main teaching assignment? (1991, 1994) 62% 67% ## 66% 63% @@ 51-85% 50-81% 69% 64%• a teaching certificate in main teaching assignment? (1991, 1994) 93% 89% ## 94% 93% @@ 91-100% 89-100% 98% 97%
13. Increased the percentage of public school teachers participating in professional development on 1 or more selected topics? (1994) 88% — 85% — 76-98% — 86% —
14. Increased the percentage of public school teachers with training to teach limited English-proficient students? (1994) 41% — 16% — 4-81% — 16% —
15. Increased the percentage of beginning public school teachers participating in a formal teacher induction program? (1991, 1994) 34% 33% ## 22% 27% !! 6-42% 7-48% 20% 23%
16. International comparisons in mathematics and science will be reported in future Goals Panel reports.∞ — — — — — — — —
HAWAII
GOAL 3
GOAL 4
GOAL 5
U.S.
baseline update progress?
Hawaii
baseline update progress?
Range of State Scores
baseline update
MedianScores†
baseline update
Student Achievement and Citizenship (continued)
Teacher Education and Professional Development
Mathematics and Science
ReadingGrade 4
MathematicsGrade 4
1996199219941992
100%
80%
60%
40%
20%
0%
19%17% 15% 16%ns
ns
Student AchievementPercentage of public school students who metthe Goals Panel’sperformancestandard1 in reading and mathematics (Indicators 8 & 9)
1 A complete description of the performance standard can be found inAppendix C.
nsInterpret with caution. Change was not statistically significant.0 2
0
40
60
80
100
0% 20% 40% 60% 80% 100%
Uses ofeducationaltechnology
One ormore topics
Methods ofteaching
subject fieldIn-depthstudy in
subject field
Studentassessment
88%
57%
68%
39%
54%
Professional DevelopmentPercentage ofpublic schoolteachers partici-pating in profes-sional develop-ment on thefollowing topics,1994(Indicator 13)KEY
KEY
!! Significant progress
@@ Significant decline
## Change is not significant
Scorecards #1 (AL-MS) 10/30/97 10:12 AM Page 121

122
20. Increased adult literacy? (1992) — — 52% — 46-77% — 53% —21. Increased the percentage of U.S. citizens
• registered to vote? (1988, 1992) 66% 65% ## 70% 73% !! 58-95% 63-92% 71% 75%• voting? (1988, 1992) 59% 59% ## 61% 66% !! 50-74% 55-77% 62% 68%
22. Increased postsecondary enrollment? (1992, 1994) 54% 62% ❊ ** ** 33-68% 37-71% 53% 55%
HAWAII
† Median is the middle score in a set of ranked scores.— Data not available. See Appendix A.** Indicators are not the same at the national and state level.❊ Sample size does not permit a reliable estimate of change.See pages 72-75 for a Guide to Reading the State Pages.See Appendix C for technical notes and sources.
GOAL 5
GOAL 6
Hawaii
baseline update progress?
Range of State Scores
baseline update
MedianScores†
baseline update
U.S.
baseline update progress?
17. Increased the percentage of public school 8th graders whose mathematics teachers • have students work in small groups or with a partner? (1996) 70% — 66% — 45-92% — 67% —• address Algebra and functions? (1996) 45% — 57% — 45-82% — 58% —• address reasoning and analytical ability? (1996) 43% — 52% — 39-64% — 48% —
18. Increased the percentage of public school 8th graders who have computers available in their mathematics classroom? (1996) 36% — 30% — 7-54% — 30% —
19. Increased mathematics and science degrees awarded to• all students? (1991, 1995) 40% 40% ## 39% 42% !! 25-49% 15-53% 39% 42%• minorities (Black, Hispanic, American Indian/Alaskan Native)? (1991, 1995) 47% 44% @@ 39% 40% !! 22-64% 22-57% 39% 39%• female students? (1991, 1995) 37% 29% @@ 35% 37% !! 23-46% 13-47% 33% 36%
Mathematics and Science (continued)
Adult Literacy and Lifelong Learning
Addressreasoning & analytical
ability
AddressAlgebra and functions
Work insmall groups
or with apartner
0% 20% 40% 60% 80% 100%
70%
45%
43%
1
2
2
MathematicsInstructionPercentage ofpublic school 8thgraders whosemathematicsteachers do thefollowing, 1996(Indicator 17)
KEY
KEY
!! Significant progress
@@ Significant decline
## Change is not significant
1 At least once a week.2 On a 4-point scale from “none” to “a lot,” defined as a response to the top point.
Scorecards #1 (AL-MS) 10/30/97 10:12 AM Page 122

123
† Median is the middle score in a set of ranked scores.** Indicators are not the same at the national and state level.— Data not available. See Appendix A.• Baseline years and most recent update years may differ by state
for this indicator. See Appendix C for more information.See pages 72-75 for a Guide to Reading the State Pages.See Appendix C for technical notes and sources.
23. Reduced marijuana use? (1993, 1995) • 17% 24% @@ ** ** 7-21% 7-32% 14% 23%24. Reduced alcohol use (more than 5 drinks in a row)? (1993, 1995) • 23% 24% ## ** ** 9-44% 13-43% 28% 31%25. Reduced availability of drugs on school property? (1993, 1995) • 26% 36% @@ ** ** 11-31% 20-46% 22% 30%26. Reduced students threatened or injured with a weapon while on school property? (1993, 1995) • 7% 5% ## ** ** 6-15% 4-11% 8% 8%27. Reduced physical fights on school property? (1993, 1995) • 14% 13% ## ** ** 13-39% 12-19% 16% 15%28. Reduced students carrying weapons on school property? (1993, 1995) • 8% 8% ## ** ** 8-18% 7-14% 12% 11%29. Reduced students not feeling safe at school? (1993, 1995) • 7% 5% ## ** ** 3-23% 3-16% 6% 5%30. Reduced teacher victimization? (1994) 11% — 15% — 8-26% — 14% —31. Reduced student disruptions? (1991, 1994) 49% 62% @@ 37% 46% @@ 23-60% 33-65% 37% 47%
32. Decreased schools with minimal parental involvement• Teacher’s perspective? (1991, 1994) 32% 31% ## ** ** 9-44% 13-50% 23% 27%• Principal’s perspective? (1991, 1994) 18% 13% ## ** ** 4-22% 3-27% 13% 13%
33. Increased influence of parent associations? (1991, 1994) 37% 33% ## ** ** 8-37% 12-50% 16% 22%
HAWAII
GOAL 7
GOAL 8
U.S.
baseline update progress?
Hawaii
baseline update progress?
Range of State Scores
baseline update
MedianScores†
baseline update
Safe, Disciplined and Alcohol- and Drug-free Schools
Parental Participation
Usedmarijuana
Had 5 ormore drinks
in a row
Were offered, sold,or given an illegal drug
on school property
1
1
2
0% 20% 40% 60% 80% 100%
1993 1995
24%
17%
23%
24%
26%
36%
ns
Alcohol- andDrug-freeSchoolsPercentage ofpublic high schoolstudents whoreported the fol-lowing(Indicators 23,24, & 25)
1 During the past 30 days.2 During the past 12 months.nsInterpret with caution. Change was not statistically significant.
0% 20% 40% 60% 80% 100%
Establishingcurriculum
One ormore areas
Hiring newfull-timeteachers
Settingdiscipline
policy
1991 1994
37%
33%
17%
10%
6%
10%
31%
29%
ns
ns
ns
ns
Parent-SchoolPartnershipsPercentage of public school principals whoreported that theparent associationhas influence1 onthe following areas(Indicator 33)
1 On a 6-point scale from no influence to a great deal of influence, defined asa response to the top two points.
nsInterpret with caution. Change was not statistically significant.
KEY
KEY
!! Significant progress
@@ Significant decline
## Change is not significant
Scorecards #1 (AL-MS) 10/30/97 10:12 AM Page 123

124
8. Increased reading achievement in Grade 4? (1992) • 28% — 29% — 8-38% — 26% —9. Increased mathematics achievement •
• in Grade 4? (1992) 16% — 18% — 5-27% — 16% —• in Grade 8? (1990, 1992) 18% 22% ## 15% 21% !! 1-27% 1-31% 15% 18%
10. Increased science achievement in Grade 8? (1996) — — 29% — 5-41% — 27% —
IDAHO
† Median is the middle score in a set of ranked scores.* Comparable national data are not available.— Data not available. See Appendix A.• Baseline years and most recent update years may differ by state
for this indicator. See Appendix C for more information.See pages 72-75 for a Guide to Reading the State Pages.See Appendix C for technical notes and sources.
GOAL 1
GOAL 2
GOAL 3
Idaho
baseline update progress?
Range of State Scores
baseline update
MedianScores†
baseline update
U.S.
baseline update progress?
1. Reduced percentage of infants born with 1 or more health risks? (1990, 1995) 35% 31% !! 37% 34% !! 25-48% 24-46% 38% 35%2. Increased percentage of 2-year-olds immunized? (1994, 1996) 64% 68% ## 75% 78% !! 61-88% 64-88% 76% 79% 3. Reduced number of infants (per 1,000) born with low birthweight? (1990, 1995) 57 59 @@ 70 73 @@ 48-151 53-134 71 754. Increased number of mothers (per 1,000) receiving early prenatal care? (1990, 1995) 742 799 !! 758 813 !! 469-868 560-900 778 8285. Increased number of children with disabilities in preschool (per 1,000)? (1991, 1996) 56 56 ## * * 16-68 16-92 38 47
6. Increased high school completion rate? (1990, 1995) 83% 85% ## 86% 86% ## 77-96% 79-96% 87% 88%7. Reduced high school dropout rate? (1992, 1994) • — — * * 3-12% 3-10% 5% 5%
Ready to Learn
School Completion
Student Achievement and Citizenship
19951990
85%
100%
80%
60%
40%
20%
0%
83%ns
High School CompletionPercentage of all18- to 24-year-olds1
who have a highschool credential2(Indicator 6)
1 Does not include those still in high school.2 Includes traditional high school diploma and alternative credential.nsInterpret with caution. Change was not statistically significant.
0%
20%
40%
60%
80%
100%
19951990
35%31%
Children’sHealth IndexPercentage ofinfants born with 1or more healthrisks1 (Indicator 1)
1 Includes late (in third trimester) or no prenatal care, low maternal weightgain (less than 21 pounds), mother smoked during pregnancy, or motherdrank alcohol during pregnancy.
KEY
KEY
!! Significant progress
@@ Significant decline
## Change is not significant
Scorecards #1 (AL-MS) 10/30/97 10:12 AM Page 124

125
† Median is the middle score in a set of ranked scores.° See Table 8 for the numbers for each subject area.— Data not available. See Appendix A.∞ This information had not been released when the 1997 Goals Report
went to print.See pages 72-75 for a Guide to Reading the State Pages.See Appendix C for technical notes and sources.
11. Increased the number of Advanced Placement examinations receiving a grade of 3 or higher (per 1,000)? (1991, 1997)° 28 39 !! 55 85 !! 9-177 18-223 41 65
12. Increased the percentage of public secondary school teachers who hold • a degree in main teaching assignment? (1991, 1994) 62% 56% ## 66% 63% @@ 51-85% 50-81% 69% 64%• a teaching certificate in main teaching assignment? (1991, 1994) 98% 96% ## 94% 93% @@ 91-100% 89-100% 98% 97%
13. Increased the percentage of public school teachers participating in professional development on 1 or more selected topics? (1994) 84% — 85% — 76-98% — 86% —
14. Increased the percentage of public school teachers with training to teach limited English-proficient students? (1994) 26% — 16% — 4-81% — 16% —
15. Increased the percentage of beginning public school teachers participating in a formal teacher induction program? (1991, 1994) 19% 27% !! 22% 27% !! 6-42% 7-48% 20% 23%
16. International comparisons in mathematics and science will be reported in future Goals Panel reports.∞ — — — — — — — —
IDAHO
GOAL 3
GOAL 4
GOAL 5
U.S.
baseline update progress?
Idaho
baseline update progress?
Range of State Scores
baseline update
MedianScores†
baseline update
Student Achievement and Citizenship (continued)
Teacher Education and Professional Development
Mathematics and Science
ReadingGrade 4
MathematicsGrade 4
19921992
28%
100%
80%
60%
40%
20%
0%
16%
Student AchievementPercentage of public school students who metthe Goals Panel’sperformancestandard1 in reading and mathematics (Indicators 8 & 9)
1 A complete description of the performance standard can be found inAppendix C. 0 2
0
40
60
80
100
0% 20% 40% 60% 80% 100%
Uses ofeducationaltechnology
One ormore topics
Methods ofteaching
subject fieldIn-depthstudy in
subject field
Studentassessment
84%
42%
61%
28%
41%
Professional DevelopmentPercentage ofpublic schoolteachers partici-pating in profes-sional develop-ment on thefollowing topics,1994(Indicator 13)KEY
KEY
!! Significant progress
@@ Significant decline
## Change is not significant
Scorecards #1 (AL-MS) 10/30/97 10:12 AM Page 125

126
20. Increased adult literacy? (1992) — — 52% — 46-77% — 53% —21. Increased the percentage of U.S. citizens
• registered to vote? (1988, 1992) 72% 74% ## 70% 73% !! 58-95% 63-92% 71% 75%• voting? (1988, 1992) 66% 69% ## 61% 66% !! 50-74% 55-77% 62% 68%
22. Increased postsecondary enrollment? (1992, 1994) 49% 48% ❊ ** ** 33-68% 37-71% 53% 55%
IDAHO
† Median is the middle score in a set of ranked scores.— Data not available. See Appendix A.** Indicators are not the same at the national and state level.❊ Sample size does not permit a reliable estimate of change.See pages 72-75 for a Guide to Reading the State Pages.See Appendix C for technical notes and sources.
GOAL 5
GOAL 6
Idaho
baseline update progress?
Range of State Scores
baseline update
MedianScores†
baseline update
U.S.
baseline update progress?
17. Increased the percentage of public school 8th graders whose mathematics teachers • have students work in small groups or with a partner? (1996) — — 66% — 45-92% — 67% —• address Algebra and functions? (1996) — — 57% — 45-82% — 58% —• address reasoning and analytical ability? (1996) — — 52% — 39-64% — 48% —
18. Increased the percentage of public school 8th graders who have computers available in their mathematics classroom? (1996) — — 30% — 7-54% — 30% —
19. Increased mathematics and science degrees awarded to• all students? (1991, 1995) 34% 38% !! 39% 42% !! 25-49% 15-53% 39% 42%• minorities (Black, Hispanic, American Indian/Alaskan Native)? (1991, 1995) 43% 39% @@ 39% 40% !! 22-64% 22-57% 39% 39%• female students? (1991, 1995) 29% 31% !! 35% 37% !! 23-46% 13-47% 33% 36%
Mathematics and Science (continued)
Adult Literacy and Lifelong Learning
KEY
KEY
!! Significant progress
@@ Significant decline
## Change is not significant
Scorecards #1 (AL-MS) 10/30/97 10:12 AM Page 126
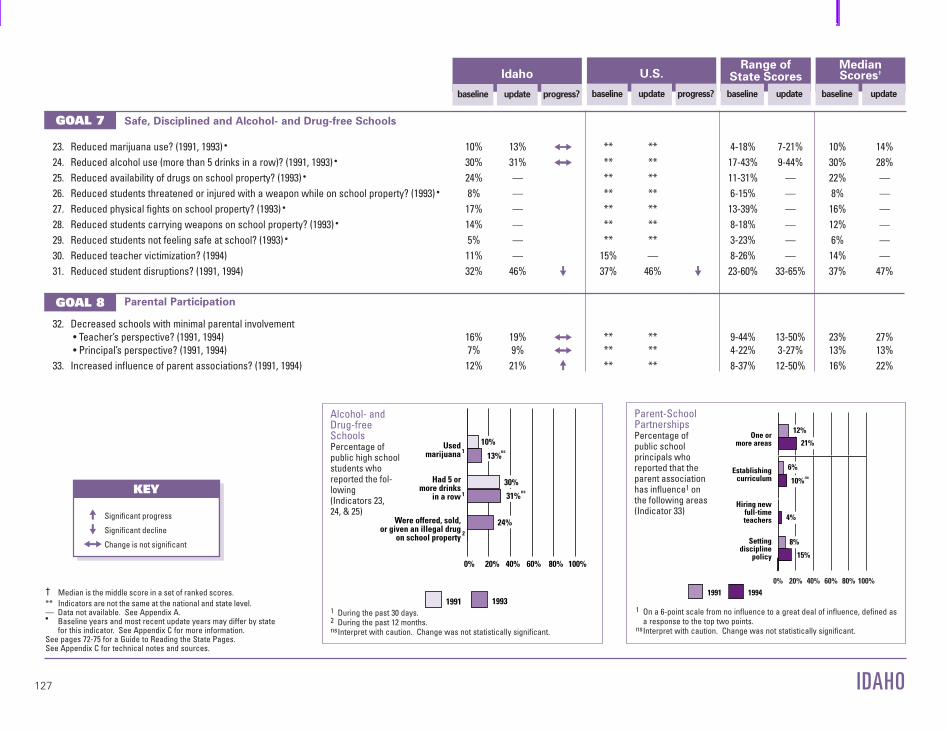
127
† Median is the middle score in a set of ranked scores.** Indicators are not the same at the national and state level.— Data not available. See Appendix A.• Baseline years and most recent update years may differ by state
for this indicator. See Appendix C for more information.See pages 72-75 for a Guide to Reading the State Pages.See Appendix C for technical notes and sources.
23. Reduced marijuana use? (1991, 1993) • 10% 13% ## ** ** 4-18% 7-21% 10% 14%24. Reduced alcohol use (more than 5 drinks in a row)? (1991, 1993) • 30% 31% ## ** ** 17-43% 9-44% 30% 28%25. Reduced availability of drugs on school property? (1993) • 24% — ** ** 11-31% — 22% —26. Reduced students threatened or injured with a weapon while on school property? (1993) • 8% — ** ** 6-15% — 8% —27. Reduced physical fights on school property? (1993) • 17% — ** ** 13-39% — 16% —28. Reduced students carrying weapons on school property? (1993) • 14% — ** ** 8-18% — 12% —29. Reduced students not feeling safe at school? (1993) • 5% — ** ** 3-23% — 6% —30. Reduced teacher victimization? (1994) 11% — 15% — 8-26% — 14% —31. Reduced student disruptions? (1991, 1994) 32% 46% @@ 37% 46% @@ 23-60% 33-65% 37% 47%
32. Decreased schools with minimal parental involvement• Teacher’s perspective? (1991, 1994) 16% 19% ## ** ** 9-44% 13-50% 23% 27%• Principal’s perspective? (1991, 1994) 7% 9% ## ** ** 4-22% 3-27% 13% 13%
33. Increased influence of parent associations? (1991, 1994) 12% 21% !! ** ** 8-37% 12-50% 16% 22%
IDAHO
GOAL 7
GOAL 8
U.S.
baseline update progress?
Idaho
baseline update progress?
Range of State Scores
baseline update
MedianScores†
baseline update
Safe, Disciplined and Alcohol- and Drug-free Schools
Parental Participation
Usedmarijuana
Had 5 ormore drinks
in a row
Were offered, sold,or given an illegal drug
on school property
1
1
2
0% 20% 40% 60% 80% 100%
1991 1993
13%
10%
30%
31%
24%
ns
ns
Alcohol- andDrug-freeSchoolsPercentage ofpublic high schoolstudents whoreported the fol-lowing(Indicators 23,24, & 25)
1 During the past 30 days.2 During the past 12 months.nsInterpret with caution. Change was not statistically significant.
0% 20% 40% 60% 80% 100%
Establishingcurriculum
One ormore areas
Hiring newfull-timeteachers
Settingdiscipline
policy
1991 1994
12%
21%
6%
10%
4%
8%
15%
ns
Parent-SchoolPartnershipsPercentage of public school principals whoreported that theparent associationhas influence1 onthe following areas(Indicator 33)
1 On a 6-point scale from no influence to a great deal of influence, defined asa response to the top two points.
nsInterpret with caution. Change was not statistically significant.
KEY
KEY
!! Significant progress
@@ Significant decline
## Change is not significant
Scorecards #1 (AL-MS) 10/30/97 10:12 AM Page 127

128
8. Increased reading achievement in Grade 4? (1992, 1994) • — — 29% 30% ## 8-38% 8-41% 26% 27%9. Increased mathematics achievement •
• in Grade 4? (1992, 1996) — — 18% 21% !! 5-27% 3-31% 16% 20%• in Grade 8? (1990, 1996) — — 15% 24% !! 1-27% 5-34% 15% 22%
10. Increased science achievement in Grade 8? (1996) — — 29% — 5-41% — 27% —
ILLINOIS
† Median is the middle score in a set of ranked scores.* Comparable national data are not available.— Data not available. See Appendix A.• Baseline years and most recent update years may differ by state
for this indicator. See Appendix C for more information.See pages 72-75 for a Guide to Reading the State Pages.See Appendix C for technical notes and sources.
GOAL 1
GOAL 2
GOAL 3
Illinois
baseline update progress?
Range of State Scores
baseline update
MedianScores†
baseline update
U.S.
baseline update progress?
1. Reduced percentage of infants born with 1 or more health risks? (1990, 1995) 35% 33% !! 37% 34% !! 25-48% 24-46% 38% 35%2. Increased percentage of 2-year-olds immunized? (1994, 1996) 68% 76% !! 75% 78% !! 61-88% 64-88% 76% 79%3. Reduced number of infants (per 1,000) born with low birthweight? (1990, 1995) 76 79 @@ 70 73 @@ 48-151 53-134 71 754. Increased number of mothers (per 1,000) receiving early prenatal care? (1990, 1995) 778 808 !! 758 813 !! 469-868 560-900 778 8285. Increased number of children with disabilities in preschool (per 1,000)? (1991, 1996) 53 45 @@ * * 16-68 16-92 38 47
6. Increased high school completion rate? (1990, 1995) 85% 89% !! 86% 86% ## 77-96% 79-96% 87% 88%7. Reduced high school dropout rate? (1992, 1994) • — — * * 3-12% 3-10% 5% 5%
Ready to Learn
School Completion
Student Achievement and Citizenship
19951990
89%100%
80%
60%
40%
20%
0%
85%
High School CompletionPercentage of all18- to 24-year-olds1
who have a highschool credential2(Indicator 6)
1 Does not include those still in high school.2 Includes traditional high school diploma and alternative credential.
0%
20%
40%
60%
80%
100%
19951990
35%33%
Children’sHealth IndexPercentage ofinfants born with 1or more healthrisks1 (Indicator 1)
1 Includes late (in third trimester) or no prenatal care, low maternal weightgain (less than 21 pounds), mother smoked during pregnancy, or motherdrank alcohol during pregnancy.
KEY
KEY
!! Significant progress
@@ Significant decline
## Change is not significant
Scorecards #1 (AL-MS) 10/30/97 10:12 AM Page 128

129
† Median is the middle score in a set of ranked scores.° See Table 8 for the numbers for each subject area.— Data not available. See Appendix A.∞ This information had not been released when the 1997 Goals Report
went to print.See pages 72-75 for a Guide to Reading the State Pages.See Appendix C for technical notes and sources.
11. Increased the number of Advanced Placement examinations receiving a grade of 3 or higher (per 1,000)? (1991, 1997)° 61 92 !! 55 85 !! 9-177 18-223 41 65
12. Increased the percentage of public secondary school teachers who hold • a degree in main teaching assignment? (1991, 1994) 69% 72% ## 66% 63% @@ 51-85% 50-81% 69% 64%• a teaching certificate in main teaching assignment? (1991, 1994) 96% 96% ## 94% 93% @@ 91-100% 89-100% 98% 97%
13. Increased the percentage of public school teachers participating in professional development on 1 or more selected topics? (1994) 81% — 85% — 76-98% — 86% —
14. Increased the percentage of public school teachers with training to teach limited English-proficient students? (1994) 19% — 16% — 4-81% — 16% —
15. Increased the percentage of beginning public school teachers participating in a formal teacher induction program? (1991, 1994) 18% 20% ## 22% 27% !! 6-42% 7-48% 20% 23%
16. International comparisons in mathematics and science will be reported in future Goals Panel reports.∞ — — — — — — — —
ILLINOIS
GOAL 3
GOAL 4
GOAL 5
U.S.
baseline update progress?
Illinois
baseline update progress?
Range of State Scores
baseline update
MedianScores†
baseline update
Student Achievement and Citizenship (continued)
Teacher Education and Professional Development
Mathematics and Science
0 20
40
60
80
100
0% 20% 40% 60% 80% 100%
Uses ofeducationaltechnology
One ormore topics
Methods ofteaching
subject fieldIn-depthstudy in
subject field
Studentassessment
81%
42%
52%
22%
56%
Professional DevelopmentPercentage ofpublic schoolteachers partici-pating in profes-sional develop-ment on thefollowing topics,1994(Indicator 13)KEY
KEY
!! Significant progress
@@ Significant decline
## Change is not significant
Scorecards #1 (AL-MS) 10/30/97 10:12 AM Page 129
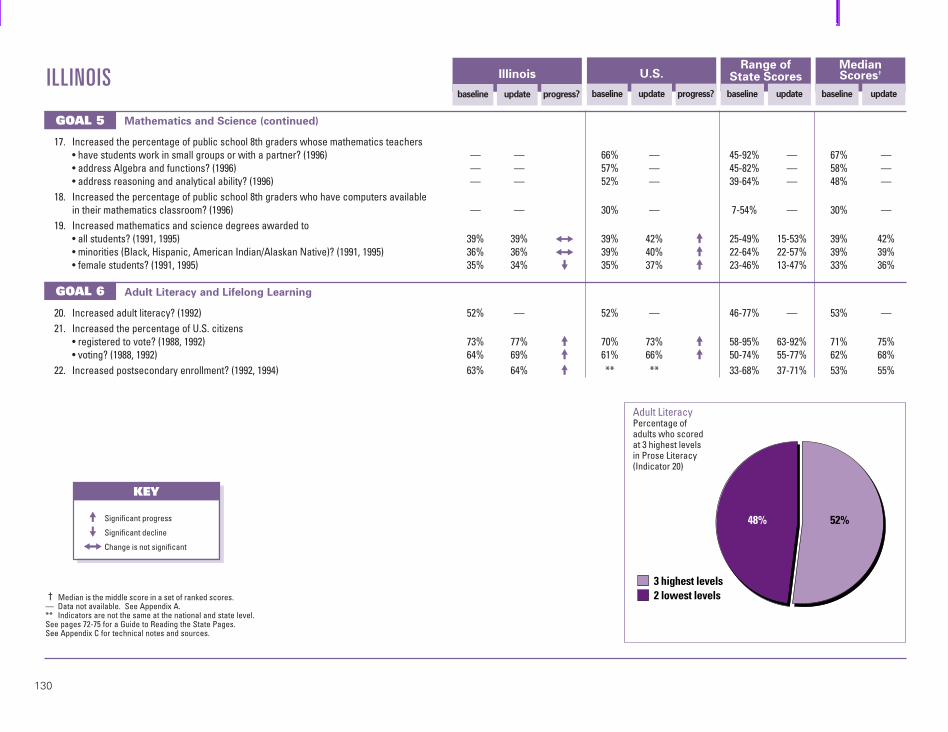
130
20. Increased adult literacy? (1992) 52% — 52% — 46-77% — 53% —21. Increased the percentage of U.S. citizens
• registered to vote? (1988, 1992) 73% 77% !! 70% 73% !! 58-95% 63-92% 71% 75%• voting? (1988, 1992) 64% 69% !! 61% 66% !! 50-74% 55-77% 62% 68%
22. Increased postsecondary enrollment? (1992, 1994) 63% 64% !! ** ** 33-68% 37-71% 53% 55%
ILLINOIS
† Median is the middle score in a set of ranked scores.— Data not available. See Appendix A.** Indicators are not the same at the national and state level.See pages 72-75 for a Guide to Reading the State Pages.See Appendix C for technical notes and sources.
GOAL 5
GOAL 6
Illinois
baseline update progress?
Range of State Scores
baseline update
MedianScores†
baseline update
U.S.
baseline update progress?
17. Increased the percentage of public school 8th graders whose mathematics teachers • have students work in small groups or with a partner? (1996) — — 66% — 45-92% — 67% —• address Algebra and functions? (1996) — — 57% — 45-82% — 58% —• address reasoning and analytical ability? (1996) — — 52% — 39-64% — 48% —
18. Increased the percentage of public school 8th graders who have computers available in their mathematics classroom? (1996) — — 30% — 7-54% — 30% —
19. Increased mathematics and science degrees awarded to• all students? (1991, 1995) 39% 39% ## 39% 42% !! 25-49% 15-53% 39% 42%• minorities (Black, Hispanic, American Indian/Alaskan Native)? (1991, 1995) 36% 36% ## 39% 40% !! 22-64% 22-57% 39% 39%• female students? (1991, 1995) 35% 34% @@ 35% 37% !! 23-46% 13-47% 33% 36%
Mathematics and Science (continued)
Adult Literacy and Lifelong Learning
52%48%
3 highest levels2 lowest levels
Adult LiteracyPercentage ofadults who scoredat 3 highest levelsin Prose Literacy(Indicator 20)
KEY
KEY
!! Significant progress
@@ Significant decline
## Change is not significant
Scorecards #1 (AL-MS) 10/30/97 10:12 AM Page 130

131
† Median is the middle score in a set of ranked scores.** Indicators are not the same at the national and state level.— Data not available. See Appendix A.• Baseline years and most recent update years may differ by state
for this indicator. See Appendix C for more information.See pages 72-75 for a Guide to Reading the State Pages.See Appendix C for technical notes and sources.
23. Reduced marijuana use? (1993, 1995) • 14% 25% @@ ** ** 7-21% 7-32% 14% 23%24. Reduced alcohol use (more than 5 drinks in a row)? (1993, 1995) • 28% 30% ## ** ** 9-44% 13-43% 28% 31%25. Reduced availability of drugs on school property? (1993, 1995) • 19% 31% @@ ** ** 11-31% 20-46% 22% 30%26. Reduced students threatened or injured with a weapon while on school property? (1993, 1995) • 8% 9% ## ** ** 6-15% 4-11% 8% 8%27. Reduced physical fights on school property? (1993, 1995) • 18% 16% ## ** ** 13-39% 12-19% 16% 15%28. Reduced students carrying weapons on school property? (1993, 1995) • 10% 9% ## ** ** 8-18% 7-14% 12% 11%29. Reduced students not feeling safe at school? (1993, 1995) • 7% 6% ## ** ** 3-23% 3-16% 6% 5%30. Reduced teacher victimization? (1994) 12% — 15% — 8-26% — 14% —31. Reduced student disruptions? (1991, 1994) 40% 49% @@ 37% 46% @@ 23-60% 33-65% 37% 47%
32. Decreased schools with minimal parental involvement• Teacher’s perspective? (1991, 1994) 27% 25% ## ** ** 9-44% 13-50% 23% 27%• Principal’s perspective? (1991, 1994) 15% 14% ## ** ** 4-22% 3-27% 13% 13%
33. Increased influence of parent associations? (1991, 1994) 18% 22% ## ** ** 8-37% 12-50% 16% 22%
ILLINOIS
GOAL 7
GOAL 8
U.S.
baseline update progress?
Illinois
baseline update progress?
Range of State Scores
baseline update
MedianScores†
baseline update
Safe, Disciplined and Alcohol- and Drug-free Schools
Parental Participation
Usedmarijuana
Had 5 ormore drinks
in a row
Were offered, sold,or given an illegal drug
on school property
1
1
2
0% 20% 40% 60% 80% 100%
1993 1995
25%
14%
28%
30%
19%
31%
ns
Alcohol- andDrug-freeSchoolsPercentage ofpublic high schoolstudents whoreported the fol-lowing(Indicators 23,24, & 25)
1 During the past 30 days.2 During the past 12 months.nsInterpret with caution. Change was not statistically significant.
0% 20% 40% 60% 80% 100%
Establishingcurriculum
One ormore areas
Hiring newfull-timeteachers
Settingdiscipline
policy
1991 1994
18%
22%
8%
9%
3%
3%
13%
16%
ns
ns
ns
Parent-SchoolPartnershipsPercentage of public school principals whoreported that theparent associationhas influence1 onthe following areas(Indicator 33)
1 On a 6-point scale from no influence to a great deal of influence, defined asa response to the top two points.
nsInterpret with caution. Change was not statistically significant.
KEY
KEY
!! Significant progress
@@ Significant decline
## Change is not significant
Scorecards #1 (AL-MS) 10/30/97 10:12 AM Page 131

132
8. Increased reading achievement in Grade 4? (1992, 1994) • 30% 33% ## 29% 30% ## 8-38% 8-41% 26% 27%9. Increased mathematics achievement •
• in Grade 4? (1992, 1996) 16% 24% !! 18% 21% !! 5-27% 3-31% 16% 20%• in Grade 8? (1990, 1996) 17% 24% !! 15% 24% !! 1-27% 5-34% 15% 22%
10. Increased science achievement in Grade 8? (1996) 30% — 29% — 5-41% — 27% —
INDIANA
† Median is the middle score in a set of ranked scores.* Comparable national data are not available.— Data not available. See Appendix A.• Baseline years and most recent update years may differ by state
for this indicator. See Appendix C for more information.See pages 72-75 for a Guide to Reading the State Pages.See Appendix C for technical notes and sources.
GOAL 1
GOAL 2
GOAL 3
Indiana
baseline update progress?
Range of State Scores
baseline update
MedianScores†
baseline update
U.S.
baseline update progress?
1. Reduced percentage of infants born with 1 or more health risks? (1990, 1995) — — 37% 34% !! 25-48% 24-46% 38% 35%2. Increased percentage of 2-year-olds immunized? (1994, 1996) 74% 73% ## 75% 78% !! 61-88% 64-88% 76% 79%3. Reduced number of infants (per 1,000) born with low birthweight? (1990, 1995) 66 75 @@ 70 73 @@ 48-151 53-134 71 754. Increased number of mothers (per 1,000) receiving early prenatal care? (1990, 1995) 779 809 !! 758 813 !! 469-868 560-900 778 8285. Increased number of children with disabilities in preschool (per 1,000)? (1991, 1996) 30 49 !! * * 16-68 16-92 38 47
6. Increased high school completion rate? (1990, 1995) 89% 88% ## 86% 86% ## 77-96% 79-96% 87% 88%7. Reduced high school dropout rate? (1992, 1994) • — — * * 3-12% 3-10% 5% 5%
Ready to Learn
School Completion
Student Achievement and Citizenship
19951990
88%
100%
80%
60%
40%
20%
0%
89% ns
High School CompletionPercentage of all18- to 24-year-olds1
who have a highschool credential2(Indicator 6)
1 Does not include those still in high school.2 Includes traditional high school diploma and alternative credential.nsInterpret with caution. Change was not statistically significant.
KEY
KEY
!! Significant progress
@@ Significant decline
## Change is not significant
Scorecards #1 (AL-MS) 10/30/97 10:12 AM Page 132

133
† Median is the middle score in a set of ranked scores.° See Table 8 for the numbers for each subject area.— Data not available. See Appendix A.∞ This information had not been released when the 1997 Goals Report
went to print.See pages 72-75 for a Guide to Reading the State Pages.See Appendix C for technical notes and sources.
11. Increased the number of Advanced Placement examinations receiving a grade of 3 or higher (per 1,000)? (1991, 1997)° 20 40 !! 55 85 !! 9-177 18-223 41 65
12. Increased the percentage of public secondary school teachers who hold • a degree in main teaching assignment? (1991, 1994) 73% 70% ## 66% 63% @@ 51-85% 50-81% 69% 64%• a teaching certificate in main teaching assignment? (1991, 1994) 99% 98% ## 94% 93% @@ 91-100% 89-100% 98% 97%
13. Increased the percentage of public school teachers participating in professional development on 1 or more selected topics? (1994) 80% — 85% — 76-98% — 86% —
14. Increased the percentage of public school teachers with training to teach limited English-proficient students? (1994) 6% — 16% — 4-81% — 16% —
15. Increased the percentage of beginning public school teachers participating in a formal teacher induction program? (1991, 1994) 14% 22% !! 22% 27% !! 6-42% 7-48% 20% 23%
16. International comparisons in mathematics and science will be reported in future Goals Panel reports.∞ — — — — — — — —
INDIANA
GOAL 3
GOAL 4
GOAL 5
U.S.
baseline update progress?
Indiana
baseline update progress?
Range of State Scores
baseline update
MedianScores†
baseline update
Student Achievement and Citizenship (continued)
Teacher Education and Professional Development
Mathematics and Science
ReadingGrade 4
MathematicsGrade 4
1996199219941992
100%
80%
60%
40%
20%
0%
33%30%
16%24%
ns
Student AchievementPercentage of public school students who metthe Goals Panel’sperformancestandard1 in reading and mathematics (Indicators 8 & 9)
1 A complete description of the performance standard can be found inAppendix C.
nsInterpret with caution. Change was not statistically significant.
0 20
40
60
80
100
0% 20% 40% 60% 80% 100%
Uses ofeducationaltechnology
One ormore topics
Methods ofteaching
subject fieldIn-depthstudy in
subject field
Studentassessment
80%
52%
56%
22%
37%
Professional DevelopmentPercentage ofpublic schoolteachers partici-pating in profes-sional develop-ment on thefollowing topics,1994(Indicator 13)KEY
KEY
!! Significant progress
@@ Significant decline
## Change is not significant
Scorecards #1 (AL-MS) 10/30/97 10:12 AM Page 133

134
20. Increased adult literacy? (1992) 58% — 52% — 46-77% — 53% —21. Increased the percentage of U.S. citizens
• registered to vote? (1988, 1992) 69% 68% ## 70% 73% !! 58-95% 63-92% 71% 75%• voting? (1988, 1992) 61% 63% ## 61% 66% !! 50-74% 55-77% 62% 68%
22. Increased postsecondary enrollment? (1992, 1994) 51% 55% ❊ ** ** 33-68% 37-71% 53% 55%
INDIANA
† Median is the middle score in a set of ranked scores.— Data not available. See Appendix A.** Indicators are not the same at the national and state level.❊ Sample size does not permit a reliable estimate of change.See pages 72-75 for a Guide to Reading the State Pages.See Appendix C for technical notes and sources.
GOAL 5
GOAL 6
Indiana
baseline update progress?
Range of State Scores
baseline update
MedianScores†
baseline update
U.S.
baseline update progress?
17. Increased the percentage of public school 8th graders whose mathematics teachers • have students work in small groups or with a partner? (1996) 62% — 66% — 45-92% — 67% —• address Algebra and functions? (1996) 52% — 57% — 45-82% — 58% —• address reasoning and analytical ability? (1996) 43% — 52% — 39-64% — 48% —
18. Increased the percentage of public school 8th graders who have computers available in their mathematics classroom? (1996) 23% — 30% — 7-54% — 30% —
19. Increased mathematics and science degrees awarded to• all students? (1991, 1995) 40% 42% !! 39% 42% !! 25-49% 15-53% 39% 42%• minorities (Black, Hispanic, American Indian/Alaskan Native)? (1991, 1995) 39% 40% !! 39% 40% !! 22-64% 22-57% 39% 39%• female students? (1991, 1995) 34% 37% !! 35% 37% !! 23-46% 13-47% 33% 36%
Mathematics and Science (continued)
Adult Literacy and Lifelong Learning
Addressreasoning & analytical
ability
AddressAlgebra and functions
Work insmall groups
or with apartner
0% 20% 40% 60% 80% 100%
62%
52%
43%
1
2
2
MathematicsInstructionPercentage ofpublic school 8thgraders whosemathematicsteachers do thefollowing, 1996(Indicator 17)
58%42%
3 highest levels2 lowest levels
Adult LiteracyPercentage ofadults who scoredat 3 highest levelsin Prose Literacy(Indicator 20)
KEY
KEY
!! Significant progress
@@ Significant decline
## Change is not significant
1 At least once a week.2 On a 4-point scale from “none” to “a lot,” defined as a response to the top point.
Scorecards #1 (AL-MS) 10/30/97 10:12 AM Page 134

135
† Median is the middle score in a set of ranked scores.** Indicators are not the same at the national and state level.— Data not available. See Appendix A.• Baseline years and most recent update years may differ by state
for this indicator. See Appendix C for more information.See pages 72-75 for a Guide to Reading the State Pages.See Appendix C for technical notes and sources.
23. Reduced marijuana use? (1991, 1995) • — — ** ** 4-18% 7-32% 10% 23%24. Reduced alcohol use (more than 5 drinks in a row)? (1991, 1995) • — — ** ** 17-43% 13-43% 30% 31%25. Reduced availability of drugs on school property? (1993, 1995) • — — ** ** 11-31% 20-46% 22% 30%26. Reduced students threatened or injured with a weapon while on school property? (1993, 1995) • — — ** ** 6-15% 4-11% 8% 8%27. Reduced physical fights on school property? (1993, 1995) • — — ** ** 13-39% 12-19% 16% 15%28. Reduced students carrying weapons on school property? (1993, 1995) • — — ** ** 8-18% 7-14% 12% 11%29. Reduced students not feeling safe at school? (1993, 1995) • — — ** ** 3-23% 3-16% 6% 5%30. Reduced teacher victimization? (1994) 16% — 15% — 8-26% — 14% —31. Reduced student disruptions? (1991, 1994) 38% 45% @@ 37% 46% @@ 23-60% 33-65% 37% 47%
32. Decreased schools with minimal parental involvement• Teacher’s perspective? (1991, 1994) 27% 25% ## ** ** 9-44% 13-50% 23% 27%• Principal’s perspective? (1991, 1994) 19% 9% !! ** ** 4-22% 3-27% 13% 13%
33. Increased influence of parent associations? (1991, 1994) 14% 20% ## ** ** 8-37% 12-50% 16% 22%
INDIANA
GOAL 7
GOAL 8
U.S.
baseline update progress?
Indiana
baseline update progress?
Range of State Scores
baseline update
MedianScores†
baseline update
Safe, Disciplined and Alcohol- and Drug-free Schools
Parental Participation
0% 20% 40% 60% 80% 100%
Establishingcurriculum
One ormore areas
Hiring newfull-timeteachers
Settingdiscipline
policy
1991 1994
14%
20%
6%
7%
3%
1%
9%
17%
ns
ns
ns
ns
Parent-SchoolPartnershipsPercentage of public school principals whoreported that theparent associationhas influence1 onthe following areas(Indicator 33)
1 On a 6-point scale from no influence to a great deal of influence, defined asa response to the top two points.
nsInterpret with caution. Change was not statistically significant.
KEY
KEY
!! Significant progress
@@ Significant decline
## Change is not significant
Scorecards #1 (AL-MS) 10/30/97 10:12 AM Page 135

136
8. Increased reading achievement in Grade 4? (1992, 1994) • 36% 35% ## 29% 30% ## 8-38% 8-41% 26% 27%9. Increased mathematics achievement •
• in Grade 4? (1992, 1996) 26% 22% ## 18% 21% !! 5-27% 3-31% 16% 20%• in Grade 8? (1990, 1996) 25% 31% !! 15% 24% !! 1-27% 5-34% 15% 22%
10. Increased science achievement in Grade 8? (1996) 36% — 29% — 5-41% — 27% —
IOWA
† Median is the middle score in a set of ranked scores.* Comparable national data are not available.— Data not available. See Appendix A.• Baseline years and most recent update years may differ by state
for this indicator. See Appendix C for more information.See pages 72-75 for a Guide to Reading the State Pages.See Appendix C for technical notes and sources.
GOAL 1
GOAL 2
GOAL 3
Iowa
baseline update progress?
Range of State Scores
baseline update
MedianScores†
baseline update
U.S.
baseline update progress?
1. Reduced percentage of infants born with 1 or more health risks? (1990, 1995) 39% 36% !! 37% 34% !! 25-48% 24-46% 38% 35%2. Increased percentage of 2-year-olds immunized? (1994, 1996) 81% 82% ## 75% 78% !! 61-88% 64-88% 76% 79%3. Reduced number of infants (per 1,000) born with low birthweight? (1990, 1995) 54 60 @@ 70 73 @@ 48-151 53-134 71 75 4. Increased number of mothers (per 1,000) receiving early prenatal care? (1990, 1995) 848 871 !! 758 813 !! 469-868 560-900 778 8285. Increased number of children with disabilities in preschool (per 1,000)? (1991, 1996) 45 51 !! * * 16-68 16-92 38 47
6. Increased high school completion rate? (1990, 1995) 95% 92% ## 86% 86% ## 77-96% 79-96% 87% 88%7. Reduced high school dropout rate? (1994) • 3% — * * 3-10% — 5% —
Ready to Learn
School Completion
Student Achievement and Citizenship
19951990
92%100%
80%
60%
40%
20%
0%
95% ns
High School CompletionPercentage of all18- to 24-year-olds1
who have a highschool credential2(Indicator 6)
1 Does not include those still in high school.2 Includes traditional high school diploma and alternative credential.nsInterpret with caution. Change was not statistically significant.
0%
20%
40%
60%
80%
100%
19951990
39% 36%
Children’sHealth IndexPercentage ofinfants born with 1or more healthrisks1 (Indicator 1)
1 Includes late (in third trimester) or no prenatal care, low maternal weightgain (less than 21 pounds), mother smoked during pregnancy, or motherdrank alcohol during pregnancy.
KEY
KEY
!! Significant progress
@@ Significant decline
## Change is not significant
Scorecards #1 (AL-MS) 10/30/97 10:12 AM Page 136

137
† Median is the middle score in a set of ranked scores.° See Table 8 for the numbers for each subject area.— Data not available. See Appendix A.∞ This information had not been released when the 1997 Goals Report
went to print.See pages 72-75 for a Guide to Reading the State Pages.See Appendix C for technical notes and sources.
11. Increased the number of Advanced Placement examinations receiving a grade of 3 or higher (per 1,000)? (1991, 1997)° 19 34 !! 55 85 !! 9-177 18-223 41 65
12. Increased the percentage of public secondary school teachers who hold • a degree in main teaching assignment? (1991, 1994) 71% 70% ## 66% 63% @@ 51-85% 50-81% 69% 64%• a teaching certificate in main teaching assignment? (1991, 1994) 99% 98% ## 94% 93% @@ 91-100% 89-100% 98% 97%
13. Increased the percentage of public school teachers participating in professional development on 1 or more selected topics? (1994) 89% — 85% — 76-98% — 86% —
14. Increased the percentage of public school teachers with training to teach limited English-proficient students? (1994) 15% — 16% — 4-81% — 16% —
15. Increased the percentage of beginning public school teachers participating in a formal teacher induction program? (1991, 1994) 11% 13% ## 22% 27% !! 6-42% 7-48% 20% 23%
16. International comparisons in mathematics and science will be reported in future Goals Panel reports.∞ — — — — — — — —
IOWA
GOAL 3
GOAL 4
GOAL 5
U.S.
baseline update progress?
Iowa
baseline update progress?
Range of State Scores
baseline update
MedianScores†
baseline update
Student Achievement and Citizenship (continued)
Teacher Education and Professional Development
Mathematics and Science
ReadingGrade 4
MathematicsGrade 4
1996199219941992
100%
80%
60%
40%
20%
0%
35%36%
26%22%
ns
ns
Student AchievementPercentage of public school students who metthe Goals Panel’sperformancestandard1 in reading and mathematics (Indicators 8 & 9)
1 A complete description of the performance standard can be found inAppendix C.
nsInterpret with caution. Change was not statistically significant.0 2
0
40
60
80
100
0% 20% 40% 60% 80% 100%
Uses ofeducationaltechnology
One ormore topics
Methods ofteaching
subject fieldIn-depthstudy in
subject field
Studentassessment
89%
57%
58%
27%
56%
Professional DevelopmentPercentage ofpublic schoolteachers partici-pating in profes-sional develop-ment on thefollowing topics,1994(Indicator 13)KEY
KEY
!! Significant progress
@@ Significant decline
## Change is not significant
Scorecards #1 (AL-MS) 10/30/97 10:12 AM Page 137

138
20. Increased adult literacy? (1992) 61% — 52% — 46-77% — 53% —21. Increased the percentage of U.S. citizens
• registered to vote? (1988, 1992) 73% 79% !! 70% 73% !! 58-95% 63-92% 71% 75%• voting? (1988, 1992) 64% 72% !! 61% 66% !! 50-74% 55-77% 62% 68%
22. Increased postsecondary enrollment? (1992, 1994) 64% 64% ❊ ** ** 33-68% 37-71% 53% 55%
IOWA
† Median is the middle score in a set of ranked scores.— Data not available. See Appendix A.** Indicators are not the same at the national and state level.❊ Sample size does not permit a reliable estimate of change.See pages 72-75 for a Guide to Reading the State Pages.See Appendix C for technical notes and sources.
GOAL 5
GOAL 6
Iowa
baseline update progress?
Range of State Scores
baseline update
MedianScores†
baseline update
U.S.
baseline update progress?
17. Increased the percentage of public school 8th graders whose mathematics teachers• have students work in small groups or with a partner? (1996) 60% — 66% — 45-92% — 67% —• address Algebra and functions? (1996) 55% — 57% — 45-82% — 58% —• address reasoning and analytical ability? (1996) 44% — 52% — 39-64% — 48% —
18. Increased the percentage of public school 8th graders who have computers available in their mathematics classroom? (1996) 32% — 30% — 7-54% — 30% —
19. Increased mathematics and science degrees awarded to• all students? (1991, 1995) 33% 37% !! 39% 42% !! 25-49% 15-53% 39% 42%• minorities (Black, Hispanic, American Indian/Alaskan Native)? (1991, 1995) 32% 37% !! 39% 40% !! 22-64% 22-57% 39% 39%• female students? (1991, 1995) 28% 32% !! 35% 37% !! 23-46% 13-47% 33% 36%
Mathematics and Science (continued)
Adult Literacy and Lifelong Learning
Addressreasoning & analytical
ability
AddressAlgebra and functions
Work insmall groups
or with apartner
0% 20% 40% 60% 80% 100%
60%
55%
44%
1
2
2
MathematicsInstructionPercentage ofpublic school 8thgraders whosemathematicsteachers do thefollowing, 1996(Indicator 17)
61%39%
3 highest levels2 lowest levels
Adult LiteracyPercentage ofadults who scoredat 3 highest levelsin Prose Literacy(Indicator 20)
KEY
KEY
!! Significant progress
@@ Significant decline
## Change is not significant
1 At least once a week.2 On a 4-point scale from “none” to “a lot,” defined as a response to the top point.
Scorecards #1 (AL-MS) 10/30/97 10:12 AM Page 138

139
† Median is the middle score in a set of ranked scores.** Indicators are not the same at the national and state level.— Data not available. See Appendix A.• Baseline years and most recent update years may differ by state
for this indicator. See Appendix C for more information.See pages 72-75 for a Guide to Reading the State Pages.See Appendix C for technical notes and sources.
23. Reduced marijuana use? (1991, 1995) • — — ** ** 4-18% 7-32% 10% 23%24. Reduced alcohol use (more than 5 drinks in a row)? (1991, 1995) • — — ** ** 17-43% 13-43% 30% 31%25. Reduced availability of drugs on school property? (1993, 1995) • — — ** ** 11-31% 20-46% 22% 30%26. Reduced students threatened or injured with a weapon while on school property? (1993, 1995) • — — ** ** 6-15% 4-11% 8% 8%27. Reduced physical fights on school property? (1993, 1995) • — — ** ** 13-39% 12-19% 16% 15%28. Reduced students carrying weapons on school property? (1993, 1995) • — — ** ** 8-18% 7-14% 12% 11%29. Reduced students not feeling safe at school? (1993, 1995) • — — ** ** 3-23% 3-16% 6% 5%30. Reduced teacher victimization? (1994) 11% — 15% — 8-26% — 14% —31. Reduced student disruptions? (1991, 1994) 31% 48% @@ 37% 46% @@ 23-60% 33-65% 37% 47%
32. Decreased schools with minimal parental involvement• Teacher’s perspective? (1991, 1994) 15% 18% ## ** ** 9-44% 13-50% 23% 27%• Principal’s perspective? (1991, 1994) 8% 7% ## ** ** 4-22% 3-27% 13% 13%
33. Increased influence of parent associations? (1991, 1994) 12% 23% !! ** ** 8-37% 12-50% 16% 22%
IOWA
GOAL 7
GOAL 8
U.S.
baseline update progress?
Iowa
baseline update progress?
Range of State Scores
baseline update
MedianScores†
baseline update
Safe, Disciplined and Alcohol- and Drug-free Schools
Parental Participation
0% 20% 40% 60% 80% 100%
Establishingcurriculum
One ormore areas
Hiring newfull-timeteachers
Settingdiscipline
policy
1991 1994
12%
23%
3%
10%
6%
0%
9%
17%ns
Parent-SchoolPartnershipsPercentage of public school principals whoreported that theparent associationhas influence1 onthe following areas(Indicator 33)
1 On a 6-point scale from no influence to a great deal of influence, defined asa response to the top two points.
nsInterpret with caution. Change was not statistically significant.
KEY
KEY
!! Significant progress
@@ Significant decline
## Change is not significant
Scorecards #1 (AL-MS) 10/30/97 10:12 AM Page 139

140
8. Increased reading achievement in Grade 4? (1992, 1994) • — — 29% 30% ## 8-38% 8-41% 26% 27%9. Increased mathematics achievement •
• in Grade 4? (1992, 1996) — — 18% 21% !! 5-27% 3-31% 16% 20%• in Grade 8? (1990, 1996) — — 15% 24% !! 1-27% 5-34% 15% 22%
10. Increased science achievement in Grade 8? (1996) — — 29% — 5-41% — 27% —
KANSAS
† Median is the middle score in a set of ranked scores.* Comparable national data are not available.— Data not available. See Appendix A.• Baseline years and most recent update years may differ by state
for this indicator. See Appendix C for more information.See pages 72-75 for a Guide to Reading the State Pages.See Appendix C for technical notes and sources.
GOAL 1
GOAL 2
GOAL 3
Kansas
baseline update progress?
Range of State Scores
baseline update
MedianScores†
baseline update
U.S.
baseline update progress?
1. Reduced percentage of infants born in the state with 1 or more health risks? (1990, 1995) 32% 31% !! 37% 34% !! 25-48% 24-46% 38% 35%2. Increased percentage of 2-year-olds immunized? (1994, 1996) 82% 76% ## 75% 78% !! 61-88% 64-88% 76% 79%3. Reduced number of infants (per 1,000) born with low birthweight? (1990, 1995) 62 64 @@ 70 73 @@ 48-151 53-134 71 754. Increased number of mothers (per 1,000) receiving early prenatal care? (1990, 1995) 807 857 !! 758 813 !! 469-868 560-900 778 828 5. Increased number of children with disabilities in preschool (per 1,000)? (1991, 1996) 33 54 !! * * 16-68 16-92 38 47
6. Increased high school completion rate? (1990, 1995) 93% 92% ## 86% 86% ## 77-96% 79-96% 87% 88%7. Reduced high school dropout rate? (1993, 1994) • 5% 5% ## * * 2-10% 3-10% 5% 5%
Ready to Learn
School Completion
Student Achievement and Citizenship
19951990
92%100%
80%
60%
40%
20%
0%
93% ns
High School CompletionPercentage of all18- to 24-year-olds1
who have a highschool credential2(Indicator 6)
1 Does not include those still in high school.2 Includes traditional high school diploma and alternative credential.nsInterpret with caution. Change was not statistically significant.
0%
20%
40%
60%
80%
100%
19951990
32% 31%
Children’sHealth IndexPercentage ofinfants born with 1or more healthrisks1 (Indicator 1)
1 Includes late (in third trimester) or no prenatal care, low maternal weightgain (less than 21 pounds), mother smoked during pregnancy, or motherdrank alcohol during pregnancy.
KEY
KEY
!! Significant progress
@@ Significant decline
## Change is not significant
Scorecards #1 (AL-MS) 10/30/97 10:12 AM Page 140

141
† Median is the middle score in a set of ranked scores.° See Table 8 for the numbers for each subject area.— Data not available. See Appendix A.∞ This information had not been released when the 1997 Goals Report
went to print.See pages 72-75 for a Guide to Reading the State Pages.See Appendix C for technical notes and sources.
11. Increased the number of Advanced Placement examinations receiving a grade of 3 or higher (per 1,000)? (1991, 1997)° 22 29 !! 55 85 !! 9-177 18-223 41 65
12. Increased the percentage of public secondary school teachers who hold • a degree in main teaching assignment? (1991, 1994) 62% 60% ## 66% 63% @@ 51-85% 50-81% 69% 64%• a teaching certificate in main teaching assignment? (1991, 1994) 99% 99% ## 94% 93% @@ 91-100% 89-100% 98% 97%
13. Increased the percentage of public school teachers participating in professional development on 1 or more selected topics? (1994) 89% — 85% — 76-98% — 86% —
14. Increased the percentage of public school teachers with training to teach limited English-proficient students? (1994) 16% — 16% — 4-81% — 16% —
15. Increased the percentage of beginning public school teachers participating in a formal teacher induction program? (1991, 1994) 17% 19% ## 22% 27% !! 6-42% 7-48% 20% 23%
16. International comparisons in mathematics and science will be reported in future Goals Panel reports.∞ — — — — — — — —
KANSAS
GOAL 3
GOAL 4
GOAL 5
U.S.
baseline update progress?
Kansas
baseline update progress?
Range of State Scores
baseline update
MedianScores†
baseline update
Student Achievement and Citizenship (continued)
Teacher Education and Professional Development
Mathematics and Science
0 20
40
60
80
100
0% 20% 40% 60% 80% 100%
Uses ofeducationaltechnology
One ormore topics
Methods ofteaching
subject fieldIn-depthstudy in
subject field
Studentassessment
89%
58%
63%
28%
54%
Professional DevelopmentPercentage ofpublic schoolteachers partici-pating in profes-sional develop-ment on thefollowing topics,1994(Indicator 13)KEY
KEY
!! Significant progress
@@ Significant decline
## Change is not significant
Scorecards #1 (AL-MS) 10/30/97 10:12 AM Page 141

142
20. Increased adult literacy? (1992) — — 52% — 46-77% — 53% —21. Increased the percentage of U.S. citizens
• registered to vote? (1988, 1992) 69% 78% !! 70% 73% !! 58-95% 63-92% 71% 75%• voting? (1988, 1992) 62% 73% !! 61% 66% !! 50-74% 55-77% 62% 68%
22. Increased postsecondary enrollment? (1992, 1994) 58% 57% ❊ ** ** 33-68% 37-71% 53% 55%
KANSAS
† Median is the middle score in a set of ranked scores.— Data not available. See Appendix A.** Indicators are not the same at the national and state level.❊ Sample size does not permit a reliable estimate of change.See pages 72-75 for a Guide to Reading the State Pages.See Appendix C for technical notes and sources.
GOAL 5
GOAL 6
Kansas
baseline update progress?
Range of State Scores
baseline update
MedianScores†
baseline update
U.S.
baseline update progress?
17. Increased the percentage of public school 8th graders whose mathematics teachers• have students work in small groups? (1996) — — 66% — 45-92% — 67% —• address Algebra and functions? (1996) — — 57% — 45-82% — 58% —• address reasoning and analytical ability? (1996) — — 52% — 39-64% — 48% —
18. Increased the percentage of public school 8th graders who have computers available in their mathematics classroom? (1996) — — 30% — 7-54% — 30% —
19. Increased mathematics and science degrees awarded to • all students? (1991, 1995) 36% 39% !! 39% 42% !! 25-49% 15-53% 39% 42%• minority (Black, Hispanic, American Indian/Alaskan Native) students? (1991, 1995) 35% 36% !! 39% 40% !! 22-64% 22-57% 39% 39%• female students? (1991, 1995) 32% 32% ## 35% 37% !! 23-46% 13-47% 33% 36%
Mathematics and Science (continued)
Adult Literacy and Lifelong Learning
KEY
KEY
!! Significant progress
@@ Significant decline
## Change is not significant
Scorecards #1 (AL-MS) 10/30/97 10:12 AM Page 142

143
† Median is the middle score in a set of ranked scores.** Indicators are not the same at the national and state level.— Data not available. See Appendix A.• Baseline years and most recent update years may differ by state
for this indicator. See Appendix C for more information.See pages 72-75 for a Guide to Reading the State Pages.See Appendix C for technical notes and sources.
23. Reduced marijuana use? (1991, 1995) • — — ** ** 4-18% 7-32% 10% 23%24. Reduced alcohol use (more than 5 drinks in a row)? (1991, 1995) • — — ** ** 17-43% 13-43% 30% 31%25. Reduced availability of drugs on school property? (1993, 1995) • — — ** ** 11-31% 20-46% 22% 30%26. Reduced students threatened or injured with a weapon while on school property? (1993, 1995) • — — ** ** 6-15% 4-11% 8% 8%27. Reduced physical fights on school property? (1993, 1995) • — — ** ** 13-39% 12-19% 16% 15%28. Reduced students carrying weapons on school property? (1993, 1995) • — — ** ** 8-18% 7-14% 12% 11%29. Reduced students not feeling safe at school? (1993, 1995) • — — ** ** 3-23% 3-16% 6% 5%30. Reduced teacher victimization? (1994) 12% — 15% — 8-26% — 14% —31. Reduced student disruptions? (1991, 1994) 35% 42% ## 37% 46% @@ 23-60% 33-65% 37% 47%
32. Decreased schools with minimal parental involvement• Teacher’s perspective? (1991, 1994) 17% 18% ## ** ** 9-44% 13-50% 23% 27%• Principal’s perspective? (1991, 1994) 10% 8% ## ** ** 4-22% 3-27% 13% 13%
33. Increased influence of parent associations? (1991, 1994) 11% 15% ## ** ** 8-37% 12-50% 16% 22%
KANSAS
GOAL 7
GOAL 8
U.S.
baseline update progress?
Kansas
baseline update progress?
Range of State Scores
baseline update
MedianScores†
baseline update
Safe, Disciplined and Alcohol- and Drug-free Schools
Parental Participation
0% 20% 40% 60% 80% 100%
Establishingcurriculum
One ormore areas
Hiring newfull-timeteachers
Settingdiscipline
policy
1991 1994
11%
15%
7%
4%
2%
5%
11%
ns
ns
Parent-SchoolPartnershipsPercentage of public school principals whoreported that theparent associationhas influence1 onthe following areas(Indicator 33)
1 On a 6-point scale from no influence to a great deal of influence, defined asa response to the top two points.
nsInterpret with caution. Change was not statistically significant.
KEY
KEY
!! Significant progress
@@ Significant decline
## Change is not significant
Scorecards #1 (AL-MS) 10/30/97 10:12 AM Page 143

144
8. Increased reading achievement in Grade 4? (1992, 1994) • 23% 26% ## 29% 30% ## 8-38% 8-41% 26% 27%9. Increased mathematics achievement •
• in Grade 4? (1992, 1996) 13% 16% ## 18% 21% !! 5-27% 3-31% 16% 20%• in Grade 8? (1990, 1996) 10% 16% !! 15% 24% !! 1-27% 5-34% 15% 22%
10. Increased science achievement in Grade 8? (1996) 23% — 29% — 5-41% — 27% —
KENTUCKY
† Median is the middle score in a set of ranked scores.* Comparable national data are not available.— Data not available. See Appendix A.• Baseline years and most recent update years may differ by state
for this indicator. See Appendix C for more information.See pages 72-75 for a Guide to Reading the State Pages.See Appendix C for technical notes and sources.
GOAL 1
GOAL 2
GOAL 3
Kentucky
baseline update progress?
Range of State Scores
baseline update
MedianScores†
baseline update
U.S.
baseline update progress?
1. Reduced percentage of infants born in the state with 1 or more health risks? (1990, 1995) 45% 42% !! 37% 34% !! 25-48% 24-46% 38% 35%2. Increased percentage of 2-year-olds immunized? (1994, 1996) 80% 79% ## 75% 78% !! 61-88% 64-88% 76% 79%3. Reduced number of infants (per 1,000) born with low birthweight? (1990, 1995) 71 76 @@ 70 73 @@ 48-151 53-134 71 754. Increased number of mothers (per 1,000) receiving early prenatal care? (1990, 1995) 777 843 !! 758 813 !! 469-868 560-900 778 8285. Increased number of children with disabilities in preschool (per 1,000)? (1991, 1996) 68 92 !! * * 16-68 16-92 38 47
6. Increased high school completion rate? (1990, 1995) 82% 82% ## 86% 86% ## 77-96% 79-96% 87% 88%7. Reduced high school dropout rate? (1992, 1994) • — — * * 3-12% 3-10% 5% 5%
Ready to Learn
School Completion
Student Achievement and Citizenship
19951990
82%
100%
80%
60%
40%
20%
0%
82%
High School CompletionPercentage of all18- to 24-year-olds1
who have a highschool credential2(Indicator 6)
1 Does not include those still in high school.2 Includes traditional high school diploma and alternative credential.
0%
20%
40%
60%
80%
100%
19951990
45%42%
Children’sHealth IndexPercentage ofinfants born with 1or more healthrisks1 (Indicator 1)
1 Includes late (in third trimester) or no prenatal care, low maternal weightgain (less than 21 pounds), mother smoked during pregnancy, or motherdrank alcohol during pregnancy.
KEY
KEY
!! Significant progress
@@ Significant decline
## Change is not significant
Scorecards #1 (AL-MS) 10/30/97 10:12 AM Page 144

145
† Median is the middle score in a set of ranked scores.° See Table 8 for the numbers for each subject area.— Data not available. See Appendix A.∞ This information had not been released when the 1997 Goals Report
went to print.See pages 72-75 for a Guide to Reading the State Pages.See Appendix C for technical notes and sources.
11. Increased the number of Advanced Placement examinations receiving a grade of 3 or higher (per 1,000)? (1991, 1997)° 29 46 !! 55 85 !! 9-177 18-223 41 65
12. Increased the percentage of public secondary school teachers who hold • a degree in main teaching assignment? (1991, 1994) 65% 53% @@ 66% 63% @@ 51-85% 50-81% 69% 64%• a teaching certificate in main teaching assignment? (1991, 1994) 95% 94% ## 94% 93% @@ 91-100% 89-100% 98% 97%
13. Increased the percentage of public school teachers participating in professional development on 1 or more selected topics? (1994) 98% — 85% — 76-98% — 86% —
14. Increased the percentage of public school teachers with training to teach limited English-proficient students? (1994) 7% — 16% — 4-81% — 16% —
15. Increased the percentage of beginning public school teachers participating in a formal teacher induction program? (1991, 1994) 24% 34% !! 22% 27% !! 6-42% 7-48% 20% 23%
16. International comparisons in mathematics and science will be reported in future Goals Panel reports.∞ — — — — — — — —
KENTUCKY
GOAL 3
GOAL 4
GOAL 5
U.S.
baseline update progress?
Kentucky
baseline update progress?
Range of State Scores
baseline update
MedianScores†
baseline update
Student Achievement and Citizenship (continued)
Teacher Education and Professional Development
Mathematics and Science
ReadingGrade 4
MathematicsGrade 4
1996199219941992
100%
80%
60%
40%
20%
0%
26%23%
13%16%
ns
ns
Student AchievementPercentage of public school students who metthe Goals Panel’sperformancestandard1 in reading and mathematics (Indicators 8 & 9)
1 A complete description of the performance standard can be found inAppendix C.
nsInterpret with caution. Change was not statistically significant.
0 20
40
60
80
100
0% 20% 40% 60% 80% 100%
Uses ofeducationaltechnology
One ormore topics
Methods ofteaching
subject fieldIn-depthstudy in
subject field
Studentassessment
98%
75%
76%
37%
88%
Professional DevelopmentPercentage ofpublic schoolteachers partici-pating in profes-sional develop-ment on thefollowing topics,1994(Indicator 13)KEY
KEY
!! Significant progress
@@ Significant decline
## Change is not significant
Scorecards #1 (AL-MS) 10/30/97 10:12 AM Page 145

146
20. Increased adult literacy? (1992) — — 52% — 46-77% — 53% —21. Increased the percentage of U.S. citizens
• registered to vote? (1988, 1992) 63% 65% ## 70% 73% !! 58-95% 63-92% 71% 75%• voting? (1988, 1992) 50% 58% !! 61% 66% !! 50-74% 55-77% 62% 68%
22. Increased postsecondary enrollment? (1992, 1994) 50% 49% ❊ ** ** 33-68% 37-71% 53% 55%
KENTUCKY
† Median is the middle score in a set of ranked scores.— Data not available. See Appendix A.** Indicators are not the same at the national and state level.❊ Sample size does not permit a reliable estimate of change.See pages 72-75 for a Guide to Reading the State Pages.See Appendix C for technical notes and sources.
GOAL 5
GOAL 6
Kentucky
baseline update progress?
Range of State Scores
baseline update
MedianScores†
baseline update
U.S.
baseline update progress?
17. Increased the percentage of public school 8th graders whose mathematics teachers• have students work in small groups? (1996) 61% — 66% — 45-92% — 67% —• address Algebra and functions? (1996) 49% — 57% — 45-82% — 58% —• address reasoning and analytical ability? (1996) 49% — 52% — 39-64% — 48% —
18. Increased the percentage of public school 8th graders who have computers available in their mathematics classroom? (1996) 37% — 30% — 7-54% — 30% —
19. Increased mathematics and science degrees awarded to • all students? (1991, 1995) 36% 41% !! 39% 42% !! 25-49% 15-53% 39% 42%• minority (Black, Hispanic, American Indian/Alaskan Native) students? (1991, 1995) 33% 33% ## 39% 40% !! 22-64% 22-57% 39% 39%• female students? (1991, 1995) 31% 36% !! 35% 37% !! 23-46% 13-47% 33% 36%
Mathematics and Science (continued)
Adult Literacy and Lifelong Learning
Addressreasoning & analytical
ability
AddressAlgebra and functions
Work insmall groups
or with apartner
0% 20% 40% 60% 80% 100%
61%
49%
49%
1
2
2
MathematicsInstructionPercentage ofpublic school 8thgraders whosemathematicsteachers do thefollowing, 1996(Indicator 17)
KEY
KEY
!! Significant progress
@@ Significant decline
## Change is not significant
1 At least once a week.2 On a 4-point scale from “none” to “a lot,” defined as a response to the top point.
Scorecards #1 (AL-MS) 10/30/97 10:12 AM Page 146

147
† Median is the middle score in a set of ranked scores.** Indicators are not the same at the national and state level.— Data not available. See Appendix A.• Baseline years and most recent update years may differ by state
for this indicator. See Appendix C for more information.See pages 72-75 for a Guide to Reading the State Pages.See Appendix C for technical notes and sources.
23. Reduced marijuana use? (1991, 1995) • — — ** ** 4-18% 7-32% 10% 23%24. Reduced alcohol use (more than 5 drinks in a row)? (1991, 1995) • — — ** ** 17-43% 13-43% 30% 31%25. Reduced availability of drugs on school property? (1993, 1995) • — — ** ** 11-31% 20-46% 22% 30%26. Reduced students threatened or injured with a weapon while on school property? (1993, 1995) • — — ** ** 6-15% 4-11% 8% 8%27. Reduced physical fights on school property? (1993, 1995) • — — ** ** 13-39% 12-19% 16% 15%28. Reduced students carrying weapons on school property? (1993, 1995) • — — ** ** 8-18% 7-14% 12% 11%29. Reduced students not feeling safe at school? (1993, 1995) • — — ** ** 3-23% 3-16% 6% 5%30. Reduced teacher victimization? (1994) 15% — 15% — 8-26% — 14% —31. Reduced student disruptions? (1991, 1994) 39% 48% ## 37% 46% @@ 23-60% 33-65% 37% 47%
32. Decreased schools with minimal parental involvement• Teacher’s perspective? (1991, 1994) 32% 35% ## ** ** 9-44% 13-50% 23% 27%• Principal’s perspective? (1991, 1994) 15% 18% ## ** ** 4-22% 3-27% 13% 13%
33. Increased influence of parent associations? (1991, 1994) 17% 37% !! ** ** 8-37% 12-50% 16% 22%
KENTUCKY
GOAL 7
GOAL 8
U.S.
baseline update progress?
Kentucky
baseline update progress?
Range of State Scores
baseline update
MedianScores†
baseline update
Safe, Disciplined and Alcohol- and Drug-free Schools
Parental Participation
0% 20% 40% 60% 80% 100%
Establishingcurriculum
One ormore areas
Hiring newfull-timeteachers
Settingdiscipline
policy
1991 1994
17%
37%
8%
16%
19%
4%
13%
32%
ns
Parent-SchoolPartnershipsPercentage of public school principals whoreported that theparent associationhas influence1 onthe following areas(Indicator 33)
1 On a 6-point scale from no influence to a great deal of influence, defined asa response to the top two points.
nsInterpret with caution. Change was not statistically significant.
KEY
KEY
!! Significant progress
@@ Significant decline
## Change is not significant
Scorecards #1 (AL-MS) 10/30/97 10:12 AM Page 147

148
8. Increased reading achievement in Grade 4? (1992, 1994) • 15% 15% ## 29% 30% ## 8-38% 8-41% 26% 27%9. Increased mathematics achievement •
• in Grade 4? (1992, 1996) 8% 8% ## 18% 21% !! 5-27% 3-31% 16% 20%• in Grade 8? (1990, 1996) 5% 7% ## 15% 24% !! 1-27% 5-34% 15% 22%
10. Increased science achievement in Grade 8? (1996) 13% — 29% — 5-41% — 27% —
LOUISIANA
† Median is the middle score in a set of ranked scores.* Comparable national data are not available.— Data not available. See Appendix A.• Baseline years and most recent update years may differ by state
for this indicator. See Appendix C for more information.See pages 72-75 for a Guide to Reading the State Pages.See Appendix C for technical notes and sources.
GOAL 1
GOAL 2
GOAL 3
Louisiana
baseline update progress?
Range of State Scores
baseline update
MedianScores†
baseline update
U.S.
baseline update progress?
1. Reduced percentage of infants born in the state with 1 or more health risks? (1990, 1995) 39% 37% !! 37% 34% !! 25-48% 24-46% 38% 35%2. Increased percentage of 2-year-olds immunized? (1994, 1996) 71% 80% !! 75% 78% !! 61-88% 64-88% 76% 79%3. Reduced number of infants (per 1,000) born with low birthweight? (1990, 1995) 92 97 @@ 70 73 @@ 48-151 53-134 71 754. Increased number of mothers (per 1,000) receiving early prenatal care? (1990, 1995) 745 807 !! 758 813 !! 469-868 560-900 778 8285. Increased number of children with disabilities in preschool (per 1,000)? (1991, 1996) 32 47 !! * * 16-68 16-92 38 47
6. Increased high school completion rate? (1990, 1995) 81% 82% ## 86% 86% ## 77-96% 79-96% 87% 88%7. Reduced high school dropout rate? (1994) • 5% — * * 3-10% — 5% —
Ready to Learn
School Completion
Student Achievement and Citizenship
19951990
82%
100%
80%
60%
40%
20%
0%
81%ns
High School CompletionPercentage of all18- to 24-year-olds1
who have a highschool credential2(Indicator 6)
1 Does not include those still in high school.2 Includes traditional high school diploma and alternative credential.nsInterpret with caution. Change was not statistically significant.
0%
20%
40%
60%
80%
100%
19951990
37%39%
Children’sHealth IndexPercentage ofinfants born with 1or more healthrisks1 (Indicator 1)
1 Includes late (in third trimester) or no prenatal care, low maternal weightgain (less than 21 pounds), mother smoked during pregnancy, or motherdrank alcohol during pregnancy.
KEY
KEY
!! Significant progress
@@ Significant decline
## Change is not significant
Scorecards #1 (AL-MS) 10/30/97 10:12 AM Page 148

149
† Median is the middle score in a set of ranked scores.° See Table 8 for the numbers for each subject area.— Data not available. See Appendix A.∞ This information had not been released when the 1997 Goals Report
went to print.See pages 72-75 for a Guide to Reading the State Pages.See Appendix C for technical notes and sources.
11. Increased the number of Advanced Placement examinations receiving a grade of 3 or higher (per 1,000)? (1991, 1997)° 18 24 !! 55 85 !! 9-177 18-223 41 65
12. Increased the percentage of public secondary school teachers who hold • a degree in main teaching assignment? (1991, 1994) 51% 50% ## 66% 63% @@ 51-85% 50-81% 69% 64%• a teaching certificate in main teaching assignment? (1991, 1994) 96% 91% @@ 94% 93% @@ 91-100% 89-100% 98% 97%
13. Increased the percentage of public school teachers participating in professional development on 1 or more selected topics? (1994) 83% — 85% — 76-98% — 86% —
14. Increased the percentage of public school teachers with training to teach limited English-proficient students? (1994) 17% — 16% — 4-81% — 16% —
15. Increased the percentage of beginning public school teachers participating in a formal teacher induction program? (1991, 1994) 23% 24% ## 22% 27% !! 6-42% 7-48% 20% 23%
16. International comparisons in mathematics and science will be reported in future Goals Panel reports.∞ — — — — — — — —
LOUISIANA
GOAL 3
GOAL 4
GOAL 5
U.S.
baseline update progress?
Louisiana
baseline update progress?
Range of State Scores
baseline update
MedianScores†
baseline update
Student Achievement and Citizenship (continued)
Teacher Education and Professional Development
Mathematics and Science
ReadingGrade 4
MathematicsGrade 4
1996199219941992
100%
80%
60%
40%
20%
0%
15%15%
8% 8%
Student AchievementPercentage of public school students who metthe Goals Panel’sperformancestandard1 in reading and mathematics (Indicators 8 & 9)
1 A complete description of the performance standard can be found inAppendix C.
0 20
40
60
80
100
0% 20% 40% 60% 80% 100%
Uses ofeducationaltechnology
One ormore topics
Methods ofteaching
subject fieldIn-depthstudy in
subject field
Studentassessment
83%
41%
68%
29%
47%
Professional DevelopmentPercentage ofpublic schoolteachers partici-pating in profes-sional develop-ment on thefollowing topics,1994(Indicator 13)KEY
KEY
!! Significant progress
@@ Significant decline
## Change is not significant
Scorecards #1 (AL-MS) 10/30/97 10:12 AM Page 149
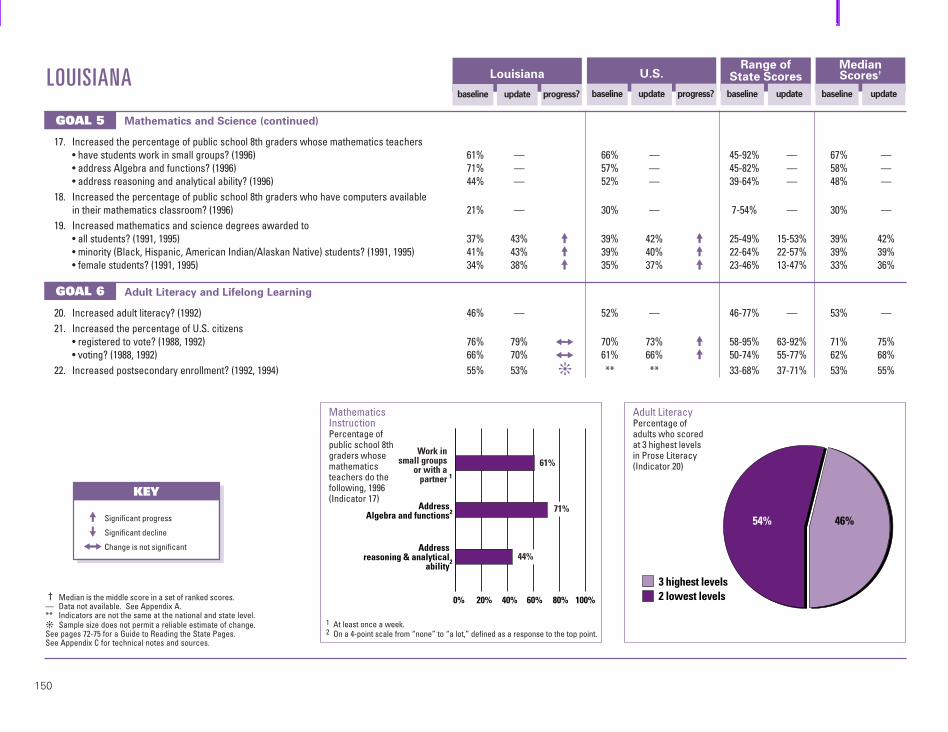
150
20. Increased adult literacy? (1992) 46% — 52% — 46-77% — 53% —21. Increased the percentage of U.S. citizens
• registered to vote? (1988, 1992) 76% 79% ## 70% 73% !! 58-95% 63-92% 71% 75%• voting? (1988, 1992) 66% 70% ## 61% 66% !! 50-74% 55-77% 62% 68%
22. Increased postsecondary enrollment? (1992, 1994) 55% 53% ❊ ** ** 33-68% 37-71% 53% 55%
LOUISIANA
† Median is the middle score in a set of ranked scores.— Data not available. See Appendix A.** Indicators are not the same at the national and state level.❊ Sample size does not permit a reliable estimate of change.See pages 72-75 for a Guide to Reading the State Pages.See Appendix C for technical notes and sources.
GOAL 5
GOAL 6
Louisiana
baseline update progress?
Range of State Scores
baseline update
MedianScores†
baseline update
U.S.
baseline update progress?
17. Increased the percentage of public school 8th graders whose mathematics teachers• have students work in small groups? (1996) 61% — 66% — 45-92% — 67% —• address Algebra and functions? (1996) 71% — 57% — 45-82% — 58% —• address reasoning and analytical ability? (1996) 44% — 52% — 39-64% — 48% —
18. Increased the percentage of public school 8th graders who have computers available in their mathematics classroom? (1996) 21% — 30% — 7-54% — 30% —
19. Increased mathematics and science degrees awarded to • all students? (1991, 1995) 37% 43% !! 39% 42% !! 25-49% 15-53% 39% 42%• minority (Black, Hispanic, American Indian/Alaskan Native) students? (1991, 1995) 41% 43% !! 39% 40% !! 22-64% 22-57% 39% 39%• female students? (1991, 1995) 34% 38% !! 35% 37% !! 23-46% 13-47% 33% 36%
Mathematics and Science (continued)
Adult Literacy and Lifelong Learning
Addressreasoning & analytical
ability
AddressAlgebra and functions
Work insmall groups
or with apartner
0% 20% 40% 60% 80% 100%
61%
44%
71%
1
2
2
MathematicsInstructionPercentage ofpublic school 8thgraders whosemathematicsteachers do thefollowing, 1996(Indicator 17)
46%54%
3 highest levels2 lowest levels
Adult LiteracyPercentage ofadults who scoredat 3 highest levelsin Prose Literacy(Indicator 20)
KEY
KEY
!! Significant progress
@@ Significant decline
## Change is not significant
1 At least once a week.2 On a 4-point scale from “none” to “a lot,” defined as a response to the top point.
Scorecards #1 (AL-MS) 10/30/97 10:12 AM Page 150

151
† Median is the middle score in a set of ranked scores.** Indicators are not the same at the national and state level.— Data not available. See Appendix A.• Baseline years and most recent update years may differ by state
for this indicator. See Appendix C for more information.See pages 72-75 for a Guide to Reading the State Pages.See Appendix C for technical notes and sources.
23. Reduced marijuana use? (1993) • 14% — ** ** 7-21% — 14% —24. Reduced alcohol use (more than 5 drinks in a row)? (1993) • 32% — ** ** 9-44% — 28% —25. Reduced availability of drugs on school property? (1993) • 22% — ** ** 11-31% — 22% —26. Reduced students threatened or injured with a weapon while on school property? (1993) • 10% — ** ** 6-15% — 8% —27. Reduced physical fights on school property? (1993) • 16% — ** ** 13-39% — 16% —28. Reduced students carrying weapons on school property? (1993) • 12% — ** ** 8-18% — 12% —29. Reduced students not feeling safe at school? (1993) • 7% — ** ** 3-23% — 6% —30. Reduced teacher victimization? (1994) 20% — 15% — 8-26% — 14% —31. Reduced student disruptions? (1991, 1994) 44% 47% ## 37% 46% @@ 23-60% 33-65% 37% 47%
32. Decreased schools with minimal parental involvement• Teacher’s perspective? (1991, 1994) 32% 38% ## ** ** 9-44% 13-50% 23% 27%• Principal’s perspective? (1991, 1994) 22% 24% ## ** ** 4-22% 3-27% 13% 13%
33. Increased influence of parent associations? (1991, 1994) 11% 12% ## ** ** 8-37% 12-50% 16% 22%
LOUISIANA
GOAL 7
GOAL 8
U.S.
baseline update progress?
Louisiana
baseline update progress?
Range of State Scores
baseline update
MedianScores†
baseline update
Safe, Disciplined and Alcohol- and Drug-free Schools
Parental Participation
Usedmarijuana
Had 5 ormore drinks
in a row
Were offered, sold,or given an illegal drug
on school property
1
1
2
0% 20% 40% 60% 80% 100%
1993
14%
32%
22%
Alcohol- andDrug-freeSchoolsPercentage ofpublic high schoolstudents whoreported the fol-lowing(Indicators 23,24, & 25)
1 During the past 30 days.2 During the past 12 months.
0% 20% 40% 60% 80% 100%
Establishingcurriculum
One ormore areas
Hiring newfull-timeteachers
Settingdiscipline
policy
1991 1994
11%
12%
5%
8%
2%
3%
6%
8%
ns
ns
ns
ns
Parent-SchoolPartnershipsPercentage of public school principals whoreported that theparent associationhas influence1 onthe following areas(Indicator 33)
1 On a 6-point scale from no influence to a great deal of influence, defined asa response to the top two points.
nsInterpret with caution. Change was not statistically significant.
KEY
KEY
!! Significant progress
@@ Significant decline
## Change is not significant
Scorecards #1 (AL-MS) 10/30/97 10:13 AM Page 151

152
8. Increased reading achievement in Grade 4? (1992, 1994) • 36% 41% ## 29% 30% ## 8-38% 8-41% 26% 27%9. Increased mathematics achievement •
• in Grade 4? (1992, 1996) 27% 27% ## 18% 21% !! 5-27% 3-31% 16% 20%• in Grade 8? (1992, 1996) 25% 31% ## 21% 24% ## 1-31% 5-34% 18% 22%
10. Increased science achievement in Grade 8? (1996) 41% — 29% — 5-41% — 27% —
MAINE
† Median is the middle score in a set of ranked scores.* Comparable national data are not available.— Data not available. See Appendix A.• Baseline years and most recent update years may differ by state
for this indicator. See Appendix C for more information.See pages 72-75 for a Guide to Reading the State Pages.See Appendix C for technical notes and sources.
GOAL 1
GOAL 2
GOAL 3
Maine
baseline update progress?
Range of State Scores
baseline update
MedianScores†
baseline update
U.S.
baseline update progress?
1. Reduced percentage of infants born in the state with 1 or more health risks? (1990, 1995) 35% 35% ## 37% 34% !! 25-48% 24-46% 38% 35%2. Increased percentage of 2-year-olds immunized? (1994, 1996) 82% 87% ## 75% 78% !! 61-88% 64-88% 76% 79%3. Reduced number of infants (per 1,000) born with low birthweight? (1990, 1995) 51 61 @@ 70 73 @@ 48-151 53-134 71 754. Increased number of mothers (per 1,000) receiving early prenatal care? (1990, 1995) 850 891 !! 758 813 !! 469-868 560-900 778 8285. Increased number of children with disabilities in preschool (per 1,000)? (1991, 1996) 54 72 !! * * 16-68 16-92 38 47
6. Increased high school completion rate? (1990, 1995) 91% 92% ## 86% 86% ## 77-96% 79-96% 87% 88%7. Reduced high school dropout rate? (1994) • 3% — * * 3-10% — 5% —
Ready to Learn
School Completion
Student Achievement and Citizenship
19951990
92%100%
80%
60%
40%
20%
0%
91%ns
High School CompletionPercentage of all18- to 24-year-olds1
who have a highschool credential2(Indicator 6)
1 Does not include those still in high school.2 Includes traditional high school diploma and alternative credential.nsInterpret with caution. Change was not statistically significant.
0%
20%
40%
60%
80%
100%
19951990
35%35%
Children’sHealth IndexPercentage ofinfants born with 1or more healthrisks1 (Indicator 1)
1 Includes late (in third trimester) or no prenatal care, low maternal weightgain (less than 21 pounds), mother smoked during pregnancy, or motherdrank alcohol during pregnancy.
KEY
KEY
!! Significant progress
@@ Significant decline
## Change is not significant
Scorecards #1 (AL-MS) 10/30/97 10:13 AM Page 152

153
† Median is the middle score in a set of ranked scores.° See Table 8 for the numbers for each subject area.— Data not available. See Appendix A.∞ This information had not been released when the 1997 Goals Report
went to print.See pages 72-75 for a Guide to Reading the State Pages.See Appendix C for technical notes and sources.
11. Increased the number of Advanced Placement examinations receiving a grade of 3 or higher (per 1,000)? (1991, 1997)° 38 79 !! 55 85 !! 9-177 18-223 41 65
12. Increased the percentage of public secondary school teachers who hold • a degree in main teaching assignment? (1991, 1994) 64% 59% ## 66% 63% @@ 51-85% 50-81% 69% 64%• a teaching certificate in main teaching assignment? (1991, 1994) 97% 95% ## 94% 93% @@ 91-100% 89-100% 98% 97%
13. Increased the percentage of public school teachers participating in professional development on 1 or more selected topics? (1994) 80% — 85% — 76-98% — 86% —
14. Increased the percentage of public school teachers with training to teach limited English-proficient students? (1994) 10% — 16% — 4-81% — 16% —
15. Increased the percentage of beginning public school teachers participating in a formal teacher induction program? (1991, 1994) 16% 21% ## 22% 27% !! 6-42% 7-48% 20% 23%
16. International comparisons in mathematics and science will be reported in future Goals Panel reports.∞ — — — — — — — —
MAINE
GOAL 3
GOAL 4
GOAL 5
U.S.
baseline update progress?
Maine
baseline update progress?
Range of State Scores
baseline update
MedianScores†
baseline update
Student Achievement and Citizenship (continued)
Teacher Education and Professional Development
Mathematics and Science
ReadingGrade 4
MathematicsGrade 4
1996199219941992
100%
80%
60%
40%
20%
0%
41%36%
27% 27%
ns
Student AchievementPercentage of public school students who metthe Goals Panel’sperformancestandard1 in reading and mathematics (Indicators 8 & 9)
1 A complete description of the performance standard can be found inAppendix C.
nsInterpret with caution. Change was not statistically significant.
0 20
40
60
80
100
0% 20% 40% 60% 80% 100%
Uses ofeducationaltechnology
One ormore topics
Methods ofteaching
subject fieldIn-depthstudy in
subject field
Studentassessment
80%
38%
59%
27%
50%
Professional DevelopmentPercentage ofpublic schoolteachers partici-pating in profes-sional develop-ment on thefollowing topics,1994(Indicator 13)KEY
KEY
!! Significant progress
@@ Significant decline
## Change is not significant
Scorecards #1 (AL-MS) 10/30/97 10:13 AM Page 153

154
20. Increased adult literacy? (1992) — — 52% — 46-77% — 53% —21. Increased the percentage of U.S. citizens
• registered to vote? (1988, 1992) 82% 86% !! 70% 73% !! 58-95% 63-92% 71% 75%• voting? (1988, 1992) 67% 75% !! 61% 66% !! 50-74% 55-77% 62% 68%
22. Increased postsecondary enrollment? (1992, 1994) 48% 50% ❊ ** ** 33-68% 37-71% 53% 55%
MAINE
† Median is the middle score in a set of ranked scores.— Data not available. See Appendix A.** Indicators are not the same at the national and state level.❊ Sample size does not permit a reliable estimate of change.See pages 72-75 for a Guide to Reading the State Pages.See Appendix C for technical notes and sources.
GOAL 5
GOAL 6
Maine
baseline update progress?
Range of State Scores
baseline update
MedianScores†
baseline update
U.S.
baseline update progress?
17. Increased the percentage of public school 8th graders whose mathematics teachers• have students work in small groups? (1996) 68% — 66% — 45-92% — 67% —• address Algebra and functions? (1996) 55% — 57% — 45-82% — 58% —• address reasoning and analytical ability? (1996) 48% — 52% — 39-64% — 48% —
18. Increased the percentage of public school 8th graders who have computers available in their mathematics classroom? (1996) 34% — 30% — 7-54% — 30% —
19. Increased mathematics and science degrees awarded to • all students? (1991, 1995) 49% 50% !! 39% 42% !! 25-49% 15-53% 39% 42%• minority (Black, Hispanic, American Indian/Alaskan Native) students? (1991, 1995) 64% 50% @@ 39% 40% !! 22-64% 22-57% 39% 39%• female students? (1991, 1995) 45% 45% ## 35% 37% !! 23-46% 13-47% 33% 36%
Mathematics and Science (continued)
Adult Literacy and Lifelong Learning
Addressreasoning & analytical
ability
AddressAlgebra and functions
Work insmall groups
or with apartner
0% 20% 40% 60% 80% 100%
68%
48%
55%
1
2
2
MathematicsInstructionPercentage ofpublic school 8thgraders whosemathematicsteachers do thefollowing, 1996(Indicator 17)
KEY
KEY
!! Significant progress
@@ Significant decline
## Change is not significant
1 At least once a week.2 On a 4-point scale from “none” to “a lot,” defined as a response to the top point.
Scorecards #1 (AL-MS) 10/30/97 10:13 AM Page 154

155
† Median is the middle score in a set of ranked scores.** Indicators are not the same at the national and state level.— Data not available. See Appendix A.• Baseline years and most recent update years may differ by state
for this indicator. See Appendix C for more information.See pages 72-75 for a Guide to Reading the State Pages.See Appendix C for technical notes and sources.
23. Reduced marijuana use? (1995) • 28% — ** ** 7-32% — 23% —24. Reduced alcohol use (more than 5 drinks in a row)? (1995) • 31% — ** ** 13-43% — 31% —25. Reduced availability of drugs on school property? (1995) • 36% — ** ** 20-46% — 30% —26. Reduced students threatened or injured with a weapon while on school property? (1995) • 7% — ** ** 4-11% — 8% —27. Reduced physical fights on school property? (1995) • 14% — ** ** 12-19% — 15% —28. Reduced students carrying weapons on school property? (1995) • 10% — ** ** 7-14% — 11% —29. Reduced students not feeling safe at school? (1995) • 3% — ** ** 3-16% — 5% —30. Reduced teacher victimization? (1994) 9% — 15% — 8-26% — 14% —31. Reduced student disruptions? (1991, 1994) 23% 40% @@ 37% 46% @@ 23-60% 33-65% 37% 47%
32. Decreased schools with minimal parental involvement• Teacher’s perspective? (1991, 1994) 21% 17% ## ** ** 9-44% 13-50% 23% 27%• Principal’s perspective? (1991, 1994) 10% 5% ## ** ** 4-22% 3-27% 13% 13%
33. Increased influence of parent associations? (1991, 1994) 12% 15% ## ** ** 8-37% 12-50% 16% 22%
MAINE
GOAL 7
GOAL 8
U.S.
baseline update progress?
Maine
baseline update progress?
Range of State Scores
baseline update
MedianScores†
baseline update
Safe, Disciplined and Alcohol- and Drug-free Schools
Parental Participation
Usedmarijuana
Had 5 ormore drinks
in a row
Were offered, sold,or given an illegal drug
on school property
1
1
2
0% 20% 40% 60% 80% 100%
1995
28%
31%
36%
Alcohol- andDrug-freeSchoolsPercentage ofpublic high schoolstudents whoreported the fol-lowing(Indicators 23,24, & 25)
1 During the past 30 days.2 During the past 12 months.
0% 20% 40% 60% 80% 100%
Establishingcurriculum
One ormore areas
Hiring newfull-timeteachers
Settingdiscipline
policy
1991 1994
12%
15%
11%
6%
5%
8%
ns
ns
Parent-SchoolPartnershipsPercentage of public school principals whoreported that theparent associationhas influence1 onthe following areas(Indicator 33)
1 On a 6-point scale from no influence to a great deal of influence, defined asa response to the top two points.
nsInterpret with caution. Change was not statistically significant.
KEY
KEY
!! Significant progress
@@ Significant decline
## Change is not significant
Scorecards #1 (AL-MS) 10/30/97 10:13 AM Page 155

156
8. Increased reading achievement in Grade 4? (1992, 1994) • 24% 26% ## 29% 30% ## 8-38% 8-41% 26% 27%9. Increased mathematics achievement •
• in Grade 4? (1992, 1996) 18% 22% ## 18% 21% !! 5-27% 3-31% 16% 20%• in Grade 8? (1990, 1996) 17% 24% !! 15% 24% !! 1-27% 5-34% 15% 22%
10. Increased science achievement in Grade 8? (1996) 25% — 29% — 5-41% — 27% —
MARYLAND
† Median is the middle score in a set of ranked scores.* Comparable national data are not available.— Data not available. See Appendix A.• Baseline years and most recent update years may differ by state
for this indicator. See Appendix C for more information.See pages 72-75 for a Guide to Reading the State Pages.See Appendix C for technical notes and sources.
GOAL 1
GOAL 2
GOAL 3
Maryland
baseline update progress?
Range of State Scores
baseline update
MedianScores†
baseline update
U.S.
baseline update progress?
1. Reduced percentage of infants born in the state with 1 or more health risks? (1990, 1995) 31% 29% !! 37% 34% !! 25-48% 24-46% 38% 35%2. Increased percentage of 2-year-olds immunized? (1994, 1996) 79% 80% ## 75% 78% !! 61-88% 64-88% 76% 79%3. Reduced number of infants (per 1,000) born with low birthweight? (1990, 1995) 78 85 @@ 70 73 @@ 48-151 53-134 71 754. Increased number of mothers (per 1,000) receiving early prenatal care? (1990, 1995) 835 879 !! 758 813 !! 469-868 560-900 778 8285. Increased number of children with disabilities in preschool (per 1,000)? (1991, 1996) 34 41 !! * * 16-68 16-92 38 47
6. Increased high school completion rate? (1990, 1995) 87% 93% !! 86% 86% ## 77-96% 79-96% 87% 88%7. Reduced high school dropout rate? (1992, 1994) • — — * * 3-12% 3-10% 5% 5%
Ready to Learn
School Completion
Student Achievement and Citizenship
19951990
93%100%
80%
60%
40%
20%
0%
87%
High School CompletionPercentage of all18- to 24-year-olds1
who have a highschool credential2(Indicator 6)
1 Does not include those still in high school.2 Includes traditional high school diploma and alternative credential.
0%
20%
40%
60%
80%
100%
19951990
29%31%
Children’sHealth IndexPercentage ofinfants born with 1or more healthrisks1 (Indicator 1)
1 Includes late (in third trimester) or no prenatal care, low maternal weightgain (less than 21 pounds), mother smoked during pregnancy, or motherdrank alcohol during pregnancy.
KEY
KEY
!! Significant progress
@@ Significant decline
## Change is not significant
Scorecards #1 (AL-MS) 10/30/97 10:13 AM Page 156

157
† Median is the middle score in a set of ranked scores.° See Table 8 for the numbers for each subject area.— Data not available. See Appendix A.∞ This information had not been released when the 1997 Goals Report
went to print.See pages 72-75 for a Guide to Reading the State Pages.See Appendix C for technical notes and sources.
11. Increased the number of Advanced Placement examinations receiving a grade of 3 or higher (per 1,000)? (1991, 1997)° 90 131 !! 55 85 !! 9-177 18-223 41 65
12. Increased the percentage of public secondary school teachers who hold • a degree in main teaching assignment? (1991, 1994) 70% 72% ## 66% 63% @@ 51-85% 50-81% 69% 64%• a teaching certificate in main teaching assignment? (1991, 1994) 96% 95% ## 94% 93% @@ 91-100% 89-100% 98% 97%
13. Increased the percentage of public school teachers participating in professional development on 1 or more selected topics? (1994) 84% — 85% — 76-98% — 86% —
14. Increased the percentage of public school teachers with training to teach limited English-proficient students? (1994) 16% — 16% — 4-81% — 16% —
15. Increased the percentage of beginning public school teachers participating in a formal teacher induction program? (1991, 1994) 32% 28% ## 22% 27% !! 6-42% 7-48% 20% 23%
16. International comparisons in mathematics and science will be reported in future Goals Panel reports.∞ — — — — — — — —
MARYLAND
GOAL 3
GOAL 4
GOAL 5
U.S.
baseline update progress?
Maryland
baseline update progress?
Range of State Scores
baseline update
MedianScores†
baseline update
Student Achievement and Citizenship (continued)
Teacher Education and Professional Development
Mathematics and Science
ReadingGrade 4
MathematicsGrade 4
1996199219941992
100%
80%
60%
40%
20%
0%
26%24%18%
22%
nsns
Student AchievementPercentage of public school students who metthe Goals Panel’sperformancestandard1 in reading and mathematics (Indicators 8 & 9)
1 A complete description of the performance standard can be found inAppendix C.
nsInterpret with caution. Change was not statistically significant.
0% 20% 40% 60% 80% 100%
Uses ofeducationaltechnology
One ormore topics
Methods ofteaching
subject fieldIn-depthstudy in
subject field
Studentassessment
84%
49%
65%
24%
56%
Professional DevelopmentPercentage ofpublic schoolteachers partici-pating in profes-sional develop-ment on thefollowing topics,1994(Indicator 13)KEY
KEY
!! Significant progress
@@ Significant decline
## Change is not significant
Scorecards #1 (AL-MS) 10/30/97 10:13 AM Page 157

158
20. Increased adult literacy? (1992) — — 52% — 46-77% — 53% —21. Increased the percentage of U.S. citizens
• registered to vote? (1988, 1992) 67% 76% !! 70% 73% !! 58-95% 63-92% 71% 75%• voting? (1988, 1992) 57% 70% !! 61% 66% !! 50-74% 55-77% 62% 68%
22. Increased postsecondary enrollment? (1992, 1994) 55% 55% ❊ ** ** 33-68% 37-71% 53% 55%
MARYLAND
† Median is the middle score in a set of ranked scores.— Data not available. See Appendix A.** Indicators are not the same at the national and state level.❊ Sample size does not permit a reliable estimate of change.See pages 72-75 for a Guide to Reading the State Pages.See Appendix C for technical notes and sources.
GOAL 5
GOAL 6
Maryland
baseline update progress?
Range of State Scores
baseline update
MedianScores†
baseline update
U.S.
baseline update progress?
17. Increased the percentage of public school 8th graders whose mathematics teachers• have students work in small groups? (1996) 70% — 66% — 45-92% — 67% —• address Algebra and functions? (1996) 59% — 57% — 45-82% — 58% —• address reasoning and analytical ability? (1996) 46% — 52% — 39-64% — 48% —
18. Increased the percentage of public school 8th graders who have computers available in their mathematics classroom? (1996) 13% — 30% — 7-54% — 30% —
19. Increased mathematics and science degrees awarded to • all students? (1991, 1995) 43% 46% !! 39% 42% !! 25-49% 15-53% 39% 42%• minority (Black, Hispanic, American Indian/Alaskan Native) students? (1991, 1995) 40% 43% !! 39% 40% !! 22-64% 22-57% 39% 39%• female students? (1991, 1995) 38% 40% !! 35% 37% !! 23-46% 13-47% 33% 36%
Mathematics and Science (continued)
Adult Literacy and Lifelong Learning
Addressreasoning & analytical
ability
AddressAlgebra and functions
Work insmall groups
or with apartner
0% 20% 40% 60% 80% 100%
70%
46%
59%
1
2
2
MathematicsInstructionPercentage ofpublic school 8thgraders whosemathematicsteachers do thefollowing, 1996(Indicator 17)
KEY
KEY
!! Significant progress
@@ Significant decline
## Change is not significant
1 At least once a week.2 On a 4-point scale from “none” to “a lot,” defined as a response to the top point.
Scorecards #1 (AL-MS) 10/30/97 10:13 AM Page 158

159
† Median is the middle score in a set of ranked scores.** Indicators are not the same at the national and state level.— Data not available. See Appendix A.• Baseline years and most recent update years may differ by state
for this indicator. See Appendix C for more information.See pages 72-75 for a Guide to Reading the State Pages.See Appendix C for technical notes and sources.
23. Reduced marijuana use? (1991, 1995) • — — ** ** 4-18% 7-32% 10% 23%24. Reduced alcohol use (more than 5 drinks in a row)? (1991, 1995) • — — ** ** 17-43% 13-43% 30% 31%25. Reduced availability of drugs on school property? (1993, 1995) • — — ** ** 11-31% 20-46% 22% 30%26. Reduced students threatened or injured with a weapon while on school property? (1993, 1995) • — — ** ** 6-15% 4-11% 8% 8%27. Reduced physical fights on school property? (1993, 1995) • — — ** ** 13-39% 12-19% 16% 15%28. Reduced students carrying weapons on school property? (1993, 1995) • — — ** ** 8-18% 7-14% 12% 11%29. Reduced students not feeling safe at school? (1993, 1995) • — — ** ** 3-23% 3-16% 6% 5%30. Reduced teacher victimization? (1994) 23% — 15% — 8-26% — 14% —31. Reduced student disruptions? (1991, 1994) 47% 62% @@ 37% 46% @@ 23-60% 33-65% 37% 47%
32. Decreased schools with minimal parental involvement• Teacher’s perspective? (1991, 1994) 28% 29% ## ** ** 9-44% 13-50% 23% 27%• Principal’s perspective? (1991, 1994) 11% 14% ## ** ** 4-22% 3-27% 13% 13%
33. Increased influence of parent associations? (1991, 1994) 20% 22% ## ** ** 8-37% 12-50% 16% 22%
MARYLAND
GOAL 7
GOAL 8
U.S.
baseline update progress?
Maryland
baseline update progress?
Range of State Scores
baseline update
MedianScores†
baseline update
Safe, Disciplined and Alcohol- and Drug-free Schools
Parental Participation
0% 20% 40% 60% 80% 100%
Establishingcurriculum
One ormore areas
Hiring newfull-timeteachers
Settingdiscipline
policy
1991 1994
20%
22%
8%
11%
4%
4%
18%
11%
ns
ns
ns
Parent-SchoolPartnershipsPercentage of public school principals whoreported that theparent associationhas influence1 onthe following areas(Indicator 33)
1 On a 6-point scale from no influence to a great deal of influence, defined asa response to the top two points.
nsInterpret with caution. Change was not statistically significant.
KEY
KEY
!! Significant progress
@@ Significant decline
## Change is not significant
Scorecards #1 (AL-MS) 10/30/97 10:13 AM Page 159

160
8. Increased reading achievement in Grade 4? (1992, 1994) • 36% 36% ## 29% 30% ## 8-38% 8-41% 26% 27%9. Increased mathematics achievement •
• in Grade 4? (1992, 1996) 23% 24% ## 18% 21% !! 5-27% 3-31% 16% 20%• in Grade 8? (1992, 1996) 23% 28% ## 21% 24% ## 1-31% 5-34% 18% 22%
10. Increased science achievement in Grade 8? (1996) 37% — 29% — 5-41% — 27% —
MASSACHUSETTS
† Median is the middle score in a set of ranked scores.* Comparable national data are not available.— Data not available. See Appendix A.• Baseline years and most recent update years may differ by state
for this indicator. See Appendix C for more information.See pages 72-75 for a Guide to Reading the State Pages.See Appendix C for technical notes and sources.
GOAL 1
GOAL 2
GOAL 3
Massachusetts
baseline update progress?
Range of State Scores
baseline update
MedianScores†
baseline update
U.S.
baseline update progress?
1. Reduced percentage of infants born in the state with 1 or more health risks? (1990, 1995) 42% 31% !! 37% 34% !! 25-48% 24-46% 38% 35%2. Increased percentage of 2-year-olds immunized? (1994, 1996) 82% 87% ## 75% 78% !! 61-88% 64-88% 76% 79%3. Reduced number of infants (per 1,000) born with low birthweight? (1990, 1995) 59 63 @@ 70 73 @@ 48-151 53-134 71 754. Increased number of mothers (per 1,000) receiving early prenatal care? (1990, 1995) 843 893 !! 758 813 !! 469-868 560-900 778 8285. Increased number of children with disabilities in preschool (per 1,000)? (1991, 1996) 50 55 !! * * 16-68 16-92 38 47
6. Increased high school completion rate? (1990, 1995) 90% 92% ## 86% 86% ## 77-96% 79-96% 87% 88%7. Reduced high school dropout rate? (1992, 1994) • 3% 4% @@ * * 3-12% 3-10% 5% 5%
Ready to Learn
School Completion
Student Achievement and Citizenship
19951990
92%100%
80%
60%
40%
20%
0%
90%ns
High School CompletionPercentage of all18- to 24-year-olds1
who have a highschool credential2(Indicator 6)
1 Does not include those still in high school.2 Includes traditional high school diploma and alternative credential.nsInterpret with caution. Change was not statistically significant.
0%
20%
40%
60%
80%
100%
19951990
31%
42%
Children’sHealth IndexPercentage ofinfants born with 1or more healthrisks1 (Indicator 1)
1 Includes late (in third trimester) or no prenatal care, low maternal weightgain (less than 21 pounds), mother smoked during pregnancy, or motherdrank alcohol during pregnancy.
KEY
KEY
!! Significant progress
@@ Significant decline
## Change is not significant
Scorecards #1 (AL-MS) 10/30/97 10:13 AM Page 160

161
† Median is the middle score in a set of ranked scores.° See Table 8 for the numbers for each subject area.— Data not available. See Appendix A.∞ This information had not been released when the 1997 Goals Report
went to print.See pages 72-75 for a Guide to Reading the State Pages.See Appendix C for technical notes and sources.
11. Increased the number of Advanced Placement examinations receiving a grade of 3 or higher (per 1,000)? (1991, 1997)° 82 136 !! 55 85 !! 9-177 18-223 41 65
12. Increased the percentage of public secondary school teachers who hold • a degree in main teaching assignment? (1991, 1994) 69% 72% ## 66% 63% @@ 51-85% 50-81% 69% 64%• a teaching certificate in main teaching assignment? (1991, 1994) 97% 94% @@ 94% 93% @@ 91-100% 89-100% 98% 97%
13. Increased the percentage of public school teachers participating in professional development on 1 or more selected topics? (1994) 82% — 85% — 76-98% — 86% —
14. Increased the percentage of public school teachers with training to teach limited English-proficient students? (1994) 18% — 16% — 4-81% — 16% —
15. Increased the percentage of beginning public school teachers participating in a formal teacher induction program? (1991, 1994) 14% 13% ## 22% 27% !! 6-42% 7-48% 20% 23%
16. International comparisons in mathematics and science will be reported in future Goals Panel reports.∞ — — — — — — — —
MASSACHUSETTS
GOAL 3
GOAL 4
GOAL 5
U.S.
baseline update progress?
Massachusetts
baseline update progress?
Range of State Scores
baseline update
MedianScores†
baseline update
Student Achievement and Citizenship (continued)
Teacher Education and Professional Development
Mathematics and Science
ReadingGrade 4
MathematicsGrade 4
1996199219941992
100%
80%
60%
40%
20%
0%
36%36%
23% 24%ns
Student AchievementPercentage of public school students who metthe Goals Panel’sperformancestandard1 in reading and mathematics (Indicators 8 & 9)
1 A complete description of the performance standard can be found inAppendix C.
nsInterpret with caution. Change was not statistically significant.0 2
0
40
60
80
100
0% 20% 40% 60% 80% 100%
Uses ofeducationaltechnology
One ormore topics
Methods ofteaching
subject fieldIn-depthstudy in
subject field
Studentassessment
82%
43%
63%
31%
45%
Professional DevelopmentPercentage ofpublic schoolteachers partici-pating in profes-sional develop-ment on thefollowing topics,1994(Indicator 13)KEY
KEY
!! Significant progress
@@ Significant decline
## Change is not significant
Scorecards #1 (AL-MS) 10/30/97 10:13 AM Page 161

162
20. Increased adult literacy? (1992) — — 52% — 46-77% — 53% —21. Increased the percentage of U.S. citizens
• registered to vote? (1988, 1992) 74% 77% !! 70% 73% !! 58-95% 63-92% 71% 75%• voting? (1988, 1992) 67% 70% !! 61% 66% !! 50-74% 55-77% 62% 68%
22. Increased postsecondary enrollment? (1992, 1994) 60% 65% ❊ ** ** 33-68% 37-71% 53% 55%
MASSACHUSETTS
† Median is the middle score in a set of ranked scores.— Data not available. See Appendix A.** Indicators are not the same at the national and state level.❊ Sample size does not permit a reliable estimate of change.See pages 72-75 for a Guide to Reading the State Pages.See Appendix C for technical notes and sources.
GOAL 5
GOAL 6
Massachusetts
baseline update progress?
Range of State Scores
baseline update
MedianScores†
baseline update
U.S.
baseline update progress?
17. Increased the percentage of public school 8th graders whose mathematics teachers• have students work in small groups? (1996) 65% — 66% — 45-92% — 67% —• address Algebra and functions? (1996) 68% — 57% — 45-82% — 58% —• address reasoning and analytical ability? (1996) 60% — 52% — 39-64% — 48% —
18. Increased the percentage of public school 8th graders who have computers available in their mathematics classroom? (1996) 23% — 30% — 7-54% — 30% —
19. Increased mathematics and science degrees awarded to • all students? (1991, 1995) 46% 49% !! 39% 42% !! 25-49% 15-53% 39% 42%• minority (Black, Hispanic, American Indian/Alaskan Native) students? (1991, 1995) 51% 54% !! 39% 40% !! 22-64% 22-57% 39% 39%• female students? (1991, 1995) 43% 44% !! 35% 37% !! 23-46% 13-47% 33% 36%
Mathematics and Science (continued)
Adult Literacy and Lifelong Learning
Addressreasoning & analytical
ability
AddressAlgebra and functions
Work insmall groups
or with apartner
0% 20% 40% 60% 80% 100%
65%
60%
68%
1
2
2
MathematicsInstructionPercentage ofpublic school 8thgraders whosemathematicsteachers do thefollowing, 1996(Indicator 17)
KEY
KEY
!! Significant progress
@@ Significant decline
## Change is not significant
1 At least once a week.2 On a 4-point scale from “none” to “a lot,” defined as a response to the top point.
Scorecards #1 (AL-MS) 10/30/97 10:13 AM Page 162
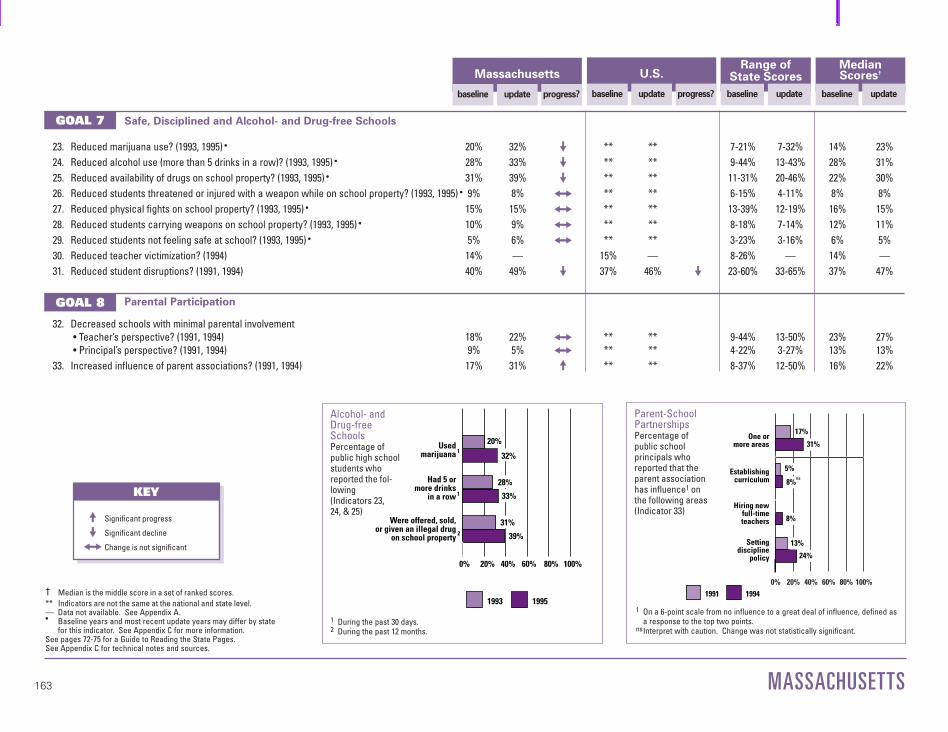
163
† Median is the middle score in a set of ranked scores.** Indicators are not the same at the national and state level.— Data not available. See Appendix A.• Baseline years and most recent update years may differ by state
for this indicator. See Appendix C for more information.See pages 72-75 for a Guide to Reading the State Pages.See Appendix C for technical notes and sources.
23. Reduced marijuana use? (1993, 1995) • 20% 32% @@ ** ** 7-21% 7-32% 14% 23%24. Reduced alcohol use (more than 5 drinks in a row)? (1993, 1995) • 28% 33% @@ ** ** 9-44% 13-43% 28% 31%25. Reduced availability of drugs on school property? (1993, 1995) • 31% 39% @@ ** ** 11-31% 20-46% 22% 30%26. Reduced students threatened or injured with a weapon while on school property? (1993, 1995) • 9% 8% ## ** ** 6-15% 4-11% 8% 8%27. Reduced physical fights on school property? (1993, 1995) • 15% 15% ## ** ** 13-39% 12-19% 16% 15%28. Reduced students carrying weapons on school property? (1993, 1995) • 10% 9% ## ** ** 8-18% 7-14% 12% 11%29. Reduced students not feeling safe at school? (1993, 1995) • 5% 6% ## ** ** 3-23% 3-16% 6% 5%30. Reduced teacher victimization? (1994) 14% — 15% — 8-26% — 14% —31. Reduced student disruptions? (1991, 1994) 40% 49% @@ 37% 46% @@ 23-60% 33-65% 37% 47%
32. Decreased schools with minimal parental involvement• Teacher’s perspective? (1991, 1994) 18% 22% ## ** ** 9-44% 13-50% 23% 27%• Principal’s perspective? (1991, 1994) 9% 5% ## ** ** 4-22% 3-27% 13% 13%
33. Increased influence of parent associations? (1991, 1994) 17% 31% !! ** ** 8-37% 12-50% 16% 22%
MASSACHUSETTS
GOAL 7
GOAL 8
U.S.
baseline update progress?
Massachusetts
baseline update progress?
Range of State Scores
baseline update
MedianScores†
baseline update
Safe, Disciplined and Alcohol- and Drug-free Schools
Parental Participation
Usedmarijuana
Had 5 ormore drinks
in a row
Were offered, sold,or given an illegal drug
on school property
1
1
2
0% 20% 40% 60% 80% 100%
1993 1995
32%
20%
28%
33%
31%
39%
Alcohol- andDrug-freeSchoolsPercentage ofpublic high schoolstudents whoreported the fol-lowing(Indicators 23,24, & 25)
1 During the past 30 days.2 During the past 12 months.
0% 20% 40% 60% 80% 100%
Establishingcurriculum
One ormore areas
Hiring newfull-timeteachers
Settingdiscipline
policy
1991 1994
17%
31%
5%
8%
8%
24%
13%
ns
Parent-SchoolPartnershipsPercentage of public school principals whoreported that theparent associationhas influence1 onthe following areas(Indicator 33)
1 On a 6-point scale from no influence to a great deal of influence, defined asa response to the top two points.
nsInterpret with caution. Change was not statistically significant.
KEY
KEY
!! Significant progress
@@ Significant decline
## Change is not significant
Scorecards #1 (AL-MS) 10/30/97 10:13 AM Page 163

164
8. Increased reading achievement in Grade 4? (1992) • 26% — 29% — 8-38% — 26% —9. Increased mathematics achievement •
• in Grade 4? (1992, 1996) 18% 23% ## 18% 21% !! 5-27% 3-31% 16% 20%• in Grade 8? (1990, 1996) 16% 28% !! 15% 24% !! 1-27% 5-34% 15% 22%
10. Increased science achievement in Grade 8? (1996) 32% — 29% — 5-41% — 27% —
MICHIGAN
† Median is the middle score in a set of ranked scores.* Comparable national data are not available.— Data not available. See Appendix A.• Baseline years and most recent update years may differ by state
for this indicator. See Appendix C for more information.See pages 72-75 for a Guide to Reading the State Pages.See Appendix C for technical notes and sources.
GOAL 1
GOAL 2
GOAL 3
Michigan
baseline update progress?
Range of State Scores
baseline update
MedianScores†
baseline update
U.S.
baseline update progress?
1. Reduced percentage of infants born in the state with 1 or more health risks? (1990, 1995) 38% 37% !! 37% 34% !! 25-48% 24-46% 38% 35%2. Increased percentage of 2-year-olds immunized? (1994, 1996) 61% 76% !! 75% 78% !! 61-88% 64-88% 76% 79%3. Reduced number of infants (per 1,000) born with low birthweight? (1990, 1995) 76 77 @@ 70 73 @@ 48-151 53-134 71 754. Increased number of mothers (per 1,000) receiving early prenatal care? (1990, 1995) 794 836 !! 758 813 !! 469-868 560-900 778 8285. Increased number of children with disabilities in preschool (per 1,000)? (1991, 1996) 34 42 !! * * 16-68 16-92 38 47
6. Increased high school completion rate? (1990, 1995) 86% 89% !! 86% 86% ## 77-96% 79-96% 87% 88%7. Reduced high school dropout rate? (1992, 1994) • — — * * 3-12% 3-10% 5% 5%
Ready to Learn
School Completion
Student Achievement and Citizenship
19951990
89%100%
80%
60%
40%
20%
0%
86%
High School CompletionPercentage of all18- to 24-year-olds1
who have a highschool credential2(Indicator 6)
1 Does not include those still in high school.2 Includes traditional high school diploma and alternative credential.
0%
20%
40%
60%
80%
100%
19951990
37%38%
Children’sHealth IndexPercentage ofinfants born with 1or more healthrisks1 (Indicator 1)
1 Includes late (in third trimester) or no prenatal care, low maternal weightgain (less than 21 pounds), mother smoked during pregnancy, or motherdrank alcohol during pregnancy.
KEY
KEY
!! Significant progress
@@ Significant decline
## Change is not significant
Scorecards #1 (AL-MS) 10/30/97 10:13 AM Page 164
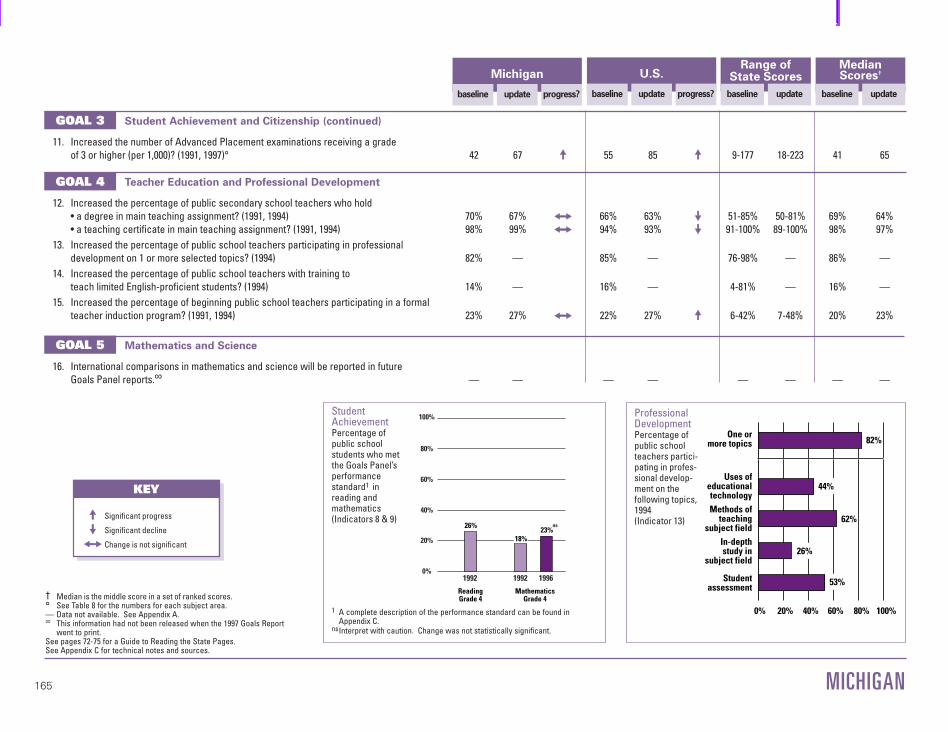
165
† Median is the middle score in a set of ranked scores.° See Table 8 for the numbers for each subject area.— Data not available. See Appendix A.∞ This information had not been released when the 1997 Goals Report
went to print.See pages 72-75 for a Guide to Reading the State Pages.See Appendix C for technical notes and sources.
11. Increased the number of Advanced Placement examinations receiving a grade of 3 or higher (per 1,000)? (1991, 1997)° 42 67 !! 55 85 !! 9-177 18-223 41 65
12. Increased the percentage of public secondary school teachers who hold • a degree in main teaching assignment? (1991, 1994) 70% 67% ## 66% 63% @@ 51-85% 50-81% 69% 64%• a teaching certificate in main teaching assignment? (1991, 1994) 98% 99% ## 94% 93% @@ 91-100% 89-100% 98% 97%
13. Increased the percentage of public school teachers participating in professional development on 1 or more selected topics? (1994) 82% — 85% — 76-98% — 86% —
14. Increased the percentage of public school teachers with training to teach limited English-proficient students? (1994) 14% — 16% — 4-81% — 16% —
15. Increased the percentage of beginning public school teachers participating in a formal teacher induction program? (1991, 1994) 23% 27% ## 22% 27% !! 6-42% 7-48% 20% 23%
16. International comparisons in mathematics and science will be reported in future Goals Panel reports.∞ — — — — — — — —
MICHIGAN
GOAL 3
GOAL 4
GOAL 5
U.S.
baseline update progress?
Michigan
baseline update progress?
Range of State Scores
baseline update
MedianScores†
baseline update
Student Achievement and Citizenship (continued)
Teacher Education and Professional Development
Mathematics and Science
ReadingGrade 4
MathematicsGrade 4
199619921992
100%
80%
60%
40%
20%
0%
26%
18%23%
ns
Student AchievementPercentage of public school students who metthe Goals Panel’sperformancestandard1 in reading and mathematics (Indicators 8 & 9)
1 A complete description of the performance standard can be found inAppendix C.
nsInterpret with caution. Change was not statistically significant.
0 20
40
60
80
100
0% 20% 40% 60% 80% 100%
Uses ofeducationaltechnology
One ormore topics
Methods ofteaching
subject fieldIn-depthstudy in
subject field
Studentassessment
82%
44%
62%
26%
53%
Professional DevelopmentPercentage ofpublic schoolteachers partici-pating in profes-sional develop-ment on thefollowing topics,1994(Indicator 13)KEY
KEY
!! Significant progress
@@ Significant decline
## Change is not significant
Scorecards #1 (AL-MS) 10/30/97 10:13 AM Page 165

166
20. Increased adult literacy? (1992) — — 52% — 46-77% — 53% —21. Increased the percentage of U.S. citizens
• registered to vote? (1988, 1992) 74% 77% !! 70% 73% !! 58-95% 63-92% 71% 75%• voting? (1988, 1992) 61% 68% !! 61% 66% !! 50-74% 55-77% 62% 68%
22. Increased postsecondary enrollment? (1992, 1994) 59% 60% ❊ ** ** 33-68% 37-71% 53% 55%
MICHIGAN
† Median is the middle score in a set of ranked scores.— Data not available. See Appendix A.** Indicators are not the same at the national and state level.❊ Sample size does not permit a reliable estimate of change.See pages 72-75 for a Guide to Reading the State Pages.See Appendix C for technical notes and sources.
GOAL 5
GOAL 6
Michigan
baseline update progress?
Range of State Scores
baseline update
MedianScores†
baseline update
U.S.
baseline update progress?
17. Increased the percentage of public school 8th graders whose mathematics teachers• have students work in small groups? (1996) 75% — 66% — 45-92% — 67% —• address Algebra and functions? (1996) 62% — 57% — 45-82% — 58% —• address reasoning and analytical ability? (1996) 48% — 52% — 39-64% — 48% —
18. Increased the percentage of public school 8th graders who have computers available in their mathematics classroom? (1996) 27% — 30% — 7-54% — 30% —
19. Increased mathematics and science degrees awarded to • all students? (1991, 1995) 40% 42% !! 39% 42% !! 25-49% 15-53% 39% 42%• minority (Black, Hispanic, American Indian/Alaskan Native) students? (1991, 1995) 39% 37% @@ 39% 40% !! 22-64% 22-57% 39% 39%• female students? (1991, 1995) 35% 35% ## 35% 37% !! 23-46% 13-47% 33% 36%
Mathematics and Science (continued)
Adult Literacy and Lifelong Learning
Addressreasoning & analytical
ability
AddressAlgebra and functions
Work insmall groups
or with apartner
0% 20% 40% 60% 80% 100%
75%
48%
62%
1
2
2
MathematicsInstructionPercentage ofpublic school 8thgraders whosemathematicsteachers do thefollowing, 1996(Indicator 17)
KEY
KEY
!! Significant progress
@@ Significant decline
## Change is not significant
1 At least once a week.2 On a 4-point scale from “none” to “a lot,” defined as a response to the top point.
Scorecards #1 (AL-MS) 10/30/97 10:13 AM Page 166

167
† Median is the middle score in a set of ranked scores.** Indicators are not the same at the national and state level.— Data not available. See Appendix A.• Baseline years and most recent update years may differ by state
for this indicator. See Appendix C for more information.See pages 72-75 for a Guide to Reading the State Pages.See Appendix C for technical notes and sources.
23. Reduced marijuana use? (1991, 1995) • — — ** ** 4-18% 7-32% 10% 23%24. Reduced alcohol use (more than 5 drinks in a row)? (1991, 1995) • — — ** ** 17-43% 13-43% 30% 31%25. Reduced availability of drugs on school property? (1993, 1995) • — — ** ** 11-31% 20-46% 22% 30%26. Reduced students threatened or injured with a weapon while on school property? (1993, 1995) • — — ** ** 6-15% 4-11% 8% 8%27. Reduced physical fights on school property? (1993, 1995) • — — ** ** 13-39% 12-19% 16% 15%28. Reduced students carrying weapons on school property? (1993, 1995) • — — ** ** 8-18% 7-14% 12% 11%29. Reduced students not feeling safe at school? (1993, 1995) • — — ** ** 3-23% 3-16% 6% 5%30. Reduced teacher victimization? (1994) 13% — 15% — 8-26% — 14% —31. Reduced student disruptions? (1991, 1994) 38% 46% @@ 37% 46% @@ 23-60% 33-65% 37% 47%
32. Decreased schools with minimal parental involvement• Teacher’s perspective? (1991, 1994) 25% 26% ## ** ** 9-44% 13-50% 23% 27%• Principal’s perspective? (1991, 1994) 13% 9% ## ** ** 4-22% 3-27% 13% 13%
33. Increased influence of parent associations? (1991, 1994) 21% 16% ## ** ** 8-37% 12-50% 16% 22%
MICHIGAN
GOAL 7
GOAL 8
U.S.
baseline update progress?
Michigan
baseline update progress?
Range of State Scores
baseline update
MedianScores†
baseline update
Safe, Disciplined and Alcohol- and Drug-free Schools
Parental Participation
0% 20% 40% 60% 80% 100%
Establishingcurriculum
One ormore areas
Hiring newfull-timeteachers
Settingdiscipline
policy
1991 1994
21%
16%
11%
8%
3%
1%
10%
16%
ns
ns
ns
ns
Parent-SchoolPartnershipsPercentage of public school principals whoreported that theparent associationhas influence1 onthe following areas(Indicator 33)
1 On a 6-point scale from no influence to a great deal of influence, defined asa response to the top two points.
nsInterpret with caution. Change was not statistically significant.
KEY
KEY
!! Significant progress
@@ Significant decline
## Change is not significant
Scorecards #1 (AL-MS) 10/30/97 10:13 AM Page 167

168
8. Increased reading achievement in Grade 4? (1992, 1994) • 31% 33% ## 29% 30% ## 8-38% 8-41% 26% 27%9. Increased mathematics achievement •
• in Grade 4? (1992, 1996) 26% 29% ## 18% 21% !! 5-27% 3-31% 16% 20%• in Grade 8? (1990, 1996) 23% 34% !! 15% 24% !! 1-27% 5-34% 15% 22%
10. Increased science achievement in Grade 8? (1996) 37% — 29% — 5-41% — 27% —
MINNESOTA
† Median is the middle score in a set of ranked scores.* Comparable national data are not available.— Data not available. See Appendix A.• Baseline years and most recent update years may differ by state
for this indicator. See Appendix C for more information.See pages 72-75 for a Guide to Reading the State Pages.See Appendix C for technical notes and sources.
GOAL 1
GOAL 2
GOAL 3
Minnesota
baseline update progress?
Range of State Scores
baseline update
MedianScores†
baseline update
U.S.
baseline update progress?
1. Reduced percentage of infants born in the state with 1 or more health risks? (1990, 1995) 28% 29% @@ 37% 34% !! 25-48% 24-46% 38% 35%2. Increased percentage of 2-year-olds immunized? (1994, 1996) 81% 85% ## 75% 78% !! 61-88% 64-88% 76% 79%3. Reduced number of infants (per 1,000) born with low birthweight? (1990, 1995) 51 59 @@ 70 73 @@ 48-151 53-134 71 754. Increased number of mothers (per 1,000) receiving early prenatal care? (1990, 1995) 812 836 !! 758 813 !! 469-868 560-900 778 8285. Increased number of children with disabilities in preschool (per 1,000)? (1991, 1996) 42 53 !! * * 16-68 16-92 38 47
6. Increased high school completion rate? (1990, 1995) 92% 95% !! 86% 86% ## 77-96% 79-96% 87% 88%7. Reduced high school dropout rate? (1994) • 5% — * * 3-10% — 5% —
Ready to Learn
School Completion
Student Achievement and Citizenship
19951990
100%
80%
60%
40%
20%
0%
92%95%
High School CompletionPercentage of all18- to 24-year-olds1
who have a highschool credential2(Indicator 6)
1 Does not include those still in high school.2 Includes traditional high school diploma and alternative credential.
0%
20%
40%
60%
80%
100%
19951990
29%28%
Children’sHealth IndexPercentage ofinfants born with 1or more healthrisks1 (Indicator 1)
1 Includes late (in third trimester) or no prenatal care, low maternal weightgain (less than 21 pounds), mother smoked during pregnancy, or motherdrank alcohol during pregnancy.
KEY
KEY
!! Significant progress
@@ Significant decline
## Change is not significant
Scorecards #1 (AL-MS) 10/30/97 10:13 AM Page 168

169
† Median is the middle score in a set of ranked scores.° See Table 8 for the numbers for each subject area.— Data not available. See Appendix A.∞ This information had not been released when the 1997 Goals Report
went to print.See pages 72-75 for a Guide to Reading the State Pages.See Appendix C for technical notes and sources.
11. Increased the number of Advanced Placement examinations receiving a grade of 3 or higher (per 1,000)? (1991, 1997)° 22 46 !! 55 85 !! 9-177 18-223 41 65
12. Increased the percentage of public secondary school teachers who hold • a degree in main teaching assignment? (1991, 1994) 80% 81% ## 66% 63% @@ 51-85% 50-81% 69% 64%• a teaching certificate in main teaching assignment? (1991, 1994) 100% 98% @@ 94% 93% @@ 91-100% 89-100% 98% 97%
13. Increased the percentage of public school teachers participating in professional development on 1 or more selected topics? (1994) 85% — 85% — 76-98% — 86% —
14. Increased the percentage of public school teachers with training to teach limited English-proficient students? (1994) 10% — 16% — 4-81% — 16% —
15. Increased the percentage of beginning public school teachers participating in a formal teacher induction program? (1991, 1994) 14% 18% ## 22% 27% !! 6-42% 7-48% 20% 23%
16. International comparisons in mathematics and science will be reported in future Goals Panel reports.∞ — — — — — — — —
MINNESOTA
GOAL 3
GOAL 4
GOAL 5
U.S.
baseline update progress?
Minnesota
baseline update progress?
Range of State Scores
baseline update
MedianScores†
baseline update
Student Achievement and Citizenship (continued)
Teacher Education and Professional Development
Mathematics and Science
ReadingGrade 4
MathematicsGrade 4
1996199219941992
100%
80%
60%
40%
20%
0%
33%31%26% 29%
nsns
Student AchievementPercentage of public school students who metthe Goals Panel’sperformancestandard1 in reading and mathematics (Indicators 8 & 9)
1 A complete description of the performance standard can be found inAppendix C.
nsInterpret with caution. Change was not statistically significant.
0 20
40
60
80
100
0% 20% 40% 60% 80% 100%
Uses ofeducationaltechnology
One ormore topics
Methods ofteaching
subject fieldIn-depthstudy in
subject field
Studentassessment
85%
54%
64%
34%
51%
Professional DevelopmentPercentage ofpublic schoolteachers partici-pating in profes-sional develop-ment on thefollowing topics,1994(Indicator 13)KEY
KEY
!! Significant progress
@@ Significant decline
## Change is not significant
Scorecards #1 (AL-MS) 10/30/97 10:13 AM Page 169

170
20. Increased adult literacy? (1992) — — 52% — 46-77% — 53% —21. Increased the percentage of U.S. citizens
• registered to vote? (1988, 1992) 79% 88% !! 70% 73% !! 58-95% 63-92% 71% 75%• voting? (1988, 1992) 71% 76% !! 61% 66% !! 50-74% 55-77% 62% 68%
22. Increased postsecondary enrollment? (1992, 1994) 54% 53% ❊ ** ** 33-68% 37-71% 53% 55%
MINNESOTA
† Median is the middle score in a set of ranked scores.— Data not available. See Appendix A.** Indicators are not the same at the national and state level.❊ Sample size does not permit a reliable estimate of change.See pages 72-75 for a Guide to Reading the State Pages.See Appendix C for technical notes and sources.
GOAL 5
GOAL 6
Minnesota
baseline update progress?
Range of State Scores
baseline update
MedianScores†
baseline update
U.S.
baseline update progress?
17. Increased the percentage of public school 8th graders whose mathematics teachers• have students work in small groups? (1996) 69% — 66% — 45-92% — 67% —• address Algebra and functions? (1996) 64% — 57% — 45-82% — 58% —• address reasoning and analytical ability? (1996) 47% — 52% — 39-64% — 48% —
18. Increased the percentage of public school 8th graders who have computers available in their mathematics classroom? (1996) 28% — 30% — 7-54% — 30% —
19. Increased mathematics and science degrees awarded to • all students? (1991, 1995) 37% 41% !! 39% 42% !! 25-49% 15-53% 39% 42%• minority (Black, Hispanic, American Indian/Alaskan Native) students? (1991, 1995) 39% 41% !! 39% 40% !! 22-64% 22-57% 39% 39%• female students? (1991, 1995) 33% 35% !! 35% 37% !! 23-46% 13-47% 33% 36%
Mathematics and Science (continued)
Adult Literacy and Lifelong Learning
Addressreasoning & analytical
ability
AddressAlgebra and functions
Work insmall groups
or with apartner
0% 20% 40% 60% 80% 100%
69%
47%
64%
1
2
2
MathematicsInstructionPercentage ofpublic school 8thgraders whosemathematicsteachers do thefollowing, 1996(Indicator 17)
KEY
KEY
!! Significant progress
@@ Significant decline
## Change is not significant
1 At least once a week.2 On a 4-point scale from “none” to “a lot,” defined as a response to the top point.
Scorecards #1 (AL-MS) 10/30/97 10:13 AM Page 170

171
† Median is the middle score in a set of ranked scores.** Indicators are not the same at the national and state level.— Data not available. See Appendix A.• Baseline years and most recent update years may differ by state
for this indicator. See Appendix C for more information.See pages 72-75 for a Guide to Reading the State Pages.See Appendix C for technical notes and sources.
23. Reduced marijuana use? (1991, 1995) • — — ** ** 4-18% 7-32% 10% 23%24. Reduced alcohol use (more than 5 drinks in a row)? (1991, 1995) • — — ** ** 17-43% 13-43% 30% 31%25. Reduced availability of drugs on school property? (1993, 1995) • — — ** ** 11-31% 20-46% 22% 30%26. Reduced students threatened or injured with a weapon while on school property? (1993, 1995) • — — ** ** 6-15% 4-11% 8% 8%27. Reduced physical fights on school property? (1993, 1995) • — — ** ** 13-39% 12-19% 16% 15%28. Reduced students carrying weapons on school property? (1993, 1995) • — — ** ** 8-18% 7-14% 12% 11%29. Reduced students not feeling safe at school? (1993, 1995) • — — ** ** 3-23% 3-16% 6% 5%30. Reduced teacher victimization? (1994) 13% — 15% — 8-26% — 14% —31. Reduced student disruptions? (1991, 1994) 32% 52% @@ 37% 46% @@ 23-60% 33-65% 37% 47%
32. Decreased schools with minimal parental involvement• Teacher’s perspective? (1991, 1994) 13% 14% ## ** ** 9-44% 13-50% 23% 27%• Principal’s perspective? (1991, 1994) 7% 6% ## ** ** 4-22% 3-27% 13% 13%
33. Increased influence of parent associations? (1991, 1994) 24% 32% ## ** ** 8-37% 12-50% 16% 22%
MINNESOTA
GOAL 7
GOAL 8
U.S.
baseline update progress?
Minnesota
baseline update progress?
Range of State Scores
baseline update
MedianScores†
baseline update
Safe, Disciplined and Alcohol- and Drug-free Schools
Parental Participation
0% 20% 40% 60% 80% 100%
Establishingcurriculum
One ormore areas
Hiring newfull-timeteachers
Settingdiscipline
policy
1991 1994
24%
32%
12%
14%
9%
6%
24%
19%
ns
ns
ns
ns
Parent-SchoolPartnershipsPercentage of public school principals whoreported that theparent associationhas influence1 onthe following areas(Indicator 33)
1 On a 6-point scale from no influence to a great deal of influence, defined asa response to the top two points.
nsInterpret with caution. Change was not statistically significant.
KEY
KEY
!! Significant progress
@@ Significant decline
## Change is not significant
Scorecards #1 (AL-MS) 10/30/97 10:13 AM Page 171

172
8. Increased reading achievement in Grade 4? (1992, 1994) • 14% 18% !! 29% 30% ## 8-38% 8-41% 26% 27%9. Increased mathematics achievement •
• in Grade 4? (1992, 1996) 6% 8% ## 18% 21% !! 5-27% 3-31% 16% 20%• in Grade 8? (1992, 1996) 6% 7% ## 21% 24% ## 1-31% 5-34% 18% 22%
10. Increased science achievement in Grade 8? (1996) 12% — 29% — 5-41% — 27% —
MISSISSIPPI
† Median is the middle score in a set of ranked scores.* Comparable national data are not available.— Data not available. See Appendix A.• Baseline years and most recent update years may differ by state
for this indicator. See Appendix C for more information.See pages 72-75 for a Guide to Reading the State Pages.See Appendix C for technical notes and sources.
GOAL 1
GOAL 2
GOAL 3
Mississippi
baseline update progress?
Range of State Scores
baseline update
MedianScores†
baseline update
U.S.
baseline update progress?
1. Reduced percentage of infants born in the state with 1 or more health risks? (1990, 1995) 40% 39% !! 37% 34% !! 25-48% 24-46% 38% 35%2. Increased percentage of 2-year-olds immunized? (1994, 1996) 83% 81% ## 75% 78% !! 61-88% 64-88% 76% 79%3. Reduced number of infants (per 1,000) born with low birthweight? (1990, 1995) 96 98 @@ 70 73 @@ 48-151 53-134 71 754. Increased number of mothers (per 1,000) receiving early prenatal care? (1990, 1995) 745 772 !! 758 813 !! 469-868 560-900 778 8285. Increased number of children with disabilities in preschool (per 1,000)? (1991, 1996) 46 53 !! * * 16-68 16-92 38 47
6. Increased high school completion rate? (1990, 1995) 84% 84% ## 86% 86% ## 77-96% 79-96% 87% 88%7. Reduced high school dropout rate? (1992, 1994) • 5% 6% @@ * * 3-12% 3-10% 5% 5%
Ready to Learn
School Completion
Student Achievement and Citizenship
19951990
84%
100%
80%
60%
40%
20%
0%
84%
High School CompletionPercentage of all18- to 24-year-olds1
who have a highschool credential2(Indicator 6)
1 Does not include those still in high school.2 Includes traditional high school diploma and alternative credential.
0%
20%
40%
60%
80%
100%
19951990
39%40%
Children’sHealth IndexPercentage ofinfants born with 1or more healthrisks1 (Indicator 1)
1 Includes late (in third trimester) or no prenatal care, low maternal weightgain (less than 21 pounds), mother smoked during pregnancy, or motherdrank alcohol during pregnancy.
KEY
KEY
!! Significant progress
@@ Significant decline
## Change is not significant
Scorecards #1 (AL-MS) 10/30/97 10:13 AM Page 172

173
† Median is the middle score in a set of ranked scores.° See Table 8 for the numbers for each subject area.— Data not available. See Appendix A.∞ This information had not been released when the 1997 Goals Report
went to print.See pages 72-75 for a Guide to Reading the State Pages.See Appendix C for technical notes and sources.
11. Increased the number of Advanced Placement examinations receiving a grade of 3 or higher (per 1,000)? (1991, 1997)° 17 26 !! 55 85 !! 9-177 18-223 41 65
12. Increased the percentage of public secondary school teachers who hold • a degree in main teaching assignment? (1991, 1994) 67% 61% ## 66% 63% @@ 51-85% 50-81% 69% 64%• a teaching certificate in main teaching assignment? (1991, 1994) 98% 96% ## 94% 93% @@ 91-100% 89-100% 98% 97%
13. Increased the percentage of public school teachers participating in professional development on 1 or more selected topics? (1994) 88% — 85% — 76-98% — 86% —
14. Increased the percentage of public school teachers with training to teach limited English-proficient students? (1994) 18% — 16% — 4-81% — 16% —
15. Increased the percentage of beginning public school teachers participating in a formal teacher induction program? (1991, 1994) 20% 20% ## 22% 27% !! 6-42% 7-48% 20% 23%
16. International comparisons in mathematics and science will be reported in future Goals Panel reports.∞ — — — — — — — —
MISSISSIPPI
GOAL 3
GOAL 4
GOAL 5
U.S.
baseline update progress?
Mississippi
baseline update progress?
Range of State Scores
baseline update
MedianScores†
baseline update
Student Achievement and Citizenship (continued)
Teacher Education and Professional Development
Mathematics and Science
ReadingGrade 4
MathematicsGrade 4
1996199219941992
100%
80%
60%
40%
20%
0%
18%14%
6% 8%ns
Student AchievementPercentage of public school students who metthe Goals Panel’sperformancestandard1 in reading and mathematics (Indicators 8 & 9)
1 A complete description of the performance standard can be found inAppendix C.
nsInterpret with caution. Change was not statistically significant.0 2
0
40
60
80
100
0% 20% 40% 60% 80% 100%
Uses ofeducationaltechnology
One ormore topics
Methods ofteaching
subject fieldIn-depthstudy in
subject field
Studentassessment
88%
44%
67%
31%
68%
Professional DevelopmentPercentage ofpublic schoolteachers partici-pating in profes-sional develop-ment on thefollowing topics,1994(Indicator 13)KEY
KEY
!! Significant progress
@@ Significant decline
## Change is not significant
Scorecards #1 (AL-MS) 10/30/97 10:13 AM Page 173

174
20. Increased adult literacy? (1992) — — 52% — 46-77% — 53% —21. Increased the percentage of U.S. citizens
• registered to vote? (1988, 1992) 78% 80% ## 70% 73% !! 58-95% 63-92% 71% 75%• voting? (1988, 1992) 63% 67% ## 61% 66% !! 50-74% 55-77% 62% 68%
22. Increased postsecondary enrollment? (1992, 1994) 61% 69% !! ** ** 33-68% 37-71% 53% 55%
MISSISSIPPI
† Median is the middle score in a set of ranked scores.— Data not available. See Appendix A.** Indicators are not the same at the national and state level.See pages 72-75 for a Guide to Reading the State Pages.See Appendix C for technical notes and sources.
GOAL 5
GOAL 6
Mississippi
baseline update progress?
Range of State Scores
baseline update
MedianScores†
baseline update
U.S.
baseline update progress?
17. Increased the percentage of public school 8th graders whose mathematics teachers• have students work in small groups? (1996) 58% — 66% — 45-92% — 67% —• address Algebra and functions? (1996) 51% — 57% — 45-82% — 58% —• address reasoning and analytical ability? (1996) 49% — 52% — 39-64% — 48% —
18. Increased the percentage of public school 8th graders who have computers available in their mathematics classroom? (1996) 22% — 30% — 7-54% — 30% —
19. Increased mathematics and science degrees awarded to • all students? (1991, 1995) 33% 40% !! 39% 42% !! 25-49% 15-53% 39% 42%• minority (Black, Hispanic, American Indian/Alaskan Native) students? (1991, 1995) 36% 40% !! 39% 40% !! 22-64% 22-57% 39% 39%• female students? (1991, 1995) 30% 37% !! 35% 37% !! 23-46% 13-47% 33% 36%
Mathematics and Science (continued)
Adult Literacy and Lifelong Learning
Addressreasoning & analytical
ability
AddressAlgebra and functions
Work insmall groups
or with apartner
0% 20% 40% 60% 80% 100%
58%
49%
51%
1
2
2
MathematicsInstructionPercentage ofpublic school 8thgraders whosemathematicsteachers do thefollowing, 1996(Indicator 17)
KEY
KEY
!! Significant progress
@@ Significant decline
## Change is not significant
1 At least once a week.2 On a 4-point scale from “none” to “a lot,” defined as a response to the top point.
Scorecards #1 (AL-MS) 10/30/97 10:13 AM Page 174

175
† Median is the middle score in a set of ranked scores.** Indicators are not the same at the national and state level.— Data not available. See Appendix A.• Baseline years and most recent update years may differ by state
for this indicator. See Appendix C for more information.See pages 72-75 for a Guide to Reading the State Pages.See Appendix C for technical notes and sources.
23. Reduced marijuana use? (1993, 1995) • 9% 16% @@ ** ** 7-21% 7-32% 14% 23%24. Reduced alcohol use (more than 5 drinks in a row)? (1993, 1995) • 27% 30% ## ** ** 9-44% 13-43% 28% 31%25. Reduced availability of drugs on school property? (1993, 1995) • 16% 20% ## ** ** 11-31% 20-46% 22% 30%26. Reduced students threatened or injured with a weapon while on school property? (1993, 1995) • 8% 8% ## ** ** 6-15% 4-11% 8% 8%27. Reduced physical fights on school property? (1993, 1995) • 17% 16% ## ** ** 13-39% 12-19% 16% 15%28. Reduced students carrying weapons on school property? (1993, 1995) • 14% 8% !! ** ** 8-18% 7-14% 12% 11%29. Reduced students not feeling safe at school? (1993, 1995) • 6% 5% ## ** ** 3-23% 3-16% 6% 5%30. Reduced teacher victimization? (1994) 15% — 15% — 8-26% — 14% —31. Reduced student disruptions? (1991, 1994) 30% 47% @@ 37% 46% @@ 23-60% 33-65% 37% 47%
32. Decreased schools with minimal parental involvement• Teacher’s perspective? (1991, 1994) 31% 40% @@ ** ** 9-44% 13-50% 23% 27%• Principal’s perspective? (1991, 1994) 21% 24% ## ** ** 4-22% 3-27% 13% 13%
33. Increased influence of parent associations? (1991, 1994) 24% 25% ## ** ** 8-37% 12-50% 16% 22%
MISSISSIPPI
GOAL 7
GOAL 8
U.S.
baseline update progress?
Mississippi
baseline update progress?
Range of State Scores
baseline update
MedianScores†
baseline update
Safe, Disciplined and Alcohol- and Drug-free Schools
Parental Participation
Usedmarijuana
Had 5 ormore drinks
in a row
Were offered, sold,or given an illegal drug
on school property
1
1
2
0% 20% 40% 60% 80% 100%
1993 1995
16%
9%
27%
30%
16%
20%
ns
ns
Alcohol- andDrug-freeSchoolsPercentage ofpublic high schoolstudents whoreported the fol-lowing(Indicators 23,24, & 25)
1 During the past 30 days.2 During the past 12 months.nsInterpret with caution. Change was not statistically significant.
0% 20% 40% 60% 80% 100%
Establishingcurriculum
One ormore areas
Hiring newfull-timeteachers
Settingdiscipline
policy
1991 1994
24%
25%
10%
9%
3%
2%
21%
19%
ns
ns
ns
ns
Parent-SchoolPartnershipsPercentage of public school principals whoreported that theparent associationhas influence1 onthe following areas(Indicator 33)
1 On a 6-point scale from no influence to a great deal of influence, defined asa response to the top two points.
nsInterpret with caution. Change was not statistically significant.
KEY
KEY
!! Significant progress
@@ Significant decline
## Change is not significant
Scorecards #1 (AL-MS) 10/30/97 10:13 AM Page 175

176
8. Increased reading achievement in Grade 4? (1992, 1994) • 30% 31% ## 29% 30% ## 8-38% 8-41% 26% 27%9. Increased mathematics achievement •
• in Grade 4? (1992, 1996) 19% 20% ## 18% 21% !! 5-27% 3-31% 16% 20%• in Grade 8? (1992, 1996) 20% 22% ## 21% 24% ## 1-31% 5-34% 18% 22%
10. Increased science achievement in Grade 8? (1996) 28% — 29% — 5-41% — 27% —
MISSOURI
† Median is the middle score in a set of ranked scores.* Comparable national data are not available.— Data not available. See Appendix A.• Baseline years and most recent update years may differ by state
for this indicator. See Appendix C for more information.See pages 72-75 for a Guide to Reading the State Pages.See Appendix C for technical notes and sources.
GOAL 1
GOAL 2
GOAL 3
Missouri
baseline update progress?
Range of State Scores
baseline update
MedianScores†
baseline update
U.S.
baseline update progress?
1. Reduced percentage of infants born in the state with 1 or more health risks? (1990, 1995) 41% 36% !! 37% 34% !! 25-48% 24-46% 38% 35%2. Increased percentage of 2-year-olds immunized? (1994, 1996) 64% 75% !! 75% 78% !! 61-88% 64-88% 76% 79%3. Reduced number of infants (per 1,000) born with low birthweight? (1990, 1995) 71 76 @@ 70 73 @@ 48-151 53-134 71 754. Increased number of mothers (per 1,000) receiving early prenatal care? (1990, 1995) 785 852 !! 758 813 !! 469-868 560-900 778 8285. Increased number of children with disabilities in preschool (per 1,000)? (1991, 1996) 18 36 !! * * 16-68 16-92 38 47
6. Increased high school completion rate? (1990, 1995) 88% 88% ## 86% 86% ## 77-96% 79-96% 87% 88%7. Reduced high school dropout rate? (1992, 1994) • 6% 7% @@ * * 3-12% 3-10% 5% 5%
Ready to Learn
School Completion
Student Achievement and Citizenship
KEY
KEY
!! Significant progress
@@ Significant decline
## Change is not significant
19951990
88%100%
80%
60%
40%
20%
0%
88%
High School CompletionPercentage of all18- to 24-year-olds1
who have a highschool credential2(Indicator 6)
1 Does not include those still in high school.2 Includes traditional high school diploma and alternative credential.
0%
20%
40%
60%
80%
100%
19951990
36%41%
Children’sHealth IndexPercentage ofinfants born with 1or more healthrisks1 (Indicator 1)
1 Includes late (in third trimester) or no prenatal care, low maternal weightgain (less than 21 pounds), mother smoked during pregnancy, or motherdrank alcohol during pregnancy.
Scorecards #2 (MO-VI) 10/30/97 11:56 AM Page 176
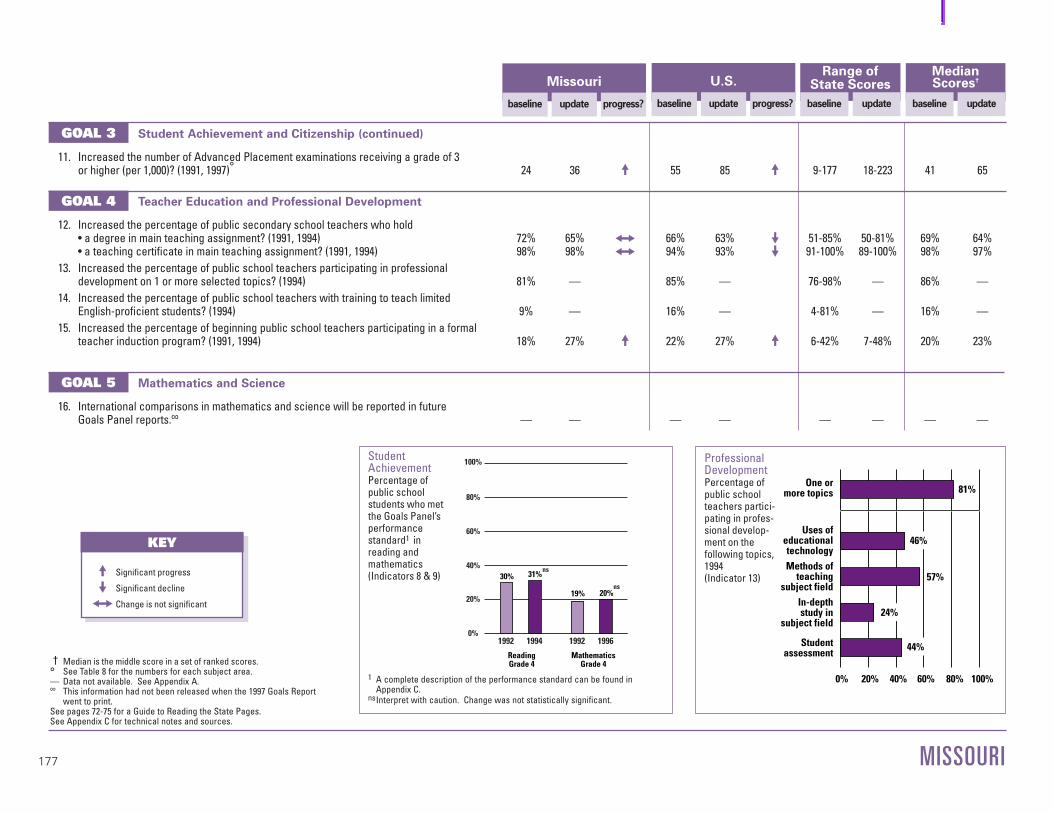
177
† Median is the middle score in a set of ranked scores.° See Table 8 for the numbers for each subject area.— Data not available. See Appendix A.∞ This information had not been released when the 1997 Goals Report
went to print.See pages 72-75 for a Guide to Reading the State Pages.See Appendix C for technical notes and sources.
11. Increased the number of Advanced Placement examinations receiving a grade of 3 or higher (per 1,000)? (1991, 1997)° 24 36 !! 55 85 !! 9-177 18-223 41 65
12. Increased the percentage of public secondary school teachers who hold • a degree in main teaching assignment? (1991, 1994) 72% 65% ## 66% 63% @@ 51-85% 50-81% 69% 64%• a teaching certificate in main teaching assignment? (1991, 1994) 98% 98% ## 94% 93% @@ 91-100% 89-100% 98% 97%
13. Increased the percentage of public school teachers participating in professional development on 1 or more selected topics? (1994) 81% — 85% — 76-98% — 86% —
14. Increased the percentage of public school teachers with training to teach limited English-proficient students? (1994) 9% — 16% — 4-81% — 16% —
15. Increased the percentage of beginning public school teachers participating in a formal teacher induction program? (1991, 1994) 18% 27% !! 22% 27% !! 6-42% 7-48% 20% 23%
16. International comparisons in mathematics and science will be reported in future Goals Panel reports.∞ — — — — — — — —
MISSOURI
GOAL 3
GOAL 4
U.S.
baseline update progress?
Missouri
baseline update progress?
Range of State Scores
baseline update
MedianScores†
baseline update
Student Achievement and Citizenship (continued)
Teacher Education and Professional Development
GOAL 5 Mathematics and Science
KEY
KEY
!! Significant progress
@@ Significant decline
## Change is not significant
ReadingGrade 4
MathematicsGrade 4
1996199219941992
100%
80%
60%
40%
20%
0%
31%30%
19% 20%
ns
ns
Student AchievementPercentage of public school students who metthe Goals Panel’sperformancestandard1 in reading and mathematics (Indicators 8 & 9)
1 A complete description of the performance standard can be found inAppendix C.
nsInterpret with caution. Change was not statistically significant.
0 20
40
60
80
10
0
0% 20% 40% 60% 80% 100%
Uses ofeducationaltechnology
One ormore topics
Methods ofteaching
subject fieldIn-depthstudy in
subject field
Studentassessment
81%
46%
57%
24%
44%
Professional DevelopmentPercentage ofpublic schoolteachers partici-pating in profes-sional develop-ment on thefollowing topics,1994(Indicator 13)
Scorecards #2 (MO-VI) 10/30/97 11:56 AM Page 177

178
20. Increased adult literacy? (1992) — — 52% — 46-77% — 53% —21. Increased the percentage of U.S. citizens
• registered to vote? (1988, 1992) 76% 75% ## 70% 73% !! 58-95% 63-92% 71% 75%• voting? (1988, 1992) 66% 67% ## 61% 66% !! 50-74% 55-77% 62% 68%
22. Increased postsecondary enrollment? (1992, 1994) 49% 51% ❊ ** ** 33-68% 37-71% 53% 55%
MISSOURI
† Median is the middle score in a set of ranked scores.— Data not available. See Appendix A.** Indicators are not the same at the national and state level.❊ Sample size does not permit a reliable estimate of change.See pages 72-75 for a Guide to Reading the State Pages.See Appendix C for technical notes and sources.
GOAL 5
GOAL 6
Missouri
baseline update progress?
Range of State Scores
baseline update
MedianScores†
baseline update
U.S.
baseline update progress?
17. Increased the percentage of public school 8th graders whose mathematics teachers• have students work in small groups? (1996) 60% — 66% — 45-92% — 67% —• address Algebra and functions? (1996) 65% — 57% — 45-82% — 58% —• address reasoning and analytical ability? (1996) 46% — 52% — 39-64% — 48% —
18. Increased the percentage of public school 8th graders who have computers available in their mathematics classroom? (1996) 27% — 30% — 7-54% — 30% —
19. Increased mathematics and science degrees awarded to • all students? (1991, 1995) 35% 38% !! 39% 42% !! 25-49% 15-53% 39% 42%• minority (Black, Hispanic, American Indian/Alaskan Native) students? (1991, 1995) 32% 33% !! 39% 40% !! 22-64% 22-57% 39% 39%• female students? (1991, 1995) 30% 35% !! 35% 37% !! 23-46% 13-47% 33% 36%
Mathematics and Science (continued)
Adult Literacy and Lifelong Learning
KEY
KEY
!! Significant progress
@@ Significant decline
## Change is not significant Addressreasoning & analytical
ability
AddressAlgebra and functions
Work insmall groups
or with apartner
0% 20% 40% 60% 80% 100%
60%
46%
65%
1
2
2
MathematicsInstructionPercentage ofpublic school 8thgraders whosemathematicsteachers do thefollowing, 1996(Indicator 17)
1 At least once a week.2 On a 4-point scale from “none” to “a lot,” defined as a response to the top point.
Scorecards #2 (MO-VI) 10/30/97 11:56 AM Page 178

179
KEY
KEY
!! Significant progress
@@ Significant decline
## Change is not significant
† Median is the middle score in a set of ranked scores.** Indicators are not the same at the national and state level.— Data not available. See Appendix A.• Baseline years and most recent update years may differ by state
for this indicator. See Appendix C for more information.See pages 72-75 for a Guide to Reading the State Pages.See Appendix C for technical notes and sources.
23. Reduced marijuana use? (1995) • 22% — ** ** 7-32% — 23% —24. Reduced alcohol use (more than 5 drinks in a row)? (1995) • 40% — ** ** 13-43% — 31% —25. Reduced availability of drugs on school property? (1995) • 26% — ** ** 20-46% — 30% —26. Reduced students threatened or injured with a weapon while on school property? (1995) • 8% — ** ** 4-11% — 8% —27. Reduced physical fights on school property? (1995) • 15% — ** ** 12-19% — 15% —28. Reduced students carrying weapons on school property? (1995) • 13% — ** ** 7-14% — 11% —29. Reduced students not feeling safe at school? (1995) • 4% — ** ** 3-16% — 5% —30. Reduced teacher victimization? (1994) 14% — 15% — 8-26% — 14% —31. Reduced student disruptions? (1991, 1994) 41% 53% @@ 37% 46% @@ 23-60% 33-65% 37% 47%
32. Decreased schools with minimal parental involvement• Teacher’s perspective? (1991, 1994) 22% 27% ## ** ** 9-44% 13-50% 23% 27%• Principal’s perspective? (1991, 1994) 15% 13% ## ** ** 4-22% 3-27% 13% 13%
33. Increased influence of parent associations? (1991, 1994) 10% 17% ## ** ** 8-37% 12-50% 16% 22%
MISSOURI
GOAL 7
GOAL 8
U.S.
baseline update progress?
Missouri
baseline update progress?
Range of State Scores
baseline update
MedianScores†
baseline update
Safe, Disciplined and Alcohol- and Drug-free Schools
Parental Participation
Usedmarijuana
Had 5 ormore drinks
in a row
Were offered, sold,or given an illegal drug
on school property
1
1
2
0% 20% 40% 60% 80% 100%
1995
22%
40%
26%
Alcohol- andDrug-freeSchoolsPercentage ofpublic high schoolstudents whoreported the fol-lowing(Indicators 23,24, & 25)
1 During the past 30 days.2 During the past 12 months.
0% 20% 40% 60% 80% 100%
Establishingcurriculum
One ormore areas
Hiring newfull-timeteachers
Settingdiscipline
policy
1991 1994
10%
17%ns
ns
ns
4%
8%
1%
1%
12%
8%
Parent-SchoolPartnershipsPercentage of public school principals whoreported that theparent associationhas influence1 onthe following areas(Indicator 33)
1 On a 6-point scale from no influence to a great deal of influence, defined asa response to the top two points.
nsInterpret with caution. Change was not statistically significant.
Scorecards #2 (MO-VI) 10/30/97 11:56 AM Page 179

180
8. Increased reading achievement in Grade 4? (1994) • 35% — 30% — 8-41% — 27% —9. Increased mathematics achievement •
• in Grade 4? (1996) 22% — 21% — 3-31% — 20% —• in Grade 8? (1990, 1996) 27% 32% !! 15% 24% !! 1-27% 5-34% 15% 22%
10. Increased science achievement in Grade 8? (1996) 41% — 29% — 5-41% — 27% —
MONTANA
† Median is the middle score in a set of ranked scores.* Comparable national data are not available.— Data not available. See Appendix A.• Baseline years and most recent update years may differ by state
for this indicator. See Appendix C for more information.See pages 72-75 for a Guide to Reading the State Pages.See Appendix C for technical notes and sources.
GOAL 1
GOAL 2
GOAL 3
Montana
baseline update progress?
Range of State Scores
baseline update
MedianScores†
baseline update
U.S.
baseline update progress?
1. Reduced percentage of infants born in the state with 1 or more health risks? (1990, 1995) 38% 35% !! 37% 34% !! 25-48% 24-46% 38% 35%2. Increased percentage of 2-year-olds immunized? (1994, 1996) 75% 78% ## 75% 78% !! 61-88% 64-88% 76% 79%3. Reduced number of infants (per 1,000) born with low birthweight? (1990, 1995) 62 58 !! 70 73 @@ 48-151 53-134 71 754. Increased number of mothers (per 1,000) receiving early prenatal care? (1990, 1995) 763 815 !! 758 813 !! 469-868 560-900 778 8285. Increased number of children with disabilities in preschool (per 1,000)? (1991, 1996) 46 48 !! * * 16-68 16-92 38 47
6. Increased high school completion rate? (1990, 1995) 93% 90% ## 86% 86% ## 77-96% 79-96% 87% 88%7. Reduced high school dropout rate? (1992, 1994) • — — * * 3-12% 3-10% 5% 5%
Ready to Learn
School Completion
Student Achievement and Citizenship
19951990
90%100%
80%
60%
40%
20%
0%
93% ns
High School CompletionPercentage of all18- to 24-year-olds1
who have a highschool credential2(Indicator 6)
1 Does not include those still in high school.2 Includes traditional high school diploma and alternative credential.nsInterpret with caution. Change was not statistically significant.
0%
20%
40%
60%
80%
100%
19951990
35%38%
Children’sHealth IndexPercentage ofinfants born with 1or more healthrisks1 (Indicator 1)
1 Includes late (in third trimester) or no prenatal care, low maternal weightgain (less than 21 pounds), mother smoked during pregnancy, or motherdrank alcohol during pregnancy.
KEY
KEY
!! Significant progress
@@ Significant decline
## Change is not significant
Scorecards #2 (MO-VI) 10/30/97 11:57 AM Page 180

181
† Median is the middle score in a set of ranked scores.° See Table 8 for the numbers for each subject area.— Data not available. See Appendix A.∞ This information had not been released when the 1997 Goals Report
went to print.See pages 72-75 for a Guide to Reading the State Pages.See Appendix C for technical notes and sources.
11. Increased the number of Advanced Placement examinations receiving a grade of 3 or higher (per 1,000)? (1991, 1997)° 26 42 !! 55 85 !! 9-177 18-223 41 65
12. Increased the percentage of public secondary school teachers who hold • a degree in main teaching assignment? (1991, 1994) 69% 64% ## 66% 63% @@ 51-85% 50-81% 69% 64%• a teaching certificate in main teaching assignment? (1991, 1994) 98% 98% ## 94% 93% @@ 91-100% 89-100% 98% 97%
13. Increased the percentage of public school teachers participating in professional development on 1 or more selected topics? (1994) 86% — 85% — 76-98% — 86% —
14. Increased the percentage of public school teachers with training to teach limited English-proficient students? (1994) 19% — 16% — 4-81% — 16% —
15. Increased the percentage of beginning public school teachers participating in a formal teacher induction program? (1991, 1994) 10% 9% ## 22% 27% !! 6-42% 7-48% 20% 23%
16. International comparisons in mathematics and science will be reported in future Goals Panel reports.∞ — — — — — — — —
MONTANA
GOAL 3
GOAL 4
GOAL 5
U.S.
baseline update progress?
Montana
baseline update progress?
Range of State Scores
baseline update
MedianScores†
baseline update
Student Achievement and Citizenship (continued)
Teacher Education and Professional Development
Mathematics and Science
ReadingGrade 4
MathematicsGrade 4
19961994
100%
80%
60%
40%
20%
0%
35%
22%
Student AchievementPercentage of public school students who metthe Goals Panel’sperformancestandard1 in reading and mathematics (Indicators 8 & 9)
1 A complete description of the performance standard can be found inAppendix C.
0 20
40
60
80
10
0
0% 20% 40% 60% 80% 100%
Uses ofeducationaltechnology
One ormore topics
Methods ofteaching
subject fieldIn-depthstudy in
subject field
Studentassessment
86%
57%
60%
28%
44%
Professional DevelopmentPercentage ofpublic schoolteachers partici-pating in profes-sional develop-ment on thefollowing topics,1994(Indicator 13)KEY
KEY
!! Significant progress
@@ Significant decline
## Change is not significant
Scorecards #2 (MO-VI) 10/30/97 11:57 AM Page 181

182
20. Increased adult literacy? (1992) — — 52% — 46-77% — 53% —21. Increased the percentage of U.S. citizens
• registered to vote? (1988, 1992) 76% 78% ## 70% 73% !! 58-95% 63-92% 71% 75%• voting? (1988, 1992) 69% 72% ## 61% 66% !! 50-74% 55-77% 62% 68%
22. Increased postsecondary enrollment? (1992, 1994) 51% 54% ❊ ** ** 33-68% 37-71% 53% 55%
MONTANA
† Median is the middle score in a set of ranked scores.— Data not available. See Appendix A.** Indicators are not the same at the national and state level.❊ Sample size does not permit a reliable estimate of change.See pages 72-75 for a Guide to Reading the State Pages.See Appendix C for technical notes and sources.
GOAL 5
GOAL 6
Montana
baseline update progress?
Range of State Scores
baseline update
MedianScores†
baseline update
U.S.
baseline update progress?
17. Increased the percentage of public school 8th graders whose mathematics teachers• have students work in small groups? (1996) 72% — 66% — 45-92% — 67% —• address Algebra and functions? (1996) 67% — 57% — 45-82% — 58% —• address reasoning and analytical ability? (1996) 51% — 52% — 39-64% — 48% —
18. Increased the percentage of public school 8th graders who have computers available in their mathematics classroom? (1996) 39% — 30% — 7-54% — 30% —
19. Increased mathematics and science degrees awarded to • all students? (1991, 1995) 38% 44% !! 39% 42% !! 25-49% 15-53% 39% 42%• minority (Black, Hispanic, American Indian/Alaskan Native) students? (1991, 1995) 39% 43% !! 39% 40% !! 22-64% 22-57% 39% 39%• female students? (1991, 1995) 29% 35% !! 35% 37% !! 23-46% 13-47% 33% 36%
Mathematics and Science (continued)
Adult Literacy and Lifelong Learning
Addressreasoning & analytical
ability
AddressAlgebra and functions
Work insmall groups
or with apartner
0% 20% 40% 60% 80% 100%
72%
51%
67%
1
2
2
MathematicsInstructionPercentage ofpublic school 8thgraders whosemathematicsteachers do thefollowing, 1996(Indicator 17)
1 At least once a week.2 On a 4-point scale from “none” to “a lot,” defined as a response to the top point.
KEY
KEY
!! Significant progress
@@ Significant decline
## Change is not significant
Scorecards #2 (MO-VI) 10/30/97 11:57 AM Page 182

183
† Median is the middle score in a set of ranked scores.** Indicators are not the same at the national and state level.— Data not available. See Appendix A.• Baseline years and most recent update years may differ by state
for this indicator. See Appendix C for more information.See pages 72-75 for a Guide to Reading the State Pages.See Appendix C for technical notes and sources.
23. Reduced marijuana use? (1993, 1995) • 14% 20% @@ ** ** 7-21% 7-32% 14% 23%24. Reduced alcohol use (more than 5 drinks in a row)? (1993, 1995) • 41% 43% ## ** ** 9-44% 13-43% 28% 31%25. Reduced availability of drugs on school property? (1993, 1995) • 22% 30% @@ ** ** 11-31% 20-46% 22% 30%26. Reduced students threatened or injured with a weapon while on school property? (1993, 1995) • 7% 6% ## ** ** 6-15% 4-11% 8% 8%27. Reduced physical fights on school property? (1993, 1995) • 17% 14% ## ** ** 13-39% 12-19% 16% 15%28. Reduced students carrying weapons on school property? (1993, 1995) • 14% 12% ## ** ** 8-18% 7-14% 12% 11%29. Reduced students not feeling safe at school? (1993, 1995) • 3% 3% ## ** ** 3-23% 3-16% 6% 5%30. Reduced teacher victimization? (1994) 9% — 15% — 8-26% — 14% —31. Reduced student disruptions? (1991, 1994) 35% 33% ## 37% 46% @@ 23-60% 33-65% 37% 47%
32. Decreased schools with minimal parental involvement• Teacher’s perspective? (1991, 1994) 17% 18% ## ** ** 9-44% 13-50% 23% 27%• Principal’s perspective? (1991, 1994) 7% 15% @@ ** ** 4-22% 3-27% 13% 13%
33. Increased influence of parent associations? (1991, 1994) 12% 16% ## ** ** 8-37% 12-50% 16% 22%
MONTANA
GOAL 7
GOAL 8
U.S.
baseline update progress?
Montana
baseline update progress?
Range of State Scores
baseline update
MedianScores†
baseline update
Safe, Disciplined and Alcohol- and Drug-free Schools
Parental Participation
Usedmarijuana
Had 5 ormore drinks
in a row
Were offered, sold,or given an illegal drug
on school property
1
1
2
0% 20% 40% 60% 80% 100%
1993 1995
20%
14%
41%
43%
22%
30%
ns
Alcohol- andDrug-freeSchoolsPercentage ofpublic high schoolstudents whoreported the fol-lowing(Indicators 23,24, & 25)
1 During the past 30 days.2 During the past 12 months.nsInterpret with caution. Change was not statistically significant.
0% 20% 40% 60% 80% 100%
Establishingcurriculum
One ormore areas
Hiring newfull-timeteachers
Settingdiscipline
policy
1991 1994
12%
16%
5%
7%
3%
13%
10%
ns
ns
ns
Parent-SchoolPartnershipsPercentage of public school principals whoreported that theparent associationhas influence1 onthe following areas(Indicator 33)
1 On a 6-point scale from no influence to a great deal of influence, defined asa response to the top two points.
nsInterpret with caution. Change was not statistically significant.
KEY
KEY
!! Significant progress
@@ Significant decline
## Change is not significant
Scorecards #2 (MO-VI) 10/30/97 11:57 AM Page 183
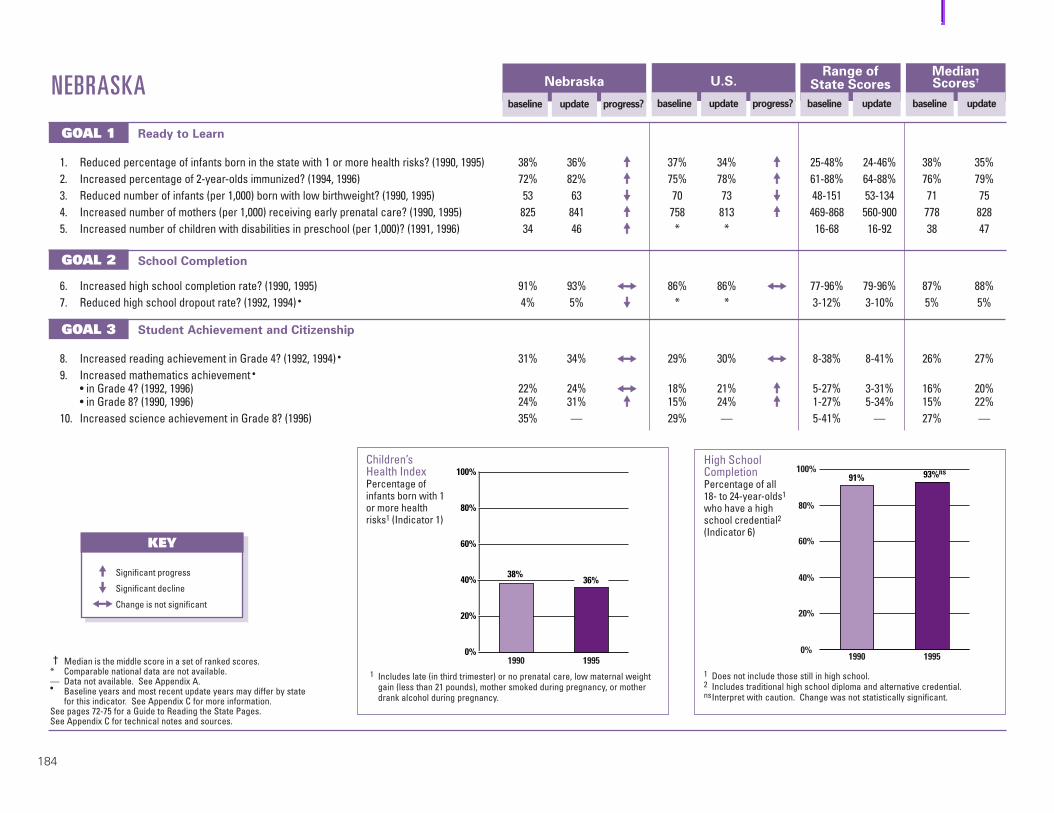
184
8. Increased reading achievement in Grade 4? (1992, 1994) • 31% 34% ## 29% 30% ## 8-38% 8-41% 26% 27%9. Increased mathematics achievement •
• in Grade 4? (1992, 1996) 22% 24% ## 18% 21% !! 5-27% 3-31% 16% 20%• in Grade 8? (1990, 1996) 24% 31% !! 15% 24% !! 1-27% 5-34% 15% 22%
10. Increased science achievement in Grade 8? (1996) 35% — 29% — 5-41% — 27% —
NEBRASKA
† Median is the middle score in a set of ranked scores.* Comparable national data are not available.— Data not available. See Appendix A.• Baseline years and most recent update years may differ by state
for this indicator. See Appendix C for more information.See pages 72-75 for a Guide to Reading the State Pages.See Appendix C for technical notes and sources.
GOAL 1
GOAL 2
GOAL 3
Nebraska
baseline update progress?
Range of State Scores
baseline update
MedianScores†
baseline update
U.S.
baseline update progress?
1. Reduced percentage of infants born in the state with 1 or more health risks? (1990, 1995) 38% 36% !! 37% 34% !! 25-48% 24-46% 38% 35%2. Increased percentage of 2-year-olds immunized? (1994, 1996) 72% 82% !! 75% 78% !! 61-88% 64-88% 76% 79%3. Reduced number of infants (per 1,000) born with low birthweight? (1990, 1995) 53 63 @@ 70 73 @@ 48-151 53-134 71 754. Increased number of mothers (per 1,000) receiving early prenatal care? (1990, 1995) 825 841 !! 758 813 !! 469-868 560-900 778 8285. Increased number of children with disabilities in preschool (per 1,000)? (1991, 1996) 34 46 !! * * 16-68 16-92 38 47
6. Increased high school completion rate? (1990, 1995) 91% 93% ## 86% 86% ## 77-96% 79-96% 87% 88%7. Reduced high school dropout rate? (1992, 1994) • 4% 5% @@ * * 3-12% 3-10% 5% 5%
Ready to Learn
School Completion
Student Achievement and Citizenship
19951990
93%100%
80%
60%
40%
20%
0%
91%ns
High School CompletionPercentage of all18- to 24-year-olds1
who have a highschool credential2(Indicator 6)
1 Does not include those still in high school.2 Includes traditional high school diploma and alternative credential.nsInterpret with caution. Change was not statistically significant.
0%
20%
40%
60%
80%
100%
19951990
36%38%
Children’sHealth IndexPercentage ofinfants born with 1or more healthrisks1 (Indicator 1)
1 Includes late (in third trimester) or no prenatal care, low maternal weightgain (less than 21 pounds), mother smoked during pregnancy, or motherdrank alcohol during pregnancy.
KEY
KEY
!! Significant progress
@@ Significant decline
## Change is not significant
Scorecards #2 (MO-VI) 10/30/97 11:57 AM Page 184

185
† Median is the middle score in a set of ranked scores.° See Table 8 for the numbers for each subject area.— Data not available. See Appendix A.∞ This information had not been released when the 1997 Goals Report
went to print.See pages 72-75 for a Guide to Reading the State Pages.See Appendix C for technical notes and sources.
11. Increased the number of Advanced Placement examinations receiving a grade of 3 or higher (per 1,000)? (1991, 1997)° 25 30 !! 55 85 !! 9-177 18-223 41 65
12. Increased the percentage of public secondary school teachers who hold • a degree in main teaching assignment? (1991, 1994) 82% 75% @@ 66% 63% @@ 51-85% 50-81% 69% 64%• a teaching certificate in main teaching assignment? (1991, 1994) 99% 99% ## 94% 93% @@ 91-100% 89-100% 98% 97%
13. Increased the percentage of public school teachers participating in professional development on 1 or more selected topics? (1994) 87% — 85% — 76-98% — 86% —
14. Increased the percentage of public school teachers with training to teach limited English-proficient students? (1994) 13% — 16% — 4-81% — 16% —
15. Increased the percentage of beginning public school teachers participating in a formal teacher induction program? (1991, 1994) 14% 15% ## 22% 27% !! 6-42% 7-48% 20% 23%
16. International comparisons in mathematics and science will be reported in future Goals Panel reports.∞ — — — — — — — —
NEBRASKA
GOAL 3
GOAL 4
GOAL 5
U.S.
baseline update progress?
Nebraska
baseline update progress?
Range of State Scores
baseline update
MedianScores†
baseline update
Student Achievement and Citizenship (continued)
Teacher Education and Professional Development
Mathematics and Science
ReadingGrade 4
MathematicsGrade 4
1996199219941992
100%
80%
60%
40%
20%
0%
34%31%
22% 24%
ns
ns
Student AchievementPercentage of public school students who metthe Goals Panel’sperformancestandard1 in reading and mathematics (Indicators 8 & 9)
1 A complete description of the performance standard can be found inAppendix C.
nsInterpret with caution. Change was not statistically significant. 0 20
40
60
80
10
0
0% 20% 40% 60% 80% 100%
Uses ofeducationaltechnology
One ormore topics
Methods ofteaching
subject fieldIn-depthstudy in
subject field
Studentassessment
87%
57%
56%
25%
47%
Professional DevelopmentPercentage ofpublic schoolteachers partici-pating in profes-sional develop-ment on thefollowing topics,1994(Indicator 13)KEY
KEY
!! Significant progress
@@ Significant decline
## Change is not significant
Scorecards #2 (MO-VI) 10/30/97 11:57 AM Page 185

186
20. Increased adult literacy? (1992) — — 52% — 46-77% — 53% —21. Increased the percentage of U.S. citizens
• registered to vote? (1988, 1992) 72% 74% ## 70% 73% !! 58-95% 63-92% 71% 75%• voting? (1988, 1992) 65% 67% ## 61% 66% !! 50-74% 55-77% 62% 68%
22. Increased postsecondary enrollment? (1992, 1994) 65% 60% ❊ ** ** 33-68% 37-71% 53% 55%
NEBRASKA
† Median is the middle score in a set of ranked scores.— Data not available. See Appendix A.** Indicators are not the same at the national and state level.❊ Sample size does not permit a reliable estimate of change.See pages 72-75 for a Guide to Reading the State Pages.See Appendix C for technical notes and sources.
GOAL 5
GOAL 6
Nebraska
baseline update progress?
Range of State Scores
baseline update
MedianScores†
baseline update
U.S.
baseline update progress?
17. Increased the percentage of public school 8th graders whose mathematics teachers• have students work in small groups? (1996) 62% — 66% — 45-92% — 67% —• address Algebra and functions? (1996) 58% — 57% — 45-82% — 58% —• address reasoning and analytical ability? (1996) 45% — 52% — 39-64% — 48% —
18. Increased the percentage of public school 8th graders who have computers available in their mathematics classroom? (1996) 31% — 30% — 7-54% — 30% —
19. Increased mathematics and science degrees awarded to • all students? (1991, 1995) 33% 36% !! 39% 42% !! 25-49% 15-53% 39% 42%• minority (Black, Hispanic, American Indian/Alaskan Native) students? (1991, 1995) 32% 36% !! 39% 40% !! 22-64% 22-57% 39% 39%• female students? (1991, 1995) 31% 33% !! 35% 37% !! 23-46% 13-47% 33% 36%
Mathematics and Science (continued)
Adult Literacy and Lifelong Learning
Addressreasoning & analytical
ability
AddressAlgebra and functions
Work insmall groups
or with apartner
0% 20% 40% 60% 80% 100%
62%
45%
58%
1
2
2
MathematicsInstructionPercentage ofpublic school 8thgraders whosemathematicsteachers do thefollowing, 1996(Indicator 17)
1 At least once a week.2 On a 4-point scale from “none” to “a lot,” defined as a response to the top point.
KEY
KEY
!! Significant progress
@@ Significant decline
## Change is not significant
Scorecards #2 (MO-VI) 10/30/97 11:57 AM Page 186

187
† Median is the middle score in a set of ranked scores.** Indicators are not the same at the national and state level.— Data not available. See Appendix A.• Baseline years and most recent update years may differ by state
for this indicator. See Appendix C for more information.See pages 72-75 for a Guide to Reading the State Pages.See Appendix C for technical notes and sources.
23. Reduced marijuana use? (1991, 1993) • 10% 9% ## ** ** 4-18% 7-21% 10% 14%24. Reduced alcohol use (more than 5 drinks in a row)? (1991, 1993) • 37% 36% ## ** ** 17-43% 9-44% 30% 28%25. Reduced availability of drugs on school property? (1993) • 11% — ** ** 11-31% — 22% —26. Reduced students threatened or injured with a weapon while on school property? (1993) • 6% — ** ** 6-15% — 8% —27. Reduced physical fights on school property? (1993) • 13% — ** ** 13-39% — 16% —28. Reduced students carrying weapons on school property? (1993) • 9% — ** ** 8-18% — 12% —29. Reduced students not feeling safe at school? (1993) • 3% — ** ** 3-23% — 6% —30. Reduced teacher victimization? (1994) 13% — 15% — 8-26% — 14% —31. Reduced student disruptions? (1991, 1994) 33% 41% @@ 37% 46% @@ 23-60% 33-65% 37% 47%
32. Decreased schools with minimal parental involvement• Teacher’s perspective? (1991, 1994) 13% 15% ## ** ** 9-44% 13-50% 23% 27%• Principal’s perspective? (1991, 1994) 4% 6% ## ** ** 4-22% 3-27% 13% 13%
33. Increased influence of parent associations? (1991, 1994) 17% 15% ## ** ** 8-37% 12-50% 16% 22%
NEBRASKA
GOAL 7
GOAL 8
U.S.
baseline update progress?
Nebraska
baseline update progress?
Range of State Scores
baseline update
MedianScores†
baseline update
Safe, Disciplined and Alcohol- and Drug-free Schools
Parental Participation
Usedmarijuana
Had 5 ormore drinks
in a row
Were offered, sold,or given an illegal drug
on school property
1
1
2
0% 20% 40% 60% 80% 100%
1991 1993
9%
10%ns
ns
37%
36%
11%
Alcohol- andDrug-freeSchoolsPercentage ofpublic high schoolstudents whoreported the fol-lowing(Indicators 23,24, & 25)
1 During the past 30 days.2 During the past 12 months.nsInterpret with caution. Change was not statistically significant.
0% 20% 40% 60% 80% 100%
Establishingcurriculum
One ormore areas
Hiring newfull-timeteachers
Settingdiscipline
policy
1991 1994
17%
15%
7%
7%
4%
5%
9%
6%
ns
ns
ns
Parent-SchoolPartnershipsPercentage of public school principals whoreported that theparent associationhas influence1 onthe following areas(Indicator 33)
1 On a 6-point scale from no influence to a great deal of influence, defined asa response to the top two points.
nsInterpret with caution. Change was not statistically significant.
KEY
KEY
!! Significant progress
@@ Significant decline
## Change is not significant
Scorecards #2 (MO-VI) 10/30/97 11:57 AM Page 187

188
8. Increased reading achievement in Grade 4? (1992, 1994) • — — 29% 30% ## 8-38% 8-41% 26% 27%9. Increased mathematics achievement •
• in Grade 4? (1996) 14% — 21% — 3-31% — 20% —• in Grade 8? (1990, 1996) — — 15% 24% !! 1-27% 5-34% 15% 22%
10. Increased science achievement in Grade 8? (1996) — — 29% — 5-41% — 27% —
NEVADA
† Median is the middle score in a set of ranked scores.* Comparable national data are not available.— Data not available. See Appendix A.• Baseline years and most recent update years may differ by state
for this indicator. See Appendix C for more information.See pages 72-75 for a Guide to Reading the State Pages.See Appendix C for technical notes and sources.
GOAL 1
GOAL 2
GOAL 3
Nevada
baseline update progress?
Range of State Scores
baseline update
MedianScores†
baseline update
U.S.
baseline update progress?
1. Reduced percentage of infants born in the state with 1 or more health risks? (1990, 1995) 38% 35% !! 37% 34% !! 25-48% 24-46% 38% 35%2. Increased percentage of 2-year-olds immunized? (1994, 1996) 69% 71% ## 75% 78% !! 61-88% 64-88% 76% 79%3. Reduced number of infants (per 1,000) born with low birthweight? (1990, 1995) 72 74 @@ 70 73 @@ 48-151 53-134 71 754. Increased number of mothers (per 1,000) receiving early prenatal care? (1990, 1995) 725 757 !! 758 813 !! 469-868 560-900 778 8285. Increased number of children with disabilities in preschool (per 1,000)? (1991, 1996) 26 44 !! * * 16-68 16-92 38 47
6. Increased high school completion rate? (1990, 1995) 83% 81% ## 86% 86% ## 77-96% 79-96% 87% 88%7. Reduced high school dropout rate? (1992, 1994) • 8% 10% @@ * * 3-12% 3-10% 5% 5%
Ready to Learn
School Completion
Student Achievement and Citizenship
19951990
81%
100%
80%
60%
40%
20%
0%
83% ns
High School CompletionPercentage of all18- to 24-year-olds1
who have a highschool credential2(Indicator 6)
1 Does not include those still in high school.2 Includes traditional high school diploma and alternative credential.nsInterpret with caution. Change was not statistically significant.
0%
20%
40%
60%
80%
100%
19951990
35%38%
Children’sHealth IndexPercentage ofinfants born with 1or more healthrisks1 (Indicator 1)
1 Includes late (in third trimester) or no prenatal care, low maternal weightgain (less than 21 pounds), mother smoked during pregnancy, or motherdrank alcohol during pregnancy.
KEY
KEY
!! Significant progress
@@ Significant decline
## Change is not significant
Scorecards #2 (MO-VI) 10/30/97 11:57 AM Page 188

189
† Median is the middle score in a set of ranked scores.° See Table 8 for the numbers for each subject area.— Data not available. See Appendix A.∞ This information had not been released when the 1997 Goals Report
went to print.See pages 72-75 for a Guide to Reading the State Pages.See Appendix C for technical notes and sources.
11. Increased the number of Advanced Placement examinations receiving a grade of 3 or higher (per 1,000)? (1991, 1997)° 38 57 !! 55 85 !! 9-177 18-223 41 65
12. Increased the percentage of public secondary school teachers who hold • a degree in main teaching assignment? (1991, 1994) 62% 66% ## 66% 63% @@ 51-85% 50-81% 69% 64%• a teaching certificate in main teaching assignment? (1991, 1994) 96% 98% ## 94% 93% @@ 91-100% 89-100% 98% 97%
13. Increased the percentage of public school teachers participating in professional development on 1 or more selected topics? (1994) 81% — 85% — 76-98% — 86% —
14. Increased the percentage of public school teachers with training to teach limited English-proficient students? (1994) 27% — 16% — 4-81% — 16% —
15. Increased the percentage of beginning public school teachers participating in a formal teacher induction program? (1991, 1994) 21% 17% ## 22% 27% !! 6-42% 7-48% 20% 23%
16. International comparisons in mathematics and science will be reported in future Goals Panel reports.∞ — — — — — — — —
NEVADA
GOAL 3
GOAL 4
GOAL 5
U.S.
baseline update progress?
Nevada
baseline update progress?
Range of State Scores
baseline update
MedianScores†
baseline update
Student Achievement and Citizenship (continued)
Teacher Education and Professional Development
Mathematics and Science
MathematicsGrade 4
1996
100%
80%
60%
40%
20%
0%
14%
Student AchievementPercentage of public school students who metthe Goals Panel’sperformancestandard1 in reading and mathematics (Indicators 8 & 9)
1 A complete description of the performance standard can be found inAppendix C. 0 2
0
40
60
80
10
0
0% 20% 40% 60% 80% 100%
Uses ofeducationaltechnology
One ormore topics
Methods ofteaching
subject fieldIn-depthstudy in
subject field
Studentassessment
81%
31%
63%
31%
39%
Professional DevelopmentPercentage ofpublic schoolteachers partici-pating in profes-sional develop-ment on thefollowing topics,1994(Indicator 13)KEY
KEY
!! Significant progress
@@ Significant decline
## Change is not significant
Scorecards #2 (MO-VI) 10/30/97 11:57 AM Page 189

190
20. Increased adult literacy? (1992) — — 52% — 46-77% — 53% —21. Increased the percentage of U.S. citizens
• registered to vote? (1988, 1992) 58% 68% !! 70% 73% !! 58-95% 63-92% 71% 75%• voting? (1988, 1992) 50% 63% !! 61% 66% !! 50-74% 55-77% 62% 68%
22. Increased postsecondary enrollment? (1992, 1994) 33% 38% ❊ ** ** 33-68% 37-71% 53% 55%
NEVADA
† Median is the middle score in a set of ranked scores.— Data not available. See Appendix A.** Indicators are not the same at the national and state level.❊ Sample size does not permit a reliable estimate of change.See pages 72-75 for a Guide to Reading the State Pages.See Appendix C for technical notes and sources.
GOAL 5
GOAL 6
Nevada
baseline update progress?
Range of State Scores
baseline update
MedianScores†
baseline update
U.S.
baseline update progress?
17. Increased the percentage of public school 8th graders whose mathematics teachers• have students work in small groups? (1996) — — 66% — 45-92% — 67% —• address Algebra and functions? (1996) — — 57% — 45-82% — 58% —• address reasoning and analytical ability? (1996) — — 52% — 39-64% — 48% —
18. Increased the percentage of public school 8th graders who have computers available in their mathematics classroom? (1996) — — 30% — 7-54% — 30% —
19. Increased mathematics and science degrees awarded to • all students? (1991, 1995) 30% 35% !! 39% 42% !! 25-49% 15-53% 39% 42%• minority (Black, Hispanic, American Indian/Alaskan Native) students? (1991, 1995) 26% 35% !! 39% 40% !! 22-64% 22-57% 39% 39%• female students? (1991, 1995) 27% 29% !! 35% 37% !! 23-46% 13-47% 33% 36%
Mathematics and Science (continued)
Adult Literacy and Lifelong Learning
KEY
KEY
!! Significant progress
@@ Significant decline
## Change is not significant
Scorecards #2 (MO-VI) 10/30/97 11:57 AM Page 190

191
† Median is the middle score in a set of ranked scores.** Indicators are not the same at the national and state level.— Data not available. See Appendix A.• Baseline years and most recent update years may differ by state
for this indicator. See Appendix C for more information.See pages 72-75 for a Guide to Reading the State Pages.See Appendix C for technical notes and sources.
23. Reduced marijuana use? (1993, 1995) • 19% 26% @@ ** ** 7-21% 7-32% 14% 23%24. Reduced alcohol use (more than 5 drinks in a row)? (1993, 1995) • 32% 33% ## ** ** 9-44% 13-43% 28% 31%25. Reduced availability of drugs on school property? (1993, 1995) • 30% 35% ## ** ** 11-31% 20-46% 22% 30%26. Reduced students threatened or injured with a weapon while on school property? (1993, 1995) • 10% 10% ## ** ** 6-15% 4-11% 8% 8%27. Reduced physical fights on school property? (1993, 1995) • 20% 19% ## ** ** 13-39% 12-19% 16% 15%28. Reduced students carrying weapons on school property? (1993, 1995) • 12% 11% ## ** ** 8-18% 7-14% 12% 11%29. Reduced students not feeling safe at school? (1993, 1995) • 8% 6% ## ** ** 3-23% 3-16% 6% 5%30. Reduced teacher victimization? (1994) 16% — 15% — 8-26% — 14% —31. Reduced student disruptions? (1991, 1994) 36% 50% @@ 37% 46% @@ 23-60% 33-65% 37% 47%
32. Decreased schools with minimal parental involvement• Teacher’s perspective? (1991, 1994) 27% 31% ## ** ** 9-44% 13-50% 23% 27%• Principal’s perspective? (1991, 1994) 17% 16% ## ** ** 4-22% 3-27% 13% 13%
33. Increased influence of parent associations? (1991, 1994) 12% 21% !! ** ** 8-37% 12-50% 16% 22%
NEVADA
GOAL 7
GOAL 8
U.S.
baseline update progress?
Nevada
baseline update progress?
Range of State Scores
baseline update
MedianScores†
baseline update
Safe, Disciplined and Alcohol- and Drug-free Schools
Parental Participation
Usedmarijuana
Had 5 ormore drinks
in a row
Were offered, sold,or given an illegal drug
on school property
1
1
2
0% 20% 40% 60% 80% 100%
1993 1995
26%
19%
32%
33%
30%
35%
ns
ns
Alcohol- andDrug-freeSchoolsPercentage ofpublic high schoolstudents whoreported the fol-lowing(Indicators 23,24, & 25)
1 During the past 30 days.2 During the past 12 months.nsInterpret with caution. Change was not statistically significant.
0% 20% 40% 60% 80% 100%
Establishingcurriculum
One ormore areas
Hiring newfull-timeteachers
Settingdiscipline
policy
1991 1994
12%
21%
6%
12%
3%
15%
6%
ns
Parent-SchoolPartnershipsPercentage of public school principals whoreported that theparent associationhas influence1 onthe following areas(Indicator 33)
1 On a 6-point scale from no influence to a great deal of influence, defined asa response to the top two points.
nsInterpret with caution. Change was not statistically significant.
KEY
KEY
!! Significant progress
@@ Significant decline
## Change is not significant
Scorecards #2 (MO-VI) 10/30/97 11:57 AM Page 191

192
8. Increased reading achievement in Grade 4? (1992, 1994) • 38% 36% ## 29% 30% ## 8-38% 8-41% 26% 27%9. Increased mathematics achievement •
• in Grade 4? (1992) 25% — 18% — 5-27% — 16% —• in Grade 8? (1990, 1992) 20% 25% !! 15% 21% !! 1-27% 1-31% 15% 18%
10. Increased science achievement in Grade 8? (1996) — — 29% — 5-41% — 27% —
NEW HAMPSHIRE
† Median is the middle score in a set of ranked scores.* Comparable national data are not available.— Data not available. See Appendix A.• Baseline years and most recent update years may differ by state
for this indicator. See Appendix C for more information.See pages 72-75 for a Guide to Reading the State Pages.See Appendix C for technical notes and sources.
GOAL 1
GOAL 2
GOAL 3
New Hampshire
baseline update progress?
Range of State Scores
baseline update
MedianScores†
baseline update
U.S.
baseline update progress?
1. Reduced percentage of infants born in the state with 1 or more health risks? (1990, 1995) 35% 32% !! 37% 34% !! 25-48% 24-46% 38% 35%2. Increased percentage of 2-year-olds immunized? (1994, 1996) 83% 84% ## 75% 78% !! 61-88% 64-88% 76% 79%3. Reduced number of infants (per 1,000) born with low birthweight? (1990, 1995) 49 55 @@ 70 73 @@ 48-151 53-134 71 754. Increased number of mothers (per 1,000) receiving early prenatal care? (1990, 1995) 858 900 !! 758 813 !! 469-868 560-900 778 8285. Increased number of children with disabilities in preschool (per 1,000)? (1991, 1996) 29 43 !! * * 16-68 16-92 38 47
6. Increased high school completion rate? (1990, 1995) 87% 88% ## 86% 86% ## 77-96% 79-96% 87% 88%7. Reduced high school dropout rate? (1992, 1994) • — — * * 3-12% 3-10% 5% 5%
Ready to Learn
School Completion
Student Achievement and Citizenship
19951990
88%
100%
80%
60%
40%
20%
0%
87%ns
High School CompletionPercentage of all18- to 24-year-olds1
who have a highschool credential2(Indicator 6)
1 Does not include those still in high school.2 Includes traditional high school diploma and alternative credential.nsInterpret with caution. Change was not statistically significant.
0%
20%
40%
60%
80%
100%
19951990
32%35%
Children’sHealth IndexPercentage ofinfants born with 1or more healthrisks1 (Indicator 1)
1 Includes late (in third trimester) or no prenatal care, low maternal weightgain (less than 21 pounds), mother smoked during pregnancy, or motherdrank alcohol during pregnancy.
KEY
KEY
!! Significant progress
@@ Significant decline
## Change is not significant
Scorecards #2 (MO-VI) 10/30/97 11:57 AM Page 192

193
† Median is the middle score in a set of ranked scores.° See Table 8 for the numbers for each subject area.— Data not available. See Appendix A.∞ This information had not been released when the 1997 Goals Report
went to print.See pages 72-75 for a Guide to Reading the State Pages.See Appendix C for technical notes and sources.
11. Increased the number of Advanced Placement examinations receiving a grade of 3 or higher (per 1,000)? (1991, 1997)° 51 84 !! 55 85 !! 9-177 18-223 41 65
12. Increased the percentage of public secondary school teachers who hold • a degree in main teaching assignment? (1991, 1994) 80% 71% @@ 66% 63% @@ 51-85% 50-81% 69% 64%• a teaching certificate in main teaching assignment? (1991, 1994) 96% 96% ## 94% 93% @@ 91-100% 89-100% 98% 97%
13. Increased the percentage of public school teachers participating in professional development on 1 or more selected topics? (1994) 89% — 85% — 76-98% — 86% —
14. Increased the percentage of public school teachers with training to teach limited English-proficient students? (1994) 13% — 16% — 4-81% — 16% —
15. Increased the percentage of beginning public school teachers participating in a formal teacher induction program? (1991, 1994) 12% 15% ## 22% 27% !! 6-42% 7-48% 20% 23%
16. International comparisons in mathematics and science will be reported in future Goals Panel reports.∞ — — — — — — — —
NEW HAMPSHIRE
GOAL 3
GOAL 4
GOAL 5
U.S.
baseline update progress?
New Hampshire
baseline update progress?
Range of State Scores
baseline update
MedianScores†
baseline update
Student Achievement and Citizenship (continued)
Teacher Education and Professional Development
Mathematics and Science
ReadingGrade 4
MathematicsGrade 4
199219941992
38%
100%
80%
60%
40%
20%
0%
25%
36%ns
Student AchievementPercentage of public school students who metthe Goals Panel’sperformancestandard1 in reading and mathematics (Indicators 8 & 9)
1 A complete description of the performance standard can be found inAppendix C.
nsInterpret with caution. Change was not statistically significant.0 2
0
40
60
80
10
0
0% 20% 40% 60% 80% 100%
Uses ofeducationaltechnology
One ormore topics
Methods ofteaching
subject fieldIn-depthstudy in
subject field
Studentassessment
89%
50%
72%
46%
53%
Professional DevelopmentPercentage ofpublic schoolteachers partici-pating in profes-sional develop-ment on thefollowing topics,1994(Indicator 13)KEY
KEY
!! Significant progress
@@ Significant decline
## Change is not significant
Scorecards #2 (MO-VI) 10/30/97 11:57 AM Page 193
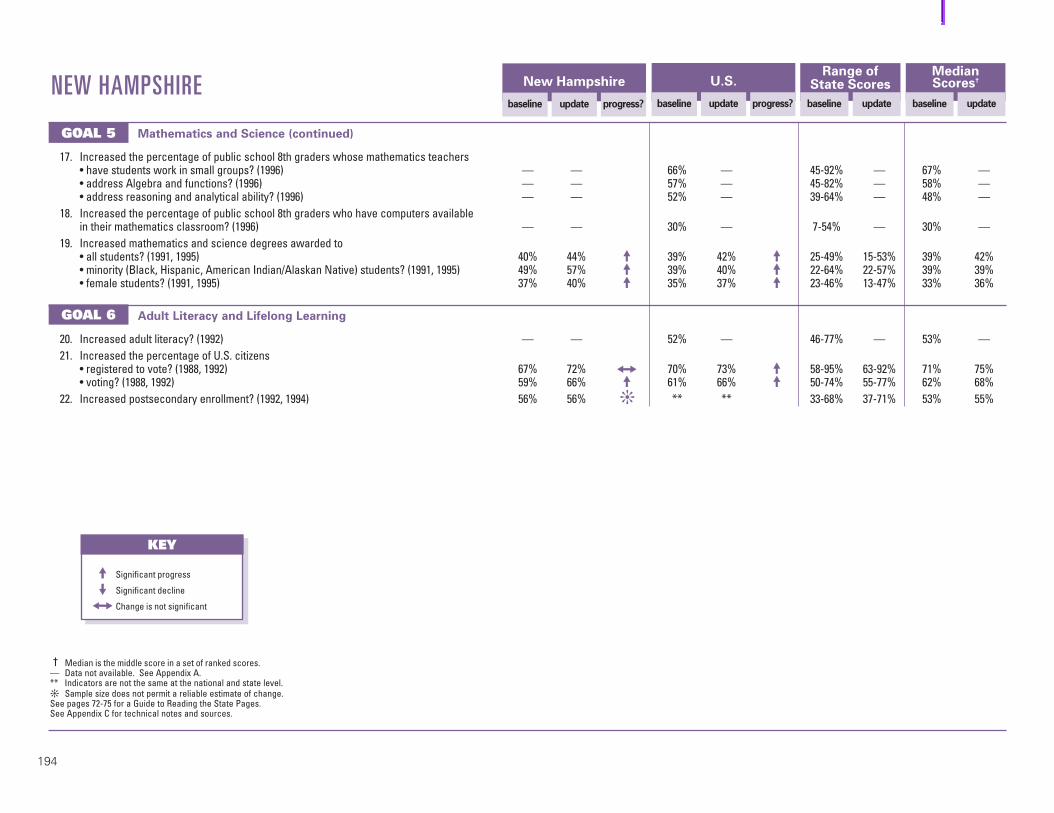
194
20. Increased adult literacy? (1992) — — 52% — 46-77% — 53% —21. Increased the percentage of U.S. citizens
• registered to vote? (1988, 1992) 67% 72% ## 70% 73% !! 58-95% 63-92% 71% 75%• voting? (1988, 1992) 59% 66% !! 61% 66% !! 50-74% 55-77% 62% 68%
22. Increased postsecondary enrollment? (1992, 1994) 56% 56% ❊ ** ** 33-68% 37-71% 53% 55%
NEW HAMPSHIRE
† Median is the middle score in a set of ranked scores.— Data not available. See Appendix A.** Indicators are not the same at the national and state level.❊ Sample size does not permit a reliable estimate of change.See pages 72-75 for a Guide to Reading the State Pages.See Appendix C for technical notes and sources.
GOAL 5
GOAL 6
New Hampshire
baseline update progress?
Range of State Scores
baseline update
MedianScores†
baseline update
U.S.
baseline update progress?
17. Increased the percentage of public school 8th graders whose mathematics teachers• have students work in small groups? (1996) — — 66% — 45-92% — 67% —• address Algebra and functions? (1996) — — 57% — 45-82% — 58% —• address reasoning and analytical ability? (1996) — — 52% — 39-64% — 48% —
18. Increased the percentage of public school 8th graders who have computers available in their mathematics classroom? (1996) — — 30% — 7-54% — 30% —
19. Increased mathematics and science degrees awarded to • all students? (1991, 1995) 40% 44% !! 39% 42% !! 25-49% 15-53% 39% 42%• minority (Black, Hispanic, American Indian/Alaskan Native) students? (1991, 1995) 49% 57% !! 39% 40% !! 22-64% 22-57% 39% 39%• female students? (1991, 1995) 37% 40% !! 35% 37% !! 23-46% 13-47% 33% 36%
Mathematics and Science (continued)
Adult Literacy and Lifelong Learning
KEY
KEY
!! Significant progress
@@ Significant decline
## Change is not significant
Scorecards #2 (MO-VI) 10/30/97 11:57 AM Page 194

195
† Median is the middle score in a set of ranked scores.** Indicators are not the same at the national and state level.— Data not available. See Appendix A.• Baseline years and most recent update years may differ by state
for this indicator. See Appendix C for more information.See pages 72-75 for a Guide to Reading the State Pages.See Appendix C for technical notes and sources.
23. Reduced marijuana use? (1993, 1995) • 21% 28% @@ ** ** 7-21% 7-32% 14% 23%24. Reduced alcohol use (more than 5 drinks in a row)? (1993, 1995) • 31% 33% ## ** ** 9-44% 13-43% 28% 31%25. Reduced availability of drugs on school property? (1993, 1995) • 26% 32% @@ ** ** 11-31% 20-46% 22% 30%26. Reduced students threatened or injured with a weapon while on school property? (1993, 1995) • 7% 6% ## ** ** 6-15% 4-11% 8% 8%27. Reduced physical fights on school property? (1993, 1995) • 15% 14% ## ** ** 13-39% 12-19% 16% 15%28. Reduced students carrying weapons on school property? (1993, 1995) • 12% 9% ## ** ** 8-18% 7-14% 12% 11%29. Reduced students not feeling safe at school? (1993, 1995) • 4% 3% ## ** ** 3-23% 3-16% 6% 5%30. Reduced teacher victimization? (1994) 13% — 15% — 8-26% — 14% —31. Reduced student disruptions? (1991, 1994) 34% 40% ## 37% 46% @@ 23-60% 33-65% 37% 47%
32. Decreased schools with minimal parental involvement• Teacher’s perspective? (1991, 1994) 17% 21% ## ** ** 9-44% 13-50% 23% 27%• Principal’s perspective? (1991, 1994) 8% 12% ## ** ** 4-22% 3-27% 13% 13%
33. Increased influence of parent associations? (1991, 1994) 13% 22% ## ** ** 8-37% 12-50% 16% 22%
NEW HAMPSHIRE
GOAL 7
GOAL 8
U.S.
baseline update progress?
New Hampshire
baseline update progress?
Range of State Scores
baseline update
MedianScores†
baseline update
Safe, Disciplined and Alcohol- and Drug-free Schools
Parental Participation
Usedmarijuana
Had 5 ormore drinks
in a row
Were offered, sold,or given an illegal drug
on school property
1
1
2
0% 20% 40% 60% 80% 100%
1993 1995
28%
21%
31%
33%
26%
32%
ns
Alcohol- andDrug-freeSchoolsPercentage ofpublic high schoolstudents whoreported the fol-lowing(Indicators 23,24, & 25)
1 During the past 30 days.2 During the past 12 months.nsInterpret with caution. Change was not statistically significant.
0% 20% 40% 60% 80% 100%
Establishingcurriculum
One ormore areas
Hiring newfull-timeteachers
Settingdiscipline
policy
1991 1994
13%
ns
22%
2%
14%
11%
4%
18%
8%ns
ns
Parent-SchoolPartnershipsPercentage of public school principals whoreported that theparent associationhas influence1 onthe following areas(Indicator 33)
1 On a 6-point scale from no influence to a great deal of influence, defined asa response to the top two points.
nsInterpret with caution. Change was not statistically significant.
KEY
KEY
!! Significant progress
@@ Significant decline
## Change is not significant
Scorecards #2 (MO-VI) 10/30/97 11:57 AM Page 195

196
8. Increased reading achievement in Grade 4? (1992, 1994) • 35% 33% ## 29% 30% ## 8-38% 8-41% 26% 27%9. Increased mathematics achievement •
• in Grade 4? (1992, 1996) 25% 25% ## 18% 21% !! 5-27% 3-31% 16% 20%• in Grade 8? (1990, 1992) 21% 24% ## 15% 21% !! 1-27% 1-31% 15% 18%
10. Increased science achievement in Grade 8? (1996) — — 29% — 5-41% — 27% —
NEW JERSEY
† Median is the middle score in a set of ranked scores.* Comparable national data are not available.— Data not available. See Appendix A.• Baseline years and most recent update years may differ by state
for this indicator. See Appendix C for more information.See pages 72-75 for a Guide to Reading the State Pages.See Appendix C for technical notes and sources.
GOAL 1
GOAL 2
GOAL 3
New Jersey
baseline update progress?
Range of State Scores
baseline update
MedianScores†
baseline update
U.S.
baseline update progress?
1. Reduced percentage of infants born in the state with 1 or more health risks? (1990, 1995) 31% 29% !! 37% 34% !! 25-48% 24-46% 38% 35%2. Increased percentage of 2-year-olds immunized? (1994, 1996) 71% 78% ## 75% 78% !! 61-88% 64-88% 76% 79%3. Reduced number of infants (per 1,000) born with low birthweight? (1990, 1995) 70 76 @@ 70 73 @@ 48-151 53-134 71 754. Increased number of mothers (per 1,000) receiving early prenatal care? (1990, 1995) 817 828 !! 758 813 !! 469-868 560-900 778 8285. Increased number of children with disabilities in preschool (per 1,000)? (1991, 1996) 47 47 ## * * 16-68 16-92 38 47
6. Increased high school completion rate? (1990, 1995) 90% 87% ## 86% 86% ## 77-96% 79-96% 87% 88%7. Reduced high school dropout rate? (1992, 1994) • — — * * 3-12% 3-10% 5% 5%
Ready to Learn
School Completion
Student Achievement and Citizenship
19951990
87%
100%
80%
60%
40%
20%
0%
90% ns
High School CompletionPercentage of all18- to 24-year-olds1
who have a highschool credential2(Indicator 6)
1 Does not include those still in high school.2 Includes traditional high school diploma and alternative credential.nsInterpret with caution. Change was not statistically significant.
0%
20%
40%
60%
80%
100%
19951990
29%31%
Children’sHealth IndexPercentage ofinfants born with 1or more healthrisks1 (Indicator 1)
1 Includes late (in third trimester) or no prenatal care, low maternal weightgain (less than 21 pounds), mother smoked during pregnancy, or motherdrank alcohol during pregnancy.
KEY
KEY
!! Significant progress
@@ Significant decline
## Change is not significant
Scorecards #2 (MO-VI) 10/30/97 11:57 AM Page 196

197
† Median is the middle score in a set of ranked scores.° See Table 8 for the numbers for each subject area.— Data not available. See Appendix A.∞ This information had not been released when the 1997 Goals Report
went to print.See pages 72-75 for a Guide to Reading the State Pages.See Appendix C for technical notes and sources.
11. Increased the number of Advanced Placement examinations receiving a grade of 3 or higher (per 1,000)? (1991, 1997)° 81 137 !! 55 85 !! 9-177 18-223 41 65
12. Increased the percentage of public secondary school teachers who hold • a degree in main teaching assignment? (1991, 1994) 69% 69% ## 66% 63% @@ 51-85% 50-81% 69% 64%• a teaching certificate in main teaching assignment? (1991, 1994) 97% 97% ## 94% 93% @@ 91-100% 89-100% 98% 97%
13. Increased the percentage of public school teachers participating in professional development on 1 or more selected topics? (1994) 87% — 85% — 76-98% — 86% —
14. Increased the percentage of public school teachers with training to teach limited English-proficient students? (1994) 12% — 16% — 4-81% — 16% —
15. Increased the percentage of beginning public school teachers participating in a formal teacher induction program? (1991, 1994) 18% 17% ## 22% 27% !! 6-42% 7-48% 20% 23%
16. International comparisons in mathematics and science will be reported in future Goals Panel reports.∞ — — — — — — — —
NEW JERSEY
GOAL 3
GOAL 4
GOAL 5
U.S.
baseline update progress?
New Jersey
baseline update progress?
Range of State Scores
baseline update
MedianScores†
baseline update
Student Achievement and Citizenship (continued)
Teacher Education and Professional Development
Mathematics and Science
ReadingGrade 4
MathematicsGrade 4
1996199219941992
100%
80%
60%
40%
20%
0%
33%35%
25% 25%
ns
Student AchievementPercentage of public school students who metthe Goals Panel’sperformancestandard1 in reading and mathematics (Indicators 8 & 9)
1 A complete description of the performance standard can be found inAppendix C.
nsInterpret with caution. Change was not statistically significant.0 2
0
40
60
80
10
0
0% 20% 40% 60% 80% 100%
Uses ofeducationaltechnology
One ormore topics
Methods ofteaching
subject fieldIn-depthstudy in
subject field
Studentassessment
87%
50%
65%
27%
49%
Professional DevelopmentPercentage ofpublic schoolteachers partici-pating in profes-sional develop-ment on thefollowing topics,1994(Indicator 13)KEY
KEY
!! Significant progress
@@ Significant decline
## Change is not significant
Scorecards #2 (MO-VI) 10/30/97 11:57 AM Page 197

198
20. Increased adult literacy? (1992) 53% — 52% — 46-77% — 53% —21. Increased the percentage of U.S. citizens
• registered to vote? (1988, 1992) 72% 75% !! 70% 73% !! 58-95% 63-92% 71% 75%• voting? (1988, 1992) 64% 67% !! 61% 66% !! 50-74% 55-77% 62% 68%
22. Increased postsecondary enrollment? (1992, 1994) 60% 64% ❊ ** ** 33-68% 37-71% 53% 55%
NEW JERSEY
† Median is the middle score in a set of ranked scores.— Data not available. See Appendix A.** Indicators are not the same at the national and state level.❊ Sample size does not permit a reliable estimate of change.See pages 72-75 for a Guide to Reading the State Pages.See Appendix C for technical notes and sources.
GOAL 5
GOAL 6
New Jersey
baseline update progress?
Range of State Scores
baseline update
MedianScores†
baseline update
U.S.
baseline update progress?
17. Increased the percentage of public school 8th graders whose mathematics teachers• have students work in small groups? (1996) — — 66% — 45-92% — 67% —• address Algebra and functions? (1996) — — 57% — 45-82% — 58% —• address reasoning and analytical ability? (1996) — — 52% — 39-64% — 48% —
18. Increased the percentage of public school 8th graders who have computers available in their mathematics classroom? (1996) — — 30% — 7-54% — 30% —
19. Increased mathematics and science degrees awarded to • all students? (1991, 1995) 43% 45% !! 39% 42% !! 25-49% 15-53% 39% 42%• minority (Black, Hispanic, American Indian/Alaskan Native) students? (1991, 1995) 48% 48% ## 39% 40% !! 22-64% 22-57% 39% 39%• female students? (1991, 1995) 39% 41% !! 35% 37% !! 23-46% 13-47% 33% 36%
Mathematics and Science (continued)
Adult Literacy and Lifelong Learning
KEY
KEY
!! Significant progress
@@ Significant decline
## Change is not significant
53%47%
3 highest levels2 lowest levels
Adult LiteracyPercentage ofadults who scoredat 3 highest levelsin Prose Literacy(Indicator 20)
Scorecards #2 (MO-VI) 10/30/97 11:57 AM Page 198
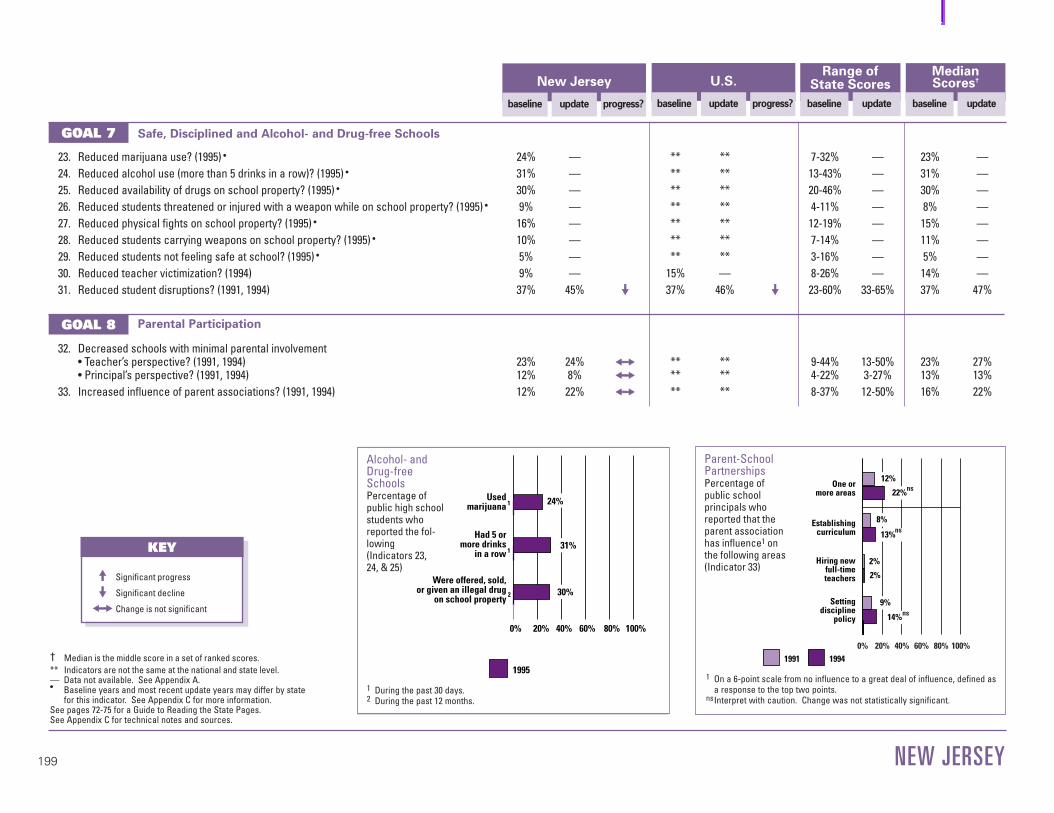
199
† Median is the middle score in a set of ranked scores.** Indicators are not the same at the national and state level.— Data not available. See Appendix A.• Baseline years and most recent update years may differ by state
for this indicator. See Appendix C for more information.See pages 72-75 for a Guide to Reading the State Pages.See Appendix C for technical notes and sources.
23. Reduced marijuana use? (1995) • 24% — ** ** 7-32% — 23% —24. Reduced alcohol use (more than 5 drinks in a row)? (1995) • 31% — ** ** 13-43% — 31% —25. Reduced availability of drugs on school property? (1995) • 30% — ** ** 20-46% — 30% —26. Reduced students threatened or injured with a weapon while on school property? (1995) • 9% — ** ** 4-11% — 8% —27. Reduced physical fights on school property? (1995) • 16% — ** ** 12-19% — 15% —28. Reduced students carrying weapons on school property? (1995) • 10% — ** ** 7-14% — 11% —29. Reduced students not feeling safe at school? (1995) • 5% — ** ** 3-16% — 5% —30. Reduced teacher victimization? (1994) 9% — 15% — 8-26% — 14% —31. Reduced student disruptions? (1991, 1994) 37% 45% @@ 37% 46% @@ 23-60% 33-65% 37% 47%
32. Decreased schools with minimal parental involvement• Teacher’s perspective? (1991, 1994) 23% 24% ## ** ** 9-44% 13-50% 23% 27%• Principal’s perspective? (1991, 1994) 12% 8% ## ** ** 4-22% 3-27% 13% 13%
33. Increased influence of parent associations? (1991, 1994) 12% 22% ## ** ** 8-37% 12-50% 16% 22%
NEW JERSEY
GOAL 7
GOAL 8
U.S.
baseline update progress?
New Jersey
baseline update progress?
Range of State Scores
baseline update
MedianScores†
baseline update
Safe, Disciplined and Alcohol- and Drug-free Schools
Parental Participation
Usedmarijuana
Had 5 ormore drinks
in a row
Were offered, sold,or given an illegal drug
on school property
1
1
2
0% 20% 40% 60% 80% 100%
1995
24%
31%
30%
Alcohol- andDrug-freeSchoolsPercentage ofpublic high schoolstudents whoreported the fol-lowing(Indicators 23,24, & 25)
1 During the past 30 days.2 During the past 12 months.
0% 20% 40% 60% 80% 100%
Establishingcurriculum
One ormore areas
Hiring newfull-timeteachers
Settingdiscipline
policy
1991 1994
12%
22%
8%
13%
2%
2%
14%
9%
ns
ns
ns
Parent-SchoolPartnershipsPercentage of public school principals whoreported that theparent associationhas influence1 onthe following areas(Indicator 33)
1 On a 6-point scale from no influence to a great deal of influence, defined asa response to the top two points.
nsInterpret with caution. Change was not statistically significant.
KEY
KEY
!! Significant progress
@@ Significant decline
## Change is not significant
Scorecards #2 (MO-VI) 10/30/97 11:57 AM Page 199
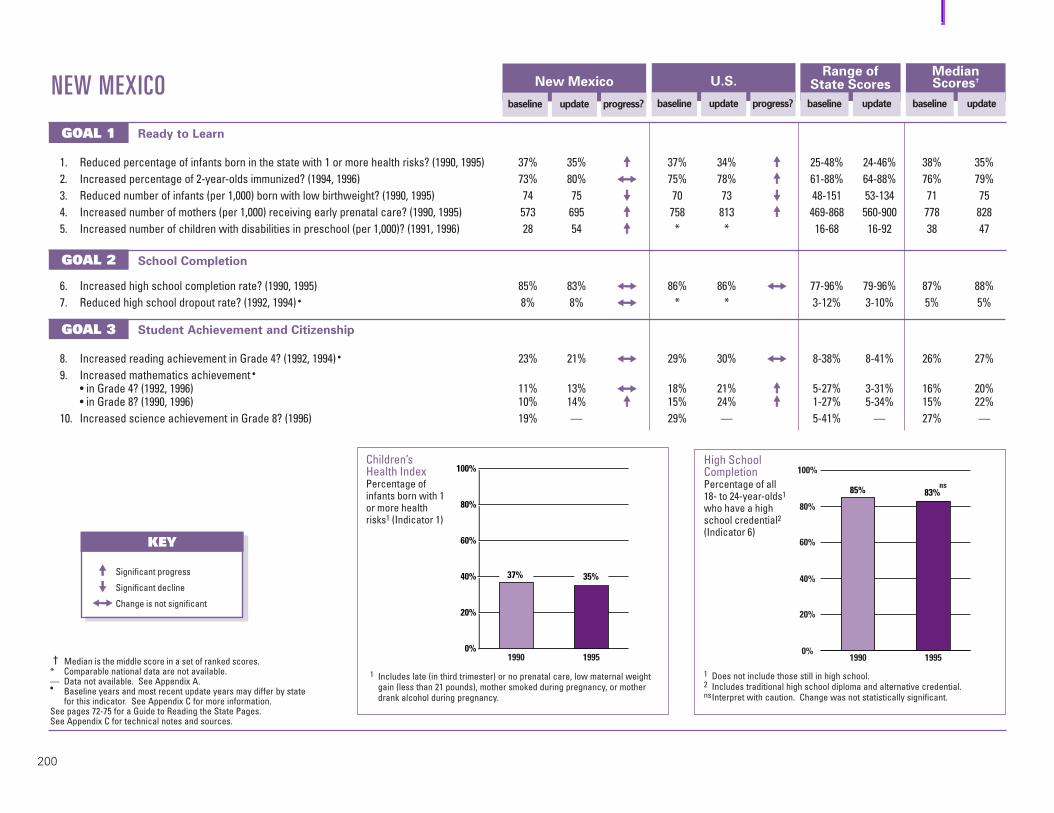
200
8. Increased reading achievement in Grade 4? (1992, 1994) • 23% 21% ## 29% 30% ## 8-38% 8-41% 26% 27%9. Increased mathematics achievement •
• in Grade 4? (1992, 1996) 11% 13% ## 18% 21% !! 5-27% 3-31% 16% 20%• in Grade 8? (1990, 1996) 10% 14% !! 15% 24% !! 1-27% 5-34% 15% 22%
10. Increased science achievement in Grade 8? (1996) 19% — 29% — 5-41% — 27% —
NEW MEXICO
† Median is the middle score in a set of ranked scores.* Comparable national data are not available.— Data not available. See Appendix A.• Baseline years and most recent update years may differ by state
for this indicator. See Appendix C for more information.See pages 72-75 for a Guide to Reading the State Pages.See Appendix C for technical notes and sources.
GOAL 1
GOAL 2
GOAL 3
New Mexico
baseline update progress?
Range of State Scores
baseline update
MedianScores†
baseline update
U.S.
baseline update progress?
1. Reduced percentage of infants born in the state with 1 or more health risks? (1990, 1995) 37% 35% !! 37% 34% !! 25-48% 24-46% 38% 35%2. Increased percentage of 2-year-olds immunized? (1994, 1996) 73% 80% ## 75% 78% !! 61-88% 64-88% 76% 79%3. Reduced number of infants (per 1,000) born with low birthweight? (1990, 1995) 74 75 @@ 70 73 @@ 48-151 53-134 71 754. Increased number of mothers (per 1,000) receiving early prenatal care? (1990, 1995) 573 695 !! 758 813 !! 469-868 560-900 778 8285. Increased number of children with disabilities in preschool (per 1,000)? (1991, 1996) 28 54 !! * * 16-68 16-92 38 47
6. Increased high school completion rate? (1990, 1995) 85% 83% ## 86% 86% ## 77-96% 79-96% 87% 88%7. Reduced high school dropout rate? (1992, 1994) • 8% 8% ## * * 3-12% 3-10% 5% 5%
Ready to Learn
School Completion
Student Achievement and Citizenship
19951990
83%
100%
80%
60%
40%
20%
0%
85% ns
High School CompletionPercentage of all18- to 24-year-olds1
who have a highschool credential2(Indicator 6)
1 Does not include those still in high school.2 Includes traditional high school diploma and alternative credential.nsInterpret with caution. Change was not statistically significant.
0%
20%
40%
60%
80%
100%
19951990
35%37%
Children’sHealth IndexPercentage ofinfants born with 1or more healthrisks1 (Indicator 1)
1 Includes late (in third trimester) or no prenatal care, low maternal weightgain (less than 21 pounds), mother smoked during pregnancy, or motherdrank alcohol during pregnancy.
KEY
KEY
!! Significant progress
@@ Significant decline
## Change is not significant
Scorecards #2 (MO-VI) 10/30/97 11:57 AM Page 200

201
† Median is the middle score in a set of ranked scores.° See Table 8 for the numbers for each subject area.— Data not available. See Appendix A.∞ This information had not been released when the 1997 Goals Report
went to print.See pages 72-75 for a Guide to Reading the State Pages.See Appendix C for technical notes and sources.
11. Increased the number of Advanced Placement examinations receiving a grade of 3 or higher (per 1,000)? (1991, 1997)° 41 45 !! 55 85 !! 9-177 18-223 41 65
12. Increased the percentage of public secondary school teachers who hold • a degree in main teaching assignment? (1991, 1994) 53% 52% ## 66% 63% @@ 51-85% 50-81% 69% 64%• a teaching certificate in main teaching assignment? (1991, 1994) 98% 96% ## 94% 93% @@ 91-100% 89-100% 98% 97%
13. Increased the percentage of public school teachers participating in professional development on 1 or more selected topics? (1994) 79% — 85% — 76-98% — 86% —
14. Increased the percentage of public school teachers with training to teach limited English-proficient students? (1994) 39% — 16% — 4-81% — 16% —
15. Increased the percentage of beginning public school teachers participating in a formal teacher induction program? (1991, 1994) 30% 31% ## 22% 27% !! 6-42% 7-48% 20% 23%
16. International comparisons in mathematics and science will be reported in future Goals Panel reports.∞ — — — — — — — —
NEW MEXICO
GOAL 3
GOAL 4
GOAL 5
U.S.
baseline update progress?
New Mexico
baseline update progress?
Range of State Scores
baseline update
MedianScores†
baseline update
Student Achievement and Citizenship (continued)
Teacher Education and Professional Development
Mathematics and Science
ReadingGrade 4
MathematicsGrade 4
1996199219941992
100%
80%
60%
40%
20%
0%
21%23%
11%13%
ns
ns
Student AchievementPercentage of public school students who metthe Goals Panel’sperformancestandard1 in reading and mathematics (Indicators 8 & 9)
1 A complete description of the performance standard can be found inAppendix C.
nsInterpret with caution. Change was not statistically significant.0 2
0
40
60
80
10
0
0% 20% 40% 60% 80% 100%
Uses ofeducationaltechnology
One ormore topics
Methods ofteaching
subject fieldIn-depthstudy in
subject field
Studentassessment
79%
44%
56%
24%
44%
Professional DevelopmentPercentage ofpublic schoolteachers partici-pating in profes-sional develop-ment on thefollowing topics,1994(Indicator 13)KEY
KEY
!! Significant progress
@@ Significant decline
## Change is not significant
Scorecards #2 (MO-VI) 10/30/97 11:57 AM Page 201

202
20. Increased adult literacy? (1992) — — 52% — 46-77% — 53% —21. Increased the percentage of U.S. citizens
• registered to vote? (1988, 1992) 69% 71% ## 70% 73% !! 58-95% 63-92% 71% 75%• voting? (1988, 1992) 58% 66% !! 61% 66% !! 50-74% 55-77% 62% 68%
22. Increased postsecondary enrollment? (1992, 1994) 49% 54% ❊ ** ** 33-68% 37-71% 53% 55%
NEW MEXICO
† Median is the middle score in a set of ranked scores.— Data not available. See Appendix A.** Indicators are not the same at the national and state level.❊ Sample size does not permit a reliable estimate of change.See pages 72-75 for a Guide to Reading the State Pages.See Appendix C for technical notes and sources.
GOAL 5
GOAL 6
New Mexico
baseline update progress?
Range of State Scores
baseline update
MedianScores†
baseline update
U.S.
baseline update progress?
17. Increased the percentage of public school 8th graders whose mathematics teachers• have students work in small groups? (1996) 67% — 66% — 45-92% — 67% —• address Algebra and functions? (1996) 60% — 57% — 45-82% — 58% —• address reasoning and analytical ability? (1996) 45% — 52% — 39-64% — 48% —
18. Increased the percentage of public school 8th graders who have computers available in their mathematics classroom? (1996) 29% — 30% — 7-54% — 30% —
19. Increased mathematics and science degrees awarded to • all students? (1991, 1995) 40% 40% ## 39% 42% !! 25-49% 15-53% 39% 42%• minority (Black, Hispanic, American Indian/Alaskan Native) students? (1991, 1995) 38% 37% @@ 39% 40% !! 22-64% 22-57% 39% 39%• female students? (1991, 1995) 33% 34% !! 35% 37% !! 23-46% 13-47% 33% 36%
Mathematics and Science (continued)
Adult Literacy and Lifelong Learning
Addressreasoning & analytical
ability
AddressAlgebra and functions
Work insmall groups
or with apartner
0% 20% 40% 60% 80% 100%
67%
45%
60%
1
2
2
MathematicsInstructionPercentage ofpublic school 8thgraders whosemathematicsteachers do thefollowing, 1996(Indicator 17)
1 At least once a week.2 On a 4-point scale from “none” to “a lot,” defined as a response to the top point.
KEY
KEY
!! Significant progress
@@ Significant decline
## Change is not significant
Scorecards #2 (MO-VI) 10/30/97 11:57 AM Page 202

203
† Median is the middle score in a set of ranked scores.** Indicators are not the same at the national and state level.— Data not available. See Appendix A.• Baseline years and most recent update years may differ by state
for this indicator. See Appendix C for more information.See pages 72-75 for a Guide to Reading the State Pages.See Appendix C for technical notes and sources.
23. Reduced marijuana use? (1991) • 18% — ** ** 4-18% — 10% —24. Reduced alcohol use (more than 5 drinks in a row)? (1991) • 43% — ** ** 17-43% — 30% —25. Reduced availability of drugs on school property? (1993, 1995) • — — ** ** 11-31% 20-46% 22% 30%26. Reduced students threatened or injured with a weapon while on school property? (1993, 1995) • — — ** ** 6-15% 4-11% 8% 8%27. Reduced physical fights on school property? (1993, 1995) • — — ** ** 13-39% 12-19% 16% 15%28. Reduced students carrying weapons on school property? (1993, 1995) • — — ** ** 8-18% 7-14% 12% 11%29. Reduced students not feeling safe at school? (1993, 1995) • — — ** ** 3-23% 3-16% 6% 5%30. Reduced teacher victimization? (1994) 14% — 15% — 8-26% — 14% —31. Reduced student disruptions? (1991, 1994) 40% 45% ## 37% 46% @@ 23-60% 33-65% 37% 47%
32. Decreased schools with minimal parental involvement• Teacher’s perspective? (1991, 1994) 31% 33% ## ** ** 9-44% 13-50% 23% 27%• Principal’s perspective? (1991, 1994) 16% 15% ## ** ** 4-22% 3-27% 13% 13%
33. Increased influence of parent associations? (1991, 1994) 25% 40% !! ** ** 8-37% 12-50% 16% 22%
NEW MEXICO
GOAL 7
GOAL 8
U.S.
baseline update progress?
New Mexico
baseline update progress?
Range of State Scores
baseline update
MedianScores†
baseline update
Safe, Disciplined and Alcohol- and Drug-free Schools
Parental Participation
Usedmarijuana
Had 5 ormore drinks
in a row
1
1
0% 20% 40% 60% 80% 100%
1991
18%
43%
Alcohol- andDrug-freeSchoolsPercentage ofpublic high schoolstudents whoreported the fol-lowing(Indicators 23,24, & 25)
1 During the past 30 days.
0% 20% 40% 60% 80% 100%
Establishingcurriculum
One ormore areas
Hiring newfull-timeteachers
Settingdiscipline
policy
1991 1994
25%
40%
7%
17%
13%
30%
21%ns
Parent-SchoolPartnershipsPercentage of public school principals whoreported that theparent associationhas influence1 onthe following areas(Indicator 33)
1 On a 6-point scale from no influence to a great deal of influence, defined asa response to the top two points.
nsInterpret with caution. Change was not statistically significant.
KEY
KEY
!! Significant progress
@@ Significant decline
## Change is not significant
Scorecards #2 (MO-VI) 10/30/97 11:57 AM Page 203

204
8. Increased reading achievement in Grade 4? (1992, 1994) • 27% 27% ## 29% 30% ## 8-38% 8-41% 26% 27%9. Increased mathematics achievement •
• in Grade 4? (1992, 1996) 17% 20% ## 18% 21% !! 5-27% 3-31% 16% 20%• in Grade 8? (1990, 1996) 15% 22% !! 15% 24% !! 1-27% 5-34% 15% 22%
10. Increased science achievement in Grade 8? (1996) 27% — 29% — 5-41% — 27% —
NEW YORK
† Median is the middle score in a set of ranked scores.* Comparable national data are not available.— Data not available. See Appendix A.• Baseline years and most recent update years may differ by state
for this indicator. See Appendix C for more information.See pages 72-75 for a Guide to Reading the State Pages.See Appendix C for technical notes and sources.
GOAL 1
GOAL 2
GOAL 3
New York
baseline update progress?
Range of State Scores
baseline update
MedianScores†
baseline update
U.S.
baseline update progress?
1. Reduced percentage of infants born in the state with 1 or more health risks? (1990, 1995) — — 37% 34% !! 25-48% 24-46% 38% 35%2. Increased percentage of 2-year-olds immunized? (1994, 1996) 77% 82% ## 75% 78% !! 61-88% 64-88% 76% 79%3. Reduced number of infants (per 1,000) born with low birthweight? (1990, 1995) 76 76 ## 70 73 @@ 48-151 53-134 71 754. Increased number of mothers (per 1,000) receiving early prenatal care? (1990, 1995) 731 780 !! 758 813 !! 469-868 560-900 778 8285. Increased number of children with disabilities in preschool (per 1,000)? (1991, 1996) 35 58 !! * * 16-68 16-92 38 47
6. Increased high school completion rate? (1990, 1995) 88% 91% !! 86% 86% ## 77-96% 79-96% 87% 88%7. Reduced high school dropout rate? (1993, 1994) • 4% 4% ## * * 2-10% 3-10% 5% 5%
Ready to Learn
School Completion
Student Achievement and Citizenship
19951990
91%100%
80%
60%
40%
20%
0%
88%
High School CompletionPercentage of all18- to 24-year-olds1
who have a highschool credential2(Indicator 6)
1 Does not include those still in high school.2 Includes traditional high school diploma and alternative credential.
KEY
KEY
!! Significant progress
@@ Significant decline
## Change is not significant
Scorecards #2 (MO-VI) 10/30/97 11:57 AM Page 204

205
† Median is the middle score in a set of ranked scores.° See Table 8 for the numbers for each subject area.— Data not available. See Appendix A.∞ This information had not been released when the 1997 Goals Report
went to print.See pages 72-75 for a Guide to Reading the State Pages.See Appendix C for technical notes and sources.
11. Increased the number of Advanced Placement examinations receiving a grade of 3 or higher (per 1,000)? (1991, 1997)° 97 145 !! 55 85 !! 9-177 18-223 41 65
12. Increased the percentage of public secondary school teachers who hold • a degree in main teaching assignment? (1991, 1994) 74% 75% ## 66% 63% @@ 51-85% 50-81% 69% 64%• a teaching certificate in main teaching assignment? (1991, 1994) 94% 93% ## 94% 93% @@ 91-100% 89-100% 98% 97%
13. Increased the percentage of public school teachers participating in professional development on 1 or more selected topics? (1994) 76% — 85% — 76-98% — 86% —
14. Increased the percentage of public school teachers with training to teach limited English-proficient students? (1994) 32% — 16% — 4-81% — 16% —
15. Increased the percentage of beginning public school teachers participating in a formal teacher induction program? (1991, 1994) 21% 31% !! 22% 27% !! 6-42% 7-48% 20% 23%
16. International comparisons in mathematics and science will be reported in future Goals Panel reports.∞ — — — — — — — —
NEW YORK
GOAL 3
GOAL 4
GOAL 5
U.S.
baseline update progress?
New York
baseline update progress?
Range of State Scores
baseline update
MedianScores†
baseline update
Student Achievement and Citizenship (continued)
Teacher Education and Professional Development
Mathematics and Science
ReadingGrade 4
MathematicsGrade 4
1996199219941992
100%
80%
60%
40%
20%
0%
27%27%
17% 20%ns
Student AchievementPercentage of public school students who metthe Goals Panel’sperformancestandard1 in reading and mathematics (Indicators 8 & 9)
1 A complete description of the performance standard can be found inAppendix C.
nsInterpret with caution. Change was not statistically significant.0 2
0
40
60
80
10
0
0% 20% 40% 60% 80% 100%
Uses ofeducationaltechnology
One ormore topics
Methods ofteaching
subject fieldIn-depthstudy in
subject field
Studentassessment
76%
38%
57%
24%
42%
Professional DevelopmentPercentage ofpublic schoolteachers partici-pating in profes-sional develop-ment on thefollowing topics,1994(Indicator 13)KEY
KEY
!! Significant progress
@@ Significant decline
## Change is not significant
Scorecards #2 (MO-VI) 10/30/97 11:57 AM Page 205

206
20. Increased adult literacy? (1992) 46% — 52% — 46-77% — 53% —21. Increased the percentage of U.S. citizens
• registered to vote? (1988, 1992) 67% 69% !! 70% 73% !! 58-95% 63-92% 71% 75%• voting? (1988, 1992) 60% 63% !! 61% 66% !! 50-74% 55-77% 62% 68%
22. Increased postsecondary enrollment? (1992, 1994) 67% 70% !! ** ** 33-68% 37-71% 53% 55%
NEW YORK
† Median is the middle score in a set of ranked scores.— Data not available. See Appendix A.** Indicators are not the same at the national and state level.See pages 72-75 for a Guide to Reading the State Pages.See Appendix C for technical notes and sources.
GOAL 5
GOAL 6
New York
baseline update progress?
Range of State Scores
baseline update
MedianScores†
baseline update
U.S.
baseline update progress?
17. Increased the percentage of public school 8th graders whose mathematics teachers • have students work in small groups? (1996) 54% — 66% — 45-92% — 67% —• address Algebra and functions? (1996) 62% — 57% — 45-82% — 58% —• address reasoning and analytical ability? (1996) 51% — 52% — 39-64% — 48% —
18. Increased the percentage of public school 8th graders who have computers available in their mathematics classroom? (1996) 11% — 30% — 7-54% — 30% —
19. Increased mathematics and science degrees awarded to • all students? (1991, 1995) 41% 43% !! 39% 42% !! 25-49% 15-53% 39% 42%• minority (Black, Hispanic, American Indian/Alaskan Native) students? (1991, 1995) 43% 43% ## 39% 40% !! 22-64% 22-57% 39% 39%• female students? (1991, 1995) 38% 40% !! 35% 37% !! 23-46% 13-47% 33% 36%
Mathematics and Science (continued)
Adult Literacy and Lifelong Learning
Addressreasoning & analytical
ability
AddressAlgebra and functions
Work insmall groups
or with apartner
0% 20% 40% 60% 80% 100%
54%
51%
62%
1
2
2
MathematicsInstructionPercentage ofpublic school 8thgraders whosemathematicsteachers do thefollowing, 1996(Indicator 17)
1 At least once a week.2 On a 4-point scale from “none” to “a lot,” defined as a response to the top point.
54% 46%
3 highest levels2 lowest levels
Adult LiteracyPercentage ofadults who scoredat 3 highest levelsin Prose Literacy(Indicator 20)
KEY
KEY
!! Significant progress
@@ Significant decline
## Change is not significant
Scorecards #2 (MO-VI) 10/30/97 11:57 AM Page 206

207
† Median is the middle score in a set of ranked scores.** Indicators are not the same at the national and state level.— Data not available. See Appendix A.• Baseline years and most recent update years may differ by state
for this indicator. See Appendix C for more information.See pages 72-75 for a Guide to Reading the State Pages.See Appendix C for technical notes and sources.
23. Reduced marijuana use? (1991, 1993) • 16% 19% ## ** ** 4-18% 7-21% 10% 14%24. Reduced alcohol use (more than 5 drinks in a row)? (1991, 1993) • 36% 32% ## ** ** 17-43% 9-44% 30% 28%25. Reduced availability of drugs on school property? (1993) • 28% — ** ** 11-31% — 22% —26. Reduced students threatened or injured with a weapon while on school property? (1993) • 8% — ** ** 6-15% — 8% —27. Reduced physical fights on school property? (1993) • 17% — ** ** 13-39% — 16% —28. Reduced students carrying weapons on school property? (1993) • 12% — ** ** 8-18% — 12% —29. Reduced students not feeling safe at school? (1993) • 5% — ** ** 3-23% — 6% —30. Reduced teacher victimization? (1994) 19% — 15% — 8-26% — 14% —31. Reduced student disruptions? (1991, 1994) 42% 55% @@ 37% 46% @@ 23-60% 33-65% 37% 47%
32. Decreased schools with minimal parental involvement• Teacher’s perspective? (1991, 1994) 23% 29% ## ** ** 9-44% 13-50% 23% 27%• Principal’s perspective? (1991, 1994) 9% 14% @@ ** ** 4-22% 3-27% 13% 13%
33. Increased influence of parent associations? (1991, 1994) 18% 34% !! ** ** 8-37% 12-50% 16% 22%
NEW YORK
GOAL 7
GOAL 8
U.S.
baseline update progress?
New York
baseline update progress?
Range of State Scores
baseline update
MedianScores†
baseline update
Safe, Disciplined and Alcohol- and Drug-free Schools
Parental Participation
Usedmarijuana
Had 5 ormore drinks
in a row
Were offered, sold,or given an illegal drug
on school property
1
1
2
0% 20% 40% 60% 80% 100%
1991 1993
19%
16%
36%
32%
28%
ns
ns
Alcohol- andDrug-freeSchoolsPercentage ofpublic high schoolstudents whoreported the fol-lowing(Indicators 23,24, & 25)
1 During the past 30 days.2 During the past 12 months.nsInterpret with caution. Change was not statistically significant.
0% 20% 40% 60% 80% 100%
One ormore areas
Establishingcurriculum
Hiring newfull-timeteachers
Settingdiscipline
policy
1991 1994
18%
34%
4%
8%
7%
16%
26%
1%
ns
Parent-SchoolPartnershipsPercentage of public school principals whoreported that theparent associationhas influence1 onthe following areas(Indicator 33)
1 On a 6-point scale from no influence to a great deal of influence, defined asa response to the top two points.
nsInterpret with caution. Change was not statistically significant.
KEY
KEY
!! Significant progress
@@ Significant decline
## Change is not significant
Scorecards #2 (MO-VI) 10/30/97 11:57 AM Page 207

208
8. Increased reading achievement in Grade 4? (1992, 1994) • 25% 30% ## 29% 30% ## 8-38% 8-41% 26% 27%9. Increased mathematics achievement •
• in Grade 4? (1992, 1996) 13% 21% !! 18% 21% !! 5-27% 3-31% 16% 20%• in Grade 8? (1990, 1996) 9% 20% !! 15% 24% !! 1-27% 5-34% 15% 22%
10. Increased science achievement in Grade 8? (1996) 24% — 29% — 5-41% — 27% —
NORTH CAROLINA
† Median is the middle score in a set of ranked scores.* Comparable national data are not available.— Data not available. See Appendix A.• Baseline years and most recent update years may differ by state
for this indicator. See Appendix C for more information.See pages 72-75 for a Guide to Reading the State Pages.See Appendix C for technical notes and sources.
GOAL 1
GOAL 2
GOAL 3
North Carolina
baseline update progress?
Range of State Scores
baseline update
MedianScores†
baseline update
U.S.
baseline update progress?
1. Reduced percentage of infants born in the state with 1 or more health risks? (1990, 1995) 40% 36% !! 37% 34% !! 25-48% 24-46% 38% 35%2. Increased percentage of 2-year-olds immunized? (1994, 1996) 84% 78% ## 75% 78% !! 61-88% 64-88% 76% 79%3. Reduced number of infants (per 1,000) born with low birthweight? (1990, 1995) 80 87 @@ 70 73 @@ 48-151 53-134 71 754. Increased number of mothers (per 1,000) receiving early prenatal care? (1990, 1995) 757 835 !! 758 813 !! 469-868 560-900 778 8285. Increased number of children with disabilities in preschool (per 1,000)? (1991, 1996) 39 52 !! * * 16-68 16-92 38 47
6. Increased high school completion rate? (1990, 1995) 83% 87% !! 86% 86% ## 77-96% 79-96% 87% 88%7. Reduced high school dropout rate? (1992, 1994) • — — * * 3-12% 3-10% 5% 5%
Ready to Learn
School Completion
Student Achievement and Citizenship
19951990
87%
100%
80%
60%
40%
20%
0%
83%
High School CompletionPercentage of all18- to 24-year-olds1
who have a highschool credential2(Indicator 6)
1 Does not include those still in high school.2 Includes traditional high school diploma and alternative credential.
0%
20%
40%
60%
80%
100%
19951990
36%40%
Children’sHealth IndexPercentage ofinfants born with 1or more healthrisks1 (Indicator 1)
1 Includes late (in third trimester) or no prenatal care, low maternal weightgain (less than 21 pounds), mother smoked during pregnancy, or motherdrank alcohol during pregnancy.
KEY
KEY
!! Significant progress
@@ Significant decline
## Change is not significant
Scorecards #2 (MO-VI) 10/30/97 11:57 AM Page 208

209
† Median is the middle score in a set of ranked scores.° See Table 8 for the numbers for each subject area.— Data not available. See Appendix A.∞ This information had not been released when the 1997 Goals Report
went to print.See pages 72-75 for a Guide to Reading the State Pages.See Appendix C for technical notes and sources.
11. Increased the number of Advanced Placement examinations receiving a grade of 3 or higher (per 1,000)? (1991, 1997)° 48 99 !! 55 85 !! 9-177 18-223 41 65
12. Increased the percentage of public secondary school teachers who hold • a degree in main teaching assignment? (1991, 1994) 68% 66% ## 66% 63% @@ 51-85% 50-81% 69% 64%• a teaching certificate in main teaching assignment? (1991, 1994) 99% 97% ## 94% 93% @@ 91-100% 89-100% 98% 97%
13. Increased the percentage of public school teachers participating in professional development on 1 or more selected topics? (1994) 93% — 85% — 76-98% — 86% —
14. Increased the percentage of public school teachers with training to teach limited English-proficient students? (1994) 8% — 16% — 4-81% — 16% —
15. Increased the percentage of beginning public school teachers participating in a formal teacher induction program? (1991, 1994) 24% 36% !! 22% 27% !! 6-42% 7-48% 20% 23%
16. International comparisons in mathematics and science will be reported in future Goals Panel reports.∞ — — — — — — — —
NORTH CAROLINA
GOAL 3
GOAL 4
GOAL 5
U.S.
baseline update progress?
North Carolina
baseline update progress?
Range of State Scores
baseline update
MedianScores†
baseline update
Student Achievement and Citizenship (continued)
Teacher Education and Professional Development
Mathematics and Science
ReadingGrade 4
MathematicsGrade 4
1996199219941992
100%
80%
60%
40%
20%
0%
30%25%
13%
21%
ns
Student AchievementPercentage of public school students who metthe Goals Panel’sperformancestandard1 in reading and mathematics (Indicators 8 & 9)
1 A complete description of the performance standard can be found inAppendix C.
nsInterpret with caution. Change was not statistically significant.0 2
0
40
60
80
10
0
0% 20% 40% 60% 80% 100%
Uses ofeducationaltechnology
One ormore topics
Methods ofteaching
subject fieldIn-depthstudy in
subject field
Studentassessment
93%
57%
72%
32%
59%
Professional DevelopmentPercentage ofpublic schoolteachers partici-pating in profes-sional develop-ment on thefollowing topics,1994(Indicator 13)KEY
KEY
!! Significant progress
@@ Significant decline
## Change is not significant
Scorecards #2 (MO-VI) 10/30/97 11:57 AM Page 209

210
20. Increased adult literacy? (1992) — — 52% — 46-77% — 53% —21. Increased the percentage of U.S. citizens
• registered to vote? (1988, 1992) 65% 70% !! 70% 73% !! 58-95% 63-92% 71% 75%• voting? (1988, 1992) 54% 61% !! 61% 66% !! 50-74% 55-77% 62% 68%
22. Increased postsecondary enrollment? (1992, 1994) 49% 51% ❊ ** ** 33-68% 37-71% 53% 55%
NORTH CAROLINA
† Median is the middle score in a set of ranked scores.— Data not available. See Appendix A.** Indicators are not the same at the national and state level.❊ Sample size does not permit a reliable estimate of change.See pages 72-75 for a Guide to Reading the State Pages.See Appendix C for technical notes and sources.
GOAL 5
GOAL 6
North Carolina
baseline update progress?
Range of State Scores
baseline update
MedianScores†
baseline update
U.S.
baseline update progress?
17. Increased the percentage of public school 8th graders whose mathematics teachers • have students work in small groups? (1996) 74% — 66% — 45-92% — 67% —• address Algebra and functions? (1996) 61% — 57% — 45-82% — 58% —• address reasoning and analytical ability? (1996) 50% — 52% — 39-64% — 48% —
18. Increased the percentage of public school 8th graders who have computers available in their mathematics classroom? (1996) 28% — 30% — 7-54% — 30% —
19. Increased mathematics and science degrees awarded to • all students? (1991, 1995) 41% 46% !! 39% 42% !! 25-49% 15-53% 39% 42%• minority (Black, Hispanic, American Indian/Alaskan Native) students? (1991, 1995) 38% 45% !! 39% 40% !! 22-64% 22-57% 39% 39%• female students? (1991, 1995) 36% 42% !! 35% 37% !! 23-46% 13-47% 33% 36%
Mathematics and Science (continued)
Adult Literacy and Lifelong Learning
Addressreasoning & analytical
ability
AddressAlgebra and functions
Work insmall groups
or with apartner
0% 20% 40% 60% 80% 100%
74%
50%
61%
1
2
2
MathematicsInstructionPercentage ofpublic school 8thgraders whosemathematicsteachers do thefollowing, 1996(Indicator 17)
1 At least once a week.2 On a 4-point scale from “none” to “a lot,” defined as a response to the top point.
KEY
KEY
!! Significant progress
@@ Significant decline
## Change is not significant
Scorecards #2 (MO-VI) 10/30/97 11:57 AM Page 210

211
† Median is the middle score in a set of ranked scores.** Indicators are not the same at the national and state level.— Data not available. See Appendix A.• Baseline years and most recent update years may differ by state
for this indicator. See Appendix C for more information.See pages 72-75 for a Guide to Reading the State Pages.See Appendix C for technical notes and sources.
23. Reduced marijuana use? (1993, 1995) • 15% 22% @@ ** ** 7-21% 7-32% 14% 23%24. Reduced alcohol use (more than 5 drinks in a row)? (1993, 1995) • 23% 23% ## ** ** 9-44% 13-43% 28% 31%25. Reduced availability of drugs on school property? (1993, 1995) • 29% 30% ## ** ** 11-31% 20-46% 22% 30%26. Reduced students threatened or injured with a weapon while on school property? (1993, 1995) • 10% 8% ## ** ** 6-15% 4-11% 8% 8%27. Reduced physical fights on school property? (1993, 1995) • 15% 12% ## ** ** 13-39% 12-19% 16% 15%28. Reduced students carrying weapons on school property? (1993, 1995) • 14% 9% !! ** ** 8-18% 7-14% 12% 11%29. Reduced students not feeling safe at school? (1993, 1995) • 5% 5% ## ** ** 3-23% 3-16% 6% 5%30. Reduced teacher victimization? (1994) 19% — 15% — 8-26% — 14% —31. Reduced student disruptions? (1991, 1994) 42% 53% @@ 37% 46% @@ 23-60% 33-65% 37% 47%
32. Decreased schools with minimal parental involvement• Teacher’s perspective? (1991, 1994) 29% 30% ## ** ** 9-44% 13-50% 23% 27%• Principal’s perspective? (1991, 1994) 10% 10% ## ** ** 4-22% 3-27% 13% 13%
33. Increased influence of parent associations? (1991, 1994) 21% 20% ## ** ** 8-37% 12-50% 16% 22%
NORTH CAROLINA
GOAL 7
GOAL 8
U.S.
baseline update progress?
North Carolina
baseline update progress?
Range of State Scores
baseline update
MedianScores†
baseline update
Safe, Disciplined and Alcohol- and Drug-free Schools
Parental Participation
Usedmarijuana
Had 5 ormore drinks
in a row
Were offered, sold,or given an illegal drug
on school property
1
1
2
0% 20% 40% 60% 80% 100%
1993 1995
22%
15%
23%
23%
29%
30% ns
Alcohol- andDrug-freeSchoolsPercentage ofpublic high schoolstudents whoreported the fol-lowing(Indicators 23,24, & 25)
1 During the past 30 days.2 During the past 12 months.nsInterpret with caution. Change was not statistically significant.
0% 20% 40% 60% 80% 100%
Establishingcurriculum
One ormore areas
Hiring newfull-timeteachers
Settingdiscipline
policy
1991 1994
20%
21%
9%
8%
2%
3%
16%
17%ns
ns
ns
ns
Parent-SchoolPartnershipsPercentage of public school principals whoreported that theparent associationhas influence1 onthe following areas(Indicator 33)
1 On a 6-point scale from no influence to a great deal of influence, defined asa response to the top two points.
nsInterpret with caution. Change was not statistically significant.
KEY
KEY
!! Significant progress
@@ Significant decline
## Change is not significant
Scorecards #2 (MO-VI) 10/30/97 11:57 AM Page 211

212
8. Increased reading achievement in Grade 4? (1992, 1994) • 35% 38% ## 29% 30% ## 8-38% 8-41% 26% 27%9. Increased mathematics achievement •
• in Grade 4? (1992, 1996) 22% 24% ## 18% 21% !! 5-27% 3-31% 16% 20%• in Grade 8? (1990, 1996) 27% 33% !! 15% 24% !! 1-27% 5-34% 15% 22%
10. Increased science achievement in Grade 8? (1996) 41% — 29% — 5-41% — 27% —
NORTH DAKOTA
† Median is the middle score in a set of ranked scores.* Comparable national data are not available.— Data not available. See Appendix A.• Baseline years and most recent update years may differ by state
for this indicator. See Appendix C for more information.See pages 72-75 for a Guide to Reading the State Pages.See Appendix C for technical notes and sources.
GOAL 1
GOAL 2
GOAL 3
North Dakota
baseline update progress?
Range of State Scores
baseline update
MedianScores†
baseline update
U.S.
baseline update progress?
1. Reduced percentage of infants born in the state with 1 or more health risks? (1990, 1995) 36% 34% !! 37% 34% !! 25-48% 24-46% 38% 35%2. Increased percentage of 2-year-olds immunized? (1994, 1996) 81% 83% ## 75% 78% !! 61-88% 64-88% 76% 79%3. Reduced number of infants (per 1,000) born with low birthweight? (1990, 1995) 55 53 !! 70 73 @@ 48-151 53-134 71 754. Increased number of mothers (per 1,000) receiving early prenatal care? (1990, 1995) 821 839 !! 758 813 !! 469-868 560-900 778 8285. Increased number of children with disabilities in preschool (per 1,000)? (1991, 1996) 39 45 !! * * 16-68 16-92 38 47
6. Increased high school completion rate? (1990, 1995) 96% 93% ## 86% 86% ## 77-96% 79-96% 87% 88%7. Reduced high school dropout rate? (1993, 1994) • 2% 3% @@ * * 2-10% 3-10% 5% 5%
Ready to Learn
School Completion
Student Achievement and Citizenship
19951990
93%100%
80%
60%
40%
20%
0%
96% ns
High School CompletionPercentage of all18- to 24-year-olds1
who have a highschool credential2(Indicator 6)
1 Does not include those still in high school.2 Includes traditional high school diploma and alternative credential.nsInterpret with caution. Change was not statistically significant.
0%
20%
40%
60%
80%
100%
19951990
34%36%
Children’sHealth IndexPercentage ofinfants born with 1or more healthrisks1 (Indicator 1)
1 Includes late (in third trimester) or no prenatal care, low maternal weightgain (less than 21 pounds), mother smoked during pregnancy, or motherdrank alcohol during pregnancy.
KEY
KEY
!! Significant progress
@@ Significant decline
## Change is not significant
Scorecards #2 (MO-VI) 10/30/97 11:57 AM Page 212

213
† Median is the middle score in a set of ranked scores.° See Table 8 for the numbers for each subject area.— Data not available. See Appendix A.∞ This information had not been released when the 1997 Goals Report
went to print.See pages 72-75 for a Guide to Reading the State Pages.See Appendix C for technical notes and sources.
11. Increased the number of Advanced Placement examinations receiving a grade of 3 or higher (per 1,000)? (1991, 1997)° 14 18 !! 55 85 !! 9-177 18-223 41 65
12. Increased the percentage of public secondary school teachers who hold • a degree in main teaching assignment? (1991, 1994) 73% 76% ## 66% 63% @@ 51-85% 50-81% 69% 64%• a teaching certificate in main teaching assignment? (1991, 1994) 99% 100% ## 94% 93% @@ 91-100% 89-100% 98% 97%
13. Increased the percentage of public school teachers participating in professional development on 1 or more selected topics? (1994) 84% — 85% — 76-98% — 86% —
14. Increased the percentage of public school teachers with training to teach limited English-proficient students? (1994) 13% — 16% — 4-81% — 16% —
15. Increased the percentage of beginning public school teachers participating in a formal teacher induction program? (1991, 1994) 6% 8% ## 22% 27% !! 6-42% 7-48% 20% 23%
16. International comparisons in mathematics and science will be reported in future Goals Panel reports.∞ — — — — — — — —
NORTH DAKOTA
GOAL 3
GOAL 4
GOAL 5
U.S.
baseline update progress?
North Dakota
baseline update progress?
Range of State Scores
baseline update
MedianScores†
baseline update
Student Achievement and Citizenship (continued)
Teacher Education and Professional Development
Mathematics and Science
ReadingGrade 4
MathematicsGrade 4
1996199219941992
100%
80%
60%
40%
20%
0%
38%35%
22%24%
ns
ns
Student AchievementPercentage of public school students who metthe Goals Panel’sperformancestandard1 in reading and mathematics (Indicators 8 & 9)
1 A complete description of the performance standard can be found inAppendix C.
nsInterpret with caution. Change was not statistically significant.0 2
0
40
60
80
10
0
0% 20% 40% 60% 80% 100%
Uses ofeducationaltechnology
One ormore topics
Methods ofteaching
subject fieldIn-depthstudy in
subject field
Studentassessment
84%
53%
58%
28%
36%
Professional DevelopmentPercentage ofpublic schoolteachers partici-pating in profes-sional develop-ment on thefollowing topics,1994(Indicator 13)KEY
KEY
!! Significant progress
@@ Significant decline
## Change is not significant
Scorecards #2 (MO-VI) 10/30/97 11:58 AM Page 213

214
20. Increased adult literacy? (1992) — — 52% — 46-77% — 53% —21. Increased the percentage of U.S. citizens
• registered to vote? (1988, 1992) 95% 92% ## 70% 73% !! 58-95% 63-92% 71% 75%• voting? (1988, 1992) 74% 72% ## 61% 66% !! 50-74% 55-77% 62% 68%
22. Increased postsecondary enrollment? (1992, 1994) 68% 68% ❊ ** ** 33-68% 37-71% 53% 55%
NORTH DAKOTA
† Median is the middle score in a set of ranked scores.— Data not available. See Appendix A.** Indicators are not the same at the national and state level.❊ Sample size does not permit a reliable estimate of change.See pages 72-75 for a Guide to Reading the State Pages.See Appendix C for technical notes and sources.
GOAL 5
GOAL 6
North Dakota
baseline update progress?
Range of State Scores
baseline update
MedianScores†
baseline update
U.S.
baseline update progress?
17. Increased the percentage of public school 8th graders whose mathematics teachers • have students work in small groups? (1996) 45% — 66% — 45-92% — 67% —• address Algebra and functions? (1996) 54% — 57% — 45-82% — 58% —• address reasoning and analytical ability? (1996) 46% — 52% — 39-64% — 48% —
18. Increased the percentage of public school 8th graders who have computers available in their mathematics classroom? (1996) 29% — 30% — 7-54% — 30% —
19. Increased mathematics and science degrees awarded to • all students? (1991, 1995) 39% 43% !! 39% 42% !! 25-49% 15-53% 39% 42%• minority (Black, Hispanic, American Indian/Alaskan Native) students? (1991, 1995) 40% 47% !! 39% 40% !! 22-64% 22-57% 39% 39%• female students? (1991, 1995) 35% 39% !! 35% 37% !! 23-46% 13-47% 33% 36%
Mathematics and Science (continued)
Adult Literacy and Lifelong Learning
Addressreasoning & analytical
ability
AddressAlgebra and functions
Work insmall groups
or with apartner
0% 20% 40% 60% 80% 100%
45%
46%
54%
1
2
2
MathematicsInstructionPercentage ofpublic school 8thgraders whosemathematicsteachers do thefollowing, 1996(Indicator 17)
1 At least once a week.2 On a 4-point scale from “none” to “a lot,” defined as a response to the top point.
KEY
KEY
!! Significant progress
@@ Significant decline
## Change is not significant
Scorecards #2 (MO-VI) 10/30/97 11:58 AM Page 214

215
† Median is the middle score in a set of ranked scores.** Indicators are not the same at the national and state level.— Data not available. See Appendix A.• Baseline years and most recent update years may differ by state
for this indicator. See Appendix C for more information.See pages 72-75 for a Guide to Reading the State Pages.See Appendix C for technical notes and sources.
23. Reduced marijuana use? (1995) • 15% — ** ** 7-32% — 23% —24. Reduced alcohol use (more than 5 drinks in a row)? (1991, 1995) • — — ** ** 17-43% 13-43% 30% 31%25. Reduced availability of drugs on school property? (1995) • 28% — ** ** 20-46% — 30% —26. Reduced students threatened or injured with a weapon while on school property? (1995) • 6% — ** ** 4-11% — 8% —27. Reduced physical fights on school property? (1995) • 12% — ** ** 12-19% — 15% —28. Reduced students carrying weapons on school property? (1995) • 10% — ** ** 7-14% — 11% —29. Reduced students not feeling safe at school? (1993, 1995) • — — ** ** 3-23% 3-16% 6% 5%30. Reduced teacher victimization? (1994) 8% — 15% — 8-26% — 14% —31. Reduced student disruptions? (1991, 1994) 30% 33% ## 37% 46% @@ 23-60% 33-65% 37% 47%
32. Decreased schools with minimal parental involvement• Teacher’s perspective? (1991, 1994) 9% 13% @@ ** ** 9-44% 13-50% 23% 27%• Principal’s perspective? (1991, 1994) 4% 3% ## ** ** 4-22% 3-27% 13% 13%
33. Increased influence of parent associations? (1991, 1994) 16% 17% ## ** ** 8-37% 12-50% 16% 22%
NORTH DAKOTA
GOAL 7
GOAL 8
U.S.
baseline update progress?
North Dakota
baseline update progress?
Range of State Scores
baseline update
MedianScores†
baseline update
Safe, Disciplined and Alcohol- and Drug-free Schools
Parental Participation
Usedmarijuana
Were offered, sold,or given an illegal drug
on school property
1
2
0% 20% 40% 60% 80% 100%
1995
15%
28%
Alcohol- andDrug-freeSchoolsPercentage ofpublic high schoolstudents whoreported the fol-lowing(Indicators 23,24, & 25)
1 During the past 30 days.2 During the past 12 months.
0% 20% 40% 60% 80% 100%
Establishingcurriculum
One ormore areas
Settingdiscipline
policy
1991 1994
16%
17%
8%
9%
11%
11%
ns
ns
Parent-SchoolPartnershipsPercentage of public school principals whoreported that theparent associationhas influence1 onthe following areas(Indicator 33)
1 On a 6-point scale from no influence to a great deal of influence, defined asa response to the top two points.
nsInterpret with caution. Change was not statistically significant.
KEY
KEY
!! Significant progress
@@ Significant decline
## Change is not significant
Scorecards #2 (MO-VI) 10/30/97 11:58 AM Page 215

216
8. Increased reading achievement in Grade 4? (1992) • 27% — 29% — 8-38% — 26% —9. Increased mathematics achievement •
• in Grade 4? (1992) 16% — 18% — 5-27% — 16% —• in Grade 8? (1990, 1992) 15% 18% ## 15% 21% !! 1-27% 1-31% 15% 18%
10. Increased science achievement in Grade 8? (1996) — — 29% — 5-41% — 27% —
OHIO
† Median is the middle score in a set of ranked scores.* Comparable national data are not available.— Data not available. See Appendix A.• Baseline years and most recent update years may differ by state
for this indicator. See Appendix C for more information.See pages 72-75 for a Guide to Reading the State Pages.See Appendix C for technical notes and sources.
GOAL 1
GOAL 2
GOAL 3
Ohio
baseline update progress?
Range of State Scores
baseline update
MedianScores†
baseline update
U.S.
baseline update progress?
1. Reduced percentage of infants born in the state with 1 or more health risks? (1990, 1995) 41% 37% !! 37% 34% !! 25-48% 24-46% 38% 35%2. Increased percentage of 2-year-olds immunized? (1994, 1996) 73% 79% !! 75% 78% !! 61-88% 64-88% 76% 79%3. Reduced number of infants (per 1,000) born with low birthweight? (1990, 1995) 71 76 @@ 70 73 @@ 48-151 53-134 71 754. Increased number of mothers (per 1,000) receiving early prenatal care? (1990, 1995) 815 847 !! 758 813 !! 469-868 560-900 778 8285. Increased number of children with disabilities in preschool (per 1,000)? (1991, 1996) 26 38 !! * * 16-68 16-92 38 47
6. Increased high school completion rate? (1990, 1995) 89% 88% ## 86% 86% ## 77-96% 79-96% 87% 88%7. Reduced high school dropout rate? (1992, 1994) • — — * * 3-12% 3-10% 5% 5%
Ready to Learn
School Completion
Student Achievement and Citizenship
19951990
88%100%
80%
60%
40%
20%
0%
89% ns
High School CompletionPercentage of all18- to 24-year-olds1
who have a highschool credential2(Indicator 6)
1 Does not include those still in high school.2 Includes traditional high school diploma and alternative credential.nsInterpret with caution. Change was not statistically significant.
0%
20%
40%
60%
80%
100%
19951990
37%41%
Children’sHealth IndexPercentage ofinfants born with 1or more healthrisks1 (Indicator 1)
1 Includes late (in third trimester) or no prenatal care, low maternal weightgain (less than 21 pounds), mother smoked during pregnancy, or motherdrank alcohol during pregnancy.
KEY
KEY
!! Significant progress
@@ Significant decline
## Change is not significant
Scorecards #2 (MO-VI) 10/30/97 11:58 AM Page 216

217
† Median is the middle score in a set of ranked scores.° See Table 8 for the numbers for each subject area.— Data not available. See Appendix A.∞ This information had not been released when the 1997 Goals Report
went to print.See pages 72-75 for a Guide to Reading the State Pages.See Appendix C for technical notes and sources.
11. Increased the number of Advanced Placement examinations receiving a grade of 3 or higher (per 1,000)? (1991, 1997)° 36 60 !! 55 85 !! 9-177 18-223 41 65
12. Increased the percentage of public secondary school teachers who hold • a degree in main teaching assignment? (1991, 1994) 68% 61% ## 66% 63% @@ 51-85% 50-81% 69% 64%• a teaching certificate in main teaching assignment? (1991, 1994) 99% 97% ## 94% 93% @@ 91-100% 89-100% 98% 97%
13. Increased the percentage of public school teachers participating in professional development on 1 or more selected topics? (1994) 83% — 85% — 76-98% — 86% —
14. Increased the percentage of public school teachers with training to teach limited English-proficient students? (1994) 4% — 16% — 4-81% — 16% —
15. Increased the percentage of beginning public school teachers participating in a formal teacher induction program? (1991, 1994) 20% 25% ## 22% 27% !! 6-42% 7-48% 20% 23%
16. International comparisons in mathematics and science will be reported in future Goals Panel reports.∞ — — — — — — — —
OHIO
GOAL 3
GOAL 4
GOAL 5
U.S.
baseline update progress?
Ohio
baseline update progress?
Range of State Scores
baseline update
MedianScores†
baseline update
Student Achievement and Citizenship (continued)
Teacher Education and Professional Development
Mathematics and Science
ReadingGrade 4
MathematicsGrade 4
19921992
27%
100%
80%
60%
40%
20%
0%
16%
Student AchievementPercentage of public school students who metthe Goals Panel’sperformancestandard1 in reading and mathematics (Indicators 8 & 9)
1 A complete description of the performance standard can be found inAppendix C. 0 2
0
40
60
80
10
0
0% 20% 40% 60% 80% 100%
Uses ofeducationaltechnology
One ormore topics
Methods ofteaching
subject fieldIn-depthstudy in
subject field
Studentassessment
83%
41%
62%
29%
46%
Professional DevelopmentPercentage ofpublic schoolteachers partici-pating in profes-sional develop-ment on thefollowing topics,1994(Indicator 13)KEY
KEY
!! Significant progress
@@ Significant decline
## Change is not significant
Scorecards #2 (MO-VI) 10/30/97 11:58 AM Page 217

218
20. Increased adult literacy? (1992) 55% — 52% — 46-77% — 53% —21. Increased the percentage of U.S. citizens
• registered to vote? (1988, 1992) 70% 71% ## 70% 73% !! 58-95% 63-92% 71% 75%• voting? (1988, 1992) 63% 65% ## 61% 66% !! 50-74% 55-77% 62% 68%
22. Increased postsecondary enrollment? (1992, 1994) 51% 51%1 !! ** ** 33-68% 37-71% 53% 55%
OHIO
† Median is the middle score in a set of ranked scores.— Data not available. See Appendix A.** Indicators are not the same at the national and state level.1 The nonrounded values for indicator 22 in 1992 and 1994 were 51.0
and 51.4, respectively.See pages 72-75 for a Guide to Reading the State Pages.See Appendix C for technical notes and sources.
GOAL 5
GOAL 6
Ohio
baseline update progress?
Range of State Scores
baseline update
MedianScores†
baseline update
U.S.
baseline update progress?
17. Increased the percentage of public school 8th graders whose mathematics teachers • have students work in small groups? (1996) — — 66% — 45-92% — 67% —• address Algebra and functions? (1996) — — 57% — 45-82% — 58% —• address reasoning and analytical ability? (1996) — — 52% — 39-64% — 48% —
18. Increased the percentage of public school 8th graders who have computers available in their mathematics classroom? (1996) — — 30% — 7-54% — 30% —
19. Increased mathematics and science degrees awarded to • all students? (1991, 1995) 36% 39% !! 39% 42% !! 25-49% 15-53% 39% 42%• minority (Black, Hispanic, American Indian/Alaskan Native) students? (1991, 1995) 36% 37% !! 39% 40% !! 22-64% 22-57% 39% 39%• female students? (1991, 1995) 31% 34% !! 35% 37% !! 23-46% 13-47% 33% 36%
Mathematics and Science (continued)
Adult Literacy and Lifelong Learning
55%45%
3 highest levels2 lowest levels
Adult LiteracyPercentage ofadults who scoredat 3 highest levelsin Prose Literacy(Indicator 20)
KEY
KEY
!! Significant progress
@@ Significant decline
## Change is not significant
Scorecards #2 (MO-VI) 10/30/97 11:58 AM Page 218

219
† Median is the middle score in a set of ranked scores.** Indicators are not the same at the national and state level.— Data not available. See Appendix A.• Baseline years and most recent update years may differ by state
for this indicator. See Appendix C for more information.See pages 72-75 for a Guide to Reading the State Pages.See Appendix C for technical notes and sources.
23. Reduced marijuana use? (1993) • 16% — ** ** 7-21% — 14% —24. Reduced alcohol use (more than 5 drinks in a row)? (1993) • 30% — ** ** 9-44% — 28% —25. Reduced availability of drugs on school property? (1993) • 20% — ** ** 11-31% — 22% —26. Reduced students threatened or injured with a weapon while on school property? (1993) • 8% — ** ** 6-15% — 8% —27. Reduced physical fights on school property? (1993) • 16% — ** ** 13-39% — 16% —28. Reduced students carrying weapons on school property? (1993) • 9% — ** ** 8-18% — 12% —29. Reduced students not feeling safe at school? (1993) • 5% — ** ** 3-23% — 6% —30. Reduced teacher victimization? (1994) 17% — 15% — 8-26% — 14% —31. Reduced student disruptions? (1991, 1994) 38% 42% ## 37% 46% @@ 23-60% 33-65% 37% 47%
32. Decreased schools with minimal parental involvement• Teacher’s perspective? (1991, 1994) 29% 29% ## ** ** 9-44% 13-50% 23% 27%• Principal’s perspective? (1991, 1994) 14% 13% ## ** ** 4-22% 3-27% 13% 13%
33. Increased influence of parent associations? (1991, 1994) 14% 16% ## ** ** 8-37% 12-50% 16% 22%
OHIO
GOAL 7
GOAL 8
U.S.
baseline update progress?
Ohio
baseline update progress?
Range of State Scores
baseline update
MedianScores†
baseline update
Safe, Disciplined and Alcohol- and Drug-free Schools
Parental Participation
Usedmarijuana
Had 5 ormore drinks
in a row
Were offered, sold,or given an illegal drug
on school property
1
1
2
0% 20% 40% 60% 80% 100%
1993
16%
30%
20%
Alcohol- andDrug-freeSchoolsPercentage ofpublic high schoolstudents whoreported the fol-lowing(Indicators 23,24, & 25)
1 During the past 30 days.2 During the past 12 months.
0% 20% 40% 60% 80% 100%
Establishingcurriculum
One ormore areas
Hiring newfull-timeteachers
Settingdiscipline
policy
1991 1994
14%
16%
7%
6%
4%
4%
9%
9%
ns
ns
Parent-SchoolPartnershipsPercentage of public school principals whoreported that theparent associationhas influence1 onthe following areas(Indicator 33)
1 On a 6-point scale from no influence to a great deal of influence, defined asa response to the top two points.
nsInterpret with caution. Change was not statistically significant.
KEY
KEY
!! Significant progress
@@ Significant decline
## Change is not significant
Scorecards #2 (MO-VI) 10/30/97 11:58 AM Page 219

220
8. Increased reading achievement in Grade 4? (1992) • 29% — 29% — 8-38% — 26% —9. Increased mathematics achievement •
• in Grade 4? (1992) 14% — 18% — 5-27% — 16% —• in Grade 8? (1990, 1992) 13% 17% ## 15% 21% !! 1-27% 1-31% 15% 18%
10. Increased science achievement in Grade 8? (1996) — — 29% — 5-41% — 27% —
OKLAHOMA
† Median is the middle score in a set of ranked scores.* Comparable national data are not available.— Data not available. See Appendix A.• Baseline years and most recent update years may differ by state
for this indicator. See Appendix C for more information.See pages 72-75 for a Guide to Reading the State Pages.See Appendix C for technical notes and sources.
GOAL 1
GOAL 2
GOAL 3
Oklahoma
baseline update progress?
Range of State Scores
baseline update
MedianScores†
baseline update
U.S.
baseline update progress?
1. Reduced percentage of infants born in the state with 1 or more health risks? (1992, 1995) 36% 36% ## 35% 34% !! 24-48% 24-46% 37% 35%2. Increased percentage of 2-year-olds immunized? (1994, 1996) 76% 75% ## 75% 78% !! 61-88% 64-88% 76% 79%3. Reduced number of infants (per 1,000) born with low birthweight? (1990, 1995) 66 70 @@ 70 73 @@ 48-151 53-134 71 754. Increased number of mothers (per 1,000) receiving early prenatal care? (1990, 1995) 712 782 !! 758 813 !! 469-868 560-900 778 8285. Increased number of children with disabilities in preschool (per 1,000)? (1991, 1996) 37 37 ## * * 16-68 16-92 38 47
6. Increased high school completion rate? (1990, 1995) 87% 87% ## 86% 86% ## 77-96% 79-96% 87% 88%7. Reduced high school dropout rate? (1992, 1994) • — — * * 3-12% 3-10% 5% 5%
Ready to Learn
School Completion
Student Achievement and Citizenship
19951990
100%
80%
60%
40%
20%
0%
87% 87%
High School CompletionPercentage of all18- to 24-year-olds1
who have a highschool credential2(Indicator 6)
1 Does not include those still in high school.2 Includes traditional high school diploma and alternative credential.
0%
20%
40%
60%
80%
100%
19951992
36%36%
Children’sHealth IndexPercentage ofinfants born with 1or more healthrisks1 (Indicator 1)
1 Includes late (in third trimester) or no prenatal care, low maternal weightgain (less than 21 pounds), mother smoked during pregnancy, or motherdrank alcohol during pregnancy.
KEY
KEY
!! Significant progress
@@ Significant decline
## Change is not significant
Scorecards #2 (MO-VI) 10/30/97 11:58 AM Page 220

221
† Median is the middle score in a set of ranked scores.° See Table 8 for the numbers for each subject area.— Data not available. See Appendix A.∞ This information had not been released when the 1997 Goals Report
went to print.See pages 72-75 for a Guide to Reading the State Pages.See Appendix C for technical notes and sources.
11. Increased the number of Advanced Placement examinations receiving a grade of 3 or higher (per 1,000)? (1991, 1997)° 21 34 !! 55 85 !! 9-177 18-223 41 65
12. Increased the percentage of public secondary school teachers who hold • a degree in main teaching assignment? (1991, 1994) 65% 61% ## 66% 63% @@ 51-85% 50-81% 69% 64%• a teaching certificate in main teaching assignment? (1991, 1994) 98% 99% !! 94% 93% @@ 91-100% 89-100% 98% 97%
13. Increased the percentage of public school teachers participating in professional development on 1 or more selected topics? (1994) 88% — 85% — 76-98% — 86% —
14. Increased the percentage of public school teachers with training to teach limited English-proficient students? (1994) 19% — 16% — 4-81% — 16% —
15. Increased the percentage of beginning public school teachers participating in a formal teacher induction program? (1991, 1994) 42% 45% ## 22% 27% !! 6-42% 7-48% 20% 23%
16. International comparisons in mathematics and science will be reported in future Goals Panel reports.∞ — — — — — — — —
OKLAHOMA
GOAL 3
GOAL 4
GOAL 5
U.S.
baseline update progress?
Oklahoma
baseline update progress?
Range of State Scores
baseline update
MedianScores†
baseline update
Student Achievement and Citizenship (continued)
Teacher Education and Professional Development
Mathematics and Science
ReadingGrade 4
MathematicsGrade 4
19921992
29%
100%
80%
60%
40%
20%
0%
14%
Student AchievementPercentage of public school students who metthe Goals Panel’sperformancestandard1 in reading and mathematics (Indicators 8 & 9)
1 A complete description of the performance standard can be found inAppendix C.
nsInterpret with caution. Change was not statistically significant. 0 20
40
60
80
10
0
0% 20% 40% 60% 80% 100%
Uses ofeducationaltechnology
One ormore topics
Methods ofteaching
subject fieldIn-depthstudy in
subject field
Studentassessment
88%
46%
65%
27%
54%
Professional DevelopmentPercentage ofpublic schoolteachers partici-pating in profes-sional develop-ment on thefollowing topics,1994(Indicator 13)KEY
KEY
!! Significant progress
@@ Significant decline
## Change is not significant
Scorecards #2 (MO-VI) 10/30/97 11:58 AM Page 221
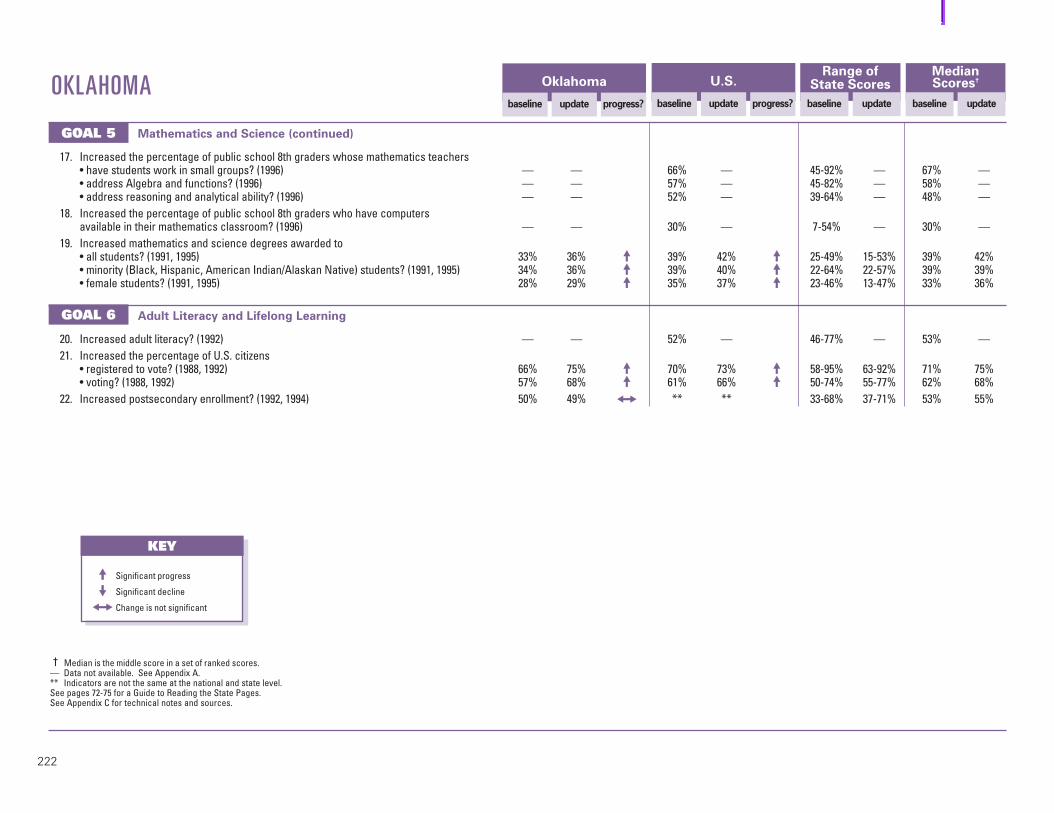
222
20. Increased adult literacy? (1992) — — 52% — 46-77% — 53% —21. Increased the percentage of U.S. citizens
• registered to vote? (1988, 1992) 66% 75% !! 70% 73% !! 58-95% 63-92% 71% 75%• voting? (1988, 1992) 57% 68% !! 61% 66% !! 50-74% 55-77% 62% 68%
22. Increased postsecondary enrollment? (1992, 1994) 50% 49% ## ** ** 33-68% 37-71% 53% 55%
OKLAHOMA
† Median is the middle score in a set of ranked scores.— Data not available. See Appendix A.** Indicators are not the same at the national and state level.See pages 72-75 for a Guide to Reading the State Pages.See Appendix C for technical notes and sources.
GOAL 5
GOAL 6
Oklahoma
baseline update progress?
Range of State Scores
baseline update
MedianScores†
baseline update
U.S.
baseline update progress?
17. Increased the percentage of public school 8th graders whose mathematics teachers • have students work in small groups? (1996) — — 66% — 45-92% — 67% —• address Algebra and functions? (1996) — — 57% — 45-82% — 58% —• address reasoning and analytical ability? (1996) — — 52% — 39-64% — 48% —
18. Increased the percentage of public school 8th graders who have computers available in their mathematics classroom? (1996) — — 30% — 7-54% — 30% —
19. Increased mathematics and science degrees awarded to • all students? (1991, 1995) 33% 36% !! 39% 42% !! 25-49% 15-53% 39% 42%• minority (Black, Hispanic, American Indian/Alaskan Native) students? (1991, 1995) 34% 36% !! 39% 40% !! 22-64% 22-57% 39% 39%• female students? (1991, 1995) 28% 29% !! 35% 37% !! 23-46% 13-47% 33% 36%
Mathematics and Science (continued)
Adult Literacy and Lifelong Learning
KEY
KEY
!! Significant progress
@@ Significant decline
## Change is not significant
Scorecards #2 (MO-VI) 10/30/97 11:58 AM Page 222

223
† Median is the middle score in a set of ranked scores.** Indicators are not the same at the national and state level.— Data not available. See Appendix A.• Baseline years and most recent update years may differ by state
for this indicator. See Appendix C for more information.See pages 72-75 for a Guide to Reading the State Pages.See Appendix C for technical notes and sources.
23. Reduced marijuana use? (1991, 1995) • — — ** ** 4-18% 7-32% 10% 23%24. Reduced alcohol use (more than 5 drinks in a row)? (1991, 1995) • — — ** ** 17-43% 13-43% 30% 31%25. Reduced availability of drugs on school property? (1993, 1995) • — — ** ** 11-31% 20-46% 22% 30%26. Reduced students threatened or injured with a weapon while on school property? (1993, 1995) • — — ** ** 6-15% 4-11% 8% 8%27. Reduced physical fights on school property? (1993, 1995) • — — ** ** 13-39% 12-19% 16% 15%28. Reduced students carrying weapons on school property? (1993, 1995) • — — ** ** 8-18% 7-14% 12% 11%29. Reduced students not feeling safe at school? (1993, 1995) • — — ** ** 3-23% 3-16% 6% 5%30. Reduced teacher victimization? (1994) 13% — 15% — 8-26% — 14% —31. Reduced student disruptions? (1991, 1994) 33% 39% @@ 37% 46% @@ 23-60% 33-65% 37% 47%
32. Decreased schools with minimal parental involvement• Teacher’s perspective? (1991, 1994) 22% 28% @@ ** ** 9-44% 13-50% 23% 27%• Principal’s perspective? (1991, 1994) 15% 13% ## ** ** 4-22% 3-27% 13% 13%
33. Increased influence of parent associations? (1991, 1994) 13% 21% !! ** ** 8-37% 12-50% 16% 22%
OKLAHOMA
GOAL 7
GOAL 8
U.S.
baseline update progress?
Oklahoma
baseline update progress?
Range of State Scores
baseline update
MedianScores†
baseline update
Safe, Disciplined and Alcohol- and Drug-free Schools
Parental Participation
0% 20% 40% 60% 80% 100%
Establishingcurriculum
One ormore areas
Hiring newfull-timeteachers
Settingdiscipline
policy
1991 1994
13%
21%
6%
14%
2%
2%
17%
8%
Parent-SchoolPartnershipsPercentage of public school principals whoreported that theparent associationhas influence1 onthe following areas(Indicator 33)
1 On a 6-point scale from no influence to a great deal of influence, defined asa response to the top two points.
KEY
KEY
!! Significant progress
@@ Significant decline
## Change is not significant
Scorecards #2 (MO-VI) 10/30/97 11:58 AM Page 223

224
8. Increased reading achievement in Grade 4? (1992, 1994) • — — 29% 30% ## 8-38% 8-41% 26% 27%9. Increased mathematics achievement •
• in Grade 4? (1996) 21% — 21% — 3-31% — 20% —• in Grade 8? (1990, 1996) 21% 26% !! 15% 24% !! 1-27% 5-34% 15% 22%
10. Increased science achievement in Grade 8? (1996) 32% — 29% — 5-41% — 27% —
OREGON
† Median is the middle score in a set of ranked scores.* Comparable national data are not available.— Data not available. See Appendix A.• Baseline years and most recent update years may differ by state
for this indicator. See Appendix C for more information.See pages 72-75 for a Guide to Reading the State Pages.See Appendix C for technical notes and sources.
GOAL 1
GOAL 2
GOAL 3
Oregon
baseline update progress?
Range of State Scores
baseline update
MedianScores†
baseline update
U.S.
baseline update progress?
1. Reduced percentage of infants born in the state with 1 or more health risks? (1990, 1995) 39% 37% !! 37% 34% !! 25-48% 24-46% 38% 35%2. Increased percentage of 2-year-olds immunized? (1994, 1996) 71% 72% ## 75% 78% !! 61-88% 64-88% 76% 79%3. Reduced number of infants (per 1,000) born with low birthweight? (1990, 1995) 50 55 @@ 70 73 @@ 48-151 53-134 71 754. Increased number of mothers (per 1,000) receiving early prenatal care? (1990, 1995) 757 788 !! 758 813 !! 469-868 560-900 778 8285. Increased number of children with disabilities in preschool (per 1,000)? (1991, 1996) 23 46 !! * * 16-68 16-92 38 47
6. Increased high school completion rate? (1990, 1995) 89% 81% @@ 86% 86% ## 77-96% 79-96% 87% 88%7. Reduced high school dropout rate? (1992, 1994) • 6% 7% @@ * * 3-12% 3-10% 5% 5%
Ready to Learn
School Completion
Student Achievement and Citizenship
19951990
81%
100%
80%
60%
40%
20%
0%
89%
High School CompletionPercentage of all18- to 24-year-olds1
who have a highschool credential2(Indicator 6)
1 Does not include those still in high school.2 Includes traditional high school diploma and alternative credential.
0%
20%
40%
60%
80%
100%
19951990
37%39%
Children’sHealth IndexPercentage ofinfants born with 1or more healthrisks1 (Indicator 1)
1 Includes late (in third trimester) or no prenatal care, low maternal weightgain (less than 21 pounds), mother smoked during pregnancy, or motherdrank alcohol during pregnancy.
KEY
KEY
!! Significant progress
@@ Significant decline
## Change is not significant
Scorecards #2 (MO-VI) 10/30/97 11:58 AM Page 224
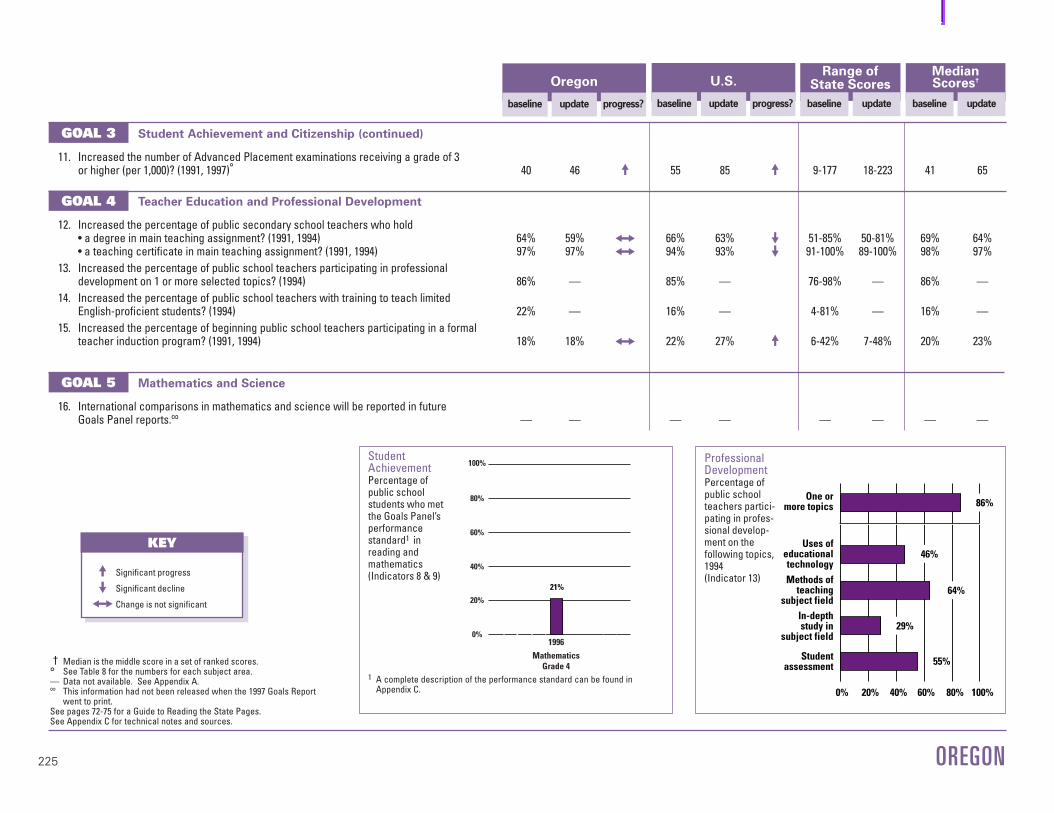
225
† Median is the middle score in a set of ranked scores.° See Table 8 for the numbers for each subject area.— Data not available. See Appendix A.∞ This information had not been released when the 1997 Goals Report
went to print.See pages 72-75 for a Guide to Reading the State Pages.See Appendix C for technical notes and sources.
11. Increased the number of Advanced Placement examinations receiving a grade of 3 or higher (per 1,000)? (1991, 1997)° 40 46 !! 55 85 !! 9-177 18-223 41 65
12. Increased the percentage of public secondary school teachers who hold • a degree in main teaching assignment? (1991, 1994) 64% 59% ## 66% 63% @@ 51-85% 50-81% 69% 64%• a teaching certificate in main teaching assignment? (1991, 1994) 97% 97% ## 94% 93% @@ 91-100% 89-100% 98% 97%
13. Increased the percentage of public school teachers participating in professional development on 1 or more selected topics? (1994) 86% — 85% — 76-98% — 86% —
14. Increased the percentage of public school teachers with training to teach limited English-proficient students? (1994) 22% — 16% — 4-81% — 16% —
15. Increased the percentage of beginning public school teachers participating in a formal teacher induction program? (1991, 1994) 18% 18% ## 22% 27% !! 6-42% 7-48% 20% 23%
16. International comparisons in mathematics and science will be reported in future Goals Panel reports.∞ — — — — — — — —
OREGON
GOAL 3
GOAL 4
GOAL 5
U.S.
baseline update progress?
Oregon
baseline update progress?
Range of State Scores
baseline update
MedianScores†
baseline update
Student Achievement and Citizenship (continued)
Teacher Education and Professional Development
Mathematics and Science
1996
100%
80%
60%
40%
20%
0%
21%
MathematicsGrade 4
Student AchievementPercentage of public school students who metthe Goals Panel’sperformancestandard1 in reading and mathematics (Indicators 8 & 9)
1 A complete description of the performance standard can be found inAppendix C. 0 2
0
40
60
80
10
0
0% 20% 40% 60% 80% 100%
Uses ofeducationaltechnology
One ormore topics
Methods ofteaching
subject fieldIn-depthstudy in
subject field
Studentassessment
86%
46%
64%
29%
55%
Professional DevelopmentPercentage ofpublic schoolteachers partici-pating in profes-sional develop-ment on thefollowing topics,1994(Indicator 13)KEY
KEY
!! Significant progress
@@ Significant decline
## Change is not significant
Scorecards #2 (MO-VI) 10/30/97 11:58 AM Page 225

226
20. Increased adult literacy? (1992) 77% — 52% — 46-77% — 53% —21. Increased the percentage of U.S. citizens
• registered to vote? (1988, 1992) 73% 78% !! 70% 73% !! 58-95% 63-92% 71% 75%• voting? (1988, 1992) 65% 72% !! 61% 66% !! 50-74% 55-77% 62% 68%
22. Increased postsecondary enrollment? (1992, 1994) 54% 57% ❊ ** ** 33-68% 37-71% 53% 55%
OREGON
† Median is the middle score in a set of ranked scores.— Data not available. See Appendix A.** Indicators are not the same at the national and state level.❊ Sample size does not permit a reliable estimate of change.See pages 72-75 for a Guide to Reading the State Pages.See Appendix C for technical notes and sources.
GOAL 5
GOAL 6
Oregon
baseline update progress?
Range of State Scores
baseline update
MedianScores†
baseline update
U.S.
baseline update progress?
17. Increased the percentage of public school 8th graders whose mathematics teachers • have students work in small groups? (1996) 77% — 66% — 45-92% — 67% —• address Algebra and functions? (1996) 48% — 57% — 45-82% — 58% —• address reasoning and analytical ability? (1996) 42% — 52% — 39-64% — 48% —
18. Increased the percentage of public school 8th graders who have computers available in their mathematics classroom? (1996) 35% — 30% — 7-54% — 30% —
19. Increased mathematics and science degrees awarded to • all students? (1991, 1995) 41% 47% !! 39% 42% !! 25-49% 15-53% 39% 42%• minority (Black, Hispanic, American Indian/Alaskan Native) students? (1991, 1995) 41% 48% !! 39% 40% !! 22-64% 22-57% 39% 39%• female students? (1991, 1995) 37% 40% !! 35% 37% !! 23-46% 13-47% 33% 36%
Mathematics and Science (continued)
Adult Literacy and Lifelong Learning
Addressreasoning & analytical
ability
AddressAlgebra and functions
Work insmall groups
or with apartner
0% 20% 40% 60% 80% 100%
77%
42%
48%
1
2
2
MathematicsInstructionPercentage ofpublic school 8thgraders whosemathematicsteachers do thefollowing, 1996(Indicator 17)
1 At least once a week.2 On a 4-point scale from “none” to “a lot,” defined as a response to the top point.
77%
33%
3 highest levels2 lowest levels
Adult LiteracyPercentage ofadults who scoredat 3 highest levelsin Prose Literacy(Indicator 20)
KEY
KEY
!! Significant progress
@@ Significant decline
## Change is not significant
Scorecards #2 (MO-VI) 10/30/97 11:58 AM Page 226

227
† Median is the middle score in a set of ranked scores.** Indicators are not the same at the national and state level.— Data not available. See Appendix A.• Baseline years and most recent update years may differ by state
for this indicator. See Appendix C for more information.See pages 72-75 for a Guide to Reading the State Pages.See Appendix C for technical notes and sources.
23. Reduced marijuana use? (1991, 1995) • — — ** ** 4-18% 7-32% 10% 23%24. Reduced alcohol use (more than 5 drinks in a row)? (1991, 1995) • — — ** ** 17-43% 13-43% 30% 31%25. Reduced availability of drugs on school property? (1993, 1995) • — — ** ** 11-31% 20-46% 22% 30%26. Reduced students threatened or injured with a weapon while on school property? (1993, 1995) • — — ** ** 6-15% 4-11% 8% 8%27. Reduced physical fights on school property? (1993, 1995) • — — ** ** 13-39% 12-19% 16% 15%28. Reduced students carrying weapons on school property? (1993, 1995) • — — ** ** 8-18% 7-14% 12% 11%29. Reduced students not feeling safe at school? (1993, 1995) • — — ** ** 3-23% 3-16% 6% 5%30. Reduced teacher victimization? (1994) 13% — 15% — 8-26% — 14% —31. Reduced student disruptions? (1991, 1994) 37% 57% @@ 37% 46% @@ 23-60% 33-65% 37% 47%
32. Decreased schools with minimal parental involvement• Teacher’s perspective? (1991, 1994) 19% 30% @@ ** ** 9-44% 13-50% 23% 27%• Principal’s perspective? (1991, 1994) 13% 12% ## ** ** 4-22% 3-27% 13% 13%
33. Increased influence of parent associations? (1991, 1994) 12% 21% ## ** ** 8-37% 12-50% 16% 22%
OREGON
GOAL 7
GOAL 8
U.S.
baseline update progress?
Oregon
baseline update progress?
Range of State Scores
baseline update
MedianScores†
baseline update
Safe, Disciplined and Alcohol- and Drug-free Schools
Parental Participation
0% 20% 40% 60% 80% 100%
Establishingcurriculum
One ormore areas
Hiring newfull-timeteachers
Settingdiscipline
policy
1991 1994
12%
21%
5%
5%
7%
5%
14%
11%
ns
ns
ns
Parent-SchoolPartnershipsPercentage of public school principals whoreported that theparent associationhas influence1 onthe following areas(Indicator 33)
1 On a 6-point scale from no influence to a great deal of influence, defined asa response to the top two points.
nsInterpret with caution. Change was not statistically significant.
KEY
KEY
!! Significant progress
@@ Significant decline
## Change is not significant
Scorecards #2 (MO-VI) 10/30/97 11:58 AM Page 227

228
8. Increased reading achievement in Grade 4? (1992, 1994) • 32% 30% ## 29% 30% ## 8-38% 8-41% 26% 27%9. Increased mathematics achievement •
• in Grade 4? (1992, 1996) 22% 20% ## 18% 21% !! 5-27% 3-31% 16% 20%• in Grade 8? (1990, 1992) 17% 22% ## 15% 21% !! 1-27% 1-31% 15% 18%
10. Increased science achievement in Grade 8? (1996) — — 29% — 5-41% — 27% —
PENNSYLVANIA
† Median is the middle score in a set of ranked scores.* Comparable national data are not available.— Data not available. See Appendix A.• Baseline years and most recent update years may differ by state
for this indicator. See Appendix C for more information.See pages 72-75 for a Guide to Reading the State Pages.See Appendix C for technical notes and sources.
GOAL 1
GOAL 2
GOAL 3
Pennsylvania
baseline update progress?
Range of State Scores
baseline update
MedianScores†
baseline update
U.S.
baseline update progress?
1. Reduced percentage of infants born in the state with 1 or more health risks? (1990, 1995) 39% 37% !! 37% 34% !! 25-48% 24-46% 38% 35%2. Increased percentage of 2-year-olds immunized? (1994, 1996) 77% 81% ## 75% 78% !! 61-88% 64-88% 76% 79%3. Reduced number of infants (per 1,000) born with low birthweight? (1990, 1995) 71 74 @@ 70 73 @@ 48-151 53-134 71 754. Increased number of mothers (per 1,000) receiving early prenatal care? (1990, 1995) 797 834 !! 758 813 !! 469-868 560-900 778 8285. Increased number of children with disabilities in preschool (per 1,000)? (1991, 1996) 37 42 !! * * 16-68 16-92 38 47
6. Increased high school completion rate? (1990, 1995) 90% 90% ## 86% 86% ## 77-96% 79-96% 87% 88%7. Reduced high school dropout rate? (1992, 1994) • 4% 4% ## * * 3-12% 3-10% 5% 5%
Ready to Learn
School Completion
Student Achievement and Citizenship
19951990
100%
80%
60%
40%
20%
0%
90% 90%
High School CompletionPercentage of all18- to 24-year-olds1
who have a highschool credential2(Indicator 6)
1 Does not include those still in high school.2 Includes traditional high school diploma and alternative credential.
0%
20%
40%
60%
80%
100%
19951990
37%39%
Children’sHealth IndexPercentage ofinfants born with 1or more healthrisks1 (Indicator 1)
1 Includes late (in third trimester) or no prenatal care, low maternal weightgain (less than 21 pounds), mother smoked during pregnancy, or motherdrank alcohol during pregnancy.
KEY
KEY
!! Significant progress
@@ Significant decline
## Change is not significant
Scorecards #2 (MO-VI) 10/30/97 11:58 AM Page 228
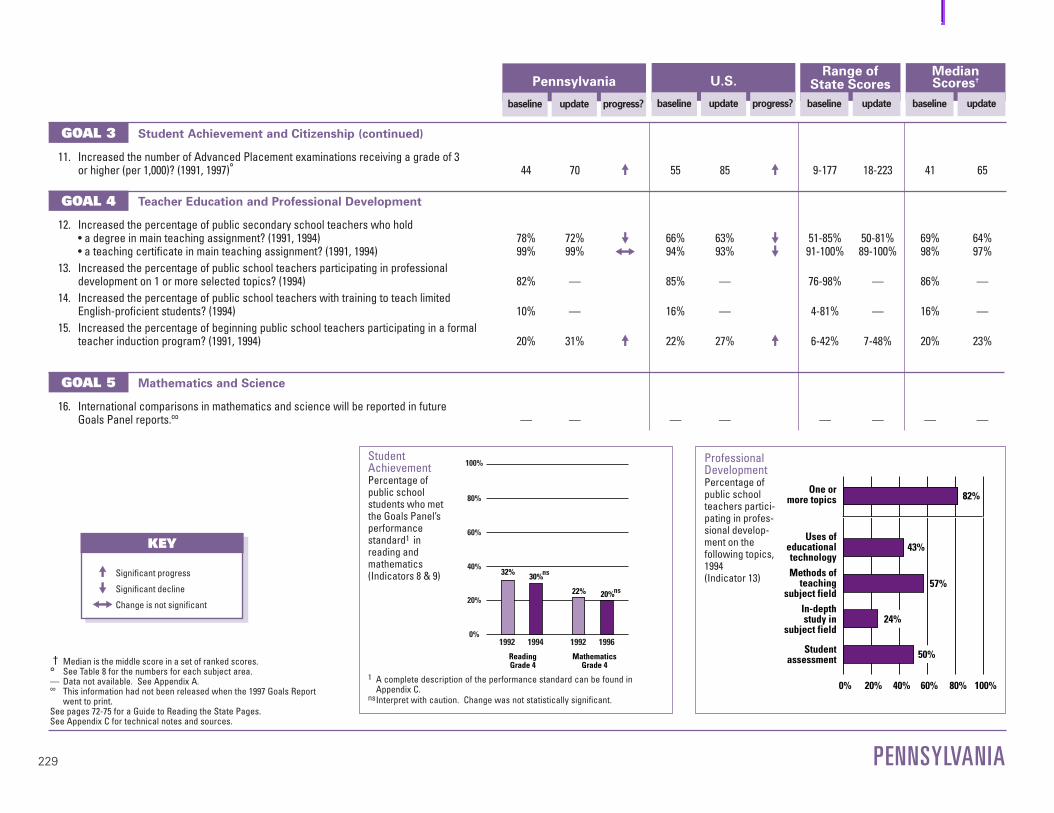
229
† Median is the middle score in a set of ranked scores.° See Table 8 for the numbers for each subject area.— Data not available. See Appendix A.∞ This information had not been released when the 1997 Goals Report
went to print.See pages 72-75 for a Guide to Reading the State Pages.See Appendix C for technical notes and sources.
11. Increased the number of Advanced Placement examinations receiving a grade of 3 or higher (per 1,000)? (1991, 1997)° 44 70 !! 55 85 !! 9-177 18-223 41 65
12. Increased the percentage of public secondary school teachers who hold • a degree in main teaching assignment? (1991, 1994) 78% 72% @@ 66% 63% @@ 51-85% 50-81% 69% 64%• a teaching certificate in main teaching assignment? (1991, 1994) 99% 99% ## 94% 93% @@ 91-100% 89-100% 98% 97%
13. Increased the percentage of public school teachers participating in professional development on 1 or more selected topics? (1994) 82% — 85% — 76-98% — 86% —
14. Increased the percentage of public school teachers with training to teach limited English-proficient students? (1994) 10% — 16% — 4-81% — 16% —
15. Increased the percentage of beginning public school teachers participating in a formal teacher induction program? (1991, 1994) 20% 31% !! 22% 27% !! 6-42% 7-48% 20% 23%
16. International comparisons in mathematics and science will be reported in future Goals Panel reports.∞ — — — — — — — —
PENNSYLVANIA
GOAL 3
GOAL 4
GOAL 5
U.S.
baseline update progress?
Pennsylvania
baseline update progress?
Range of State Scores
baseline update
MedianScores†
baseline update
Student Achievement and Citizenship (continued)
Teacher Education and Professional Development
Mathematics and Science
ReadingGrade 4
MathematicsGrade 4
1996199219941992
100%
80%
60%
40%
20%
0%
30%32%
22% 20%
ns
ns
Student AchievementPercentage of public school students who metthe Goals Panel’sperformancestandard1 in reading and mathematics (Indicators 8 & 9)
1 A complete description of the performance standard can be found inAppendix C.
nsInterpret with caution. Change was not statistically significant.0 2
0
40
60
80
10
0
0% 20% 40% 60% 80% 100%
Uses ofeducationaltechnology
One ormore topics
Methods ofteaching
subject fieldIn-depthstudy in
subject field
Studentassessment
82%
43%
57%
24%
50%
Professional DevelopmentPercentage ofpublic schoolteachers partici-pating in profes-sional develop-ment on thefollowing topics,1994(Indicator 13)KEY
KEY
!! Significant progress
@@ Significant decline
## Change is not significant
Scorecards #2 (MO-VI) 10/30/97 11:58 AM Page 229
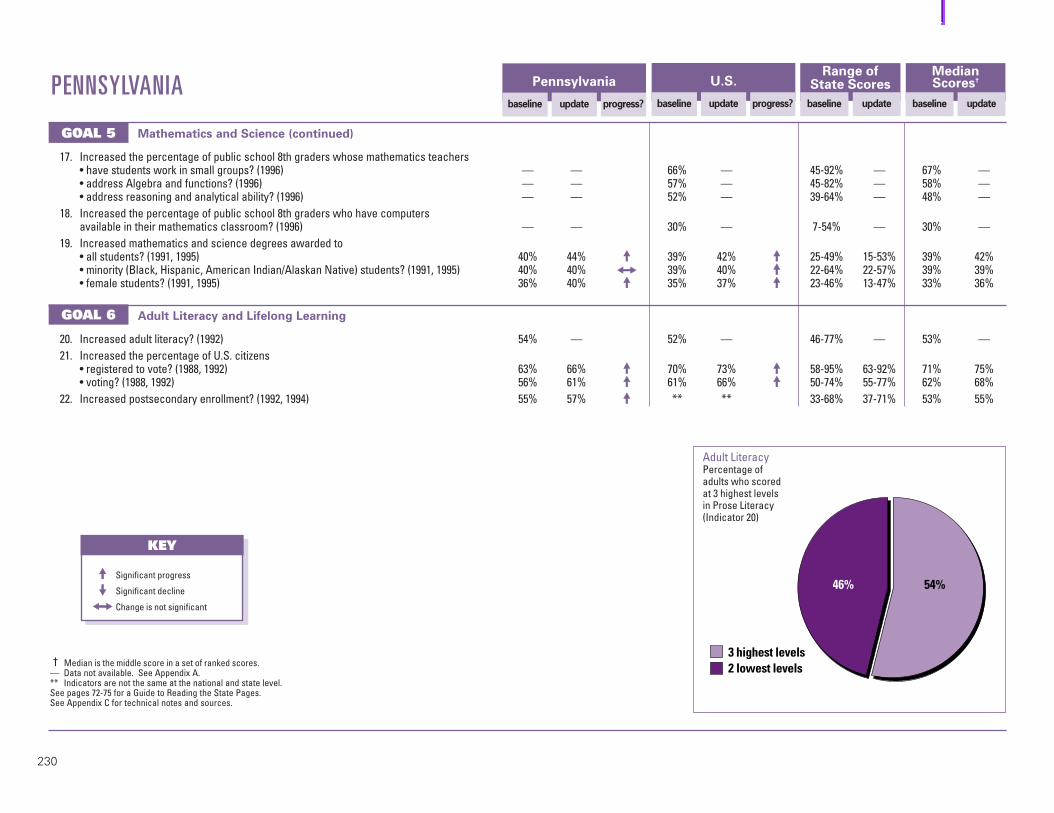
230
20. Increased adult literacy? (1992) 54% — 52% — 46-77% — 53% —21. Increased the percentage of U.S. citizens
• registered to vote? (1988, 1992) 63% 66% !! 70% 73% !! 58-95% 63-92% 71% 75%• voting? (1988, 1992) 56% 61% !! 61% 66% !! 50-74% 55-77% 62% 68%
22. Increased postsecondary enrollment? (1992, 1994) 55% 57% !! ** ** 33-68% 37-71% 53% 55%
PENNSYLVANIA
† Median is the middle score in a set of ranked scores.— Data not available. See Appendix A.** Indicators are not the same at the national and state level.See pages 72-75 for a Guide to Reading the State Pages.See Appendix C for technical notes and sources.
GOAL 5
GOAL 6
Pennsylvania
baseline update progress?
Range of State Scores
baseline update
MedianScores†
baseline update
U.S.
baseline update progress?
17. Increased the percentage of public school 8th graders whose mathematics teachers • have students work in small groups? (1996) — — 66% — 45-92% — 67% —• address Algebra and functions? (1996) — — 57% — 45-82% — 58% —• address reasoning and analytical ability? (1996) — — 52% — 39-64% — 48% —
18. Increased the percentage of public school 8th graders who have computers available in their mathematics classroom? (1996) — — 30% — 7-54% — 30% —
19. Increased mathematics and science degrees awarded to • all students? (1991, 1995) 40% 44% !! 39% 42% !! 25-49% 15-53% 39% 42%• minority (Black, Hispanic, American Indian/Alaskan Native) students? (1991, 1995) 40% 40% ## 39% 40% !! 22-64% 22-57% 39% 39%• female students? (1991, 1995) 36% 40% !! 35% 37% !! 23-46% 13-47% 33% 36%
Mathematics and Science (continued)
Adult Literacy and Lifelong Learning
54%46%
3 highest levels2 lowest levels
Adult LiteracyPercentage ofadults who scoredat 3 highest levelsin Prose Literacy(Indicator 20)
KEY
KEY
!! Significant progress
@@ Significant decline
## Change is not significant
Scorecards #2 (MO-VI) 10/30/97 11:58 AM Page 230

231
† Median is the middle score in a set of ranked scores.** Indicators are not the same at the national and state level.— Data not available. See Appendix A.• Baseline years and most recent update years may differ by state
for this indicator. See Appendix C for more information.See pages 72-75 for a Guide to Reading the State Pages.See Appendix C for technical notes and sources.
23. Reduced marijuana use? (1991, 1995) • — — ** ** 4-18% 7-32% 10% 23%24. Reduced alcohol use (more than 5 drinks in a row)? (1991, 1995) • — — ** ** 17-43% 13-43% 30% 31%25. Reduced availability of drugs on school property? (1993, 1995) • — — ** ** 11-31% 20-46% 22% 30%26. Reduced students threatened or injured with a weapon while on school property? (1993, 1995) • — — ** ** 6-15% 4-11% 8% 8%27. Reduced physical fights on school property? (1993, 1995) • — — ** ** 13-39% 12-19% 16% 15%28. Reduced students carrying weapons on school property? (1993, 1995) • — — ** ** 8-18% 7-14% 12% 11%29. Reduced students not feeling safe at school? (1993, 1995) • — — ** ** 3-23% 3-16% 6% 5%30. Reduced teacher victimization? (1994) 13% — 15% — 8-26% — 14% —31. Reduced student disruptions? (1991, 1994) 33% 49% @@ 37% 46% @@ 23-60% 33-65% 37% 47%
32. Decreased schools with minimal parental involvement• Teacher’s perspective? (1991, 1994) 18% 21% ## ** ** 9-44% 13-50% 23% 27%• Principal’s perspective? (1991, 1994) 13% 10% ## ** ** 4-22% 3-27% 13% 13%
33. Increased influence of parent associations? (1991, 1994) 10% 28% !! ** ** 8-37% 12-50% 16% 22%
PENNSYLVANIA
GOAL 7
GOAL 8
U.S.
baseline update progress?
Pennsylvania
baseline update progress?
Range of State Scores
baseline update
MedianScores†
baseline update
Safe, Disciplined and Alcohol- and Drug-free Schools
Parental Participation
0% 20% 40% 60% 80% 100%
Establishingcurriculum
One ormore areas
Hiring newfull-timeteachers
Settingdiscipline
policy
1991 1994
10%
28%
3%
15%
3%
20%
7%
Parent-SchoolPartnershipsPercentage of public school principals whoreported that theparent associationhas influence1 onthe following areas(Indicator 33)
1 On a 6-point scale from no influence to a great deal of influence, defined asa response to the top two points.
KEY
KEY
!! Significant progress
@@ Significant decline
## Change is not significant
Scorecards #2 (MO-VI) 10/30/97 11:58 AM Page 231

232
8. Increased reading achievement in Grade 4? (1992, 1994) • 28% 32% ## 29% 30% ## 8-38% 8-41% 26% 27%9. Increased mathematics achievement •
• in Grade 4? (1992, 1996) 13% 17% ## 18% 21% !! 5-27% 3-31% 16% 20%• in Grade 8? (1990, 1996) 15% 20% !! 15% 24% !! 1-27% 5-34% 15% 22%
10. Increased science achievement in Grade 8? (1996) 26% — 29% — 5-41% — 27% —
RHODE ISLAND
† Median is the middle score in a set of ranked scores.* Comparable national data are not available.— Data not available. See Appendix A.• Baseline years and most recent update years may differ by state
for this indicator. See Appendix C for more information.See pages 72-75 for a Guide to Reading the State Pages.See Appendix C for technical notes and sources.
GOAL 1
GOAL 2
GOAL 3
Rhode Island
baseline update progress?
Range of State Scores
baseline update
MedianScores†
baseline update
U.S.
baseline update progress?
1. Reduced percentage of infants born in the state with 1 or more health risks? (1990, 1995) 36% 30% !! 37% 34% !! 25-48% 24-46% 38% 35%2. Increased percentage of 2-year-olds immunized? (1994, 1996) 82% 85% ## 75% 78% !! 61-88% 64-88% 76% 79%3. Reduced number of infants (per 1,000) born with low birthweight? (1990, 1995) 62 68 @@ 70 73 @@ 48-151 53-134 71 754. Increased number of mothers (per 1,000) receiving early prenatal care? (1990, 1995) 868 897 !! 758 813 !! 469-868 560-900 778 8285. Increased number of children with disabilities in preschool (per 1,000)? (1991, 1996) 42 55 !! * * 16-68 16-92 38 47
6. Increased high school completion rate? (1990, 1995) 87% 88% ## 86% 86% ## 77-96% 79-96% 87% 88%7. Reduced high school dropout rate? (1992, 1994) • 5% 5% ## * * 3-12% 3-10% 5% 5%
Ready to Learn
School Completion
Student Achievement and Citizenship
19951990
88%100%
80%
60%
40%
20%
0%
87%ns
High School CompletionPercentage of all18- to 24-year-olds1
who have a highschool credential2(Indicator 6)
1 Does not include those still in high school.2 Includes traditional high school diploma and alternative credential.nsInterpret with caution. Change was not statistically significant.
0%
20%
40%
60%
80%
100%
19951990
30%36%
Children’sHealth IndexPercentage ofinfants born with 1or more healthrisks1 (Indicator 1)
1 Includes late (in third trimester) or no prenatal care, low maternal weightgain (less than 21 pounds), mother smoked during pregnancy, or motherdrank alcohol during pregnancy.
KEY
KEY
!! Significant progress
@@ Significant decline
## Change is not significant
Scorecards #2 (MO-VI) 10/30/97 11:58 AM Page 232

233
† Median is the middle score in a set of ranked scores.° See Table 8 for the numbers for each subject area.— Data not available. See Appendix A.∞ This information had not been released when the 1997 Goals Report
went to print.See pages 72-75 for a Guide to Reading the State Pages.See Appendix C for technical notes and sources.
11. Increased the number of Advanced Placement examinations receiving a grade of 3 or higher (per 1,000)? (1991, 1997)° 58 78 !! 55 85 !! 9-177 18-223 41 65
12. Increased the percentage of public secondary school teachers who hold • a degree in main teaching assignment? (1991, 1994) 72% 76% ## 66% 63% @@ 51-85% 50-81% 69% 64%• a teaching certificate in main teaching assignment? (1991, 1994) 100% 100% ## 94% 93% @@ 91-100% 89-100% 98% 97%
13. Increased the percentage of public school teachers participating in professional development on 1 or more selected topics? (1994) 77% — 85% — 76-98% — 86% —
14. Increased the percentage of public school teachers with training to teach limited English-proficient students? (1994) 29% — 16% — 4-81% — 16% —
15. Increased the percentage of beginning public school teachers participating in a formal teacher induction program? (1991, 1994) 11% 7% @@ 22% 27% !! 6-42% 7-48% 20% 23%
16. International comparisons in mathematics and science will be reported in future Goals Panel reports.∞ — — — — — — — —
RHODE ISLAND
GOAL 3
GOAL 4
GOAL 5
U.S.
baseline update progress?
Rhode Island
baseline update progress?
Range of State Scores
baseline update
MedianScores†
baseline update
Student Achievement and Citizenship (continued)
Teacher Education and Professional Development
Mathematics and Science
ReadingGrade 4
MathematicsGrade 4
1996199219941992
100%
80%
60%
40%
20%
0%
32%28%
13%17%
ns
ns
Student AchievementPercentage of public school students who metthe Goals Panel’sperformancestandard1 in reading and mathematics (Indicators 8 & 9)
1 A complete description of the performance standard can be found inAppendix C.
nsInterpret with caution. Change was not statistically significant.
0 20
40
60
80
10
0
0% 20% 40% 60% 80% 100%
Uses ofeducationaltechnology
One ormore topics
Methods ofteaching
subject fieldIn-depthstudy in
subject field
Studentassessment
77%
38%
56%
22%
48%
Professional DevelopmentPercentage ofpublic schoolteachers partici-pating in profes-sional develop-ment on thefollowing topics,1994(Indicator 13)KEY
KEY
!! Significant progress
@@ Significant decline
## Change is not significant
Scorecards #2 (MO-VI) 10/30/97 11:58 AM Page 233

234
20. Increased adult literacy? (1992) — — 52% — 46-77% — 53% —21. Increased the percentage of U.S. citizens
• registered to vote? (1988, 1992) 73% 78% !! 70% 73% !! 58-95% 63-92% 71% 75%• voting? (1988, 1992) 64% 73% !! 61% 66% !! 50-74% 55-77% 62% 68%
22. Increased postsecondary enrollment? (1992, 1994) 64% 65% ❊ ** ** 33-68% 37-71% 53% 55%
RHODE ISLAND
† Median is the middle score in a set of ranked scores.— Data not available. See Appendix A.** Indicators are not the same at the national and state level.❊ Sample size does not permit a reliable estimate of change.See pages 72-75 for a Guide to Reading the State Pages.See Appendix C for technical notes and sources.
GOAL 5
GOAL 6
Rhode Island
baseline update progress?
Range of State Scores
baseline update
MedianScores†
baseline update
U.S.
baseline update progress?
17. Increased the percentage of public school 8th graders whose mathematics teachers • have students work in small groups? (1996) 57% — 66% — 45-92% — 67% —• address Algebra and functions? (1996) 47% — 57% — 45-82% — 58% —• address reasoning and analytical ability? (1996) 47% — 52% — 39-64% — 48% —
18. Increased the percentage of public school 8th graders who have computers available in their mathematics classroom? (1996) 7% — 30% — 7-54% — 30% —
19. Increased mathematics and science degrees awarded to • all students? (1991, 1995) 34% 38% !! 39% 42% !! 25-49% 15-53% 39% 42%• minority (Black, Hispanic, American Indian/Alaskan Native) students? (1991, 1995) 40% 37% @@ 39% 40% !! 22-64% 22-57% 39% 39%• female students? (1991, 1995) 31% 34% !! 35% 37% !! 23-46% 13-47% 33% 36%
Mathematics and Science (continued)
Adult Literacy and Lifelong Learning
Addressreasoning & analytical
ability
AddressAlgebra and functions
Work insmall groups
or with apartner
0% 20% 40% 60% 80% 100%
57%
47%
47%
1
2
2
MathematicsInstructionPercentage ofpublic school 8thgraders whosemathematicsteachers do thefollowing, 1996(Indicator 17)
1 At least once a week.2 On a 4-point scale from “none” to “a lot,” defined as a response to the top point.
KEY
KEY
!! Significant progress
@@ Significant decline
## Change is not significant
Scorecards #2 (MO-VI) 10/30/97 11:58 AM Page 234

235
† Median is the middle score in a set of ranked scores.** Indicators are not the same at the national and state level.— Data not available. See Appendix A.• Baseline years and most recent update years may differ by state
for this indicator. See Appendix C for more information.See pages 72-75 for a Guide to Reading the State Pages.See Appendix C for technical notes and sources.
23. Reduced marijuana use? (1991, 1995) • — — ** ** 4-18% 7-32% 10% 23%24. Reduced alcohol use (more than 5 drinks in a row)? (1991, 1995) • — — ** ** 17-43% 13-43% 30% 31%25. Reduced availability of drugs on school property? (1993, 1995) • — — ** ** 11-31% 20-46% 22% 30%26. Reduced students threatened or injured with a weapon while on school property? (1993, 1995) • — — ** ** 6-15% 4-11% 8% 8%27. Reduced physical fights on school property? (1993, 1995) • — — ** ** 13-39% 12-19% 16% 15%28. Reduced students carrying weapons on school property? (1993, 1995) • — — ** ** 8-18% 7-14% 12% 11%29. Reduced students not feeling safe at school? (1993, 1995) • — — ** ** 3-23% 3-16% 6% 5%30. Reduced teacher victimization? (1994) 14% — 15% — 8-26% — 14% —31. Reduced student disruptions? (1991, 1994) 52% 43% ## 37% 46% @@ 23-60% 33-65% 37% 47%
32. Decreased schools with minimal parental involvement• Teacher’s perspective? (1991, 1994) 20% 26% ## ** ** 9-44% 13-50% 23% 27%• Principal’s perspective? (1991, 1994) 11% 7% ## ** ** 4-22% 3-27% 13% 13%
33. Increased influence of parent associations? (1991, 1994) 8% 20% !! ** ** 8-37% 12-50% 16% 22%
RHODE ISLAND
GOAL 7
GOAL 8
U.S.
baseline update progress?
Rhode Island
baseline update progress?
Range of State Scores
baseline update
MedianScores†
baseline update
Safe, Disciplined and Alcohol- and Drug-free Schools
Parental Participation
0% 20% 40% 60% 80% 100%
Establishingcurriculum
One ormore areas
Hiring newfull-timeteachers
Settingdiscipline
policy
1991 1994
8%
20%
3%
6%
6%
12%
6%
ns
ns
Parent-SchoolPartnershipsPercentage of public school principals whoreported that theparent associationhas influence1 onthe following areas(Indicator 33)
1 On a 6-point scale from no influence to a great deal of influence, defined asa response to the top two points.
nsInterpret with caution. Change was not statistically significant.
KEY
KEY
!! Significant progress
@@ Significant decline
## Change is not significant
Scorecards #2 (MO-VI) 10/30/97 11:58 AM Page 235

236
8. Increased reading achievement in Grade 4? (1992, 1994) • 22% 20% ## 29% 30% ## 8-38% 8-41% 26% 27%9. Increased mathematics achievement •
• in Grade 4? (1992, 1996) 13% 12% ## 18% 21% !! 5-27% 3-31% 16% 20%• in Grade 8? (1992, 1996) 15% 14% ## 21% 24% ## 1-31% 5-34% 18% 22%
10. Increased science achievement in Grade 8? (1996) 17% — 29% — 5-41% — 27% —
SOUTH CAROLINA
† Median is the middle score in a set of ranked scores.* Comparable national data are not available.— Data not available. See Appendix A.• Baseline years and most recent update years may differ by state
for this indicator. See Appendix C for more information.See pages 72-75 for a Guide to Reading the State Pages.See Appendix C for technical notes and sources.
GOAL 1
GOAL 2
GOAL 3
South Carolina
baseline update progress?
Range of State Scores
baseline update
MedianScores†
baseline update
U.S.
baseline update progress?
1. Reduced percentage of infants born in the state with 1 or more health risks? (1990, 1995) 43% 39% !! 37% 34% !! 25-48% 24-46% 38% 35%2. Increased percentage of 2-year-olds immunized? (1994, 1996) 84% 86% ## 75% 78% !! 61-88% 64-88% 76% 79%3. Reduced number of infants (per 1,000) born with low birthweight? (1990, 1995) 87 93 @@ 70 73 @@ 48-151 53-134 71 754. Increased number of mothers (per 1,000) receiving early prenatal care? (1990, 1995) 688 785 !! 758 813 !! 469-868 560-900 778 8285. Increased number of children with disabilities in preschool (per 1,000)? (1991, 1996) 52 63 !! * * 16-68 16-92 38 47
6. Increased high school completion rate? (1990, 1995) 83% 88% !! 86% 86% ## 77-96% 79-96% 87% 88%7. Reduced high school dropout rate? (1992, 1994) • — — * * 3-12% 3-10% 5% 5%
Ready to Learn
School Completion
Student Achievement and Citizenship
19951990
88%100%
80%
60%
40%
20%
0%
83%
High School CompletionPercentage of all18- to 24-year-olds1
who have a highschool credential2(Indicator 6)
1 Does not include those still in high school.2 Includes traditional high school diploma and alternative credential.
0%
20%
40%
60%
80%
100%
19951990
39%43%
Children’sHealth IndexPercentage ofinfants born with 1or more healthrisks1 (Indicator 1)
1 Includes late (in third trimester) or no prenatal care, low maternal weightgain (less than 21 pounds), mother smoked during pregnancy, or motherdrank alcohol during pregnancy.
KEY
KEY
!! Significant progress
@@ Significant decline
## Change is not significant
Scorecards #2 (MO-VI) 10/30/97 11:58 AM Page 236

237
† Median is the middle score in a set of ranked scores.° See Table 8 for the numbers for each subject area.— Data not available. See Appendix A.∞ This information had not been released when the 1997 Goals Report
went to print.See pages 72-75 for a Guide to Reading the State Pages.See Appendix C for technical notes and sources.
11. Increased the number of Advanced Placement examinations receiving a grade of 3 or higher (per 1,000)? (1991, 1997)° 69 96 !! 55 85 !! 9-177 18-223 41 65
12. Increased the percentage of public secondary school teachers who hold • a degree in main teaching assignment? (1991, 1994) 69% 63% ## 66% 63% @@ 51-85% 50-81% 69% 64%• a teaching certificate in main teaching assignment? (1991, 1994) 98% 95% @@ 94% 93% @@ 91-100% 89-100% 98% 97%
13. Increased the percentage of public school teachers participating in professional development on 1 or more selected topics? (1994) 81% — 85% — 76-98% — 86% —
14. Increased the percentage of public school teachers with training to teach limited English-proficient students? (1994) 11% — 16% — 4-81% — 16% —
15. Increased the percentage of beginning public school teachers participating in a formal teacher induction program? (1991, 1994) 24% 29% !! 22% 27% !! 6-42% 7-48% 20% 23%
16. International comparisons in mathematics and science will be reported in future Goals Panel reports.∞ — — — — — — — —
SOUTH CAROLINA
GOAL 3
GOAL 4
GOAL 5
U.S.
baseline update progress?
South Carolina
baseline update progress?
Range of State Scores
baseline update
MedianScores†
baseline update
Student Achievement and Citizenship (continued)
Teacher Education and Professional Development
Mathematics and Science
ReadingGrade 4
MathematicsGrade 4
1996199219941992
100%
80%
60%
40%
20%
0%
20%22%
13% 12%ns
ns
Student AchievementPercentage of public school students who metthe Goals Panel’sperformancestandard1 in reading and mathematics (Indicators 8 & 9)
1 A complete description of the performance standard can be found inAppendix C.
nsInterpret with caution. Change was not statistically significant.
0 20
40
60
80
10
0
0% 20% 40% 60% 80% 100%
Uses ofeducationaltechnology
One ormore topics
Methods ofteaching
subject fieldIn-depthstudy in
subject field
Studentassessment
81%
42%
61%
24%
46%
Professional DevelopmentPercentage ofpublic schoolteachers partici-pating in profes-sional develop-ment on thefollowing topics,1994(Indicator 13)KEY
KEY
!! Significant progress
@@ Significant decline
## Change is not significant
Scorecards #2 (MO-VI) 10/30/97 11:58 AM Page 237

238
20. Increased adult literacy? (1992) — — 52% — 46-77% — 53% —21. Increased the percentage of U.S. citizens
• registered to vote? (1988, 1992) 61% 68% ## 70% 73% !! 58-95% 63-92% 71% 75%• voting? (1988, 1992) 50% 59% !! 61% 66% !! 50-74% 55-77% 62% 68%
22. Increased postsecondary enrollment? (1992, 1994) 43% 58% ❊ ** ** 33-68% 37-71% 53% 55%
SOUTH CAROLINA
† Median is the middle score in a set of ranked scores.— Data not available. See Appendix A.** Indicators are not the same at the national and state level.❊ Sample size does not permit a reliable estimate of change.See pages 72-75 for a Guide to Reading the State Pages.See Appendix C for technical notes and sources.
GOAL 5
GOAL 6
South Carolina
baseline update progress?
Range of State Scores
baseline update
MedianScores†
baseline update
U.S.
baseline update progress?
17. Increased the percentage of public school 8th graders whose mathematics teachers • have students work in small groups? (1996) 67% — 66% — 45-92% — 67% —• address Algebra and functions? (1996) 52% — 57% — 45-82% — 58% —• address reasoning and analytical ability? (1996) 50% — 52% — 39-64% — 48% —
18. Increased the percentage of public school 8th graders who have computers available in their mathematics classroom? (1996) 31% — 30% — 7-54% — 30% —
19. Increased mathematics and science degrees awarded to • all students? (1991, 1995) 37% 41% !! 39% 42% !! 25-49% 15-53% 39% 42%• minority (Black, Hispanic, American Indian/Alaskan Native) students? (1991, 1995) 36% 38% !! 39% 40% !! 22-64% 22-57% 39% 39%• female students? (1991, 1995) 34% 38% !! 35% 37% !! 23-46% 13-47% 33% 36%
Mathematics and Science (continued)
Adult Literacy and Lifelong Learning
Addressreasoning & analytical
ability
AddressAlgebra and functions
Work insmall groups
or with apartner
0% 20% 40% 60% 80% 100%
67%
50%
52%
1
2
2
MathematicsInstructionPercentage ofpublic school 8thgraders whosemathematicsteachers do thefollowing, 1996(Indicator 17)
1 At least once a week.2 On a 4-point scale from “none” to “a lot,” defined as a response to the top point.
KEY
KEY
!! Significant progress
@@ Significant decline
## Change is not significant
Scorecards #2 (MO-VI) 10/30/97 11:58 AM Page 238
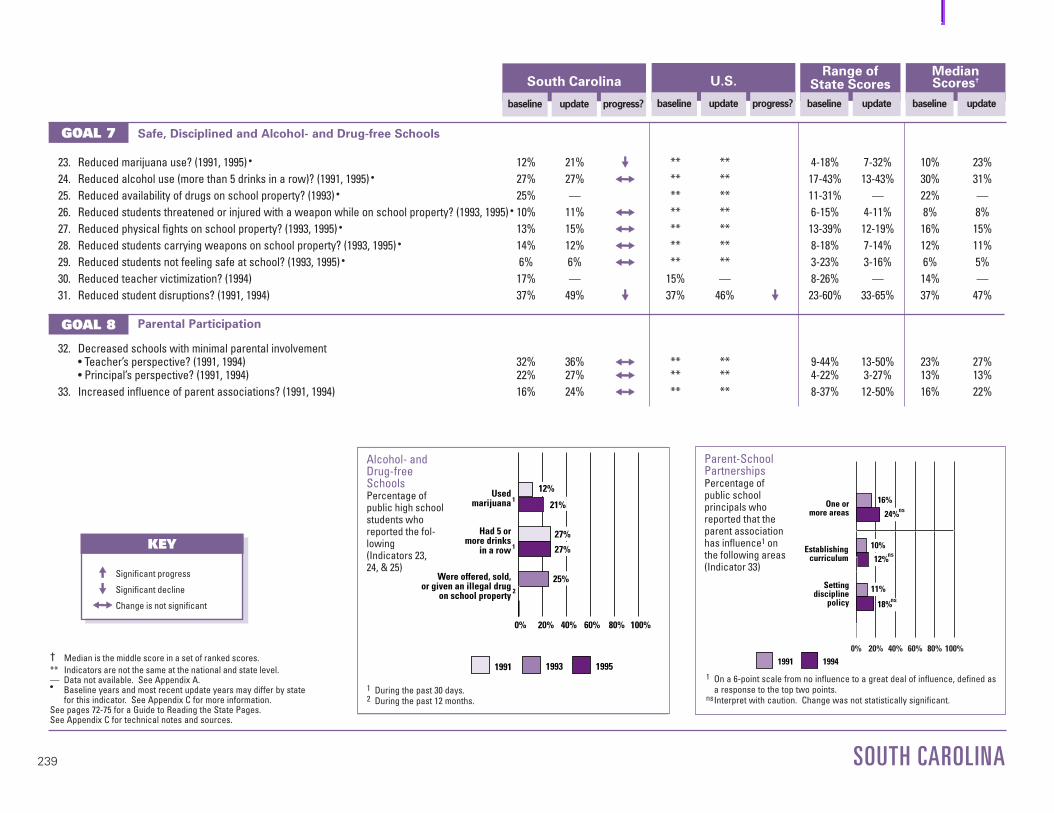
239
† Median is the middle score in a set of ranked scores.** Indicators are not the same at the national and state level.— Data not available. See Appendix A.• Baseline years and most recent update years may differ by state
for this indicator. See Appendix C for more information.See pages 72-75 for a Guide to Reading the State Pages.See Appendix C for technical notes and sources.
23. Reduced marijuana use? (1991, 1995) • 12% 21% @@ ** ** 4-18% 7-32% 10% 23%24. Reduced alcohol use (more than 5 drinks in a row)? (1991, 1995) • 27% 27% ## ** ** 17-43% 13-43% 30% 31%25. Reduced availability of drugs on school property? (1993) • 25% — ** ** 11-31% — 22% —26. Reduced students threatened or injured with a weapon while on school property? (1993, 1995) • 10% 11% ## ** ** 6-15% 4-11% 8% 8%27. Reduced physical fights on school property? (1993, 1995) • 13% 15% ## ** ** 13-39% 12-19% 16% 15%28. Reduced students carrying weapons on school property? (1993, 1995) • 14% 12% ## ** ** 8-18% 7-14% 12% 11%29. Reduced students not feeling safe at school? (1993, 1995) • 6% 6% ## ** ** 3-23% 3-16% 6% 5%30. Reduced teacher victimization? (1994) 17% — 15% — 8-26% — 14% —31. Reduced student disruptions? (1991, 1994) 37% 49% @@ 37% 46% @@ 23-60% 33-65% 37% 47%
32. Decreased schools with minimal parental involvement• Teacher’s perspective? (1991, 1994) 32% 36% ## ** ** 9-44% 13-50% 23% 27%• Principal’s perspective? (1991, 1994) 22% 27% ## ** ** 4-22% 3-27% 13% 13%
33. Increased influence of parent associations? (1991, 1994) 16% 24% ## ** ** 8-37% 12-50% 16% 22%
SOUTH CAROLINA
GOAL 7
GOAL 8
U.S.
baseline update progress?
South Carolina
baseline update progress?
Range of State Scores
baseline update
MedianScores†
baseline update
Safe, Disciplined and Alcohol- and Drug-free Schools
Parental Participation
Usedmarijuana
Had 5 ormore drinks
in a row
Were offered, sold,or given an illegal drug
on school property
1
1
2
0% 20% 40% 60% 80% 100%
1991 1993 1995
21%
12%
27%
27%
25%
Alcohol- andDrug-freeSchoolsPercentage ofpublic high schoolstudents whoreported the fol-lowing(Indicators 23,24, & 25)
1 During the past 30 days.2 During the past 12 months.
0% 20% 40% 60% 80% 100%
Establishingcurriculum
One ormore areas
Settingdiscipline
policy
1991 1994
16%
24%
10%
12%
18%
11%
ns
ns
ns
Parent-SchoolPartnershipsPercentage of public school principals whoreported that theparent associationhas influence1 onthe following areas(Indicator 33)
1 On a 6-point scale from no influence to a great deal of influence, defined asa response to the top two points.
nsInterpret with caution. Change was not statistically significant.
KEY
KEY
!! Significant progress
@@ Significant decline
## Change is not significant
Scorecards #2 (MO-VI) 10/30/97 11:58 AM Page 239
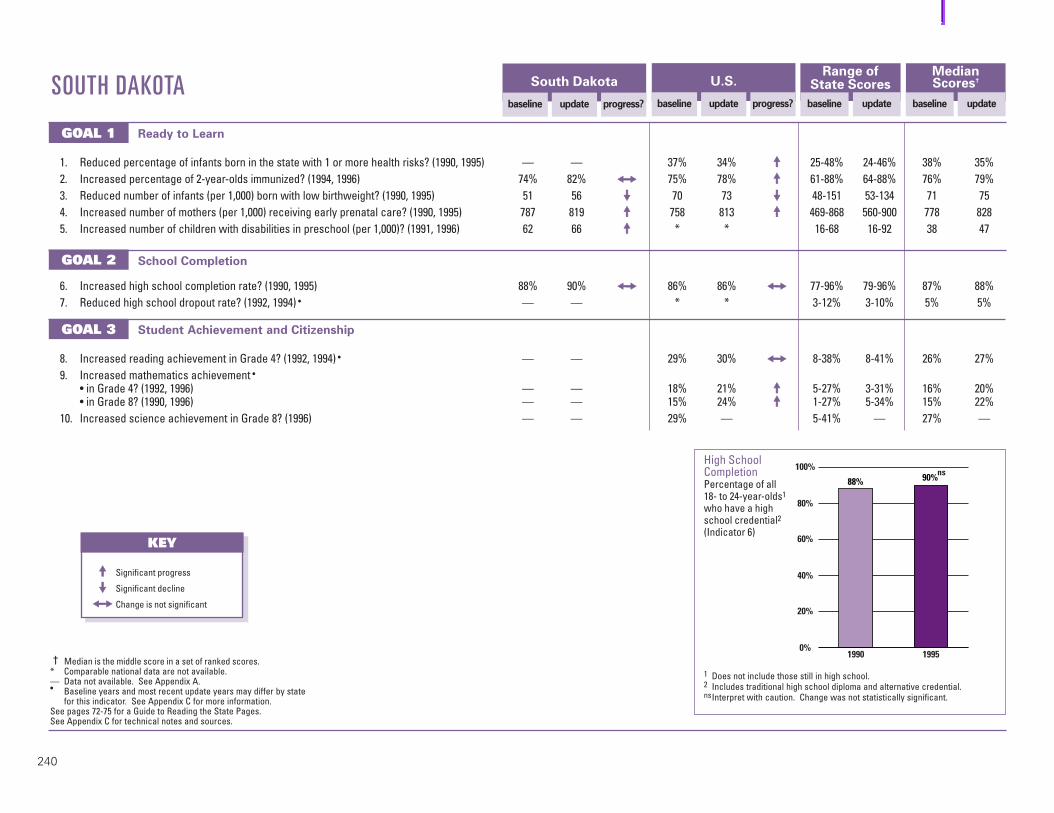
240
8. Increased reading achievement in Grade 4? (1992, 1994) • — — 29% 30% ## 8-38% 8-41% 26% 27%9. Increased mathematics achievement •
• in Grade 4? (1992, 1996) — — 18% 21% !! 5-27% 3-31% 16% 20%• in Grade 8? (1990, 1996) — — 15% 24% !! 1-27% 5-34% 15% 22%
10. Increased science achievement in Grade 8? (1996) — — 29% — 5-41% — 27% —
SOUTH DAKOTA
† Median is the middle score in a set of ranked scores.* Comparable national data are not available.— Data not available. See Appendix A.• Baseline years and most recent update years may differ by state
for this indicator. See Appendix C for more information.See pages 72-75 for a Guide to Reading the State Pages.See Appendix C for technical notes and sources.
GOAL 1
GOAL 2
GOAL 3
South Dakota
baseline update progress?
Range of State Scores
baseline update
MedianScores†
baseline update
U.S.
baseline update progress?
1. Reduced percentage of infants born in the state with 1 or more health risks? (1990, 1995) — — 37% 34% !! 25-48% 24-46% 38% 35%2. Increased percentage of 2-year-olds immunized? (1994, 1996) 74% 82% ## 75% 78% !! 61-88% 64-88% 76% 79%3. Reduced number of infants (per 1,000) born with low birthweight? (1990, 1995) 51 56 @@ 70 73 @@ 48-151 53-134 71 754. Increased number of mothers (per 1,000) receiving early prenatal care? (1990, 1995) 787 819 !! 758 813 !! 469-868 560-900 778 8285. Increased number of children with disabilities in preschool (per 1,000)? (1991, 1996) 62 66 !! * * 16-68 16-92 38 47
6. Increased high school completion rate? (1990, 1995) 88% 90% ## 86% 86% ## 77-96% 79-96% 87% 88%7. Reduced high school dropout rate? (1992, 1994) • — — * * 3-12% 3-10% 5% 5%
Ready to Learn
School Completion
Student Achievement and Citizenship
19951990
90%100%
80%
60%
40%
20%
0%
88%ns
High School CompletionPercentage of all18- to 24-year-olds1
who have a highschool credential2(Indicator 6)
1 Does not include those still in high school.2 Includes traditional high school diploma and alternative credential.nsInterpret with caution. Change was not statistically significant.
KEY
KEY
!! Significant progress
@@ Significant decline
## Change is not significant
Scorecards #2 (MO-VI) 10/30/97 11:58 AM Page 240

241
† Median is the middle score in a set of ranked scores.° See Table 8 for the numbers for each subject area.— Data not available. See Appendix A.∞ This information had not been released when the 1997 Goals Report
went to print.See pages 72-75 for a Guide to Reading the State Pages.See Appendix C for technical notes and sources.
11. Increased the number of Advanced Placement examinations receiving a grade of 3 or higher (per 1,000)? (1991, 1997)° 9 25 !! 55 85 !! 9-177 18-223 41 65
12. Increased the percentage of public secondary school teachers who hold • a degree in main teaching assignment? (1991, 1994) 62% 59% ## 66% 63% @@ 51-85% 50-81% 69% 64%• a teaching certificate in main teaching assignment? (1991, 1994) 99% 98% @@ 94% 93% @@ 91-100% 89-100% 98% 97%
13. Increased the percentage of public school teachers participating in professional development on 1 or more selected topics? (1994) 86% — 85% — 76-98% — 86% —
14. Increased the percentage of public school teachers with training to teach limited English-proficient students? (1994) 8% — 16% — 4-81% — 16% —
15. Increased the percentage of beginning public school teachers participating in a formal teacher induction program? (1991, 1994) 15% 13% ## 22% 27% !! 6-42% 7-48% 20% 23%
16. International comparisons in mathematics and science will be reported in future Goals Panel reports.∞ — — — — — — — —
SOUTH DAKOTA
GOAL 3
GOAL 4
GOAL 5
U.S.
baseline update progress?
South Dakota
baseline update progress?
Range of State Scores
baseline update
MedianScores†
baseline update
Student Achievement and Citizenship (continued)
Teacher Education and Professional Development
Mathematics and Science
Uses ofeducationaltechnology
One ormore topics
Methods ofteaching
subject fieldIn-depthstudy in
subject field
Studentassessment
0 20
40
60
80
10
0
20% 40% 60% 80% 100%0%
61%
55%
26%
45%
86%
Professional DevelopmentPercentage ofpublic schoolteachers partici-pating in profes-sional develop-ment on thefollowing topics,1994(Indicator 13)KEY
KEY
!! Significant progress
@@ Significant decline
## Change is not significant
Scorecards #2 (MO-VI) 10/30/97 11:58 AM Page 241

242
20. Increased adult literacy? (1992) — — 52% — 46-77% — 53% —21. Increased the percentage of U.S. citizens
• registered to vote? (1988, 1992) 80% 80% ## 70% 73% !! 58-95% 63-92% 71% 75%• voting? (1988, 1992) 72% 70% ## 61% 66% !! 50-74% 55-77% 62% 68%
22. Increased postsecondary enrollment? (1992, 1994) 53% 50% ❊ ** ** 33-68% 37-71% 53% 55%
SOUTH DAKOTA
† Median is the middle score in a set of ranked scores.— Data not available. See Appendix A.** Indicators are not the same at the national and state level.❊ Sample size does not permit a reliable estimate of change.See pages 72-75 for a Guide to Reading the State Pages.See Appendix C for technical notes and sources.
GOAL 5
GOAL 6
South Dakota
baseline update progress?
Range of State Scores
baseline update
MedianScores†
baseline update
U.S.
baseline update progress?
17. Increased the percentage of public school 8th graders whose mathematics teachers • have students work in small groups? (1996) — — 66% — 45-92% — 67% —• address Algebra and functions? (1996) — — 57% — 45-82% — 58% —• address reasoning and analytical ability? (1996) — — 52% — 39-64% — 48% —
18. Increased the percentage of public school 8th graders who have computers available in their mathematics classroom? (1996) — — 30% — 7-54% — 30% —
19. Increased mathematics and science degrees awarded to • all students? (1991, 1995) 44% 48% !! 39% 42% !! 25-49% 15-53% 39% 42%• minority (Black, Hispanic, American Indian/Alaskan Native) students? (1991, 1995) 30% 34% !! 39% 40% !! 22-64% 22-57% 39% 39%• female students? (1991, 1995) 36% 41% !! 35% 37% !! 23-46% 13-47% 33% 36%
Mathematics and Science (continued)
Adult Literacy and Lifelong Learning
KEY
KEY
!! Significant progress
@@ Significant decline
## Change is not significant
Scorecards #2 (MO-VI) 10/30/97 11:58 AM Page 242

243
† Median is the middle score in a set of ranked scores.** Indicators are not the same at the national and state level.— Data not available. See Appendix A.• Baseline years and most recent update years may differ by state
for this indicator. See Appendix C for more information.See pages 72-75 for a Guide to Reading the State Pages.See Appendix C for technical notes and sources.
23. Reduced marijuana use? (1991, 1995) • 10% 12% ## ** ** 4-18% 7-32% 10% 23%24. Reduced alcohol use (more than 5 drinks in a row)? (1991, 1995) • 41% 40% ## ** ** 17-43% 13-43% 30% 31%25. Reduced availability of drugs on school property? (1993, 1995) • 19% 29% @@ ** ** 11-31% 20-46% 22% 30%26. Reduced students threatened or injured with a weapon while on school property? (1993, 1995) • 6% 6% ## ** ** 6-15% 4-11% 8% 8%27. Reduced physical fights on school property? (1993, 1995) • 14% 14% ## ** ** 13-39% 12-19% 16% 15%28. Reduced students carrying weapons on school property? (1993, 1995) • 10% 11% ## ** ** 8-18% 7-14% 12% 11%29. Reduced students not feeling safe at school? (1993, 1995) • 3% 3% ## ** ** 3-23% 3-16% 6% 5%30. Reduced teacher victimization? (1994) 8% — 15% — 8-26% — 14% —31. Reduced student disruptions? (1991, 1994) 31% 40% @@ 37% 46% @@ 23-60% 33-65% 37% 47%
32. Decreased schools with minimal parental involvement• Teacher’s perspective? (1991, 1994) 18% 18% ## ** ** 9-44% 13-50% 23% 27%• Principal’s perspective? (1991, 1994) 10% 11% ## ** ** 4-22% 3-27% 13% 13%
33. Increased influence of parent associations? (1991, 1994) 15% 19% ## ** ** 8-37% 12-50% 16% 22%
SOUTH DAKOTA
GOAL 7
GOAL 8
U.S.
baseline update progress?
South Dakota
baseline update progress?
Range of State Scores
baseline update
MedianScores†
baseline update
Safe, Disciplined and Alcohol- and Drug-free Schools
Parental Participation
Usedmarijuana
Had 5 ormore drinks
in a row
Were offered, sold,or given an illegal drug
on school property
1
1
2
0% 20% 40% 60% 80% 100%
1991 1993 1995
12%
10%
41%
40%
19%
29%
ns
ns
Alcohol- andDrug-freeSchoolsPercentage ofpublic high schoolstudents whoreported the fol-lowing(Indicators 23,24, & 25)
1 During the past 30 days.2 During the past 12 months.nsInterpret with caution. Change was not statistically significant.
0% 20% 40% 60% 80% 100%
Establishingcurriculum
One ormore areas
Hiring newfull-timeteachers
Settingdiscipline
policy
1991 1994
15%
19%
5%
8%
3%
2%
14%
13%
ns
ns
ns
ns
Parent-SchoolPartnershipsPercentage of public school principals whoreported that theparent associationhas influence1 onthe following areas(Indicator 33)
1 On a 6-point scale from no influence to a great deal of influence, defined asa response to the top two points.
nsInterpret with caution. Change was not statistically significant.
KEY
KEY
!! Significant progress
@@ Significant decline
## Change is not significant
Scorecards #2 (MO-VI) 10/30/97 11:58 AM Page 243

244
8. Increased reading achievement in Grade 4? (1992, 1994) • 23% 27% ## 29% 30% ## 8-38% 8-41% 26% 27%9. Increased mathematics achievement •
• in Grade 4? (1992, 1996) 10% 17% !! 18% 21% !! 5-27% 3-31% 16% 20%• in Grade 8? (1992, 1996) 12% 15% ## 21% 24% ## 1-31% 5-34% 18% 22%
10. Increased science achievement in Grade 8? (1996) 22% — 29% — 5-41% — 27% —
TENNESSEE
† Median is the middle score in a set of ranked scores.* Comparable national data are not available.— Data not available. See Appendix A.• Baseline years and most recent update years may differ by state
for this indicator. See Appendix C for more information.See pages 72-75 for a Guide to Reading the State Pages.See Appendix C for technical notes and sources.
GOAL 1
GOAL 2
GOAL 3
Tennessee
baseline update progress?
Range of State Scores
baseline update
MedianScores†
baseline update
U.S.
baseline update progress?
1. Reduced percentage of infants born in the state with 1 or more health risks? (1990, 1995) 38% 38% ## 37% 34% !! 25-48% 24-46% 38% 35%2. Increased percentage of 2-year-olds immunized? (1994, 1996) 74% 79% ## 75% 78% !! 61-88% 64-88% 76% 79%3. Reduced number of infants (per 1,000) born with low birthweight? (1990, 1995) 82 87 @@ 70 73 @@ 48-151 53-134 71 754. Increased number of mothers (per 1,000) receiving early prenatal care? (1990, 1995) 776 828 !! 758 813 !! 469-868 560-900 778 8285. Increased number of children with disabilities in preschool (per 1,000)? (1991, 1996) 37 45 !! * * 16-68 16-92 38 47
6. Increased high school completion rate? (1990, 1995) 77% 83% !! 86% 86% ## 77-96% 79-96% 87% 88%7. Reduced high school dropout rate? (1992, 1994) • — — * * 3-12% 3-10% 5% 5%
Ready to Learn
School Completion
Student Achievement and Citizenship
19951990
83%
100%
80%
60%
40%
20%
0%
77%
High School CompletionPercentage of all18- to 24-year-olds1
who have a highschool credential2(Indicator 6)
1 Does not include those still in high school.2 Includes traditional high school diploma and alternative credential.
0%
20%
40%
60%
80%
100%
19951990
38% 38%
Children’sHealth IndexPercentage ofinfants born with 1or more healthrisks1 (Indicator 1)
1 Includes late (in third trimester) or no prenatal care, low maternal weightgain (less than 21 pounds), mother smoked during pregnancy, or motherdrank alcohol during pregnancy.
KEY
KEY
!! Significant progress
@@ Significant decline
## Change is not significant
Scorecards #2 (MO-VI) 10/30/97 11:58 AM Page 244

245
† Median is the middle score in a set of ranked scores.° See Table 8 for the numbers for each subject area.— Data not available. See Appendix A.∞ This information had not been released when the 1997 Goals Report
went to print.See pages 72-75 for a Guide to Reading the State Pages.See Appendix C for technical notes and sources.
11. Increased the number of Advanced Placement examinations receiving a grade of 3 or higher (per 1,000)? (1991, 1997)° 43 60 !! 55 85 !! 9-177 18-223 41 65
12. Increased the percentage of public secondary school teachers who hold • a degree in main teaching assignment? (1991, 1994) 59% 55% ## 66% 63% @@ 51-85% 50-81% 69% 64%• a teaching certificate in main teaching assignment? (1991, 1994) 99% 98% ## 94% 93% @@ 91-100% 89-100% 98% 97%
13. Increased the percentage of public school teachers participating in professional development on 1 or more selected topics? (1994) 87% — 85% — 76-98% — 86% —
14. Increased the percentage of public school teachers with training to teach limited English-proficient students? (1994) 8% — 16% — 4-81% — 16% —
15. Increased the percentage of beginning public school teachers participating in a formal teacher induction program? (1991, 1994) 23% 27% ## 22% 27% !! 6-42% 7-48% 20% 23%
16. International comparisons in mathematics and science will be reported in future Goals Panel reports.∞ — — — — — — — —
TENNESSEE
GOAL 3
GOAL 4
GOAL 5
U.S.
baseline update progress?
Tennessee
baseline update progress?
Range of State Scores
baseline update
MedianScores†
baseline update
Student Achievement and Citizenship (continued)
Teacher Education and Professional Development
Mathematics and Science
ReadingGrade 4
MathematicsGrade 4
1996199219941992
100%
80%
60%
40%
20%
0%
27%23%
10%17%
ns
Student AchievementPercentage of public school students who metthe Goals Panel’sperformancestandard1 in reading and mathematics (Indicators 8 & 9)
1 A complete description of the performance standard can be found inAppendix C.
nsInterpret with caution. Change was not statistically significant.
Uses ofeducationaltechnology
One ormore topics
Methods ofteaching
subject fieldIn-depthstudy in
subject field
Studentassessment
0 20
40
60
80
10
0
20% 40% 60% 80% 100%0%
56%
66%
25%
49%
87%
Professional DevelopmentPercentage ofpublic schoolteachers partici-pating in profes-sional develop-ment on thefollowing topics,1994(Indicator 13)KEY
KEY
!! Significant progress
@@ Significant decline
## Change is not significant
Scorecards #2 (MO-VI) 10/30/97 11:58 AM Page 245

246
20. Increased adult literacy? (1992) — — 52% — 46-77% — 53% —21. Increased the percentage of U.S. citizens
• registered to vote? (1988, 1992) 66% 65% ## 70% 73% !! 58-95% 63-92% 71% 75%• voting? (1988, 1992) 52% 56% ## 61% 66% !! 50-74% 55-77% 62% 68%
22. Increased postsecondary enrollment? (1992, 1994) 46% 54% ❊ ** ** 33-68% 37-71% 53% 55%
TENNESSEE
† Median is the middle score in a set of ranked scores.— Data not available. See Appendix A.** Indicators are not the same at the national and state level.❊ Sample size does not permit a reliable estimate of change.See pages 72-75 for a Guide to Reading the State Pages.See Appendix C for technical notes and sources.
GOAL 5
GOAL 6
Tennessee
baseline update progress?
Range of State Scores
baseline update
MedianScores†
baseline update
U.S.
baseline update progress?
17. Increased the percentage of public school 8th graders whose mathematics teachers • have students work in small groups? (1996) 56% — 66% — 45-92% — 67% —• address Algebra and functions? (1996) 46% — 57% — 45-82% — 58% —• address reasoning and analytical ability? (1996) 41% — 52% — 39-64% — 48% —
18. Increased the percentage of public school 8th graders who have computers available in their mathematics classroom? (1996) 54% — 30% — 7-54% — 30% —
19. Increased mathematics and science degrees awarded to • all students? (1991, 1995) 36% 43% !! 39% 42% !! 25-49% 15-53% 39% 42%• minority (Black, Hispanic, American Indian/Alaskan Native) students? (1991, 1995) 40% 43% !! 39% 40% !! 22-64% 22-57% 39% 39%• female students? (1991, 1995) 32% 38% !! 35% 37% !! 23-46% 13-47% 33% 36%
Mathematics and Science (continued)
Adult Literacy and Lifelong Learning
Addressreasoning & analytical
ability
AddressAlgebra and functions
Work insmall groups
or with apartner
0% 20% 40% 60% 80% 100%
56%
41%
46%
1
2
2
MathematicsInstructionPercentage ofpublic school 8thgraders whosemathematicsteachers do thefollowing, 1996(Indicator 17)
1 At least once a week.2 On a 4-point scale from “none” to “a lot,” defined as a response to the top point.
KEY
KEY
!! Significant progress
@@ Significant decline
## Change is not significant
Scorecards #2 (MO-VI) 10/30/97 11:58 AM Page 246

247
† Median is the middle score in a set of ranked scores.** Indicators are not the same at the national and state level.— Data not available. See Appendix A.• Baseline years and most recent update years may differ by state
for this indicator. See Appendix C for more information.See pages 72-75 for a Guide to Reading the State Pages.See Appendix C for technical notes and sources.
23. Reduced marijuana use? (1993) • 17% — ** ** 7-21% — 14% —24. Reduced alcohol use (more than 5 drinks in a row)? (1993) • 28% — ** ** 9-44% — 28% —25. Reduced availability of drugs on school property? (1993) • 22% — ** ** 11-31% — 22% —26. Reduced students threatened or injured with a weapon while on school property? (1993) • 9% — ** ** 6-15% — 8% —27. Reduced physical fights on school property? (1993) • 15% — ** ** 13-39% — 16% —28. Reduced students carrying weapons on school property? (1995) • 18% — ** ** 8-18% — 12% —29. Reduced students not feeling safe at school? (1995) • 4% — ** ** 3-23% — 6% —30. Reduced teacher victimization? (1994) 15% — 15% — 8-26% — 14% —31. Reduced student disruptions? (1991, 1994) 35% 48% @@ 37% 46% @@ 23-60% 33-65% 37% 47%
32. Decreased schools with minimal parental involvement• Teacher’s perspective? (1991, 1994) 29% 29% ## ** ** 9-44% 13-50% 23% 27%• Principal’s perspective? (1991, 1994) 18% 13% ## ** ** 4-22% 3-27% 13% 13%
33. Increased influence of parent associations? (1991, 1994) 16% 15% ## ** ** 8-37% 12-50% 16% 22%
TENNESSEE
GOAL 7
GOAL 8
U.S.
baseline update progress?
Tennessee
baseline update progress?
Range of State Scores
baseline update
MedianScores†
baseline update
Safe, Disciplined and Alcohol- and Drug-free Schools
Parental Participation
Usedmarijuana
Had 5 ormore drinks
in a row
Were offered, sold,or given an illegal drug
on school property
1
1
2
0% 20% 40% 60% 80% 100%
1993
17%
28%
22%
Alcohol- andDrug-freeSchoolsPercentage ofpublic high schoolstudents whoreported the fol-lowing(Indicators 23,24, & 25)
1 During the past 30 days.2 During the past 12 months.
0% 20% 40% 60% 80% 100%
Establishingcurriculum
One ormore areas
Hiring newfull-timeteachers
Settingdiscipline
policy
1991 1994
15%
16%
6%
6%
4%
3%
13%
10%
ns
ns
ns
Parent-SchoolPartnershipsPercentage of public school principals whoreported that theparent associationhas influence1 onthe following areas(Indicator 33)
1 On a 6-point scale from no influence to a great deal of influence, defined asa response to the top two points.
nsInterpret with caution. Change was not statistically significant.
KEY
KEY
!! Significant progress
@@ Significant decline
## Change is not significant
Scorecards #2 (MO-VI) 10/30/97 11:59 AM Page 247

248
8. Increased reading achievement in Grade 4? (1992, 1994) • 24% 26% ## 29% 30% ## 8-38% 8-41% 26% 27%9. Increased mathematics achievement •
• in Grade 4? (1992, 1996) 15% 25% !! 18% 21% !! 5-27% 3-31% 16% 20%• in Grade 8? (1990, 1996) 13% 21% !! 15% 24% !! 1-27% 5-34% 15% 22%
10. Increased science achievement in Grade 8? (1996) 23% — 29% — 5-41% — 27% —
TEXAS
† Median is the middle score in a set of ranked scores.* Comparable national data are not available.— Data not available. See Appendix A.• Baseline years and most recent update years may differ by state
for this indicator. See Appendix C for more information.See pages 72-75 for a Guide to Reading the State Pages.See Appendix C for technical notes and sources.
GOAL 1
GOAL 2
GOAL 3
Texas
baseline update progress?
Range of State Scores
baseline update
MedianScores†
baseline update
U.S.
baseline update progress?
1. Reduced percentage of infants born in the state with 1 or more health risks? (1990, 1995) 32% 29% !! 37% 34% !! 25-48% 24-46% 38% 35%2. Increased percentage of 2-year-olds immunized? (1994, 1996) 71% 74% ## 75% 78% !! 61-88% 64-88% 76% 79%3. Reduced number of infants (per 1,000) born with low birthweight? (1990, 1995) 69 71 @@ 70 73 @@ 48-151 53-134 71 754. Increased number of mothers (per 1,000) receiving early prenatal care? (1990, 1995) 683 773 !! 758 813 !! 469-868 560-900 778 8285. Increased number of children with disabilities in preschool (per 1,000)? (1991, 1996) 29 34 !! * * 16-68 16-92 38 47
6. Increased high school completion rate? (1990, 1995) 78% 79% ## 86% 86% ## 77-96% 79-96% 87% 88%7. Reduced high school dropout rate? (1992, 1994) • 5% 4% !! * * 3-12% 3-10% 5% 5%
Ready to Learn
School Completion
Student Achievement and Citizenship
19951990
79%
100%
80%
60%
40%
20%
0%
78%ns
High School CompletionPercentage of all18- to 24-year-olds1
who have a highschool credential2(Indicator 6)
1 Does not include those still in high school.2 Includes traditional high school diploma and alternative credential.nsInterpret with caution. Change was not statistically significant.
0%
20%
40%
60%
80%
100%
19951990
29%32%
Children’sHealth IndexPercentage ofinfants born with 1or more healthrisks1 (Indicator 1)
1 Includes late (in third trimester) or no prenatal care, low maternal weightgain (less than 21 pounds), mother smoked during pregnancy, or motherdrank alcohol during pregnancy.
KEY
KEY
!! Significant progress
@@ Significant decline
## Change is not significant
Scorecards #2 (MO-VI) 10/30/97 11:59 AM Page 248

249
† Median is the middle score in a set of ranked scores.° See Table 8 for the numbers for each subject area.— Data not available. See Appendix A.∞ This information had not been released when the 1997 Goals Report
went to print.See pages 72-75 for a Guide to Reading the State Pages.See Appendix C for technical notes and sources.
11. Increased the number of Advanced Placement examinations receiving a grade of 3 or higher (per 1,000)? (1991, 1997)° 34 78 !! 55 85 !! 9-177 18-223 41 65
12. Increased the percentage of public secondary school teachers who hold • a degree in main teaching assignment? (1991, 1994) 54% 51% ## 66% 63% @@ 51-85% 50-81% 69% 64%• a teaching certificate in main teaching assignment? (1991, 1994) 97% 96% ## 94% 93% @@ 91-100% 89-100% 98% 97%
13. Increased the percentage of public school teachers participating in professional development on 1 or more selected topics? (1994) 93% — 85% — 76-98% — 86% —
14. Increased the percentage of public school teachers with training to teach limited English-proficient students? (1994) 28% — 16% — 4-81% — 16% —
15. Increased the percentage of beginning public school teachers participating in a formal teacher induction program? (1991, 1994) 22% 30% !! 22% 27% !! 6-42% 7-48% 20% 23%
16. International comparisons in mathematics and science will be reported in future Goals Panel reports.∞ — — — — — — — —
TEXAS
GOAL 3
GOAL 4
GOAL 5
U.S.
baseline update progress?
Texas
baseline update progress?
Range of State Scores
baseline update
MedianScores†
baseline update
Student Achievement and Citizenship (continued)
Teacher Education and Professional Development
Mathematics and Science
ReadingGrade 4
MathematicsGrade 4
1996199219941992
100%
80%
60%
40%
20%
0%
26%24%
15%
25%ns
Student AchievementPercentage of public school students who metthe Goals Panel’sperformancestandard1 in reading and mathematics (Indicators 8 & 9)
1 A complete description of the performance standard can be found inAppendix C.
nsInterpret with caution. Change was not statistically significant.
Uses ofeducationaltechnology
One ormore topics
Methods ofteaching
subject fieldIn-depthstudy in
subject field
Studentassessment
0 20
40
60
80
10
0
20% 40% 60% 80% 100%0%
62%
75%
40%
57%
93%
Professional DevelopmentPercentage ofpublic schoolteachers partici-pating in profes-sional develop-ment on thefollowing topics,1994(Indicator 13)KEY
KEY
!! Significant progress
@@ Significant decline
## Change is not significant
Scorecards #2 (MO-VI) 10/30/97 11:59 AM Page 249

250
20. Increased adult literacy? (1992) 47% — 52% — 46-77% — 53% —21. Increased the percentage of U.S. citizens
• registered to vote? (1988, 1992) 71% 71% ## 70% 73% !! 58-95% 63-92% 71% 75%• voting? (1988, 1992) 58% 61% !! 61% 66% !! 50-74% 55-77% 62% 68%
22. Increased postsecondary enrollment? (1992, 1994) 52% 50% @@ ** ** 33-68% 37-71% 53% 55%
TEXAS
† Median is the middle score in a set of ranked scores.— Data not available. See Appendix A.** Indicators are not the same at the national and state level.See pages 72-75 for a Guide to Reading the State Pages.See Appendix C for technical notes and sources.
GOAL 5
GOAL 6
Texas
baseline update progress?
Range of State Scores
baseline update
MedianScores†
baseline update
U.S.
baseline update progress?
17. Increased the percentage of public school 8th graders whose mathematics teachers • have students work in small groups? (1996) 62% — 66% — 45-92% — 67% —• address Algebra and functions? (1996) 57% — 57% — 45-82% — 58% —• address reasoning and analytical ability? (1996) 59% — 52% — 39-64% — 48% —
18. Increased the percentage of public school 8th graders who have computers available in their mathematics classroom? (1996) 34% — 30% — 7-54% — 30% —
19. Increased mathematics and science degrees awarded to • all students? (1991, 1995) 34% 38% !! 39% 42% !! 25-49% 15-53% 39% 42%• minority (Black, Hispanic, American Indian/Alaskan Native) students? (1991, 1995) 35% 37% !! 39% 40% !! 22-64% 22-57% 39% 39%• female students? (1991, 1995) 29% 34% !! 35% 37% !! 23-46% 13-47% 33% 36%
Mathematics and Science (continued)
Adult Literacy and Lifelong Learning
Addressreasoning & analytical
ability
AddressAlgebra and functions
Work insmall groups
or with apartner
0% 20% 40% 60% 80% 100%
62%
59%
57%
1
2
2
MathematicsInstructionPercentage ofpublic school 8thgraders whosemathematicsteachers do thefollowing, 1996(Indicator 17)
1 At least once a week.2 On a 4-point scale from “none” to “a lot,” defined as a response to the top point.
53% 47%
3 highest levels2 lowest levels
Adult LiteracyPercentage ofadults who scoredat 3 highest levelsin Prose Literacy(Indicator 20)
KEY
KEY
!! Significant progress
@@ Significant decline
## Change is not significant
Scorecards #2 (MO-VI) 10/30/97 11:59 AM Page 250
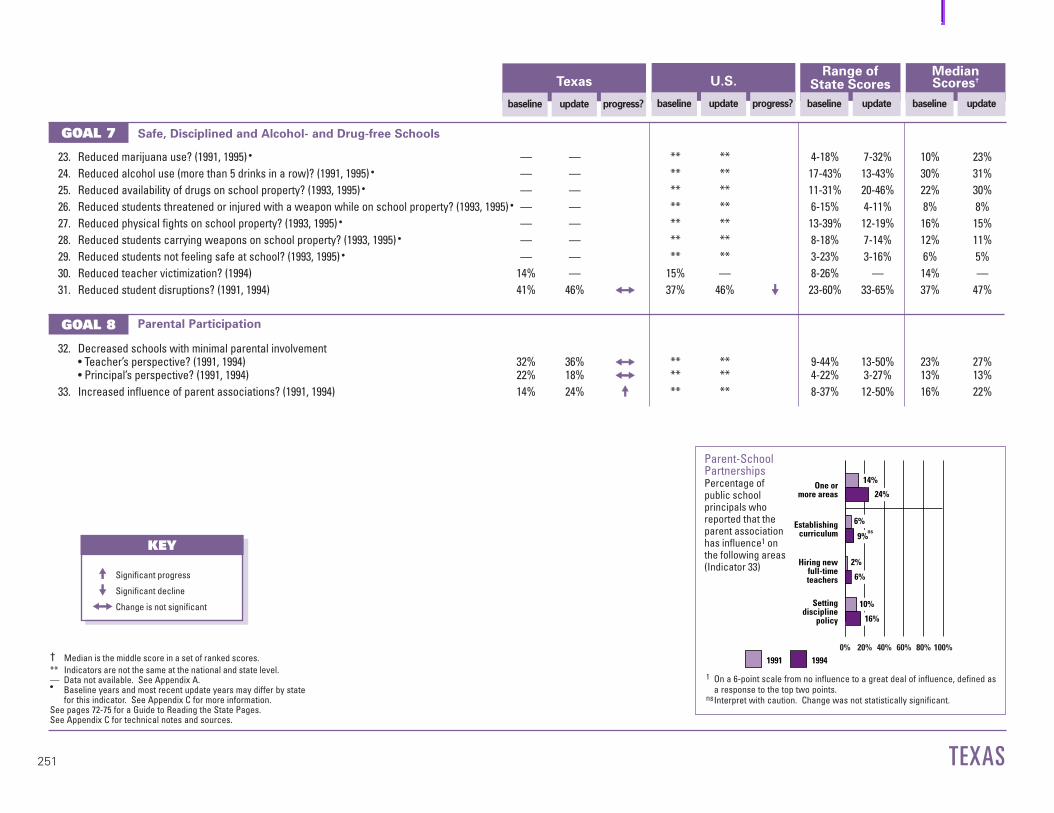
251
† Median is the middle score in a set of ranked scores.** Indicators are not the same at the national and state level.— Data not available. See Appendix A.• Baseline years and most recent update years may differ by state
for this indicator. See Appendix C for more information.See pages 72-75 for a Guide to Reading the State Pages.See Appendix C for technical notes and sources.
23. Reduced marijuana use? (1991, 1995) • — — ** ** 4-18% 7-32% 10% 23%24. Reduced alcohol use (more than 5 drinks in a row)? (1991, 1995) • — — ** ** 17-43% 13-43% 30% 31%25. Reduced availability of drugs on school property? (1993, 1995) • — — ** ** 11-31% 20-46% 22% 30%26. Reduced students threatened or injured with a weapon while on school property? (1993, 1995) • — — ** ** 6-15% 4-11% 8% 8%27. Reduced physical fights on school property? (1993, 1995) • — — ** ** 13-39% 12-19% 16% 15%28. Reduced students carrying weapons on school property? (1993, 1995) • — — ** ** 8-18% 7-14% 12% 11%29. Reduced students not feeling safe at school? (1993, 1995) • — — ** ** 3-23% 3-16% 6% 5%30. Reduced teacher victimization? (1994) 14% — 15% — 8-26% — 14% —31. Reduced student disruptions? (1991, 1994) 41% 46% ## 37% 46% @@ 23-60% 33-65% 37% 47%
32. Decreased schools with minimal parental involvement• Teacher’s perspective? (1991, 1994) 32% 36% ## ** ** 9-44% 13-50% 23% 27%• Principal’s perspective? (1991, 1994) 22% 18% ## ** ** 4-22% 3-27% 13% 13%
33. Increased influence of parent associations? (1991, 1994) 14% 24% !! ** ** 8-37% 12-50% 16% 22%
TEXAS
GOAL 7
GOAL 8
U.S.
baseline update progress?
Texas
baseline update progress?
Range of State Scores
baseline update
MedianScores†
baseline update
Safe, Disciplined and Alcohol- and Drug-free Schools
Parental Participation
0% 20% 40% 60% 80% 100%
Establishingcurriculum
One ormore areas
Hiring newfull-timeteachers
Settingdiscipline
policy
1991 1994
14%
24%
6%
9%
6%
2%
16%
10%
ns
Parent-SchoolPartnershipsPercentage of public school principals whoreported that theparent associationhas influence1 onthe following areas(Indicator 33)
1 On a 6-point scale from no influence to a great deal of influence, defined asa response to the top two points.
nsInterpret with caution. Change was not statistically significant.
KEY
KEY
!! Significant progress
@@ Significant decline
## Change is not significant
Scorecards #2 (MO-VI) 10/30/97 11:59 AM Page 251

252
8. Increased reading achievement in Grade 4? (1992, 1994) • 30% 30% ## 29% 30% ## 8-38% 8-41% 26% 27%9. Increased mathematics achievement •
• in Grade 4? (1992, 1996) 19% 23% ## 18% 21% !! 5-27% 3-31% 16% 20%• in Grade 8? (1992, 1996) 22% 24% ## 21% 24% ## 1-31% 5-34% 18% 22%
10. Increased science achievement in Grade 8? (1996) 32% — 29% — 5-41% — 27% —
UTAH
† Median is the middle score in a set of ranked scores.* Comparable national data are not available.— Data not available. See Appendix A.• Baseline years and most recent update years may differ by state
for this indicator. See Appendix C for more information.See pages 72-75 for a Guide to Reading the State Pages.See Appendix C for technical notes and sources.
GOAL 1
GOAL 2
GOAL 3
Utah
baseline update progress?
Range of State Scores
baseline update
MedianScores†
baseline update
U.S.
baseline update progress?
1. Reduced percentage of infants born in the state with 1 or more health risks? (1990, 1995) 29% 30% ## 37% 34% !! 25-48% 24-46% 38% 35%2. Increased percentage of 2-year-olds immunized? (1994, 1996) 70% 64% ## 75% 78% !! 61-88% 64-88% 76% 79%3. Reduced number of infants (per 1,000) born with low birthweight? (1990, 1995) 57 63 @@ 70 73 @@ 48-151 53-134 71 754. Increased number of mothers (per 1,000) receiving early prenatal care? (1990, 1995) 842 843 !! 758 813 !! 469-868 560-900 778 8285. Increased number of children with disabilities in preschool (per 1,000)? (1991, 1996) 33 44 !! * * 16-68 16-92 38 47
6. Increased high school completion rate? (1990, 1995) 94% 91% ## 86% 86% ## 77-96% 79-96% 87% 88%7. Reduced high school dropout rate? (1992, 1994) • — — * * 3-12% 3-10% 5% 5%
Ready to Learn
School Completion
Student Achievement and Citizenship
19951990
91%100%
80%
60%
40%
20%
0%
94% ns
High School CompletionPercentage of all18- to 24-year-olds1
who have a highschool credential2(Indicator 6)
1 Does not include those still in high school.2 Includes traditional high school diploma and alternative credential.nsInterpret with caution. Change was not statistically significant.
0%
20%
40%
60%
80%
100%
19951990
30%29%ns
Children’sHealth IndexPercentage ofinfants born with 1or more healthrisks1 (Indicator 1)
1 Includes late (in third trimester) or no prenatal care, low maternal weightgain (less than 21 pounds), mother smoked during pregnancy, or motherdrank alcohol during pregnancy.
nsInterpret with caution. Change was not statistically significant.
KEY
KEY
!! Significant progress
@@ Significant decline
## Change is not significant
Scorecards #2 (MO-VI) 10/30/97 11:59 AM Page 252

253
† Median is the middle score in a set of ranked scores.° See Table 8 for the numbers for each subject area.— Data not available. See Appendix A.∞ This information had not been released when the 1997 Goals Report
went to print.See pages 72-75 for a Guide to Reading the State Pages.See Appendix C for technical notes and sources.
11. Increased the number of Advanced Placement examinations receiving a grade of 3 or higher (per 1,000)? (1991, 1997)° 132 152 !! 55 85 !! 9-177 18-223 41 65
12. Increased the percentage of public secondary school teachers who hold • a degree in main teaching assignment? (1991, 1994) 68% 62% @@ 66% 63% @@ 51-85% 50-81% 69% 64%• a teaching certificate in main teaching assignment? (1991, 1994) 99% 97% @@ 94% 93% @@ 91-100% 89-100% 98% 97%
13. Increased the percentage of public school teachers participating in professional development on 1 or more selected topics? (1994) 87% — 85% — 76-98% — 86% —
14. Increased the percentage of public school teachers with training to teach limited English-proficient students? (1994) 12% — 16% — 4-81% — 16% —
15. Increased the percentage of beginning public school teachers participating in a formal teacher induction program? (1991, 1994) 32% 40% !! 22% 27% !! 6-42% 7-48% 20% 23%
16. International comparisons in mathematics and science will be reported in future Goals Panel reports.∞ — — — — — — — —
UTAH
GOAL 3
GOAL 4
GOAL 5
U.S.
baseline update progress?
Utah
baseline update progress?
Range of State Scores
baseline update
MedianScores†
baseline update
Student Achievement and Citizenship (continued)
Teacher Education and Professional Development
Mathematics and Science
ReadingGrade 4
MathematicsGrade 4
1996199219941992
100%
80%
60%
40%
20%
0%
30% 30%
19%23%ns
Student AchievementPercentage of public school students who metthe Goals Panel’sperformancestandard1 in reading and mathematics (Indicators 8 & 9)
1 A complete description of the performance standard can be found inAppendix C.
nsInterpret with caution. Change was not statistically significant.
Uses ofeducationaltechnology
One ormore topics
Methods ofteaching
subject fieldIn-depthstudy in
subject field
Studentassessment
0 20
40
60
80
10
0
20% 40% 60% 80% 100%0%
59%
65%
35%
43%
87%
Professional DevelopmentPercentage ofpublic schoolteachers partici-pating in profes-sional develop-ment on thefollowing topics,1994(Indicator 13)KEY
KEY
!! Significant progress
@@ Significant decline
## Change is not significant
Scorecards #2 (MO-VI) 10/30/97 11:59 AM Page 253

254
20. Increased adult literacy? (1992) — — 52% — 46-77% — 53% —21. Increased the percentage of U.S. citizens
• registered to vote? (1988, 1992) 78% 81% ## 70% 73% !! 58-95% 63-92% 71% 75%• voting? (1988, 1992) 72% 74% ## 61% 66% !! 50-74% 55-77% 62% 68%
22. Increased postsecondary enrollment? (1992, 1994) 51% 56% ❊ ** ** 33-68% 37-71% 53% 55%
UTAH
† Median is the middle score in a set of ranked scores.— Data not available. See Appendix A.** Indicators are not the same at the national and state level.❊ Sample size does not permit a reliable estimate of change.See pages 72-75 for a Guide to Reading the State Pages.See Appendix C for technical notes and sources.
GOAL 5
GOAL 6
Utah
baseline update progress?
Range of State Scores
baseline update
MedianScores†
baseline update
U.S.
baseline update progress?
17. Increased the percentage of public school 8th graders whose mathematics teachers • have students work in small groups? (1996) 69% — 66% — 45-92% — 67% —• address Algebra and functions? (1996) 71% — 57% — 45-82% — 58% —• address reasoning and analytical ability? (1996) 44% — 52% — 39-64% — 48% —
18. Increased the percentage of public school 8th graders who have computers available in their mathematics classroom? (1996) 24% — 30% — 7-54% — 30% —
19. Increased mathematics and science degrees awarded to • all students? (1991, 1995) 41% 43% !! 39% 42% !! 25-49% 15-53% 39% 42%• minority (Black, Hispanic, American Indian/Alaskan Native) students? (1991, 1995) 47% 49% !! 39% 40% !! 22-64% 22-57% 39% 39%• female students? (1991, 1995) 32% 30% @@ 35% 37% !! 23-46% 13-47% 33% 36%
Mathematics and Science (continued)
Adult Literacy and Lifelong Learning
Addressreasoning & analytical
ability
AddressAlgebra and functions
Work insmall groups
or with apartner
0% 20% 40% 60% 80% 100%
69%
44%
71%
1
2
2
MathematicsInstructionPercentage ofpublic school 8thgraders whosemathematicsteachers do thefollowing, 1996(Indicator 17)
1 At least once a week.2 On a 4-point scale from “none” to “a lot,” defined as a response to the top point.
KEY
KEY
!! Significant progress
@@ Significant decline
## Change is not significant
Scorecards #2 (MO-VI) 10/30/97 11:59 AM Page 254

255
† Median is the middle score in a set of ranked scores.** Indicators are not the same at the national and state level.— Data not available. See Appendix A.• Baseline years and most recent update years may differ by state
for this indicator. See Appendix C for more information.See pages 72-75 for a Guide to Reading the State Pages.See Appendix C for technical notes and sources.
23. Reduced marijuana use? (1991, 1995) • 9% 12% ## ** ** 4-18% 7-32% 10% 23%24. Reduced alcohol use (more than 5 drinks in a row)? (1991, 1995) • 17% 15% ## ** ** 17-43% 13-43% 30% 31%25. Reduced availability of drugs on school property? (1993, 1995) • 19% 26% @@ ** ** 11-31% 20-46% 22% 30%26. Reduced students threatened or injured with a weapon while on school property? (1993, 1995) • 8% 7% ## ** ** 6-15% 4-11% 8% 8%27. Reduced physical fights on school property? (1993, 1995) • 15% 13% ## ** ** 13-39% 12-19% 16% 15%28. Reduced students carrying weapons on school property? (1993, 1995) • 11% 11% ## ** ** 8-18% 7-14% 12% 11%29. Reduced students not feeling safe at school? (1993, 1995) • 6% 4% ## ** ** 3-23% 3-16% 6% 5%30. Reduced teacher victimization? (1994) 16% — 15% — 8-26% — 14% —31. Reduced student disruptions? (1991, 1994) 33% 54% @@ 37% 46% @@ 23-60% 33-65% 37% 47%
32. Decreased schools with minimal parental involvement• Teacher’s perspective? (1991, 1994) 18% 19% ## ** ** 9-44% 13-50% 23% 27%• Principal’s perspective? (1991, 1994) 13% 14% ## ** ** 4-22% 3-27% 13% 13%
33. Increased influence of parent associations? (1991, 1994) 17% 33% !! ** ** 8-37% 12-50% 16% 22%
UTAH
GOAL 7
GOAL 8
U.S.
baseline update progress?
Utah
baseline update progress?
Range of State Scores
baseline update
MedianScores†
baseline update
Safe, Disciplined and Alcohol- and Drug-free Schools
Parental Participation
Usedmarijuana
Had 5 ormore drinks
in a row
Were offered, sold,or given an illegal drug
on school property
1
1
2
0% 20% 40% 60% 80% 100%
1991 1993 1995
9%
12%
17%
15%
19%
26%
ns
ns
Alcohol- andDrug-freeSchoolsPercentage ofpublic high schoolstudents whoreported the fol-lowing(Indicators 23,24, & 25)
1 During the past 30 days.2 During the past 12 months.nsInterpret with caution. Change was not statistically significant.
0% 20% 40% 60% 80% 100%
Establishingcurriculum
One ormore areas
Hiring newfull-timeteachers
Settingdiscipline
policy
1991 1994
17%
33%
5%
10%
6%
2%
29%
14%
ns
Parent-SchoolPartnershipsPercentage of public school principals whoreported that theparent associationhas influence1 onthe following areas(Indicator 33)
1 On a 6-point scale from no influence to a great deal of influence, defined asa response to the top two points.
nsInterpret with caution. Change was not statistically significant.
KEY
KEY
!! Significant progress
@@ Significant decline
## Change is not significant
Scorecards #2 (MO-VI) 10/30/97 11:59 AM Page 255
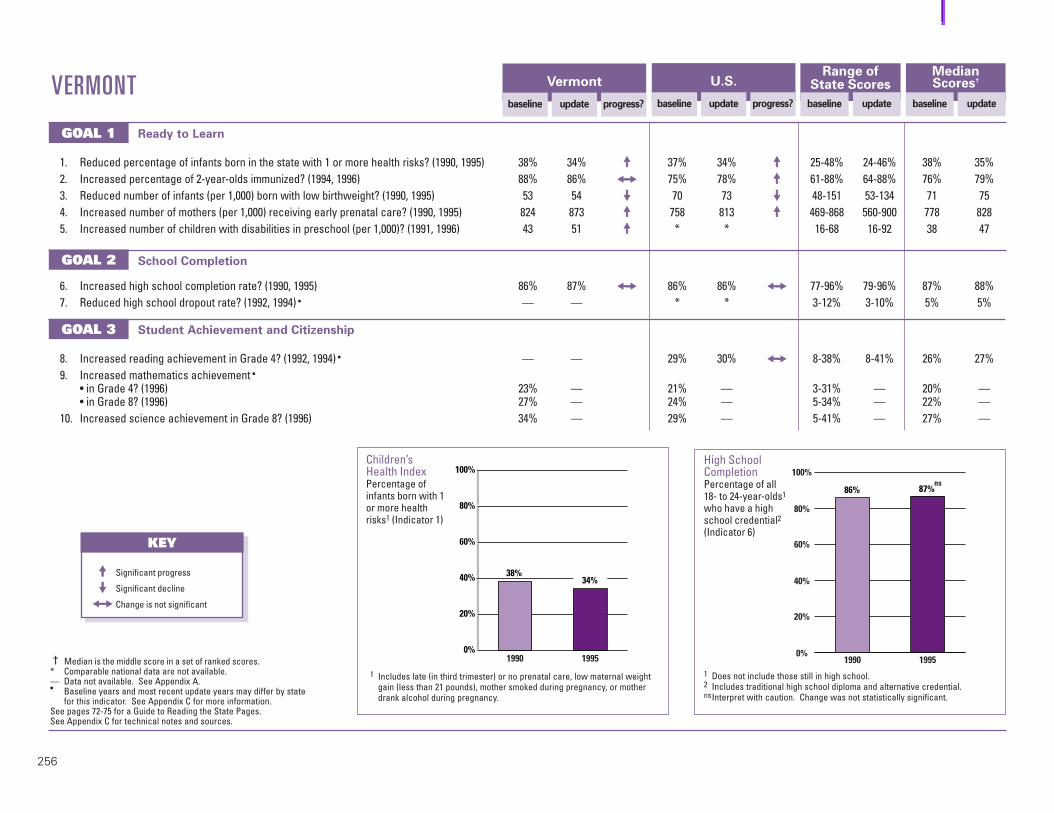
256
8. Increased reading achievement in Grade 4? (1992, 1994) • — — 29% 30% ## 8-38% 8-41% 26% 27%9. Increased mathematics achievement •
• in Grade 4? (1996) 23% — 21% — 3-31% — 20% —• in Grade 8? (1996) 27% — 24% — 5-34% — 22% —
10. Increased science achievement in Grade 8? (1996) 34% — 29% — 5-41% — 27% —
VERMONT
† Median is the middle score in a set of ranked scores.* Comparable national data are not available.— Data not available. See Appendix A.• Baseline years and most recent update years may differ by state
for this indicator. See Appendix C for more information.See pages 72-75 for a Guide to Reading the State Pages.See Appendix C for technical notes and sources.
GOAL 1
GOAL 2
GOAL 3
Vermont
baseline update progress?
Range of State Scores
baseline update
MedianScores†
baseline update
U.S.
baseline update progress?
1. Reduced percentage of infants born in the state with 1 or more health risks? (1990, 1995) 38% 34% !! 37% 34% !! 25-48% 24-46% 38% 35%2. Increased percentage of 2-year-olds immunized? (1994, 1996) 88% 86% ## 75% 78% !! 61-88% 64-88% 76% 79%3. Reduced number of infants (per 1,000) born with low birthweight? (1990, 1995) 53 54 @@ 70 73 @@ 48-151 53-134 71 754. Increased number of mothers (per 1,000) receiving early prenatal care? (1990, 1995) 824 873 !! 758 813 !! 469-868 560-900 778 8285. Increased number of children with disabilities in preschool (per 1,000)? (1991, 1996) 43 51 !! * * 16-68 16-92 38 47
6. Increased high school completion rate? (1990, 1995) 86% 87% ## 86% 86% ## 77-96% 79-96% 87% 88%7. Reduced high school dropout rate? (1992, 1994) • — — * * 3-12% 3-10% 5% 5%
Ready to Learn
School Completion
Student Achievement and Citizenship
19951990
87%
100%
80%
60%
40%
20%
0%
86%ns
High School CompletionPercentage of all18- to 24-year-olds1
who have a highschool credential2(Indicator 6)
1 Does not include those still in high school.2 Includes traditional high school diploma and alternative credential.nsInterpret with caution. Change was not statistically significant.
0%
20%
40%
60%
80%
100%
19951990
34%38%
Children’sHealth IndexPercentage ofinfants born with 1or more healthrisks1 (Indicator 1)
1 Includes late (in third trimester) or no prenatal care, low maternal weightgain (less than 21 pounds), mother smoked during pregnancy, or motherdrank alcohol during pregnancy.
KEY
KEY
!! Significant progress
@@ Significant decline
## Change is not significant
Scorecards #2 (MO-VI) 10/30/97 11:59 AM Page 256

257
† Median is the middle score in a set of ranked scores.° See Table 8 for the numbers for each subject area.— Data not available. See Appendix A.∞ This information had not been released when the 1997 Goals Report
went to print.See pages 72-75 for a Guide to Reading the State Pages.See Appendix C for technical notes and sources.
11. Increased the number of Advanced Placement examinations receiving a grade of 3 or higher (per 1,000)? (1991, 1997)° 51 68 !! 55 85 !! 9-177 18-223 41 65
12. Increased the percentage of public secondary school teachers who hold • a degree in main teaching assignment? (1991, 1994) 71% 73% ## 66% 63% @@ 51-85% 50-81% 69% 64%• a teaching certificate in main teaching assignment? (1991, 1994) 99% 98% ## 94% 93% @@ 91-100% 89-100% 98% 97%
13. Increased the percentage of public school teachers participating in professional development on 1 or more selected topics? (1994) 89% — 85% — 76-98% — 86% —
14. Increased the percentage of public school teachers with training to teach limited English-proficient students? (1994) 23% — 16% — 4-81% — 16% —
15. Increased the percentage of beginning public school teachers participating in a formal teacher induction program? (1991, 1994) 12% 12% ## 22% 27% !! 6-42% 7-48% 20% 23%
16. International comparisons in mathematics and science will be reported in future Goals Panel reports.∞ — — — — — — — —
VERMONT
GOAL 3
GOAL 4
GOAL 5
U.S.
baseline update progress?
Vermont
baseline update progress?
Range of State Scores
baseline update
MedianScores†
baseline update
Student Achievement and Citizenship (continued)
Teacher Education and Professional Development
Mathematics and Science
MathematicsGrade 4
1996199619941992
100%
80%
60%
40%
20%
0%
23%
Student AchievementPercentage of public school students who metthe Goals Panel’sperformancestandard1 in reading and mathematics (Indicators 8 & 9)
1 A complete description of the performance standard can be found inAppendix C.
Uses ofeducationaltechnology
One ormore topics
Methods ofteaching
subject fieldIn-depthstudy in
subject field
Studentassessment
0 20
40
60
80
10
0
20% 40% 60% 80% 100%0%
52%
62%
33%
51%
89%
Professional DevelopmentPercentage ofpublic schoolteachers partici-pating in profes-sional develop-ment on thefollowing topics,1994(Indicator 13)KEY
KEY
!! Significant progress
@@ Significant decline
## Change is not significant
Scorecards #2 (MO-VI) 10/30/97 11:59 AM Page 257

258
20. Increased adult literacy? (1992) — — 52% — 46-77% — 53% —21. Increased the percentage of U.S. citizens
• registered to vote? (1988, 1992) 79% 79% ## 70% 73% !! 58-95% 63-92% 71% 75%• voting? (1988, 1992) 65% 71% !! 61% 66% !! 50-74% 55-77% 62% 68%
22. Increased postsecondary enrollment? (1992, 1994) 54% 51% ❊ ** ** 33-68% 37-71% 53% 55%
VERMONT
† Median is the middle score in a set of ranked scores.— Data not available. See Appendix A.** Indicators are not the same at the national and state level.❊ Sample size does not permit a reliable estimate of change.See pages 72-75 for a Guide to Reading the State Pages.See Appendix C for technical notes and sources.
GOAL 5
GOAL 6
Vermont
baseline update progress?
Range of State Scores
baseline update
MedianScores†
baseline update
U.S.
baseline update progress?
17. Increased the percentage of public school 8th graders whose mathematics teachers • have students work in small groups? (1996) 68% — 66% — 45-92% — 67% —• address Algebra and functions? (1996) 56% — 57% — 45-82% — 58% —• address reasoning and analytical ability? (1996) 57% — 52% — 39-64% — 48% —
18. Increased the percentage of public school 8th graders who have computers available in their mathematics classroom? (1996) 44% — 30% — 7-54% — 30% —
19. Increased mathematics and science degrees awarded to • all students? (1991, 1995) 44% 47% !! 39% 42% !! 25-49% 15-53% 39% 42%• minority (Black, Hispanic, American Indian/Alaskan Native) students? (1991, 1995) 43% 48% !! 39% 40% !! 22-64% 22-57% 39% 39%• female students? (1991, 1995) 40% 42% !! 35% 37% !! 23-46% 13-47% 33% 36%
Mathematics and Science (continued)
Adult Literacy and Lifelong Learning
Addressreasoning & analytical
ability
AddressAlgebra and functions
Work insmall groups
or with apartner
0% 20% 40% 60% 80% 100%
68%
57%
56%
1
2
2
MathematicsInstructionPercentage ofpublic school 8thgraders whosemathematicsteachers do thefollowing, 1996(Indicator 17)
1 At least once a week.2 On a 4-point scale from “none” to “a lot,” defined as a response to the top point.
KEY
KEY
!! Significant progress
@@ Significant decline
## Change is not significant
Scorecards #2 (MO-VI) 10/30/97 11:59 AM Page 258

259
† Median is the middle score in a set of ranked scores.** Indicators are not the same at the national and state level.— Data not available. See Appendix A.• Baseline years and most recent update years may differ by state
for this indicator. See Appendix C for more information.See pages 72-75 for a Guide to Reading the State Pages.See Appendix C for technical notes and sources.
23. Reduced marijuana use? (1993, 1995) • 19% 29% @@ ** ** 7-21% 7-32% 14% 23%24. Reduced alcohol use (more than 5 drinks in a row)? (1993, 1995) • 31% 32% ## ** ** 9-44% 13-43% 28% 31%25. Reduced availability of drugs on school property? (1995) • 35% — ** ** 20-46% — 30% —26. Reduced students threatened or injured with a weapon while on school property? (1995) • 7% — ** ** 4-11% — 8% —27. Reduced physical fights on school property? (1995) • 18% — ** ** 12-19% — 15% —28. Reduced students carrying weapons on school property? (1995) • 12% — ** ** 7-14% — 11% —29. Reduced students not feeling safe at school? (1993, 1995) • 4% 4% ## ** ** 3-23% 3-16% 6% 5%30. Reduced teacher victimization? (1994) 15% — 15% — 8-26% — 14% —31. Reduced student disruptions? (1991, 1994) 27% 44% @@ 37% 46% @@ 23-60% 33-65% 37% 47%
32. Decreased schools with minimal parental involvement• Teacher’s perspective? (1991, 1994) 10% 17% @@ ** ** 9-44% 13-50% 23% 27%• Principal’s perspective? (1991, 1994) 10% 6% ## ** ** 4-22% 3-27% 13% 13%
33. Increased influence of parent associations? (1991, 1994) 8% 24% !! ** ** 8-37% 12-50% 16% 22%
VERMONT
GOAL 7
GOAL 8
U.S.
baseline update progress?
Vermont
baseline update progress?
Range of State Scores
baseline update
MedianScores†
baseline update
Safe, Disciplined and Alcohol- and Drug-free Schools
Parental Participation
Usedmarijuana
Had 5 ormore drinks
in a row
Were offered, sold,or given an illegal drug
on school property
1
1
2
0% 20% 40% 60% 80% 100%
1993 1995
29%
19%
31%
32%
35%
ns
Alcohol- andDrug-freeSchoolsPercentage ofpublic high schoolstudents whoreported the fol-lowing(Indicators 23,24, & 25)
1 During the past 30 days.2 During the past 12 months.nsInterpret with caution. Change was not statistically significant.
0% 20% 40% 60% 80% 100%
Establishingcurriculum
One ormore areas
Hiring newfull-timeteachers
Settingdiscipline
policy
1991 1994
8%
24%
3%
7%
12%
13%
5%
ns
Parent-SchoolPartnershipsPercentage of public school principals whoreported that theparent associationhas influence1 onthe following areas(Indicator 33)
1 On a 6-point scale from no influence to a great deal of influence, defined asa response to the top two points.
nsInterpret with caution. Change was not statistically significant.
KEY
KEY
!! Significant progress
@@ Significant decline
## Change is not significant
Scorecards #2 (MO-VI) 10/30/97 11:59 AM Page 259

260
8. Increased reading achievement in Grade 4? (1992, 1994) • 31% 26% ## 29% 30% ## 8-38% 8-41% 26% 27%9. Increased mathematics achievement •
• in Grade 4? (1992, 1996) 19% 19% ## 18% 21% !! 5-27% 3-31% 16% 20%• in Grade 8? (1990, 1996) 17% 21% ## 15% 24% !! 1-27% 5-34% 15% 22%
10. Increased science achievement in Grade 8? (1996) 27% — 29% — 5-41% — 27% —
VIRGINIA
† Median is the middle score in a set of ranked scores.* Comparable national data are not available.— Data not available. See Appendix A.• Baseline years and most recent update years may differ by state
for this indicator. See Appendix C for more information.See pages 72-75 for a Guide to Reading the State Pages.See Appendix C for technical notes and sources.
GOAL 1
GOAL 2
GOAL 3
Virginia
baseline update progress?
Range of State Scores
baseline update
MedianScores†
baseline update
U.S.
baseline update progress?
1. Reduced percentage of infants born in the state with 1 or more health risks? (1990, 1995) 35% 32% !! 37% 34% !! 25-48% 24-46% 38% 35%2. Increased percentage of 2-year-olds immunized? (1994, 1996) 81% 78% ## 75% 78% !! 61-88% 64-88% 76% 79%3. Reduced number of infants (per 1,000) born with low birthweight? (1990, 1995) 72 77 @@ 70 73 @@ 48-151 53-134 71 754. Increased number of mothers (per 1,000) receiving early prenatal care? (1990, 1995) 800 838 !! 758 813 !! 469-868 560-900 778 8285. Increased number of children with disabilities in preschool (per 1,000)? (1991, 1996) 38 47 !! * * 16-68 16-92 38 47
6. Increased high school completion rate? (1990, 1995) 87% 87% ## 86% 86% ## 77-96% 79-96% 87% 88%7. Reduced high school dropout rate? (1992, 1994) • — — * * 3-12% 3-10% 5% 5%
Ready to Learn
School Completion
Student Achievement and Citizenship
19951990
87%
100%
80%
60%
40%
20%
0%
87%
High School CompletionPercentage of all18- to 24-year-olds1
who have a highschool credential2(Indicator 6)
1 Does not include those still in high school.2 Includes traditional high school diploma and alternative credential.
0%
20%
40%
60%
80%
100%
19951990
32%35%
Children’sHealth IndexPercentage ofinfants born with 1or more healthrisks1 (Indicator 1)
1 Includes late (in third trimester) or no prenatal care, low maternal weightgain (less than 21 pounds), mother smoked during pregnancy, or motherdrank alcohol during pregnancy.
KEY
KEY
!! Significant progress
@@ Significant decline
## Change is not significant
Scorecards #2 (MO-VI) 10/30/97 11:59 AM Page 260

261
† Median is the middle score in a set of ranked scores.° See Table 8 for the numbers for each subject area.— Data not available. See Appendix A.∞ This information had not been released when the 1997 Goals Report
went to print.See pages 72-75 for a Guide to Reading the State Pages.See Appendix C for technical notes and sources.
11. Increased the number of Advanced Placement examinations receiving a grade of 3 or higher (per 1,000)? (1991, 1997)° 102 150 !! 55 85 !! 9-177 18-223 41 65
12. Increased the percentage of public secondary school teachers who hold • a degree in main teaching assignment? (1991, 1994) 72% 61% @@ 66% 63% @@ 51-85% 50-81% 69% 64%• a teaching certificate in main teaching assignment? (1991, 1994) 97% 96% ## 94% 93% @@ 91-100% 89-100% 98% 97%
13. Increased the percentage of public school teachers participating in professional development on 1 or more selected topics? (1994) 85% — 85% — 76-98% — 86% —
14. Increased the percentage of public school teachers with training to teach limited English-proficient students? (1994) 11% — 16% — 4-81% — 16% —
15. Increased the percentage of beginning public school teachers participating in a formal teacher induction program? (1991, 1994) 21% 30% !! 22% 27% !! 6-42% 7-48% 20% 23%
16. International comparisons in mathematics and science will be reported in future Goals Panel reports.∞ — — — — — — — —
VIRGINIA
GOAL 3
GOAL 4
GOAL 5
U.S.
baseline update progress?
Virginia
baseline update progress?
Range of State Scores
baseline update
MedianScores†
baseline update
Student Achievement and Citizenship (continued)
Teacher Education and Professional Development
Mathematics and Science
ReadingGrade 4
MathematicsGrade 4
1996199219941992
100%
80%
60%
40%
20%
0%
31%26%
19% 19%
ns
Student AchievementPercentage of public school students who metthe Goals Panel’sperformancestandard1 in reading and mathematics (Indicators 8 & 9)
1 A complete description of the performance standard can be found inAppendix C.
nsInterpret with caution. Change was not statistically significant.
Uses ofeducationaltechnology
One ormore topics
Methods ofteaching
subject fieldIn-depthstudy in
subject field
Studentassessment
0 20
40
60
80
10
0
20% 40% 60% 80% 100%0%
51%
63%
29%
47%
85%
Professional DevelopmentPercentage ofpublic schoolteachers partici-pating in profes-sional develop-ment on thefollowing topics,1994(Indicator 13)KEY
KEY
!! Significant progress
@@ Significant decline
## Change is not significant
Scorecards #2 (MO-VI) 10/30/97 11:59 AM Page 261

262
20. Increased adult literacy? (1992) — — 52% — 46-77% — 53% —21. Increased the percentage of U.S. citizens
• registered to vote? (1988, 1992) 69% 68% ## 70% 73% !! 58-95% 63-92% 71% 75%• voting? (1988, 1992) 60% 64% ## 61% 66% !! 50-74% 55-77% 62% 68%
22. Increased postsecondary enrollment? (1992, 1994) 51% 53% ❊ ** ** 33-68% 37-71% 53% 55%
VIRGINIA
† Median is the middle score in a set of ranked scores.— Data not available. See Appendix A.** Indicators are not the same at the national and state level.❊ Sample size does not permit a reliable estimate of change.See pages 72-75 for a Guide to Reading the State Pages.See Appendix C for technical notes and sources.
GOAL 5
GOAL 6
Virginia
baseline update progress?
Range of State Scores
baseline update
MedianScores†
baseline update
U.S.
baseline update progress?
17. Increased the percentage of public school 8th graders whose mathematics teachers • have students work in small groups? (1996) 64% — 66% — 45-92% — 67% —• address Algebra and functions? (1996) 73% — 57% — 45-82% — 58% —• address reasoning and analytical ability? (1996) 48% — 52% — 39-64% — 48% —
18. Increased the percentage of public school 8th graders who have computers available in their mathematics classroom? (1996) 29% — 30% — 7-54% — 30% —
19. Increased mathematics and science degrees awarded to • all students? (1991, 1995) 44% 50% !! 39% 42% !! 25-49% 15-53% 39% 42%• minority (Black, Hispanic, American Indian/Alaskan Native) students? (1991, 1995) 41% 46% !! 39% 40% !! 22-64% 22-57% 39% 39%• female students? (1991, 1995) 39% 46% !! 35% 37% !! 23-46% 13-47% 33% 36%
Mathematics and Science (continued)
Adult Literacy and Lifelong Learning
Addressreasoning & analytical
ability
AddressAlgebra and functions
Work insmall groups
or with apartner
0% 20% 40% 60% 80% 100%
64%
48%
73%
1
2
2
MathematicsInstructionPercentage ofpublic school 8thgraders whosemathematicsteachers do thefollowing, 1996(Indicator 17)
1 At least once a week.2 On a 4-point scale from “none” to “a lot,” defined as a response to the top point.
KEY
KEY
!! Significant progress
@@ Significant decline
## Change is not significant
Scorecards #2 (MO-VI) 10/30/97 11:59 AM Page 262
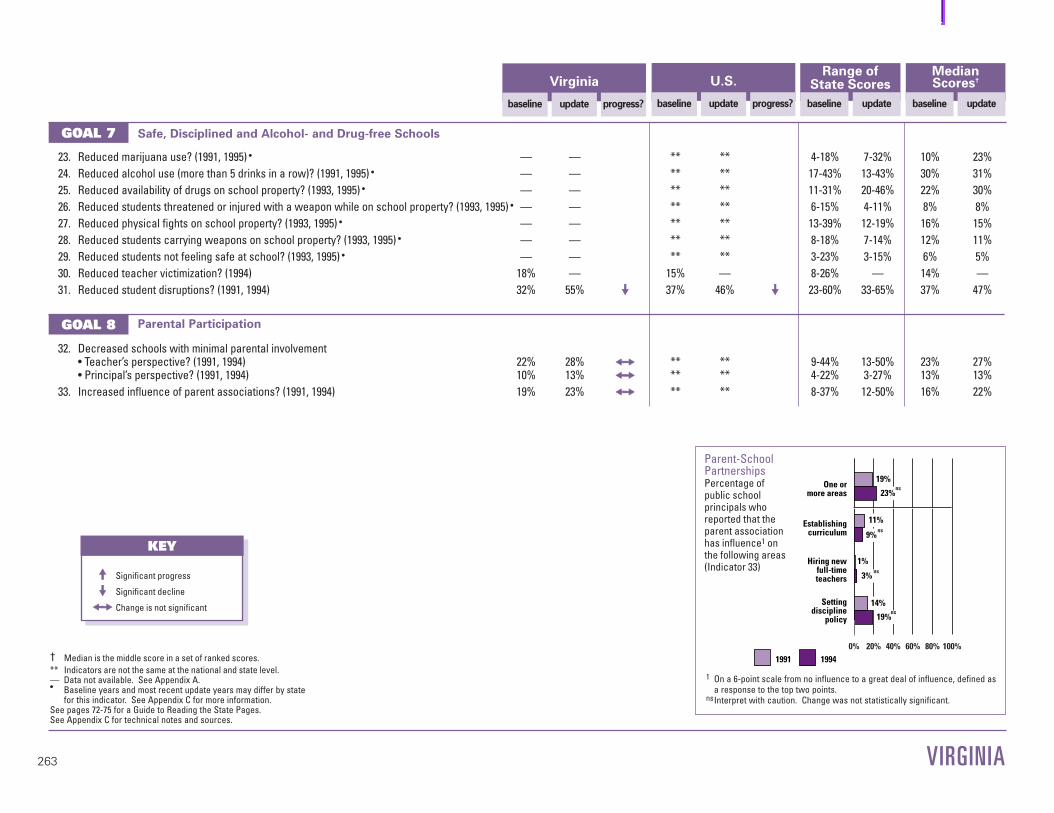
263
† Median is the middle score in a set of ranked scores.** Indicators are not the same at the national and state level.— Data not available. See Appendix A.• Baseline years and most recent update years may differ by state
for this indicator. See Appendix C for more information.See pages 72-75 for a Guide to Reading the State Pages.See Appendix C for technical notes and sources.
23. Reduced marijuana use? (1991, 1995) • — — ** ** 4-18% 7-32% 10% 23%24. Reduced alcohol use (more than 5 drinks in a row)? (1991, 1995) • — — ** ** 17-43% 13-43% 30% 31%25. Reduced availability of drugs on school property? (1993, 1995) • — — ** ** 11-31% 20-46% 22% 30%26. Reduced students threatened or injured with a weapon while on school property? (1993, 1995) • — — ** ** 6-15% 4-11% 8% 8%27. Reduced physical fights on school property? (1993, 1995) • — — ** ** 13-39% 12-19% 16% 15%28. Reduced students carrying weapons on school property? (1993, 1995) • — — ** ** 8-18% 7-14% 12% 11%29. Reduced students not feeling safe at school? (1993, 1995) • — — ** ** 3-23% 3-15% 6% 5%30. Reduced teacher victimization? (1994) 18% — 15% — 8-26% — 14% —31. Reduced student disruptions? (1991, 1994) 32% 55% @@ 37% 46% @@ 23-60% 33-65% 37% 47%
32. Decreased schools with minimal parental involvement• Teacher’s perspective? (1991, 1994) 22% 28% ## ** ** 9-44% 13-50% 23% 27%• Principal’s perspective? (1991, 1994) 10% 13% ## ** ** 4-22% 3-27% 13% 13%
33. Increased influence of parent associations? (1991, 1994) 19% 23% ## ** ** 8-37% 12-50% 16% 22%
VIRGINIA
GOAL 7
GOAL 8
U.S.
baseline update progress?
Virginia
baseline update progress?
Range of State Scores
baseline update
MedianScores†
baseline update
Safe, Disciplined and Alcohol- and Drug-free Schools
Parental Participation
0% 20% 40% 60% 80% 100%
Establishingcurriculum
One ormore areas
Hiring newfull-timeteachers
Settingdiscipline
policy
1991 1994
19%
23%
11%
9%
3%
1%
19%
14%
ns
ns
ns
ns
Parent-SchoolPartnershipsPercentage of public school principals whoreported that theparent associationhas influence1 onthe following areas(Indicator 33)
1 On a 6-point scale from no influence to a great deal of influence, defined asa response to the top two points.
nsInterpret with caution. Change was not statistically significant.
KEY
KEY
!! Significant progress
@@ Significant decline
## Change is not significant
Scorecards #2 (MO-VI) 10/30/97 11:59 AM Page 263

264
8. Increased reading achievement in Grade 4? (1994) • 27% — 30% — 8-41% — 27% —9. Increased mathematics achievement •
• in Grade 4? (1996) 21% — 21% — 3-31% — 20% —• in Grade 8? (1996) 26% — 24% — 5-34% — 22% —
10. Increased science achievement in Grade 8? (1996) 27% — 29% — 5-41% — 27% —
WASHINGTON
† Median is the middle score in a set of ranked scores.* Comparable national data are not available.— Data not available. See Appendix A.• Baseline years and most recent update years may differ by state
for this indicator. See Appendix C for more information.See pages 72-75 for a Guide to Reading the State Pages.See Appendix C for technical notes and sources.
GOAL 1
GOAL 2
GOAL 3
Washington
baseline update progress?
Range of State Scores
baseline update
MedianScores†
baseline update
U.S.
baseline update progress?
1. Reduced percentage of infants born in the state with 1 or more health risks? (1990, 1995) 34% 35% @@ 37% 34% !! 25-48% 24-46% 38% 35%2. Increased percentage of 2-year-olds immunized? (1994, 1996) 74% 79% ## 75% 78% !! 61-88% 64-88% 76% 79%3. Reduced number of infants (per 1,000) born with low birthweight? (1990, 1995) 53 55 @@ 70 73 @@ 48-151 53-134 71 754. Increased number of mothers (per 1,000) receiving early prenatal care? (1990, 1995) 773 827 !! 758 813 !! 469-868 560-900 778 8285. Increased number of children with disabilities in preschool (per 1,000)? (1991, 1996) 43 52 !! * * 16-68 16-92 38 47
6. Increased high school completion rate? (1990, 1995) 87% 87% ## 86% 86% ## 77-96% 79-96% 87% 88%7. Reduced high school dropout rate? (1992, 1994) • — — * * 3-12% 3-10% 5% 5%
Ready to Learn
School Completion
Student Achievement and Citizenship
19951990
87%
100%
80%
60%
40%
20%
0%
87%
High School CompletionPercentage of all18- to 24-year-olds1
who have a highschool credential2(Indicator 6)
1 Does not include those still in high school.2 Includes traditional high school diploma and alternative credential.
0%
20%
40%
60%
80%
100%
19951990
35%34%
Children’sHealth IndexPercentage ofinfants born with 1or more healthrisks1 (Indicator 1)
1 Includes late (in third trimester) or no prenatal care, low maternal weightgain (less than 21 pounds), mother smoked during pregnancy, or motherdrank alcohol during pregnancy.
KEY
KEY
!! Significant progress
@@ Significant decline
## Change is not significant
Scorecards #2 (MO-VI) 10/30/97 11:59 AM Page 264

265
† Median is the middle score in a set of ranked scores.° See Table 8 for the numbers for each subject area.— Data not available. See Appendix A.∞ This information had not been released when the 1997 Goals Report
went to print.See pages 72-75 for a Guide to Reading the State Pages.See Appendix C for technical notes and sources.
11. Increased the number of Advanced Placement examinations receiving a grade of 3 or higher (per 1,000)? (1991, 1997)° 35 48 !! 55 85 !! 9-177 18-223 41 65
12. Increased the percentage of public secondary school teachers who hold • a degree in main teaching assignment? (1991, 1994) 65% 61% ## 66% 63% @@ 51-85% 50-81% 69% 64%• a teaching certificate in main teaching assignment? (1991, 1994) 99% 95% @@ 94% 93% @@ 91-100% 89-100% 98% 97%
13. Increased the percentage of public school teachers participating in professional development on 1 or more selected topics? (1994) 89% — 85% — 76-98% — 86% —
14. Increased the percentage of public school teachers with training to teach limited English-proficient students? (1994) 23% — 16% — 4-81% — 16% —
15. Increased the percentage of beginning public school teachers participating in a formal teacher induction program? (1991, 1994) 20% 23% ## 22% 27% !! 6-42% 7-48% 20% 23%
16. International comparisons in mathematics and science will be reported in future Goals Panel reports.∞ — — — — — — — —
WASHINGTON
GOAL 3
GOAL 4
GOAL 5
U.S.
baseline update progress?
Washington
baseline update progress?
Range of State Scores
baseline update
MedianScores†
baseline update
Student Achievement and Citizenship (continued)
Teacher Education and Professional Development
Mathematics and Science
ReadingGrade 4
MathematicsGrade 4
19961994
100%
80%
60%
40%
20%
0%
27%21%
Student AchievementPercentage of public school students who metthe Goals Panel’sperformancestandard1 in reading and mathematics (Indicators 8 & 9)
1 A complete description of the performance standard can be found inAppendix C.
Uses ofeducationaltechnology
One ormore topics
Methods ofteaching
subject fieldIn-depthstudy in
subject field
Studentassessment
0 20
40
60
80
10
0
20% 40% 60% 80% 100%0%
65%
62%
35%
50%
89%
Professional DevelopmentPercentage ofpublic schoolteachers partici-pating in profes-sional develop-ment on thefollowing topics,1994(Indicator 13)KEY
KEY
!! Significant progress
@@ Significant decline
## Change is not significant
Scorecards #2 (MO-VI) 10/30/97 11:59 AM Page 265

266
20. Increased adult literacy? (1992) 69% — 52% — 46-77% — 53% —21. Increased the percentage of U.S. citizens
• registered to vote? (1988, 1992) 71% 75% ## 70% 73% !! 58-95% 63-92% 71% 75%• voting? (1988, 1992) 64% 69% !! 61% 66% !! 50-74% 55-77% 62% 68%
22. Increased postsecondary enrollment? (1992, 1994) 58% 57% ❊ ** ** 33-68% 37-71% 53% 55%
WASHINGTON
† Median is the middle score in a set of ranked scores.— Data not available. See Appendix A.** Indicators are not the same at the national and state level.❊ Sample size does not permit a reliable estimate of change.See pages 72-75 for a Guide to Reading the State Pages.See Appendix C for technical notes and sources.
GOAL 5
GOAL 6
Washington
baseline update progress?
Range of State Scores
baseline update
MedianScores†
baseline update
U.S.
baseline update progress?
17. Increased the percentage of public school 8th graders whose mathematics teachers • have students work in small groups? (1996) 69% — 66% — 45-92% — 67% —• address Algebra and functions? (1996) 57% — 57% — 45-82% — 58% —• address reasoning and analytical ability? (1996) 40% — 52% — 39-64% — 48% —
18. Increased the percentage of public school 8th graders who have computers available in their mathematics classroom? (1996) 42% — 30% — 7-54% — 30% —
19. Increased mathematics and science degrees awarded to • all students? (1991, 1995) 40% 43% !! 39% 42% !! 25-49% 15-53% 39% 42%• minority (Black, Hispanic, American Indian/Alaskan Native) students? (1991, 1995) 38% 39% !! 39% 40% !! 22-64% 22-57% 39% 39%• female students? (1991, 1995) 36% 38% !! 35% 37% !! 23-46% 13-47% 33% 36%
Mathematics and Science (continued)
Adult Literacy and Lifelong Learning
Addressreasoning & analytical
ability
AddressAlgebra and functions
Work insmall groups
or with apartner
0% 20% 40% 60% 80% 100%
69%
40%
57%
1
2
2
MathematicsInstructionPercentage ofpublic school 8thgraders whosemathematicsteachers do thefollowing, 1996(Indicator 17)
1 At least once a week.2 On a 4-point scale from “none” to “a lot,” defined as a response to the top point.
31%
69%
3 highest levels2 lowest levels
Adult LiteracyPercentage ofadults who scoredat 3 highest levelsin Prose Literacy(Indicator 20)
KEY
KEY
!! Significant progress
@@ Significant decline
## Change is not significant
Scorecards #2 (MO-VI) 10/30/97 11:59 AM Page 266

267
† Median is the middle score in a set of ranked scores.** Indicators are not the same at the national and state level.— Data not available. See Appendix A.• Baseline years and most recent update years may differ by state
for this indicator. See Appendix C for more information.See pages 72-75 for a Guide to Reading the State Pages.See Appendix C for technical notes and sources.
23. Reduced marijuana use? (1991, 1995) • — — ** ** 4-18% 7-32% 10% 23%24. Reduced alcohol use (more than 5 drinks in a row)? (1991, 1995) • — — ** ** 17-43% 13-43% 30% 31%25. Reduced availability of drugs on school property? (1993, 1995) • — — ** ** 11-31% 20-46% 22% 30%26. Reduced students threatened or injured with a weapon while on school property? (1993, 1995) • — — ** ** 6-15% 4-11% 8% 8%27. Reduced physical fights on school property? (1993, 1995) • — — ** ** 13-39% 12-19% 16% 15%28. Reduced students carrying weapons on school property? (1993, 1995) • — — ** ** 8-18% 7-14% 12% 11%29. Reduced students not feeling safe at school? (1993, 1995) • — — ** ** 3-23% 3-16% 6% 5%30. Reduced teacher victimization? (1994) 16% — 15% — 8-26% — 14% —31. Reduced student disruptions? (1991, 1994) 39% 45% ## 37% 46% @@ 23-60% 33-65% 37% 47%
32. Decreased schools with minimal parental involvement• Teacher’s perspective? (1991, 1994) 22% 25% ## ** ** 9-44% 13-50% 23% 27%• Principal’s perspective? (1991, 1994) 16% 15% ## ** ** 4-22% 3-27% 13% 13%
33. Increased influence of parent associations? (1991, 1994) 20% 23% ## ** ** 8-37% 12-50% 16% 22%
WASHINGTON
GOAL 7
GOAL 8
U.S.
baseline update progress?
Washington
baseline update progress?
Range of State Scores
baseline update
MedianScores†
baseline update
Safe, Disciplined and Alcohol- and Drug-free Schools
Parental Participation
0% 20% 40% 60% 80% 100%
Establishingcurriculum
One ormore areas
Hiring newfull-timeteachers
Settingdiscipline
policy
1991 1994
20%
23%
7%
9%
6%
3%
17%
12%
ns
ns
ns
ns
Parent-SchoolPartnershipsPercentage of public school principals whoreported that theparent associationhas influence1 onthe following areas(Indicator 33)
1 On a 6-point scale from no influence to a great deal of influence, defined asa response to the top two points.
nsInterpret with caution. Change was not statistically significant.
KEY
KEY
!! Significant progress
@@ Significant decline
## Change is not significant
Scorecards #2 (MO-VI) 10/30/97 11:59 AM Page 267

268
8. Increased reading achievement in Grade 4? (1992, 1994) • 25% 26% ## 29% 30% ## 8-38% 8-41% 26% 27%9. Increased mathematics achievement •
• in Grade 4? (1992, 1996) 12% 19% !! 18% 21% !! 5-27% 3-31% 16% 20%• in Grade 8? (1990, 1996) 9% 14% !! 15% 24% !! 1-27% 5-34% 15% 22%
10. Increased science achievement in Grade 8? (1996) 21% — 29% — 5-41% — 27% —
WEST VIRGINIA
† Median is the middle score in a set of ranked scores.* Comparable national data are not available.— Data not available. See Appendix A.• Baseline years and most recent update years may differ by state
for this indicator. See Appendix C for more information.See pages 72-75 for a Guide to Reading the State Pages.See Appendix C for technical notes and sources.
GOAL 1
GOAL 2
GOAL 3
West Virginia
baseline update progress?
Range of State Scores
baseline update
MedianScores†
baseline update
U.S.
baseline update progress?
1. Reduced percentage of infants born in the state with 1 or more health risks? (1990, 1995) 43% 42% !! 37% 34% !! 25-48% 24-46% 38% 35%2. Increased percentage of 2-year-olds immunized? (1994, 1996) 66% 72% ## 75% 78% !! 61-88% 64-88% 76% 79%3. Reduced number of infants (per 1,000) born with low birthweight? (1990, 1995) 71 79 @@ 70 73 @@ 48-151 53-134 71 754. Increased number of mothers (per 1,000) receiving early prenatal care? (1990, 1995) 734 820 !! 758 813 !! 469-868 560-900 778 8285. Increased number of children with disabilities in preschool (per 1,000)? (1991, 1996) 43 74 !! * * 16-68 16-92 38 47
6. Increased high school completion rate? (1990, 1995) 83% 89% !! 86% 86% ## 77-96% 79-96% 87% 88%7. Reduced high school dropout rate? (1992, 1994) • — — * * 3-12% 3-10% 5% 5%
Ready to Learn
School Completion
Student Achievement and Citizenship
19951990
89%100%
80%
60%
40%
20%
0%
83%
High School CompletionPercentage of all18- to 24-year-olds1
who have a highschool credential2(Indicator 6)
1 Does not include those still in high school.2 Includes traditional high school diploma and alternative credential.
0%
20%
40%
60%
80%
100%
19951990
42%43%
Children’sHealth IndexPercentage ofinfants born with 1or more healthrisks1 (Indicator 1)
1 Includes late (in third trimester) or no prenatal care, low maternal weightgain (less than 21 pounds), mother smoked during pregnancy, or motherdrank alcohol during pregnancy.
KEY
KEY
!! Significant progress
@@ Significant decline
## Change is not significant
Scorecards #2 (MO-VI) 10/30/97 11:59 AM Page 268
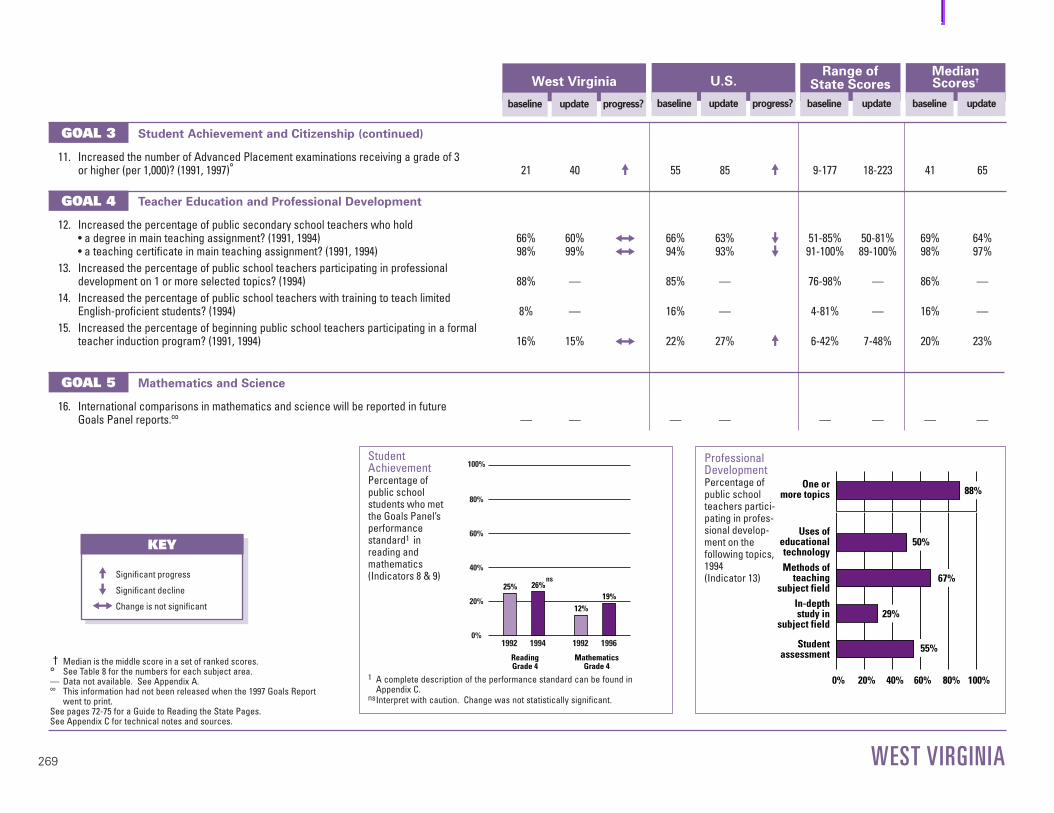
269
† Median is the middle score in a set of ranked scores.° See Table 8 for the numbers for each subject area.— Data not available. See Appendix A.∞ This information had not been released when the 1997 Goals Report
went to print.See pages 72-75 for a Guide to Reading the State Pages.See Appendix C for technical notes and sources.
11. Increased the number of Advanced Placement examinations receiving a grade of 3 or higher (per 1,000)? (1991, 1997)° 21 40 !! 55 85 !! 9-177 18-223 41 65
12. Increased the percentage of public secondary school teachers who hold • a degree in main teaching assignment? (1991, 1994) 66% 60% ## 66% 63% @@ 51-85% 50-81% 69% 64%• a teaching certificate in main teaching assignment? (1991, 1994) 98% 99% ## 94% 93% @@ 91-100% 89-100% 98% 97%
13. Increased the percentage of public school teachers participating in professional development on 1 or more selected topics? (1994) 88% — 85% — 76-98% — 86% —
14. Increased the percentage of public school teachers with training to teach limited English-proficient students? (1994) 8% — 16% — 4-81% — 16% —
15. Increased the percentage of beginning public school teachers participating in a formal teacher induction program? (1991, 1994) 16% 15% ## 22% 27% !! 6-42% 7-48% 20% 23%
16. International comparisons in mathematics and science will be reported in future Goals Panel reports.∞ — — — — — — — —
WEST VIRGINIA
GOAL 3
GOAL 4
GOAL 5
U.S.
baseline update progress?
West Virginia
baseline update progress?
Range of State Scores
baseline update
MedianScores†
baseline update
Student Achievement and Citizenship (continued)
Teacher Education and Professional Development
Mathematics and Science
ReadingGrade 4
MathematicsGrade 4
1996199219941992
100%
80%
60%
40%
20%
0%
25% 26%
12%19%
ns
Student AchievementPercentage of public school students who metthe Goals Panel’sperformancestandard1 in reading and mathematics (Indicators 8 & 9)
1 A complete description of the performance standard can be found inAppendix C.
nsInterpret with caution. Change was not statistically significant.
Uses ofeducationaltechnology
One ormore topics
Methods ofteaching
subject fieldIn-depthstudy in
subject field
Studentassessment
0 20
40
60
80
10
0
20% 40% 60% 80% 100%0%
50%
67%
29%
55%
88%
Professional DevelopmentPercentage ofpublic schoolteachers partici-pating in profes-sional develop-ment on thefollowing topics,1994(Indicator 13)KEY
KEY
!! Significant progress
@@ Significant decline
## Change is not significant
Scorecards #2 (MO-VI) 10/30/97 11:59 AM Page 269

270
20. Increased adult literacy? (1992) — — 52% — 46-77% — 53% —21. Increased the percentage of U.S. citizens
• registered to vote? (1988, 1992) 65% 65% ## 70% 73% !! 58-95% 63-92% 71% 75%• voting? (1988, 1992) 53% 58% ## 61% 66% !! 50-74% 55-77% 62% 68%
22. Increased postsecondary enrollment? (1992, 1994) 49% 50% ❊ ** ** 33-68% 37-71% 53% 55%
WEST VIRGINIA
† Median is the middle score in a set of ranked scores.— Data not available. See Appendix A.** Indicators are not the same at the national and state level.❊ Sample size does not permit a reliable estimate of change.See pages 72-75 for a Guide to Reading the State Pages.See Appendix C for technical notes and sources.
GOAL 5
GOAL 6
West Virginia
baseline update progress?
Range of State Scores
baseline update
MedianScores†
baseline update
U.S.
baseline update progress?
17. Increased the percentage of public school 8th graders whose mathematics teachers • have students work in small groups? (1996) 53% — 66% — 45-92% — 67% —• address Algebra and functions? (1996) 56% — 57% — 45-82% — 58% —• address reasoning and analytical ability? (1996) 42% — 52% — 39-64% — 48% —
18. Increased the percentage of public school 8th graders who have computers available in their mathematics classroom? (1996) 29% — 30% — 7-54% — 30% —
19. Increased mathematics and science degrees awarded to • all students? (1991, 1995) 32% 40% !! 39% 42% !! 25-49% 15-53% 39% 42%• minority (Black, Hispanic, American Indian/Alaskan Native) students? (1991, 1995) 31% 29% @@ 39% 40% !! 22-64% 22-57% 39% 39%• female students? (1991, 1995) 29% 37% !! 35% 37% !! 23-46% 13-47% 33% 36%
Mathematics and Science (continued)
Adult Literacy and Lifelong Learning
Addressreasoning & analytical
ability
AddressAlgebra and functions
Work insmall groups
or with apartner
0% 20% 40% 60% 80% 100%
53%
42%
56%
1
2
2
MathematicsInstructionPercentage ofpublic school 8thgraders whosemathematicsteachers do thefollowing, 1996(Indicator 17)
1 At least once a week.2 On a 4-point scale from “none” to “a lot,” defined as a response to the top point.
KEY
KEY
!! Significant progress
@@ Significant decline
## Change is not significant
Scorecards #2 (MO-VI) 10/30/97 11:59 AM Page 270

271
† Median is the middle score in a set of ranked scores.** Indicators are not the same at the national and state level.— Data not available. See Appendix A.• Baseline years and most recent update years may differ by state
for this indicator. See Appendix C for more information.See pages 72-75 for a Guide to Reading the State Pages.See Appendix C for technical notes and sources.
23. Reduced marijuana use? (1993, 1995) • 18% 26% @@ ** ** 7-21% 7-32% 14% 23%24. Reduced alcohol use (more than 5 drinks in a row)? (1993, 1995) • 39% 39% ## ** ** 9-44% 13-43% 28% 31%25. Reduced availability of drugs on school property? (1993, 1995) • 26% 33% @@ ** ** 11-31% 20-46% 22% 30%26. Reduced students threatened or injured with a weapon while on school property? (1993, 1995) • 8% 7% ## ** ** 6-15% 4-11% 8% 8%27. Reduced physical fights on school property? (1993, 1995) • 17% 14% ## ** ** 13-39% 12-19% 16% 15%28. Reduced students carrying weapons on school property? (1993, 1995) • 14% 12% ## ** ** 8-18% 7-14% 12% 11%29. Reduced students not feeling safe at school? (1993, 1995) • 4% 5% ## ** ** 3-23% 3-16% 6% 5%30. Reduced teacher victimization? (1994) 13% — 15% — 8-26% — 14% —31. Reduced student disruptions? (1991, 1994) 32% 43% @@ 37% 46% @@ 23-60% 33-65% 37% 47%
32. Decreased schools with minimal parental involvement• Teacher’s perspective? (1991, 1994) 23% 27% ## ** ** 9-44% 13-50% 23% 27%• Principal’s perspective? (1991, 1994) 12% 12% ## ** ** 4-22% 3-27% 13% 13%
33. Increased influence of parent associations? (1991, 1994) 16% 17% ## ** ** 8-37% 12-50% 16% 22%
WEST VIRGINIA
GOAL 7
GOAL 8
U.S.
baseline update progress?
West Virginia
baseline update progress?
Range of State Scores
baseline update
MedianScores†
baseline update
Safe, Disciplined and Alcohol- and Drug-free Schools
Parental Participation
Usedmarijuana
Had 5 ormore drinks
in a row
Were offered, sold,or given an illegal drug
on school property
1
1
2
0% 20% 40% 60% 80% 100%
1991 1993 1995
26%
18%
39%
39%
26%
33%
Alcohol- andDrug-freeSchoolsPercentage ofpublic high schoolstudents whoreported the fol-lowing(Indicators 23,24, & 25)
1 During the past 30 days.2 During the past 12 months.
0% 20% 40% 60% 80% 100%
Establishingcurriculum
One ormore areas
Settingdiscipline
policy
1991 1994
16%
17%
8%
5%
15%
8%
ns
ns
ns
Parent-SchoolPartnershipsPercentage of public school principals whoreported that theparent associationhas influence1 onthe following areas(Indicator 33)
1 On a 6-point scale from no influence to a great deal of influence, defined asa response to the top two points.
nsInterpret with caution. Change was not statistically significant.
KEY
KEY
!! Significant progress
@@ Significant decline
## Change is not significant
Scorecards #2 (MO-VI) 10/30/97 11:59 AM Page 271

272
8. Increased reading achievement in Grade 4? (1992, 1994) • 33% 35% ## 29% 30% ## 8-38% 8-41% 26% 27%9. Increased mathematics achievement •
• in Grade 4? (1992, 1996) 24% 27% ## 18% 21% !! 5-27% 3-31% 16% 20%• in Grade 8? (1990, 1996) 23% 32% !! 15% 24% !! 1-27% 5-34% 15% 22%
10. Increased science achievement in Grade 8? (1996) 39% — 29% — 5-41% — 27% —
WISCONSIN
† Median is the middle score in a set of ranked scores.* Comparable national data are not available.— Data not available. See Appendix A.• Baseline years and most recent update years may differ by state
for this indicator. See Appendix C for more information.See pages 72-75 for a Guide to Reading the State Pages.See Appendix C for technical notes and sources.
GOAL 1
GOAL 2
GOAL 3
Wisconsin
baseline update progress?
Range of State Scores
baseline update
MedianScores†
baseline update
U.S.
baseline update progress?
1. Reduced percentage of infants born in the state with 1 or more health risks? (1990, 1995) 42% 38% !! 37% 34% !! 25-48% 24-46% 38% 35%2. Increased percentage of 2-year-olds immunized? (1994, 1996) 76% 78% ## 75% 78% !! 61-88% 64-88% 76% 79%3. Reduced number of infants (per 1,000) born with low birthweight? (1990, 1995) 59 60 @@ 70 73 @@ 48-151 53-134 71 754. Increased number of mothers (per 1,000) receiving early prenatal care? (1990, 1995) 817 834 !! 758 813 !! 469-868 560-900 778 8285. Increased number of children with disabilities in preschool (per 1,000)? (1991, 1996) 49 62 !! * * 16-68 16-92 38 47
6. Increased high school completion rate? (1990, 1995) 93% 93% ## 86% 86% ## 77-96% 79-96% 87% 88%7. Reduced high school dropout rate? (1992, 1994) • — — * * 3-12% 3-10% 5% 5%
Ready to Learn
School Completion
Student Achievement and Citizenship
19951990
93%100%
80%
60%
40%
20%
0%
93%
High School CompletionPercentage of all18- to 24-year-olds1
who have a highschool credential2(Indicator 6)
1 Does not include those still in high school.2 Includes traditional high school diploma and alternative credential.
0%
20%
40%
60%
80%
100%
19951990
38%42%
Children’sHealth IndexPercentage ofinfants born with 1or more healthrisks1 (Indicator 1)
1 Includes late (in third trimester) or no prenatal care, low maternal weightgain (less than 21 pounds), mother smoked during pregnancy, or motherdrank alcohol during pregnancy.
KEY
KEY
!! Significant progress
@@ Significant decline
## Change is not significant
Scorecards #2 (MO-VI) 10/30/97 11:59 AM Page 272

273
† Median is the middle score in a set of ranked scores.° See Table 8 for the numbers for each subject area.— Data not available. See Appendix A.∞ This information had not been released when the 1997 Goals Report
went to print.See pages 72-75 for a Guide to Reading the State Pages.See Appendix C for technical notes and sources.
11. Increased the number of Advanced Placement examinations receiving a grade of 3 or higher (per 1,000)? (1991, 1997)° 25 65 !! 55 85 !! 9-177 18-223 41 65
12. Increased the percentage of public secondary school teachers who hold • a degree in main teaching assignment? (1991, 1994) 79% 63% @@ 66% 63% @@ 51-85% 50-81% 69% 64%• a teaching certificate in main teaching assignment? (1991, 1994) 98% 97% ## 94% 93% @@ 91-100% 89-100% 98% 97%
13. Increased the percentage of public school teachers participating in professional development on 1 or more selected topics? (1994) 84% — 85% — 76-98% — 86% —
14. Increased the percentage of public school teachers with training to teach limited English-proficient students? (1994) 7% — 16% — 4-81% — 16% —
15. Increased the percentage of beginning public school teachers participating in a formal teacher induction program? (1991, 1994) 12% 18% !! 22% 27% !! 6-42% 7-48% 20% 23%
16. International comparisons in mathematics and science will be reported in future Goals Panel reports.∞ — — — — — — — —
WISCONSIN
GOAL 3
GOAL 4
GOAL 5
U.S.
baseline update progress?
Wisconsin
baseline update progress?
Range of State Scores
baseline update
MedianScores†
baseline update
Student Achievement and Citizenship (continued)
Teacher Education and Professional Development
Mathematics and Science
ReadingGrade 4
MathematicsGrade 4
1996199219941992
100%
80%
60%
40%
20%
0%
33% 35%
24%27%
ns
ns
Student AchievementPercentage of public school students who metthe Goals Panel’sperformancestandard1 in reading and mathematics (Indicators 8 & 9)
1 A complete description of the performance standard can be found inAppendix C.
nsInterpret with caution. Change was not statistically significant.
Uses ofeducationaltechnology
One ormore topics
Methods ofteaching
subject fieldIn-depthstudy in
subject field
Studentassessment
0 20
40
60
80
10
0
20% 40% 60% 80% 100%0%
50%
58%
29%
45%
84%
Professional DevelopmentPercentage ofpublic schoolteachers partici-pating in profes-sional develop-ment on thefollowing topics,1994(Indicator 13)KEY
KEY
!! Significant progress
@@ Significant decline
## Change is not significant
Scorecards #2 (MO-VI) 10/30/97 11:59 AM Page 273
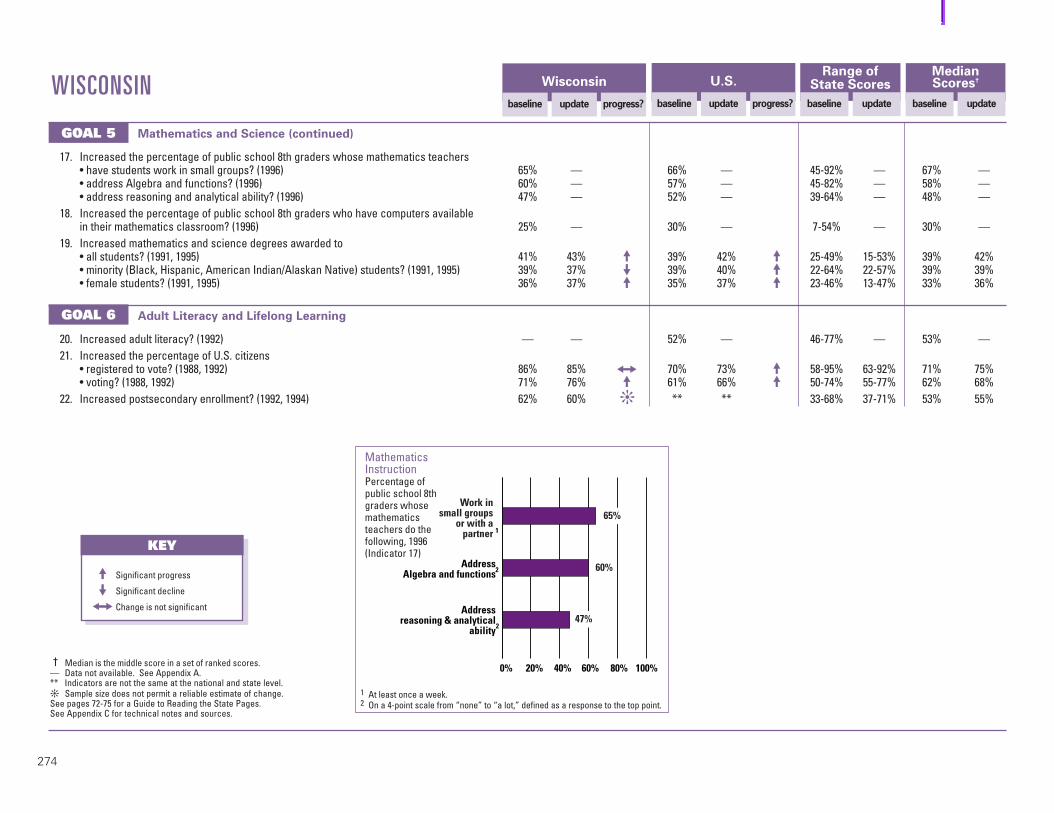
274
20. Increased adult literacy? (1992) — — 52% — 46-77% — 53% —21. Increased the percentage of U.S. citizens
• registered to vote? (1988, 1992) 86% 85% ## 70% 73% !! 58-95% 63-92% 71% 75%• voting? (1988, 1992) 71% 76% !! 61% 66% !! 50-74% 55-77% 62% 68%
22. Increased postsecondary enrollment? (1992, 1994) 62% 60% ❊ ** ** 33-68% 37-71% 53% 55%
WISCONSIN
† Median is the middle score in a set of ranked scores.— Data not available. See Appendix A.** Indicators are not the same at the national and state level.❊ Sample size does not permit a reliable estimate of change.See pages 72-75 for a Guide to Reading the State Pages.See Appendix C for technical notes and sources.
GOAL 5
GOAL 6
Wisconsin
baseline update progress?
Range of State Scores
baseline update
MedianScores†
baseline update
U.S.
baseline update progress?
17. Increased the percentage of public school 8th graders whose mathematics teachers • have students work in small groups? (1996) 65% — 66% — 45-92% — 67% —• address Algebra and functions? (1996) 60% — 57% — 45-82% — 58% —• address reasoning and analytical ability? (1996) 47% — 52% — 39-64% — 48% —
18. Increased the percentage of public school 8th graders who have computers available in their mathematics classroom? (1996) 25% — 30% — 7-54% — 30% —
19. Increased mathematics and science degrees awarded to • all students? (1991, 1995) 41% 43% !! 39% 42% !! 25-49% 15-53% 39% 42%• minority (Black, Hispanic, American Indian/Alaskan Native) students? (1991, 1995) 39% 37% @@ 39% 40% !! 22-64% 22-57% 39% 39%• female students? (1991, 1995) 36% 37% !! 35% 37% !! 23-46% 13-47% 33% 36%
Mathematics and Science (continued)
Adult Literacy and Lifelong Learning
Addressreasoning & analytical
ability
AddressAlgebra and functions
Work insmall groups
or with apartner
0% 20% 40% 60% 80% 100%
65%
47%
60%
1
2
2
MathematicsInstructionPercentage ofpublic school 8thgraders whosemathematicsteachers do thefollowing, 1996(Indicator 17)
1 At least once a week.2 On a 4-point scale from “none” to “a lot,” defined as a response to the top point.
KEY
KEY
!! Significant progress
@@ Significant decline
## Change is not significant
Scorecards #2 (MO-VI) 10/30/97 11:59 AM Page 274

275
† Median is the middle score in a set of ranked scores.** Indicators are not the same at the national and state level.— Data not available. See Appendix A.• Baseline years and most recent update years may differ by state
for this indicator. See Appendix C for more information.See pages 72-75 for a Guide to Reading the State Pages.See Appendix C for technical notes and sources.
23. Reduced marijuana use? (1993) • 11% — ** ** 7-21% — 14% —24. Reduced alcohol use (more than 5 drinks in a row)? (1993) • 29% — ** ** 9-44% — 28% —25. Reduced availability of drugs on school property? (1993) • 20% — ** ** 11-31% — 22% —26. Reduced students threatened or injured with a weapon while on school property? (1993) • 8% — ** ** 6-15% — 8% —27. Reduced physical fights on school property? (1993) • 16% — ** ** 13-39% — 16% —28. Reduced students carrying weapons on school property? (1993) • 9% — ** ** 8-18% — 12% —29. Reduced students not feeling safe at school? (1993) • 6% — ** ** 3-23% — 6% —30. Reduced teacher victimization? (1994) 15% — 15% — 8-26% — 14% —31. Reduced student disruptions? (1991, 1994) 41% 51% @@ 37% 46% @@ 23-60% 33-65% 37% 47%
32. Decreased schools with minimal parental involvement• Teacher’s perspective? (1991, 1994) 19% 21% ## ** ** 9-44% 13-50% 23% 27%• Principal’s perspective? (1991, 1994) 9% 9% ## ** ** 4-22% 3-27% 13% 13%
33. Increased influence of parent associations? (1991, 1994) 11% 21% !! ** ** 8-37% 12-50% 16% 22%
WISCONSIN
GOAL 7
GOAL 8
U.S.
baseline update progress?
Wisconsin
baseline update progress?
Range of State Scores
baseline update
MedianScores†
baseline update
Safe, Disciplined and Alcohol- and Drug-free Schools
Parental Participation
Usedmarijuana
Had 5 ormore drinks
in a row
Were offered, sold,or given an illegal drug
on school property
1
1
2
0% 20% 40% 60% 80% 100%
1991 1993
11%
29%
20%
Alcohol- andDrug-freeSchoolsPercentage ofpublic high schoolstudents whoreported the fol-lowing(Indicators 23,24, & 25)
1 During the past 30 days.2 During the past 12 months.
0% 20% 40% 60% 80% 100%
Establishingcurriculum
One ormore areas
Hiring newfull-timeteachers
Settingdiscipline
policy
1991 1994
11%
21%
2%
4%
5%
1%
16%
10%
ns
ns
Parent-SchoolPartnershipsPercentage of public school principals whoreported that theparent associationhas influence1 onthe following areas(Indicator 33)
1 On a 6-point scale from no influence to a great deal of influence, defined asa response to the top two points.
nsInterpret with caution. Change was not statistically significant.
KEY
KEY
!! Significant progress
@@ Significant decline
## Change is not significant
Scorecards #2 (MO-VI) 10/30/97 11:59 AM Page 275

8. Increased reading achievement in Grade 4? (1992, 1994) • 33% 32% ## 29% 30% ## 8-38% 8-41% 26% 27%9. Increased mathematics achievement •
• in Grade 4? (1992, 1996) 19% 19% ## 18% 21% !! 5-27% 3-31% 16% 20%• in Grade 8? (1990, 1996) 19% 22% !! 15% 24% !! 1-27% 5-34% 15% 22%
10. Increased science achievement in Grade 8? (1996) 34% — 29% — 5-41% — 27% —
WYOMING
† Median is the middle score in a set of ranked scores.* Comparable national data are not available.— Data not available. See Appendix A.• Baseline years and most recent update years may differ by state
for this indicator. See Appendix C for more information.See pages 72-75 for a Guide to Reading the State Pages.See Appendix C for technical notes and sources.
GOAL 1
GOAL 2
GOAL 3
Wyoming
baseline update progress?
Range of State Scores
baseline update
MedianScores†
baseline update
U.S.
baseline update progress?
1. Reduced percentage of infants born in the state with 1 or more health risks? (1990, 1995) 41% 37% ## 37% 34% !! 25-48% 24-46% 38% 35%2. Increased percentage of 2-year-olds immunized? (1994, 1996) 78% 79% ## 75% 78% !! 61-88% 64-88% 76% 79%3. Reduced number of infants (per 1,000) born with low birthweight? (1990, 1995) 74 74 ## 70 73 @@ 48-151 53-134 71 754. Increased number of mothers (per 1,000) receiving early prenatal care? (1990, 1995) 806 831 !! 758 813 !! 469-868 560-900 778 8285. Increased number of children with disabilities in preschool (per 1,000)? (1991, 1996) 54 76 !! * * 16-68 16-92 38 47
6. Increased high school completion rate? (1990, 1995) 91% 89% ## 86% 86% ## 77-96% 79-96% 87% 88%7. Reduced high school dropout rate? (1992, 1994) • — — * * 3-12% 3-10% 5% 5%
Ready to Learn
School Completion
Student Achievement and Citizenship
KEY
KEY
!! Significant progress
@@ Significant decline
## Change is not significant
19951990
89%100%
80%
60%
40%
20%
0%
91% ns
High School CompletionPercentage of all18- to 24-year-olds1
who have a highschool credential2(Indicator 6)
1 Does not include those still in high school.2 Includes traditional high school diploma and alternative credential.nsInterpret with caution. Change was not statistically significant.
0%
20%
40%
60%
80%
100%
19951990
37%41% ns
Children’sHealth IndexPercentage ofinfants born with 1or more healthrisks1 (Indicator 1)
1 Includes late (in third trimester) or no prenatal care, low maternal weightgain (less than 21 pounds), mother smoked during pregnancy, or motherdrank alcohol during pregnancy.
nsInterpret with caution. Change was not statistically significant.
276
Scorecards #2 (MO-VI) 10/30/97 11:59 AM Page 276

† Median is the middle score in a set of ranked scores.° See Table 8 for the numbers for each subject area.— Data not available. See Appendix A.∞ This information had not been released when the 1997 Goals Report
went to print.See pages 72-75 for a Guide to Reading the State Pages.See Appendix C for technical notes and sources.
11. Increased the number of Advanced Placement examinations receiving a grade of 3 or higher (per 1,000)? (1991, 1997)° 20 18 @@ 55 85 !! 9-177 18-223 41 65
12. Increased the percentage of public secondary school teachers who hold • a degree in main teaching assignment? (1991, 1994) 69% 72% ## 66% 63% @@ 51-85% 50-81% 69% 64%• a teaching certificate in main teaching assignment? (1991, 1994) 99% 99% ## 94% 93% @@ 91-100% 89-100% 98% 97%
13. Increased the percentage of public school teachers participating in professional development on 1 or more selected topics? (1994) 85% — 85% — 76-98% — 86% —
14. Increased the percentage of public school teachers with training to teach limited English-proficient students? (1994) 13% — 16% — 4-81% — 16% —
15. Increased the percentage of beginning public school teachers participating in a formal teacher induction program? (1991, 1994) 13% 15% ## 22% 27% !! 6-42% 7-48% 20% 23%
16. International comparisons in mathematics and science will be reported in future Goals Panel reports.∞ — — — — — — — —
WYOMING
GOAL 3
GOAL 4
GOAL 5
U.S.
baseline update progress?
Wyoming
baseline update progress?
Range of State Scores
baseline update
MedianScores†
baseline update
Student Achievement and Citizenship (continued)
Teacher Education and Professional Development
Mathematics and Science
KEY
KEY
!! Significant progress
@@ Significant decline
## Change is not significant
ReadingGrade 4
MathematicsGrade 4
1996199219941992
100%
80%
60%
40%
20%
0%
33% 32%
19% 19%
ns
Student AchievementPercentage of public school students who metthe Goals Panel’sperformancestandard1 in reading and mathematics (Indicators 8 & 9)
1 A complete description of the performance standard can be found inAppendix C.
nsInterpret with caution. Change was not statistically significant.
Uses ofeducationaltechnology
One ormore topics
Methods ofteaching
subject fieldIn-depthstudy in
subject field
Studentassessment
0 20
40
60
80
10
0
20% 40% 60% 80% 100%0%
56%
53%
30%
46%
85%
Professional DevelopmentPercentage ofpublic schoolteachers partici-pating in profes-sional develop-ment on thefollowing topics,1994(Indicator 13)
277
Scorecards #2 (MO-VI) 10/30/97 11:59 AM Page 277

278
20. Increased adult literacy? (1992) — — 52% — 46-77% — 53% —21. Increased the percentage of U.S. citizens
• registered to vote? (1988, 1992) 68% 69% ## 70% 73% !! 58-95% 63-92% 71% 75%• voting? (1988, 1992) 62% 65% ## 61% 66% !! 50-74% 55-77% 62% 68%
22. Increased postsecondary enrollment? (1992, 1994) 47% 53% ❊ ** ** 33-68% 37-71% 53% 55%
WYOMING
† Median is the middle score in a set of ranked scores.— Data not available. See Appendix A.** Indicators are not the same at the national and state level.❊ Sample size does not permit a reliable estimate of change.See pages 72-75 for a Guide to Reading the State Pages.See Appendix C for technical notes and sources.
GOAL 5
GOAL 6
Wyoming
baseline update progress?
Range of State Scores
baseline update
MedianScores†
baseline update
U.S.
baseline update progress?
17. Increased the percentage of public school 8th graders whose mathematics teachers • have students work in small groups? (1996) 64% — 66% — 45-92% — 67% —• address Algebra and functions? (1996) 58% — 57% — 45-82% — 58% —• address reasoning and analytical ability? (1996) 50% — 52% — 39-64% — 48% —
18. Increased the percentage of public school 8th graders who have computers available in their mathematics classroom? (1996) 41% — 30% — 7-54% — 30% —
19. Increased mathematics and science degrees awarded to • all students? (1991, 1995) 40% 45% !! 39% 42% !! 25-49% 15-53% 39% 42%• minority (Black, Hispanic, American Indian/Alaskan Native) students? (1991, 1995) 43% 40% @@ 39% 40% !! 22-64% 22-57% 39% 39%• female students? (1991, 1995) 35% 38% !! 35% 37% !! 23-46% 13-47% 33% 36%
Mathematics and Science (continued)
Adult Literacy and Lifelong Learning
KEY
KEY
!! Significant progress
@@ Significant decline
## Change is not significantAddress
reasoning & analyticalability
AddressAlgebra and functions
Work insmall groups
or with apartner
0% 20% 40% 60% 80% 100%
64%
50%
58%
1
2
2
MathematicsInstructionPercentage ofpublic school 8thgraders whosemathematicsteachers do thefollowing, 1996(Indicator 17)
1 At least once a week.2 On a 4-point scale from “none” to “a lot,” defined as a response to the top point.
Scorecards #2 (MO-VI) 10/30/97 11:59 AM Page 278

† Median is the middle score in a set of ranked scores.** Indicators are not the same at the national and state level.— Data not available. See Appendix A.• Baseline years and most recent update years may differ by state
for this indicator. See Appendix C for more information.See pages 72-75 for a Guide to Reading the State Pages.See Appendix C for technical notes and sources.
23. Reduced marijuana use? (1995) • 22% — ** ** 7-32% — 23% —24. Reduced alcohol use (more than 5 drinks in a row)? (1995) • 39% — ** ** 13-43% — 31% —25. Reduced availability of drugs on school property? (1995) • 24% — ** ** 20-46% — 30% —26. Reduced students threatened or injured with a weapon while on school property? (1995) • 7% — ** ** 4-11% — 8% —27. Reduced physical fights on school property? (1995) • 17% — ** ** 12-19% — 15% —28. Reduced students carrying weapons on school property? (1995) • 14% — ** ** 7-14% — 11% —29. Reduced students not feeling safe at school? (1995) • 3% — ** ** 3-16% — 5% —30. Reduced teacher victimization? (1994) 11% — 15% — 8-26% — 14% —31. Reduced student disruptions? (1991, 1994) 28% 39% @@ 37% 46% @@ 23-60% 33-65% 37% 47%
32. Decreased schools with minimal parental involvement• Teacher’s perspective? (1991, 1994) 15% 17% ## ** ** 9-44% 13-50% 23% 27%• Principal’s perspective? (1991, 1994) 7% 10% ## ** ** 4-22% 3-27% 13% 13%
33. Increased influence of parent associations? (1991, 1994) 16% 19% ## ** ** 8-37% 12-50% 16% 22%
WYOMING
GOAL 7
GOAL 8
U.S.
baseline update progress?
Wyoming
baseline update progress?
Range of State Scores
baseline update
MedianScores†
baseline update
Safe, Disciplined and Alcohol- and Drug-free Schools
Parental Participation
KEY
KEY
!! Significant progress
@@ Significant decline
## Change is not significant
Usedmarijuana
Had 5 ormore drinks
in a row
Were offered, sold,or given an illegal drug
on school property
1
1
2
0% 20% 40% 60% 80% 100%
1991 1995
22%
39%
24%
Alcohol- andDrug-freeSchoolsPercentage ofpublic high schoolstudents whoreported the fol-lowing(Indicators 23,24, & 25)
1 During the past 30 days.2 During the past 12 months.
0% 20% 40% 60% 80% 100%
Establishingcurriculum
One ormore areas
Hiring newfull-timeteachers
Settingdiscipline
policy
1991 1994
16%
19%
7%
6%
9%
14%
12%
ns
ns
ns
Parent-SchoolPartnershipsPercentage of public school principals whoreported that theparent associationhas influence1 onthe following areas(Indicator 33)
1 On a 6-point scale from no influence to a great deal of influence, defined asa response to the top two points.
nsInterpret with caution. Change was not statistically significant.
279
Scorecards #2 (MO-VI) 10/30/97 11:59 AM Page 279

280
8. Increased reading achievement in Grade 4? (1992, 1994) • — — 29% 30% ## 8-38% 8-41% 26% 27%9. Increased mathematics achievement •
• in Grade 4? (1992, 1996) — — 18% 21% !! 5-27% 3-31% 16% 20%• in Grade 8? (1990, 1996) — — 15% 24% !! 1-27% 5-34% 15% 22%
10. Increased science achievement in Grade 8? (1996) — — 29% — 5-41% — 27% —
AMERICAN SAMOA
† Median is the middle score in a set of ranked scores.* Comparable national data are not available.— Data not available. See Appendix A.• Baseline years and most recent update years may differ by state
for this indicator. See Appendix C for more information.See pages 72-75 for a Guide to Reading the State Pages.See Appendix C for technical notes and sources.
GOAL 1
GOAL 2
GOAL 3
American Samoa
baseline update progress?
Range of State Scores
baseline update
MedianScores†
baseline update
U.S.
baseline update progress?
1. Reduced percentage of infants born in the state with 1 or more health risks? (1990, 1995) — — 37% 34% !! 25-48% 24-46% 38% 35%2. Increased percentage of 2-year-olds immunized? (1994, 1996) — — 75% 78% !! 61-88% 64-88% 76% 79%3. Reduced number of infants (per 1,000) born with low birthweight? (1990, 1995) — — 70 73 @@ 48-151 53-134 71 754. Increased number of mothers (per 1,000) receiving early prenatal care? (1990, 1995) — — 758 813 !! 469-868 560-900 778 8285. Increased number of children with disabilities in preschool (per 1,000)? (1991, 1996) — — * * 16-68 16-92 38 47
6. Increased high school completion rate? (1990, 1995) — — 86% 86% ## 77-96% 79-96% 87% 88%7. Reduced high school dropout rate? (1992, 1994) • — — * * 3-12% 3-10% 5% 5%
Ready to Learn
School Completion
Student Achievement and Citizenship
KEY
KEY
!! Significant progress
@@ Significant decline
## Change is not significant
Scorecards #2 (MO-VI) 10/30/97 11:59 AM Page 280

281
† Median is the middle score in a set of ranked scores.° See Table 8 for the numbers for each subject area.— Data not available. See Appendix A.∞ This information had not been released when the 1997 Goals Report
went to print.See pages 72-75 for a Guide to Reading the State Pages.See Appendix C for technical notes and sources.
11. Increased the number of Advanced Placement examinations receiving a grade of 3 or higher (per 1,000)? (1991, 1997)° — — 55 85 !! 9-177 18-223 41 65
12. Increased the percentage of public secondary school teachers who hold • a degree in main teaching assignment? (1991, 1994) — — 66% 63% @@ 51-85% 50-81% 69% 64%• a teaching certificate in main teaching assignment? (1991, 1994) — — 94% 93% @@ 91-100% 89-100% 98% 97%
13. Increased the percentage of public school teachers participating in professional development on 1 or more selected topics? (1994) — — 85% — 76-98% — 86% —
14. Increased the percentage of public school teachers with training to teach limited English-proficient students? (1994) — — 16% — 4-81% — 16% —
15. Increased the percentage of beginning public school teachers participating in a formal teacher induction program? (1991, 1994) — — 22% 27% !! 6-42% 7-48% 20% 23%
16. International comparisons in mathematics and science will be reported in future Goals Panel reports.∞ — — — — — — — —
AMERICAN SAMOA
GOAL 3
GOAL 4
GOAL 5
U.S.
baseline update progress?
American Samoa
baseline update progress?
Range of State Scores
baseline update
MedianScores†
baseline update
Student Achievement and Citizenship (continued)
Teacher Education and Professional Development
Mathematics and Science
KEY
KEY
!! Significant progress
@@ Significant decline
## Change is not significant
Scorecards #2 (MO-VI) 10/30/97 11:59 AM Page 281

282
20. Increased adult literacy? (1992) — — 52% — 46-77% — 53% —21. Increased the percentage of U.S. citizens
• registered to vote? (1988, 1992) — — 70% 73% !! 58-95% 63-92% 71% 75%• voting? (1988, 1992) — — 61% 66% !! 50-74% 55-77% 62% 68%
22. Increased postsecondary enrollment? (1992, 1994) — — ** ** 33-68% 37-71% 53% 55%
AMERICAN SAMOA
† Median is the middle score in a set of ranked scores.— Data not available. See Appendix A.** Indicators are not the same at the national and state level.See pages 72-75 for a Guide to Reading the State Pages.See Appendix C for technical notes and sources.
GOAL 5
GOAL 6
American Samoa
baseline update progress?
Range of State Scores
baseline update
MedianScores†
baseline update
U.S.
baseline update progress?
17. Increased the percentage of public school 8th graders whose mathematics teachers • have students work in small groups? (1996) — — 66% — 45-92% — 67% —• address Algebra and functions? (1996) — — 57% — 45-82% — 58% —• address reasoning and analytical ability? (1996) — — 52% — 39-64% — 48% —
18. Increased the percentage of public school 8th graders who have computers available in their mathematics classroom? (1996) — — 30% — 7-54% — 30% —
19. Increased mathematics and science degrees awarded to • all students? (1991, 1995) — — 39% 42% !! 25-49% 15-53% 39% 42%• minority (Black, Hispanic, American Indian/Alaskan Native) students? (1991, 1995) — — 39% 40% !! 22-64% 22-57% 39% 39%• female students? (1991, 1995) — — 35% 37% !! 23-46% 13-47% 33% 36%
Mathematics and Science (continued)
Adult Literacy and Lifelong Learning
KEY
KEY
!! Significant progress
@@ Significant decline
## Change is not significant
Scorecards #2 (MO-VI) 10/30/97 12:00 PM Page 282

283
† Median is the middle score in a set of ranked scores.** Indicators are not the same at the national and state level.— Data not available. See Appendix A.• Baseline years and most recent update years may differ by state
for this indicator. See Appendix C for more information.See pages 72-75 for a Guide to Reading the State Pages.See Appendix C for technical notes and sources.
23. Reduced marijuana use? (1993) • 14% — ** ** 7-21% — 14% —24. Reduced alcohol use (more than 5 drinks in a row)? (1993) • 23% — ** ** 9-44% — 28% —25. Reduced availability of drugs on school property? (1993) • 14% — ** ** 11-31% — 22% —26. Reduced students threatened or injured with a weapon while on school property? (1993) • 15% — ** ** 6-15% — 8% —27. Reduced physical fights on school property? (1993) • 39% — ** ** 13-39% — 16% —28. Reduced students carrying weapons on school property? (1993) • 14% — ** ** 8-18% — 12% —29. Reduced students not feeling safe at school? (1993) • 23% — ** ** 3-23% — 6% —30. Reduced teacher victimization? (1994) — — 15% — 8-26% — 14% —31. Reduced student disruptions? (1991, 1994) — — 37% 46% @@ 23-60% 33-65% 37% 47%
32. Decreased schools with minimal parental involvement• Teacher’s perspective? (1991, 1994) — — ** ** 9-44% 13-50% 23% 27%• Principal’s perspective? (1991, 1994) — — ** ** 4-22% 3-27% 13% 13%
33. Increased influence of parent associations? (1991, 1994) — — ** ** 8-37% 12-50% 16% 22%
AMERICAN SAMOA
GOAL 7
GOAL 8
U.S.
baseline update progress?
American Samoa
baseline update progress?
Range of State Scores
baseline update
MedianScores†
baseline update
Safe, Disciplined and Alcohol- and Drug-free Schools
Parental Participation
KEY
KEY
!! Significant progress
@@ Significant decline
## Change is not significant
Usedmarijuana
Had 5 ormore drinks
in a row
Were offered, sold,or given an illegal drug
on school property
1
1
2
0% 20% 40% 60% 80% 100%
1993
14%
23%
14%
Alcohol- andDrug-freeSchoolsPercentage ofpublic high schoolstudents whoreported the fol-lowing(Indicators 23,24, & 25)
1 During the past 30 days.2 During the past 12 months.
Scorecards #2 (MO-VI) 10/30/97 12:00 PM Page 283

284
8. Increased reading achievement in Grade 4? (1992, 1994) • 8% 8% ## 29% 30% ## 8-38% 8-41% 26% 27%9. Increased mathematics achievement •
• in Grade 4? (1992, 1996) 5% 3% ## 18% 21% !! 5-27% 3-31% 16% 20%• in Grade 8? (1990, 1996) 4% 6% ## 15% 24% !! 1-27% 5-34% 15% 22%
10. Increased science achievement in Grade 8? (1996) 7% — 29% — 5-41% — 27% —
GUAM
† Median is the middle score in a set of ranked scores.* Comparable national data are not available.— Data not available. See Appendix A.• Baseline years and most recent update years may differ by state
for this indicator. See Appendix C for more information.See pages 72-75 for a Guide to Reading the State Pages.See Appendix C for technical notes and sources.
GOAL 1
GOAL 2
GOAL 3
Guam
baseline update progress?
Range of State Scores
baseline update
MedianScores†
baseline update
U.S.
baseline update progress?
1. Reduced percentage of infants born in the state with 1 or more health risks? (1990, 1995) 35% 37% @@ 37% 34% !! 25-48% 24-46% 38% 35%2. Increased percentage of 2-year-olds immunized? (1994, 1996) — — 75% 78% !! 61-88% 64-88% 76% 79%3. Reduced number of infants (per 1,000) born with low birthweight? (1990, 1995) 72 77 @@ 70 73 @@ 48-151 53-134 71 754. Increased number of mothers (per 1,000) receiving early prenatal care? (1990, 1995) 669 701 !! 758 813 !! 469-868 560-900 778 8285. Increased number of children with disabilities in preschool (per 1,000)? (1991, 1996) — — * * 16-68 16-92 38 47
6. Increased high school completion rate? (1990, 1995) — — 86% 86% ## 77-96% 79-96% 87% 88%7. Reduced high school dropout rate? (1992, 1994) • — — * * 3-12% 3-10% 5% 5%
Ready to Learn
School Completion
Student Achievement and Citizenship
KEY
KEY
!! Significant progress
@@ Significant decline
## Change is not significant
0%
20%
40%
60%
80%
100%
19951990
37%35%
Children’sHealth IndexPercentage ofinfants born with 1or more healthrisks1 (Indicator 1)
1 Includes late (in third trimester) or no prenatal care, low maternal weightgain (less than 21 pounds), mother smoked during pregnancy, or motherdrank alcohol during pregnancy.
Scorecards #2 (MO-VI) 10/30/97 12:00 PM Page 284

285
† Median is the middle score in a set of ranked scores.° See Table 8 for the numbers for each subject area.— Data not available. See Appendix A.∞ This information had not been released when the 1997 Goals Report
went to print.See pages 72-75 for a Guide to Reading the State Pages.See Appendix C for technical notes and sources.
11. Increased the number of Advanced Placement examinations receiving a grade of 3 or higher (per 1,000)? (1991, 1997)° — — 55 85 !! 9-177 18-223 41 65
12. Increased the percentage of public secondary school teachers who hold • a degree in main teaching assignment? (1991, 1994) — — 66% 63% @@ 51-85% 50-81% 69% 64%• a teaching certificate in main teaching assignment? (1991, 1994) — — 94% 93% @@ 91-100% 89-100% 98% 97%
13. Increased the percentage of public school teachers participating in professional development on 1 or more selected topics? (1994) — — 85% — 76-98% — 86% —
14. Increased the percentage of public school teachers with training to teach limited English-proficient students? (1994) — — 16% — 4-81% — 16% —
15. Increased the percentage of beginning public school teachers participating in a formal teacher induction program? (1991, 1994) — — 22% 27% !! 6-42% 7-48% 20% 23%
16. International comparisons in mathematics and science will be reported in future Goals Panel reports.∞ — — — — — — — —
GUAM
GOAL 3
GOAL 4
GOAL 5
U.S.
baseline update progress?
Guam
baseline update progress?
Range of State Scores
baseline update
MedianScores†
baseline update
Student Achievement and Citizenship (continued)
Teacher Education and Professional Development
Mathematics and Science
KEY
KEY
!! Significant progress
@@ Significant decline
## Change is not significant
ReadingGrade 4
MathematicsGrade 4
1996199219941992
100%
80%
60%
40%
20%
0%
8% 8%5% 3%
ns
Student AchievementPercentage of public school students who metthe Goals Panel’sperformancestandard1 in reading and mathematics (Indicators 8 & 9)
1 A complete description of the performance standard can be found inAppendix C.
nsInterpret with caution. Change was not statistically significant.
Scorecards #2 (MO-VI) 10/30/97 12:00 PM Page 285

286
20. Increased adult literacy? (1992) — — 52% — 46-77% — 53% —21. Increased the percentage of U.S. citizens
• registered to vote? (1988, 1992) — — 70% 73% !! 58-95% 63-92% 71% 75%• voting? (1988, 1992) — — 61% 66% !! 50-74% 55-77% 62% 68%
22. Increased postsecondary enrollment? (1992, 1994) — — ** ** 33-68% 37-71% 53% 55%
GUAM
† Median is the middle score in a set of ranked scores.— Data not available. See Appendix A.** Indicators are not the same at the national and state level.See pages 72-75 for a Guide to Reading the State Pages.See Appendix C for technical notes and sources.
GOAL 5
GOAL 6
Guam
baseline update progress?
Range of State Scores
baseline update
MedianScores†
baseline update
U.S.
baseline update progress?
17. Increased the percentage of public school 8th graders whose mathematics teachers • have students work in small groups? (1996) 81% — 66% — 45-92% — 67% —• address Algebra and functions? (1996) 82% — 57% — 45-82% — 58% —• address reasoning and analytical ability? (1996) 55% — 52% — 39-64% — 48% —
18. Increased the percentage of public school 8th graders who have computers available in their mathematics classroom? (1996) 8% — 30% — 7-54% — 30% —
19. Increased mathematics and science degrees awarded to • all students? (1991, 1995) 26% 15% @@ 39% 42% !! 25-49% 15-53% 39% 42%• minority (Black, Hispanic, American Indian/Alaskan Native) students? (1991, 1995) — — 39% 40% !! 22-64% 22-57% 39% 39%• female students? (1991, 1995) 24% 13% @@ 35% 37% !! 23-46% 13-47% 33% 36%
Mathematics and Science (continued)
Adult Literacy and Lifelong Learning
KEY
KEY
!! Significant progress
@@ Significant decline
## Change is not significant Addressreasoning & analytical
ability
AddressAlgebra and functions
Work insmall groups
or with apartner
0% 20% 40% 60% 80% 100%
81%
55%
82%
1
2
2
MathematicsInstructionPercentage ofpublic school 8thgraders whosemathematicsteachers do thefollowing, 1996(Indicator 17)
1 At least once a week.2 On a 4-point scale from “none” to “a lot,” defined as a response to the top point.
Scorecards #2 (MO-VI) 10/30/97 12:00 PM Page 286

287
† Median is the middle score in a set of ranked scores.** Indicators are not the same at the national and state level.— Data not available. See Appendix A.• Baseline years and most recent update years may differ by state
for this indicator. See Appendix C for more information.See pages 72-75 for a Guide to Reading the State Pages.See Appendix C for technical notes and sources.
23. Reduced marijuana use? (1995) • 19% — ** ** 7-32% — 23% —24. Reduced alcohol use (more than 5 drinks in a row)? (1995) • 15% — ** ** 13-43% — 31% —25. Reduced availability of drugs on school property? (1995) • 46% — ** ** 20-46% — 30% —26. Reduced students threatened or injured with a weapon while on school property? (1995) • 9% — ** ** 4-11% — 8% —27. Reduced physical fights on school property? (1995) • 16% — ** ** 12-19% — 15% —28. Reduced students carrying weapons on school property? (1995) • 7% — ** ** 7-14% — 11% —29. Reduced students not feeling safe at school? (1995) • 11% — ** ** 3-16% — 5% —30. Reduced teacher victimization? (1994) — — 15% — 8-26% — 14% —31. Reduced student disruptions? (1991, 1994) — — 37% 46% @@ 23-60% 33-65% 37% 47%
32. Decreased schools with minimal parental involvement• Teacher’s perspective? (1991, 1994) — — ** ** 9-44% 13-50% 23% 27%• Principal’s perspective? (1991, 1994) — — ** ** 4-22% 3-27% 13% 13%
33. Increased influence of parent associations? (1991, 1994) — — ** ** 8-37% 12-50% 16% 22%
GUAM
GOAL 7
GOAL 8
U.S.
baseline update progress?
Guam
baseline update progress?
Range of State Scores
baseline update
MedianScores†
baseline update
Safe, Disciplined and Alcohol- and Drug-free Schools
Parental Participation
KEY
KEY
!! Significant progress
@@ Significant decline
## Change is not significant
Usedmarijuana
Had 5 ormore drinks
in a row
Were offered, sold,or given an illegal drug
on school property
1
1
2
0% 20% 40% 60% 80% 100%
19931995
19%
15%
46%
Alcohol- andDrug-freeSchoolsPercentage ofpublic high schoolstudents whoreported the fol-lowing(Indicators 23,24, & 25)
1 During the past 30 days.2 During the past 12 months.
Scorecards #2 (MO-VI) 10/30/97 12:00 PM Page 287

288
8. Increased reading achievement in Grade 4? (1992, 1994) • — — 29% 30% ## 8-38% 8-41% 26% 27%9. Increased mathematics achievement •
• in Grade 4? (1992, 1996) — — 18% 21% !! 5-27% 3-31% 16% 20%• in Grade 8? (1990, 1996) — — 15% 24% !! 1-27% 5-34% 15% 22%
10. Increased science achievement in Grade 8? (1996) — — 29% — 5-41% — 27% —
NORTHERN MARIANAS
† Median is the middle score in a set of ranked scores.* Comparable national data are not available.— Data not available. See Appendix A.• Baseline years and most recent update years may differ by state
for this indicator. See Appendix C for more information.See pages 72-75 for a Guide to Reading the State Pages.See Appendix C for technical notes and sources.
GOAL 1
GOAL 2
GOAL 3
Northern Marianas
baseline update progress?
Range of State Scores
baseline update
MedianScores†
baseline update
U.S.
baseline update progress?
1. Reduced percentage of infants born in the state with 1 or more health risks? (1990, 1995) — — 37% 34% !! 25-48% 24-46% 38% 35%2. Increased percentage of 2-year-olds immunized? (1994, 1996) — — 75% 78% !! 61-88% 64-88% 76% 79%3. Reduced number of infants (per 1,000) born with low birthweight? (1990, 1995) — — 70 73 @@ 48-151 53-134 71 754. Increased number of mothers (per 1,000) receiving early prenatal care? (1990, 1995) — — 758 813 !! 469-868 560-900 778 8285. Increased number of children with disabilities in preschool (per 1,000)? (1991, 1996) — — * * 16-68 16-92 38 47
6. Increased high school completion rate? (1990, 1995) — — 86% 86% ## 77-96% 79-96% 87% 88%7. Reduced high school dropout rate? (1992, 1994) • — — * * 3-12% 3-10% 5% 5%
Ready to Learn
School Completion
Student Achievement and Citizenship
KEY
KEY
!! Significant progress
@@ Significant decline
## Change is not significant
Scorecards #2 (MO-VI) 10/30/97 12:00 PM Page 288

289
† Median is the middle score in a set of ranked scores.° See Table 8 for the numbers for each subject area.— Data not available. See Appendix A.∞ This information had not been released when the 1997 Goals Report
went to print.See pages 72-75 for a Guide to Reading the State Pages.See Appendix C for technical notes and sources.
11. Increased the number of Advanced Placement examinations receiving a grade of 3 or higher (per 1,000)? (1991, 1997)° — — 55 85 !! 9-177 18-223 41 65
12. Increased the percentage of public secondary school teachers who hold • a degree in main teaching assignment? (1991, 1994) — — 66% 63% @@ 51-85% 50-81% 69% 64%• a teaching certificate in main teaching assignment? (1991, 1994) — — 94% 93% @@ 91-100% 89-100% 98% 97%
13. Increased the percentage of public school teachers participating in professional development on 1 or more selected topics? (1994) — — 85% — 76-98% — 86% —
14. Increased the percentage of public school teachers with training to teach limited English-proficient students? (1994) — — 16% — 4-81% — 16% —
15. Increased the percentage of beginning public school teachers participating in a formal teacher induction program? (1991, 1994) — — 22% 27% !! 6-42% 7-48% 20% 23%
16. International comparisons in mathematics and science will be reported in future Goals Panel reports.∞ — — — — — — — —
NORTHERN MARIANAS
GOAL 3
GOAL 4
GOAL 5
U.S.
baseline update progress?
Northern Marianas
baseline update progress?
Range of State Scores
baseline update
MedianScores†
baseline update
Student Achievement and Citizenship (continued)
Teacher Education and Professional Development
Mathematics and Science
KEY
KEY
!! Significant progress
@@ Significant decline
## Change is not significant
Scorecards #2 (MO-VI) 10/30/97 12:00 PM Page 289

290
20. Increased adult literacy? (1992) — — 52% — 46-77% — 53% —21. Increased the percentage of U.S. citizens
• registered to vote? (1988, 1992) — — 70% 73% !! 58-95% 63-92% 71% 75%• voting? (1988, 1992) — — 61% 66% !! 50-74% 55-77% 62% 68%
22. Increased postsecondary enrollment? (1992, 1994) — — ** ** 33-68% 37-71% 53% 55%
NORTHERN MARIANAS
† Median is the middle score in a set of ranked scores.— Data not available. See Appendix A.** Indicators are not the same at the national and state level.See pages 72-75 for a Guide to Reading the State Pages.See Appendix C for technical notes and sources.
GOAL 5
GOAL 6
Northern Marianas
baseline update progress?
Range of State Scores
baseline update
MedianScores†
baseline update
U.S.
baseline update progress?
17. Increased the percentage of public school 8th graders whose mathematics teachers • have students work in small groups? (1996) — — 66% — 45-92% — 67% —• address Algebra and functions? (1996) — — 57% — 45-82% — 58% —• address reasoning and analytical ability? (1996) — — 52% — 39-64% — 48% —
18. Increased the percentage of public school 8th graders who have computers available in their mathematics classroom? (1996) — — 30% — 7-54% — 30% —
19. Increased mathematics and science degrees awarded to • all students? (1991, 1995) — — 39% 42% !! 25-49% 15-53% 39% 42%• minority (Black, Hispanic, American Indian/Alaskan Native) students? (1991, 1995) — — 39% 40% !! 22-64% 22-57% 39% 39%• female students? (1991, 1995) — — 35% 37% !! 23-46% 13-47% 33% 36%
Mathematics and Science (continued)
Adult Literacy and Lifelong Learning
KEY
KEY
!! Significant progress
@@ Significant decline
## Change is not significant
Scorecards #2 (MO-VI) 10/30/97 12:00 PM Page 290

291
† Median is the middle score in a set of ranked scores.** Indicators are not the same at the national and state level.— Data not available. See Appendix A.• Baseline years and most recent update years may differ by state
for this indicator. See Appendix C for more information.See pages 72-75 for a Guide to Reading the State Pages.See Appendix C for technical notes and sources.
23. Reduced marijuana use? (1991, 1995) • — — ** ** 4-18% 7-32% 10% 23%24. Reduced alcohol use (more than 5 drinks in a row)? (1991, 1995) • — — ** ** 17-43% 13-43% 30% 31%25. Reduced availability of drugs on school property? (1993, 1995) • — — ** ** 11-31% 20-46% 22% 30%26. Reduced students threatened or injured with a weapon while on school property? (1993, 1995) • — — ** ** 6-15% 4-11% 8% 8%27. Reduced physical fights on school property? (1993, 1995) • — — ** ** 13-39% 12-19% 16% 15%28. Reduced students carrying weapons on school property? (1993, 1995) • — — ** ** 8-18% 7-14% 12% 11%29. Reduced students not feeling safe at school? (1993, 1995) • — — ** ** 3-23% 3-16% 6% 5%30. Reduced teacher victimization? (1994) — — 15% — 8-26% — 14% —31. Reduced student disruptions? (1991, 1994) — — 37% 46% @@ 23-60% 33-65% 37% 47%
32. Decreased schools with minimal parental involvement• Teacher’s perspective? (1991, 1994) — — ** ** 9-44% 13-50% 23% 27%• Principal’s perspective? (1991, 1994) — — ** ** 4-22% 3-27% 13% 13%
33. Increased influence of parent associations? (1991, 1994) — — ** ** 8-37% 12-50% 16% 22%
NORTHERN MARIANAS
GOAL 7
GOAL 8
U.S.
baseline update progress?
Northern Marianas
baseline update progress?
Range of State Scores
baseline update
MedianScores†
baseline update
Safe, Disciplined and Alcohol- and Drug-free Schools
Parental Participation
KEY
KEY
!! Significant progress
@@ Significant decline
## Change is not significant
Scorecards #2 (MO-VI) 10/30/97 12:00 PM Page 291

292
8. Increased reading achievement in Grade 4? (1992, 1994) • — — 29% 30% ## 8-38% 8-41% 26% 27%9. Increased mathematics achievement •
• in Grade 4? (1992, 1996) — — 18% 21% !! 5-27% 3-31% 16% 20%• in Grade 8? (1990, 1996) — — 15% 24% !! 1-27% 5-34% 15% 22%
10. Increased science achievement in Grade 8? (1996) — — 29% — 5-41% — 27% —
PUERTO RICO
† Median is the middle score in a set of ranked scores.* Comparable national data are not available.— Data not available. See Appendix A.• Baseline years and most recent update years may differ by state
for this indicator. See Appendix C for more information.See pages 72-75 for a Guide to Reading the State Pages.See Appendix C for technical notes and sources.
GOAL 1
GOAL 2
GOAL 3
Puerto Rico
baseline update progress?
Range of State Scores
baseline update
MedianScores†
baseline update
U.S.
baseline update progress?
1. Reduced percentage of infants born in the state with 1 or more health risks? (1990, 1995) 48% 46% !! 37% 34% !! 25-48% 24-46% 38% 35%2. Increased percentage of 2-year-olds immunized? (1994, 1996) — — 75% 78% !! 61-88% 64-88% 76% 79%3. Reduced number of infants (per 1,000) born with low birthweight? (1990, 1995) 91 101 @@ 70 73 @@ 48-151 53-134 71 754. Increased number of mothers (per 1,000) receiving early prenatal care? (1990, 1995) 711 770 !! 758 813 !! 469-868 560-900 778 8285. Increased number of children with disabilities in preschool (per 1,000)? (1991, 1996) — — * * 16-68 16-92 38 47
6. Increased high school completion rate? (1990, 1995) — — 86% 86% ## 77-96% 79-96% 87% 88%7. Reduced high school dropout rate? (1992, 1994) • — — * * 3-12% 3-10% 5% 5%
Ready to Learn
School Completion
Student Achievement and Citizenship
KEY
KEY
!! Significant progress
@@ Significant decline
## Change is not significant
0%
20%
40%
60%
80%
100%
19951990
46%48%
Children’sHealth IndexPercentage ofinfants born with 1or more healthrisks1 (Indicator 1)
1 Includes late (in third trimester) or no prenatal care, low maternal weightgain (less than 21 pounds), mother smoked during pregnancy, or motherdrank alcohol during pregnancy.
Scorecards #2 (MO-VI) 10/30/97 12:00 PM Page 292

293
† Median is the middle score in a set of ranked scores.° See Table 8 for the numbers for each subject area.— Data not available. See Appendix A.∞ This information had not been released when the 1997 Goals Report
went to print.See pages 72-75 for a Guide to Reading the State Pages.See Appendix C for technical notes and sources.
11. Increased the number of Advanced Placement examinations receiving a grade of 3 or higher (per 1,000)? (1991, 1997)° — — 55 85 !! 9-177 18-223 41 65
12. Increased the percentage of public secondary school teachers who hold • a degree in main teaching assignment? (1991, 1994) — — 66% 63% @@ 51-85% 50-81% 69% 64%• a teaching certificate in main teaching assignment? (1991, 1994) — — 94% 93% @@ 91-100% 89-100% 98% 97%
13. Increased the percentage of public school teachers participating in professional development on 1 or more selected topics? (1994) — — 85% — 76-98% — 86% —
14. Increased the percentage of public school teachers with training to teach limited English-proficient students? (1994) — — 16% — 4-81% — 16% —
15. Increased the percentage of beginning public school teachers participating in a formal teacher induction program? (1991, 1994) — — 22% 27% !! 6-42% 7-48% 20% 23%
16. International comparisons in mathematics and science will be reported in future Goals Panel reports.∞ — — — — — — — —
PUERTO RICO
GOAL 3
GOAL 4
GOAL 5
U.S.
baseline update progress?
Puerto Rico
baseline update progress?
Range of State Scores
baseline update
MedianScores†
baseline update
Student Achievement and Citizenship (continued)
Teacher Education and Professional Development
Mathematics and Science
KEY
KEY
!! Significant progress
@@ Significant decline
## Change is not significant
Scorecards #2 (MO-VI) 10/30/97 12:00 PM Page 293

294
20. Increased adult literacy? (1992) — — 52% — 46-77% — 53% —21. Increased the percentage of U.S. citizens
• registered to vote? (1988, 1992) — — 70% 73% !! 58-95% 63-92% 71% 75%• voting? (1988, 1992) — — 61% 66% !! 50-74% 55-77% 62% 68%
22. Increased postsecondary enrollment? (1992, 1994) — — ** ** 33-68% 37-71% 53% 55%
PUERTO RICO
† Median is the middle score in a set of ranked scores.— Data not available. See Appendix A.** Indicators are not the same at the national and state level.See pages 72-75 for a Guide to Reading the State Pages.See Appendix C for technical notes and sources.
GOAL 5
GOAL 6
Puerto Rico
baseline update progress?
Range of State Scores
baseline update
MedianScores†
baseline update
U.S.
baseline update progress?
17. Increased the percentage of public school 8th graders whose mathematics teachers • have students work in small groups? (1996) — — 66% — 45-92% — 67% —• address Algebra and functions? (1996) — — 57% — 45-82% — 58% —• address reasoning and analytical ability? (1996) — — 52% — 39-64% — 48% —
18. Increased the percentage of public school 8th graders who have computers available in their mathematics classroom? (1996) — — 30% — 7-54% — 30% —
19. Increased mathematics and science degrees awarded to • all students? (1991, 1995) 31% 32% !! 39% 42% !! 25-49% 15-53% 39% 42%• minority (Black, Hispanic, American Indian/Alaskan Native) students? (1991, 1995) 31% 32% !! 39% 40% !! 22-64% 22-57% 39% 39%• female students? (1991, 1995) 29% 29% ## 35% 37% !! 23-46% 13-47% 33% 36%
Mathematics and Science (continued)
Adult Literacy and Lifelong Learning
KEY
KEY
!! Significant progress
@@ Significant decline
## Change is not significant
Scorecards #2 (MO-VI) 10/30/97 12:00 PM Page 294

295
† Median is the middle score in a set of ranked scores.** Indicators are not the same at the national and state level.— Data not available. See Appendix A.• Baseline years and most recent update years may differ by state
for this indicator. See Appendix C for more information.See pages 72-75 for a Guide to Reading the State Pages.See Appendix C for technical notes and sources.
23. Reduced marijuana use? (1991, 1995) • 4% 7% @@ ** ** 4-18% 7-32% 10% 23%24. Reduced alcohol use (more than 5 drinks in a row)? (1991, 1995) • 18% 20% ## ** ** 17-43% 13-43% 30% 31%25. Reduced availability of drugs on school property? (1995) • 21% — ** ** 20-46% — 30% —26. Reduced students threatened or injured with a weapon while on school property? (1995) • 4% — ** ** 4-11% — 8% —27. Reduced physical fights on school property? (1995) • 15% — ** ** 12-19% — 15% —28. Reduced students carrying weapons on school property? (1995) • 7% — ** ** 7-14% — 11% —29. Reduced students not feeling safe at school? (1995) • 16% — ** ** 3-16% — 5% —30. Reduced teacher victimization? (1994) — — 15% — 8-26% — 14% —31. Reduced student disruptions? (1991, 1994) — — 37% 46% @@ 23-60% 33-65% 37% 47%
32. Decreased schools with minimal parental involvement• Teacher’s perspective? (1991, 1994) — — ** ** 9-44% 13-50% 23% 27%• Principal’s perspective? (1991, 1994) — — ** ** 4-22% 3-27% 13% 13%
33. Increased influence of parent associations? (1991, 1994) — — ** ** 8-37% 12-50% 16% 22%
PUERTO RICO
GOAL 7
GOAL 8
U.S.
baseline update progress?
Puerto Rico
baseline update progress?
Range of State Scores
baseline update
MedianScores†
baseline update
Safe, Disciplined and Alcohol- and Drug-free Schools
Parental Participation
KEY
KEY
!! Significant progress
@@ Significant decline
## Change is not significant
Usedmarijuana
Had 5 ormore drinks
in a row
Were offered, sold,or given an illegal drug
on school property
1
1
2
0% 20% 40% 60% 80% 100%
1991 19931995
7%
4%
18%
20%
21%
ns
Alcohol- andDrug-freeSchoolsPercentage ofpublic high schoolstudents whoreported the fol-lowing(Indicators 23,24, & 25)
1 During the past 30 days.2 During the past 12 months.nsInterpret with caution. Change was not statistically significant.
Scorecards #2 (MO-VI) 10/30/97 12:00 PM Page 295

296
8. Increased reading achievement in Grade 4? (1992, 1994) • — — 29% 30% ## 8-38% 8-41% 26% 27%9. Increased mathematics achievement •
• in Grade 4? (1992, 1996) — — 18% 21% !! 5-27% 3-31% 16% 20%• in Grade 8? (1990, 1992) 1% 1% ## 15% 21% !! 1-27% 1-31% 15% 18%
10. Increased science achievement in Grade 8? (1996) — — 29% — 5-41% — 27% —
VIRGIN ISLANDS
† Median is the middle score in a set of ranked scores.* Comparable national data are not available.— Data not available. See Appendix A.• Baseline years and most recent update years may differ by state
for this indicator. See Appendix C for more information.See pages 72-75 for a Guide to Reading the State Pages.See Appendix C for technical notes and sources.
GOAL 1
GOAL 2
GOAL 3
Virgin Islands
baseline update progress?
Range of State Scores
baseline update
MedianScores†
baseline update
U.S.
baseline update progress?
1. Reduced percentage of infants born in the state with 1 or more health risks? (1990, 1995) — — 37% 34% !! 25-48% 24-46% 38% 35%2. Increased percentage of 2-year-olds immunized? (1994, 1996) — — 75% 78% !! 61-88% 64-88% 76% 79%3. Reduced number of infants (per 1,000) born with low birthweight? (1990, 1995) 93 94 @@ 70 73 @@ 48-151 53-134 71 754. Increased number of mothers (per 1,000) receiving early prenatal care? (1990, 1995) 469 560 !! 758 813 !! 469-868 560-900 778 8285. Increased number of children with disabilities in preschool (per 1,000)? (1991, 1996) — — * * 16-68 16-92 38 47
6. Increased high school completion rate? (1990, 1995) — — 86% 86% ## 77-96% 79-96% 87% 88%7. Reduced high school dropout rate? (1992, 1994) • — — * * 3-12% 3-10% 5% 5%
Ready to Learn
School Completion
Student Achievement and Citizenship
KEY
KEY
!! Significant progress
@@ Significant decline
## Change is not significant
Scorecards #2 (MO-VI) 10/30/97 12:00 PM Page 296
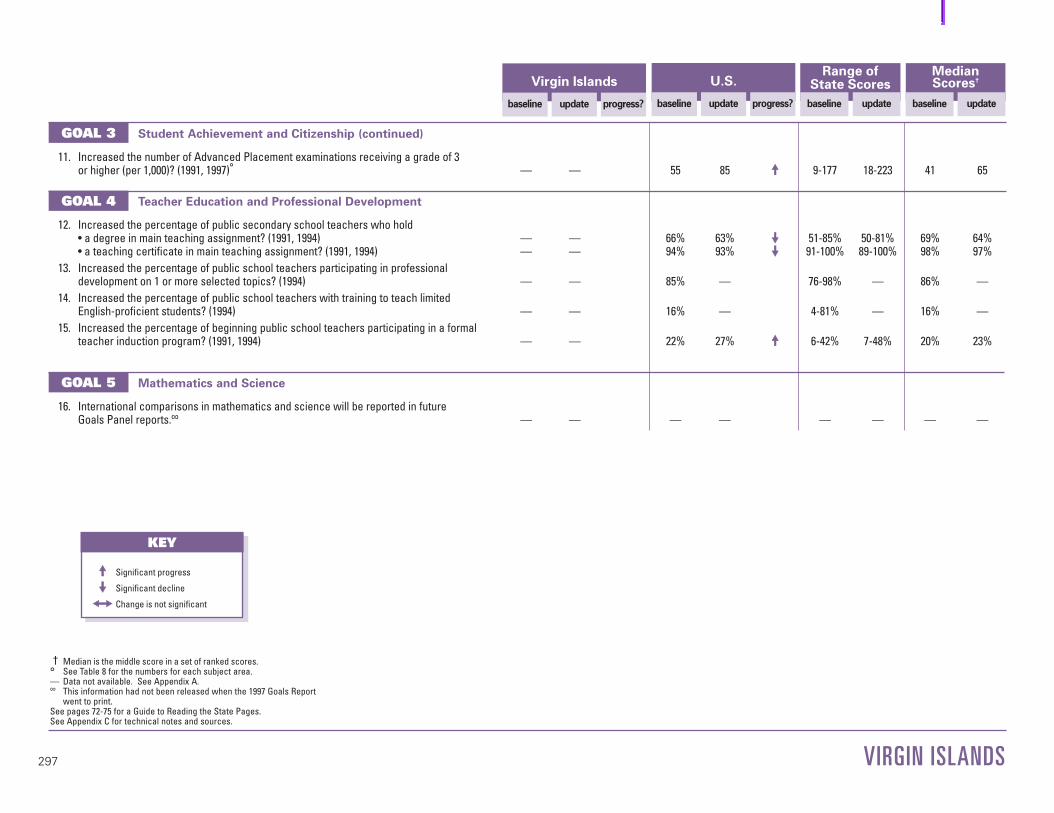
297
† Median is the middle score in a set of ranked scores.° See Table 8 for the numbers for each subject area.— Data not available. See Appendix A.∞ This information had not been released when the 1997 Goals Report
went to print.See pages 72-75 for a Guide to Reading the State Pages.See Appendix C for technical notes and sources.
11. Increased the number of Advanced Placement examinations receiving a grade of 3 or higher (per 1,000)? (1991, 1997)° — — 55 85 !! 9-177 18-223 41 65
12. Increased the percentage of public secondary school teachers who hold • a degree in main teaching assignment? (1991, 1994) — — 66% 63% @@ 51-85% 50-81% 69% 64%• a teaching certificate in main teaching assignment? (1991, 1994) — — 94% 93% @@ 91-100% 89-100% 98% 97%
13. Increased the percentage of public school teachers participating in professional development on 1 or more selected topics? (1994) — — 85% — 76-98% — 86% —
14. Increased the percentage of public school teachers with training to teach limited English-proficient students? (1994) — — 16% — 4-81% — 16% —
15. Increased the percentage of beginning public school teachers participating in a formal teacher induction program? (1991, 1994) — — 22% 27% !! 6-42% 7-48% 20% 23%
16. International comparisons in mathematics and science will be reported in future Goals Panel reports.∞ — — — — — — — —
VIRGIN ISLANDS
GOAL 3
GOAL 4
GOAL 5
U.S.
baseline update progress?
Virgin Islands
baseline update progress?
Range of State Scores
baseline update
MedianScores†
baseline update
Student Achievement and Citizenship (continued)
Teacher Education and Professional Development
Mathematics and Science
KEY
KEY
!! Significant progress
@@ Significant decline
## Change is not significant
Scorecards #2 (MO-VI) 10/30/97 12:00 PM Page 297

298
20. Increased adult literacy? (1992) — — 52% — 46-77% — 53% —21. Increased the percentage of U.S. citizens
• registered to vote? (1988, 1992) — — 70% 73% !! 58-95% 63-92% 71% 75%• voting? (1988, 1992) — — 61% 66% !! 50-74% 55-77% 62% 68%
22. Increased postsecondary enrollment? (1992, 1994) — — ** ** 33-68% 37-71% 53% 55%
VIRGIN ISLANDS
† Median is the middle score in a set of ranked scores.— Data not available. See Appendix A.** Indicators are not the same at the national and state level.See pages 72-75 for a Guide to Reading the State Pages.See Appendix C for technical notes and sources.
GOAL 5
GOAL 6
Virgin Islands
baseline update progress?
Range of State Scores
baseline update
MedianScores†
baseline update
U.S.
baseline update progress?
17. Increased the percentage of public school 8th graders whose mathematics teachers • have students work in small groups? (1996) — — 66% — 45-92% — 67% —• address Algebra and functions? (1996) — — 57% — 45-82% — 58% —• address reasoning and analytical ability? (1996) — — 52% — 39-64% — 48% —
18. Increased the percentage of public school 8th graders who have computers available in their mathematics classroom? (1996) — — 30% — 7-54% — 30% —
19. Increased mathematics and science degrees awarded to • all students? (1991, 1995) 25% 25% ## 39% 42% !! 25-49% 15-53% 39% 42%• minority (Black, Hispanic, American Indian/Alaskan Native) students? (1991, 1995) 23% 22% @@ 39% 40% !! 22-64% 22-57% 39% 39%• female students? (1991, 1995) 23% 13% @@ 35% 37% !! 23-46% 13-47% 33% 36%
Mathematics and Science (continued)
Adult Literacy and Lifelong Learning
KEY
KEY
!! Significant progress
@@ Significant decline
## Change is not significant
Scorecards #2 (MO-VI) 10/30/97 12:00 PM Page 298
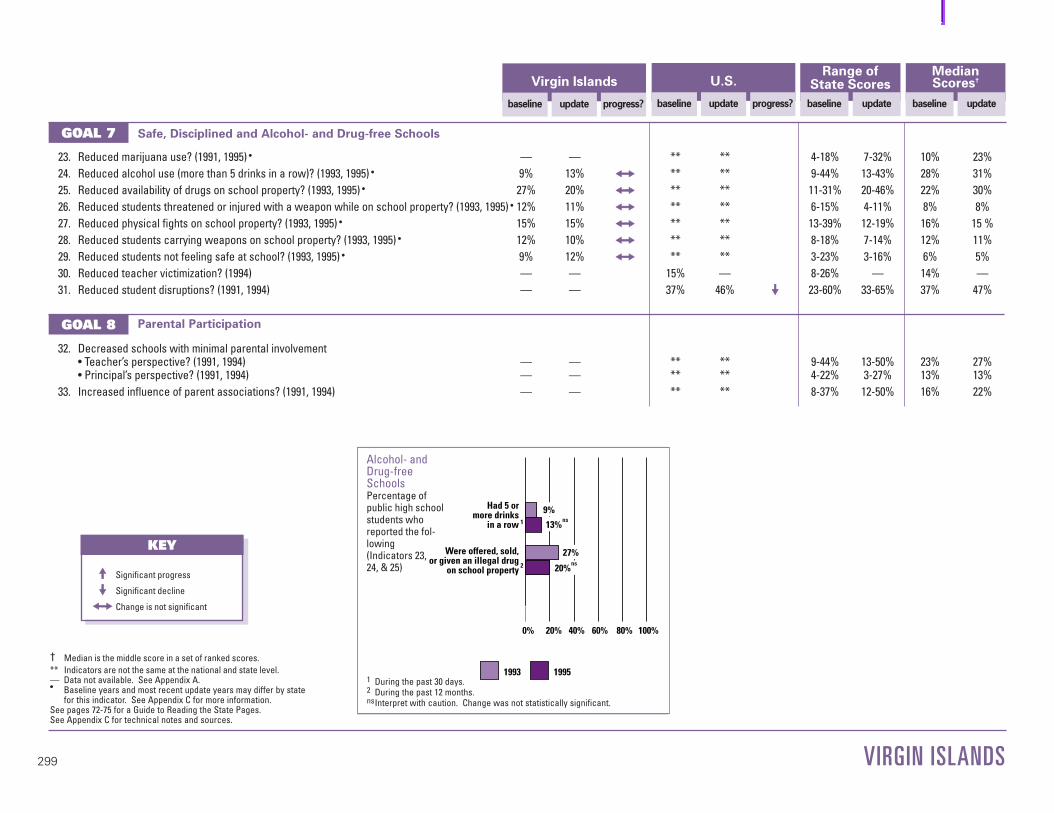
299
† Median is the middle score in a set of ranked scores.** Indicators are not the same at the national and state level.— Data not available. See Appendix A.• Baseline years and most recent update years may differ by state
for this indicator. See Appendix C for more information.See pages 72-75 for a Guide to Reading the State Pages.See Appendix C for technical notes and sources.
23. Reduced marijuana use? (1991, 1995) • — — ** ** 4-18% 7-32% 10% 23%24. Reduced alcohol use (more than 5 drinks in a row)? (1993, 1995) • 9% 13% ## ** ** 9-44% 13-43% 28% 31%25. Reduced availability of drugs on school property? (1993, 1995) • 27% 20% ## ** ** 11-31% 20-46% 22% 30%26. Reduced students threatened or injured with a weapon while on school property? (1993, 1995) • 12% 11% ## ** ** 6-15% 4-11% 8% 8%27. Reduced physical fights on school property? (1993, 1995) • 15% 15% ## ** ** 13-39% 12-19% 16% 15 %28. Reduced students carrying weapons on school property? (1993, 1995) • 12% 10% ## ** ** 8-18% 7-14% 12% 11%29. Reduced students not feeling safe at school? (1993, 1995) • 9% 12% ## ** ** 3-23% 3-16% 6% 5%30. Reduced teacher victimization? (1994) — — 15% — 8-26% — 14% —31. Reduced student disruptions? (1991, 1994) — — 37% 46% @@ 23-60% 33-65% 37% 47%
32. Decreased schools with minimal parental involvement• Teacher’s perspective? (1991, 1994) — — ** ** 9-44% 13-50% 23% 27%• Principal’s perspective? (1991, 1994) — — ** ** 4-22% 3-27% 13% 13%
33. Increased influence of parent associations? (1991, 1994) — — ** ** 8-37% 12-50% 16% 22%
VIRGIN ISLANDS
GOAL 7
GOAL 8
U.S.
baseline update progress?
Virgin Islands
baseline update progress?
Range of State Scores
baseline update
MedianScores†
baseline update
Safe, Disciplined and Alcohol- and Drug-free Schools
Parental Participation
KEY
KEY
!! Significant progress
@@ Significant decline
## Change is not significant
UsedmarijuanaHad 5 or
more drinksin a row
Were offered, sold,or given an illegal drug
on school property
1
2
1
0% 20% 40% 60% 80% 100%
19911993 1995
9%
13%
27%
20%
ns
ns
Alcohol- andDrug-freeSchoolsPercentage ofpublic high schoolstudents whoreported the fol-lowing(Indicators 23,24, & 25)
1 During the past 30 days.2 During the past 12 months.nsInterpret with caution. Change was not statistically significant.
Scorecards #2 (MO-VI) 10/30/97 12:00 PM Page 299

Table 8:
Advanced Placement (AP) PerformanceNumber of AP examinations receiving a grade of 3 or higher (per 1,000 11th and 12th graders): (1991, 1997)
English
baseline update
Mathematics
baseline update
Science
baseline update
ForeignLanguages
baseline update
Civics &Government
baseline update
Economics
baseline update
Fine Arts
baseline update
History
baseline update
Note: Due to rounding, the numbers in the table may not add to the total number of AP examinations reported in Indicator 11.
Alabama 12 16 4 7 3 7 1 1 2 5 1 3 1 1 7 10
Alaska 21 26 10 13 6 7 1 1 5 6 4 4 2 2 9 8
Arizona 12 16 7 8 6 9 4 7 4 7 1 2 1 2 7 10
Arkansas 6 12 3 4 2 4 <1 <1 <1 1 0 <1 <1 1 3 6
California 23 31 14 18 12 19 14 22 6 10 2 5 2 4 16 21
Colorado 23 28 12 13 12 14 6 7 1 2 <1 2 1 1 17 20
Connecticut 21 34 15 20 16 28 10 14 1 2 3 6 2 3 16 25
Delaware 18 30 14 20 13 22 5 7 4 4 <1 1 <1 2 19 22
District of Columbia 29 44 27 35 34 49 26 27 10 9 4 7 4 6 43 46
Florida 23 31 12 12 10 13 10 11 5 5 2 4 4 4 16 16
Georgia 16 23 8 10 6 13 1 2 3 5 <1 3 1 2 14 16
Hawaii 22 25 19 18 16 22 2 2 3 3 5 4 1 1 18 16
Idaho 11 12 6 6 5 8 <1 1 2 4 <1 <1 <1 1 4 8
Illinois 14 23 12 18 12 20 5 7 3 4 2 4 1 1 12 16
Indiana 5 14 6 9 5 9 1 1 1 1 1 1 <1 <1 3 3
Iowa 8 13 3 7 2 4 <1 1 1 2 1 2 <1 <1 3 5
Kansas 8 10 4 5 2 3 1 1 2 3 <1 <1 <1 <1 4 6
Kentucky 10 15 5 8 4 7 1 2 1 2 <1 <1 <1 1 8 11
300
Chapter 3 10/30/97 12:13 PM Page 300

English
baseline update
Mathematics
baseline update
Science
baseline update
ForeignLanguages
baseline update
Civics &Government
baseline update
Economics
baseline update
Fine Arts
baseline update
History
baseline update
Note: Due to rounding, the numbers in the table may not add to the total number of AP examinations reported in Indicator 11.
Louisiana 7 10 3 3 2 3 1 1 1 1 <1 <1 <1 <1 4 5
Maine 15 29 5 12 6 14 2 3 1 2 1 2 1 2 7 16
Maryland 22 36 15 23 15 26 8 9 4 6 1 3 2 3 22 26
Massachusetts 21 36 16 23 14 27 9 14 1 2 2 3 2 3 17 28
Michigan 14 22 9 12 7 15 2 3 2 4 <1 1 1 1 7 10
Minnesota 7 14 5 11 2 5 1 2 2 2 1 2 <1 1 5 8
Mississippi 8 13 2 3 2 3 <1 <1 1 2 0 <1 <1 <1 4 4
Missouri 7 10 4 6 3 7 1 2 1 2 <1 1 <1 1 6 8
Montana 9 16 2 5 2 5 <1 1 3 6 0 <1 2 1 9 8
Nebraska 10 12 3 5 2 4 <1 <1 1 1 1 1 <1 <1 8 8
Nevada 13 19 6 8 4 6 3 4 6 9 <1 1 <1 1 6 9
New Hampshire 15 25 13 17 8 17 4 6 1 2 <1 <1 1 1 9 15
New Jersey 20 35 16 22 16 32 7 11 2 4 2 4 1 3 17 27
New Mexico 15 18 9 7 6 7 4 4 1 2 1 0 1 1 6 5
New York 22 31 18 22 20 33 9 13 4 7 2 4 2 3 21 31
North Carolina 16 32 9 16 7 18 2 4 <1 2 <1 <1 1 2 13 26
North Dakota 5 7 3 3 3 5 <1 <1 <1 1 1 1 0 <1 2 2
Ohio 11 18 6 11 5 10 2 3 2 5 1 1 1 1 8 11
Oklahoma 8 12 4 5 3 6 1 1 1 3 <1 1 <1 1 3 5
Oregon 13 16 6 7 5 8 2 3 1 1 1 2 <1 <1 11 10
Pennsylvania 14 21 8 12 7 12 2 3 2 3 1 2 <1 1 10 15
301
Chapter 3 10/30/97 12:13 PM Page 301

Rhode Island 18 24 10 9 7 13 4 6 1 2 1 2 1 2 15 20
South Carolina 21 31 14 17 12 16 1 1 2 4 1 2 3 5 16 19
South Dakota 3 10 2 4 1 5 0 <1 <1 2 0 <1 <1 <1 2 5
Tennessee 14 18 7 10 6 10 1 2 2 3 1 1 2 2 10 15
Texas 13 32 6 9 4 9 3 8 2 5 2 4 <1 2 4 9
Utah 33 40 23 25 22 26 3 3 6 7 1 2 9 14 36 35
Vermont 18 25 9 9 9 18 4 4 0 <1 0 0 1 1 10 11
Virginia 25 33 16 20 12 22 8 10 16 30 1 2 2 4 21 28
Washington 13 17 7 10 3 6 2 2 1 2 <1 <1 <1 <1 9 11
West Virginia 9 20 4 6 3 5 <1 <1 <1 1 <1 <1 1 1 3 6
Wisconsin 7 21 6 12 4 10 1 2 1 3 1 5 <1 1 5 11
Wyoming 9 6 7 7 1 2 <1 1 1 1 0 <1 0 1 1 1
American Samoa — — — — — — — — — — — — — — — —
Guam — — — — — — — — — — — — — — — —
Northern Marianas — — — — — — — — — — — — — — — —
Puerto Rico — — — — — — — — — — — — — — — —
Virgin Islands — — — — — — — — — — — — — — — —
U.S. 16 24 10 13 9 15 5 7 3 5 1 3 1 2 11 16
Range of State Scores 3-33 6-44 2-27 3-35 1-34 2-49 0-26 <1-27 0-16 <1-30 0-5 0-7 0-9 <1-14 1-43 1-46
Median Scores 14 21 7 10 6 10 2 3 2 3 1 2 1 1 9 11
English
baseline update
Mathematics
baseline update
Science
baseline update
ForeignLanguages
baseline update
Civics &Government
baseline update
Economics
baseline update
Fine Arts
baseline update
History
baseline update
Note: Due to rounding, the numbers in the table may not add to the total number of AP examinations reported in Indicator 11.— Data not available.
Table 8: (continued)
302
Chapter 3 10/30/97 12:13 PM Page 302

303
2000
1997
Appendices
Appendix A, B, C, D 10/30/97 12:14 PM Page 303

304
Appendix A, B, C, D 10/30/97 12:14 PM Page 304

305
Appendix A:
Data Collection Schedules
Appendix A, B, C, D 10/30/97 12:14 PM Page 305

306
Table A-1Data Collection Schedule for Core Indicators at the National Level
1
Indicator 1990 ‘91 ‘92 ‘93 ‘94 ‘95 ‘96 ‘97 ‘98 ‘99 2000
1. Children’s Health Index X X X X X X X X X X X
2. Immunizations X X X X X X X
3. Family-Child Reading and Storytelling X X X X
4. Preschool Participation X X X X X
5. High School Completion X X X X X X X X X X X
6. Reading Achievement2 X X X X
7. Writing Achievement2,3 X X X
8. Mathematics Achievement2 X X X X
9. Science Achievement2 X X X
10. History Achievement2 X
11. Geography Achievement2 X
12. Teacher Preparation X X X
13. Teacher ProfessionalDevelopment X X
14. International Mathematics Achievement4 X X
15. International Science Achievement4 X X
16. Mathematics and Science Degrees X X X X X X X X X X
17. Adult Literacy X
18. Participation in Adult Education X X X
19. Participation in Higher Education
College Enrollment X X X X X X X X X X XCollege Completion X X X X X X X X X
20. Overall Student Drug and Alcohol Use
Drugs X X X X X X X X X XAlcohol X X X X X X X X
Appendix A, B, C, D 10/30/97 12:14 PM Page 306

307
Table A-1 (continued)Data Collection Schedule for Core Indicators at the National Level
1
Indicator 1990 ‘91 ‘92 ‘93 ‘94 ‘95 ‘96 ‘97 ‘98 ‘99 2000
21. Sale of Drugs at School X X X X X X X X X
22. Student and Teacher Victimization(student, teacher reports) S,T S S S,T S S S S S S,T
23. Disruptions in Class by Students (student, teacher reports) T S S S,T S S S S S S,T
24. Schools’ Reports of Parent Attendance at Parent-Teacher Conferences X
25. Schools’ Reports of Parent Involvement in School Policy Decisions X
26. Parents’ Reports of TheirInvolvement in School Activities X X X
1 Table prepared August 1997.2 The National Assessment of Educational Progress (NAEP) is administered in Grades 4, 8, and 12. Student achievement levels have been
established for the reading (1992, 1994), mathematics (1990, 1992, 1996), science (1996), history (1994), and geography (1994) assessments.An arts assessment that covers four subject areas was administered in 1997 for Grade 8 only. Assessments scheduled for 1998 havebeen approved. These include reading, writing, and civics. Preliminary decisions have been made for 2000, subject to continuing legisla-tive authority. Assessments proposed for 2000 include mathematics and science. There are no current plans to administer NAEP assess-ments in foreign languages or economics by the year 2000.
3 In 1990 and 1992, student achievement levels were not established. However, in 1992, a Writing Portfolio Study was conducted. Thesedata are presented in Exhibit 7.
4 International achievement results for Grade 12 had not been released when the 1997 Goals Report went to print. There are plans to collect data on international mathematics and science achievement of 8th graders again in 1999.
This table updates information presented in the 1996 Goals Report.
Appendix A, B, C, D 10/30/97 12:14 PM Page 307

308
Table A-2Data Collection Schedule for Indicators at the State Level
1
Indicator 1990 ‘91 ‘92 ‘93 ‘94 ‘95 ‘96 ‘97 ‘98 ‘99 2000
1. Children’s Health Index X X X X X X X X X X X
2. Immunizations X X X X X X X
3. Low Birthweight X X X X X X X X X X X
4. Early Prenatal Care X X X X X X X X X X X
5. Preschool Programs for Children with Disabilities X X X X X X X X X X
6. High School Completion X X X X X X X X X X X
7. High School Dropout Rates X X X X X X X X X
8. Reading Achievement2
Grade 4 X X XGrade 8 X
9. Mathematics Achievement2
Grade 4 X X XGrade 8 X X X X
10. Science Achievement2
Grade 4 XGrade 8 X X
11. Advanced Placement Performance X X X X X X X X X X
12. Teacher Preparation X X X
13. Teacher ProfessionalDevelopment X X
14. Preparation to Teach Limited English Proficient Students X X
15. Teacher Support X X X
16. International Mathematics and Science Achievement X
17. Mathematics Instructional Practices X X
18. Mathematics Resources X X
Appendix A, B, C, D 10/30/97 12:14 PM Page 308

Table A-2 (continued)Data Collection Schedule for Indicators at the State Level
1
Indicator 1990 ‘91 ‘92 ‘93 ‘94 ‘95 ‘96 ‘97 ‘98 ‘99 2000
19. Mathematics andScience Degrees X X X X X X X X X X
20. Adult Literacy X
21. Voter Registration and Voting X X X
22. Participation in Higher Education X X X X X
23. Student Marijuana Use X X X X X
24. Student Alcohol Use X X X X X
25. Availability of Drugs on School Property X X X X
26. Student Victimization X X X X
27. Physical Fights X X X X
28. Carrying a Weapon X X X X
29. Student Safety X X X X
30. Teacher Victimization X X
31. Disruptions in Class by Students X X X
32. Parent Involvement in School(teacher, principal reports) T,P T,P T,P
33. Influence of ParentAssociations X X X
1 Table prepared August 1997.2 Student achievement levels have been established for the reading (1992, 1994), mathematics (1990, 1992, 1996), and science (1996)
assessments. Assessments scheduled for 1998 have been approved. At the state level, these include reading (Grades 4 and 8) and writing (Grade 8). Preliminary decisions have been made for 2000, subject to continuing legislative authority. State-level assessments proposed for 2000 include mathematics (Grades 4 and 8) and science (Grades 4 and 8). There are no current plans to administer state-level NAEP assessments in foreign languages, civics, economics, arts, history, or geography by the year 2000.
This table updates information presented in the 1996 Goals Report.
309
Appendix A, B, C, D 10/30/97 12:14 PM Page 309

310
Appendix A, B, C, D 10/30/97 12:14 PM Page 310

311
General Information
Process of Choosing the Core Indicators
The core indicators were selected with the assistance ofmembers of the Goals Panel’s Resource and TechnicalPlanning Groups, who were asked to recommend asmall set of indicators for the core that were, to theextent possible:
• comprehensive across the Goals;
• most critical in determining whether the Goals areactually achieved;
• policy-actionable, so that policymakers and thepublic will have a better understanding of what theycan do to improve education performance; and
• updated at frequent intervals, so that the Panel canprovide regular progress reports.
It is important to understand that the indicators select-ed for the core are not necessarily the ideal measures ofprogress, nor are they all policy-actionable. They do rep-resent, however, the best currently available measures atthe national and the state levels.
Accuracy of Data
The accuracy of any statistic is determined by the jointeffects of “sampling” and “nonsampling” errors.Estimates based on a sample will differ somewhat fromthe figures that would have been obtained if a completecensus had been taken using the same survey instru-ments, instructions, and procedures. In addition to suchsampling errors, all surveys, both universe and sample,are subject to design, reporting, and processing errorsand errors due to nonresponse. To the extent possible,these nonsampling errors are kept to a minimum bymethods built into the survey procedures. In general,however, the effects of nonsampling errors are more
difficult to gauge than those produced by samplingvariability.
Sampling Errors
The samples used in surveys are selected from a largenumber of possible samples of the same size that couldhave been selected using the same sample design.Estimates derived from the different samples woulddiffer from each other. The difference between a sampleestimate and the average of all possible samples is calledthe sampling deviation. The standard or sampling errorof a survey estimate is a measure of the variation amongthe estimates from all possible samples and, thus, is ameasure of the precision with which an estimate from aparticular sample approximates the average result of allpossible samples.
The sample estimate and an estimate of its standarderror permit us to construct interval estimates withprescribed confidence that the interval includes theaverage result of all possible samples. If all possible sam-ples were selected under essentially the same conditionsand an estimate and its estimated standard error werecalculated from each sample, then: 1) approximately 2/3of the intervals from one standard error below theestimate to one standard error above the estimate wouldinclude the average value of the possible samples; and 2) approximately 19/20 of the intervals from two stan-dard errors above the estimate to two standard errorsbelow the estimate would include the average value ofall possible samples. We call an interval from two stan-dard errors below the estimate to two standard errorsabove the estimate a 95 percent confidence interval.
Analysis of standard errors can help assess how valid a comparison between two estimates might be. Thestandard error of a difference between two indepen-dent sample estimates is equal to the square root of the sum of the squared standard errors of the estimates.
Appendix B:
Technical Notes and Sources for the National Core Indicators
Appendix A, B, C, D 10/30/97 12:14 PM Page 311

312
The standard error (se) of the difference between inde-pendent sample estimates “a” and “b” is:
To compare changes in between-group differences(groups “a” and “b”) over time (years “1” and “2”), weapproximate the standard error of the difference as:
This method overestimates the standard error because itdoes not account for covariance (the covariance figureswere not available). Because of this overestimation, theapproach is conservative; that is, one is less likely toobtain significant results.
Nonsampling Errors
Universe and sample surveys are subject to nonsamplingerrors. Nonsampling errors may arise when respondentsor interviewers interpret questions differently; whenrespondents must estimate values; when coders, keyers,and other processors handle answers differently; whenpersons who should be included in the universe are not;or when persons fail to respond (completely or partial-ly). Nonsampling errors usually, but not always, result inan understatement of total survey error and, thus, anoverstatement of the precision of survey estimates.Since estimating the magnitude of nonsampling errorsoften would require special experiments or access toindependent data, these magnitudes are seldom avail-able.
Goal 1: Ready to Learn
1. Children’s Health Index
The percentages of infants at risk are based on the num-ber of births used to calculate the health index, not theactual number of births. The percentage of complete andusable birth records used to calculate the 1995 healthindex varied from a high of 99.81 to a low of 69.24. Fourstates (California, Indiana, New York, and South Dako-ta) did not collect information on all four risks in 1991,1992, 1993, and 1994; five states (California, Indiana,New York, Oklahoma, and South Dakota) did not col-lect information on all four risks in 1990. These statesand the territories are not included in the U.S. total.New Hampshire was included in the U.S. total but not inthe race/ethnicity totals because the state does not col-lect information on Hispanic origin. Minority popula-tions may be underrepresented due to the exclusion of
the four states (five states in 1990), particularly Califor-nia and New York; therefore, the risk factors by race/eth-nicity should be interpreted with caution.
The National Center for Health Statistics notes thatalcohol use during pregnancy, which is one of themeasures used to calculate the Children’s Health Index,is likely to be underreported on the birth certificate.
Source: Nicholas Zill and Christine Winquist Nord ofWestat developed the concept of the Children’s HealthIndex. Stephanie Ventura and Sally Clarke of theNational Center for Health Statistics provided the spe-cial tabulations of the 1990, 1991, 1992, 1993, 1994,and 1995 birth certificate data needed to produce theindex, July 1997.
2. Immunizations
The Goals Panel reports data from 1994 as the baselineyear for immunizations. This was the first year for whichdata were collected using the National ImmunizationSurvey (NIS). In prior years, the Centers for DiseaseControl collected data on immunization using theNational Health Interview Survey (NHIS). The GoalsPanel does not compare data from NIS and NHIS, dueto methodological differences between the two instru-ments.
Sources: 1994 National Immunization Survey, Centersfor Disease Control and Prevention. Morbidity and Mor-tality Weekly Report, August 25, 1995, 619; unpublishedtabulations from Abt Associates, July 1997.
1995 National Immunization Survey, Centers for Dis-ease Control and Prevention. Morbidity and MortalityWeekly Report, February 28, 1997, 177.
1996 National Immunization Survey, Centers for Dis-ease Control and Prevention. Morbidity and MortalityWeekly Report, July 25, 1997, 658; unpublished tabula-tions from Abt Associates, July 1997.
3. Family-Child Reading and Storytelling
The population estimates for the National HouseholdEducation Survey (NHES) cover 3- to 5-year-oldchildren who are not yet enrolled in kindergarten. Agefrom the NHES:93 was established as of January 1, 1993;age from the NHES:95 was established as of December31, 1994; and age from the NHES:96 was established asof December 31, 1995.
In the NHES:93, information on daily reading wascollected using two approaches with split-half samples.The two approaches did not result in significantlydifferent estimates for daily reading among 3- to 5-year-old preschoolers. A combined measure using both itemsfor NHES:93 is included in this report.
se = se2a1 + se2
b1+ se2
a2+ se2
b2
sea,b = se2a + se2
b
Appendix A, B, C, D 10/30/97 12:14 PM Page 312

313
Sources: U.S. Department of Education, National Cen-ter for Education Statistics, National Household Educa-tion Survey: 1993 School Readiness Interview, unpub-lished tabulations prepared by Westat, August 1994.
U.S. Department of Education, National Center forEducation Statistics, National Household EducationSurvey: 1995 Program Participation Interview,unpublished tabulations prepared by Westat, August1995.
U.S. Department of Education, National Center forEducation Statistics, National Household EducationSurvey: 1996 Parent Interview, unpublished tabulationsprepared by Westat, August 1996.
4. Preschool Participation
The population estimates for the NHES cover 3- to 5-year-old children who are not yet enrolled in kinder-garten. Age from the NHES:91 was established as ofJanuary 1, 1991; age from the NHES:93 was establishedas of January 1, 1993; age from the NHES:95 was estab-lished as of December 31, 1994; and age from theNHES:96 was established as of December 31, 1995.Preschool participation includes children enrolled inany center-based program.
Sources: U.S. Department of Education, NationalCenter for Education Statistics, National HouseholdEducation Survey: 1991 Early Childhood Component,unpublished tabulations prepared by Westat, August1994.
U.S. Department of Education, National Center forEducation Statistics, National Household EducationSurvey: 1993 School Readiness Interview, unpublishedtabulations prepared by Westat, August 1994.
U.S. Department of Education, National Center forEducation Statistics, National Household EducationSurvey: 1995 Program Participation Interview,unpublished tabulations prepared by Westat, August1995.
U.S. Department of Education, National Center forEducation Statistics, National Household EducationSurvey: 1996 Parent Interview, unpublished tabulationsprepared by Westat, August 1996.
Goal 2: School Completion
5. High School Completion
The high school completion rates for 18- to 24-year-oldsare computed as a percentage of the non-high schoolenrolled population at these ages who hold a highschool credential (either a high school diploma or analternative credential, such as a General Educational
Development (GED) certificate, Individual EducationPlan (IEP) credential, or certificate of attendance).
For more information on explanations for disparities inWhite and Hispanic rates, see Marilyn M. McMillen,Phillip Kaufman, and Steve Klein, Dropout Rates in theUnited States: 1995 (Washington, DC: U.S. Departmentof Education, National Center for Education Statistics,1997).
Source: U.S. Department of Commerce, Bureau of the Census, 1990-1996 October Current PopulationSurveys, unpublished tabulations prepared by theNational Center for Education Statistics and MPRAssociates, Inc., August 1997.
Goal 3: Student Achievement and Citizenship
General
National Assessment of Educational Progress(NAEP)
NAEP is a survey of the educational achievement ofAmerican students and changes in that achievementacross time. Since 1969, NAEP has assessed theachievement of national samples of 9-, 13-, and 17-year-old students in public and private schools. In 1983, itexpanded the samples so that grade-level results couldbe reported.
The assessments, conducted annually until the 1979-80school year and biennially since then, have includedperiodic measures of student performance in reading,mathematics, science, writing, U.S. history, civics,geography, and other subject areas. NAEP also collectsdemographic, curricular, and instructional backgroundinformation from students, teachers, and schooladministrators.
National Assessment Governing Board (NAGB)Achievement Levels
The NAEP data shown under Goal 3 should be inter-preted with caution. The Goals Panel’s performancestandard classifies student performance according toachievement levels devised by the National AssessmentGoverning Board. These achievement level data (inreading and mathematics) have been previously report-ed by the National Center for Education Statistics(NCES). Students with NAEP scores falling below theGoals Panel’s performance standard have been classifiedas “Basic” or below; those above have been classified as“Proficient” or “Advanced.”
The NAGB achievement levels represent a useful wayof categorizing overall performance on the NAEP. Theyare also consistent with the Panel’s efforts to report such
Appendix A, B, C, D 10/30/97 12:14 PM Page 313

314
performance against a high-criterion standard. Howev-er, both NAGB and NCES regard the achievement lev-els as developmental; the reader of this report is advisedto interpret the achievement levels with caution.
NAGB has established standards for reporting theresults of the National Assessment of EducationalProgress. This effort has resulted in three achievementlevels: basic, proficient, and advanced. The NAGBachievement levels are reasoned judgements of whatstudents should know and be able to do. They areattempts to characterize overall student performance inparticular subject matters. Readers should exercisecaution, however, in making particular inferences aboutwhat students at each level actually know and can do. ANAEP assessment is a complex picture of studentachievement, and applying external standards forperformance is a difficult task. Evaluation studies haveraised questions about the degree to which the standardsin the NAGB achievement levels are actually reflectedin an assessment and, hence, the degree to which infer-ences about actual performance can be made from theseachievement levels. The Goals Panel acknowledgesthese limitations but believes that, used with caution,these levels convey important information about howAmerican students are faring in reaching Goal 3.
Basic: This level, below proficient, denotes partial masteryof knowledge and skills that are fundamental for proficientwork at each grade — 4, 8, and 12. For 12th grade, this ishigher-than-minimum competency skills (which arenormally taught in elementary and junior high school)and covers significant elements of standard high-school-level work.
Proficient: This central level represents solid academicperformance for each grade tested — 4, 8, and 12. Itreflects a consensus that students reaching this levelhave demonstrated competency over challenging sub-ject matter and are well prepared for the next level ofschooling. At grade 12, the proficient level encompassesa body of subject-matter knowledge and analytical skills,and of cultural literacy and insight, that all high schoolgraduates should have for democratic citizenship,responsible adulthood, and productive work.
Advanced: This higher level signifies superior performancebeyond proficient grade-level mastery at grades 4, 8, and 12. For 12th grade, the advanced level shows readiness for rigorous college courses, advancedtraining, or employment requiring advanced academicachievement.
Only five academic subjects are presented at the nation-al level. Thus far, student achievement levels at thenational level have been established by NAGB in onlyfive of the core subject areas — reading, mathematics,science, history, and geography. The indicators for Goal 3
will be expanded as new NAEP assessments are devel-oped in other subject areas and achievement levels areestablished.
6. Reading Achievement
See general technical notes regarding NAEP and theNAGB achievement levels.
Source: Jay Campbell, Patricia Donahue, Clyde Reese,and Gary Phillips, NAEP 1994 Reading Report Card for the Nation and the States (Washington, DC: U.S. Department of Education, National Center forEducation Statistics, 1996).
7. Writing Achievement
Although student achievement levels have not beenestablished in writing, the data presented in the GoalsReport are reported against a standard and do showwhether students are performing at acceptable levels.
NAEP Writing Portfolio Study, 1992To conduct the Writing Portfolio Study, NAEP asked anationally representative subgroup of the 4th and 8thgraders who participated in the 1992 NAEP writingassessment to work with their teachers and submit threepieces of writing from their Language Arts or Englishclasses that represented their best writing efforts.Students were asked to give special preference to piecesdeveloped using writing process strategies such as pre-writing activities, consulting with others about writing,and revising successive drafts. They were also asked toselect pieces that represented different kinds of writing(i.e., narrative, informative, or persuasive).
Papers were scored according to the following NarrativeScoring Guide.Describing a single event:1 Event Description. Paper is a list of sentences mini-
mally related or a list of sentences that all describe asingle event, or a description of a setting or character.
Writing about a series of events:2 Undeveloped Story. Paper is a listing of related
events. More than one event is described, but withfew details about setting, characters, or the events.(Usually there is no more than one sentence tellingabout each event.)
3 Basic Story. Paper describes a series of events, givingdetails (in at least two or three sentences) aboutsome aspect of the story (the events, the characters’goals, or problems to be solved). But the story may beundeveloped or lack cohesion because of problemswith syntax, sequencing, or events missing.
Writing about a sequence of episodes:4 Extended Story. Paper describes a sequence of
episodes, including details about most story elements
Appendix A, B, C, D 10/30/97 12:14 PM Page 314

315
(i.e., setting, episodes, characters’ goals, or problemsto be solved). But the stories are confusing or incom-plete (i.e., at the end of the story the characters’goals are ignored or problems inadequately resolved;the beginning does not match the rest of the story;the plot is weak; or the internal logic or plausibilityof characters’ actions is not maintained).
5 Developed Story. Paper describes a sequence of episodes in which most of the story elements areclearly developed (i.e., setting, episodes, characters’goals, or problems to be solved) with a simple resolu-tion of these goals or problems at the end. The storymay have one or two problems, or include too muchdetail, or the end may be inconsistent with the rest of the story; or the story may contain one highlydeveloped episode with subplots.
6 Elaborated Story. Paper describes a sequence ofepisodes in which almost all story elements are welldeveloped (i.e., setting, episodes, characters’ goals, orproblems to be solved). The resolution of the goals orproblems at the end is elaborated. The events arepresented and elaborated in a cohesive way.
Source: Claudia A. Gentile, James Martin-Rehrmann,and John H. Kennedy, Windows into the Classroom,NAEP’s 1992 Writing Portfolio Study (Washington, DC:U.S. Department of Education, National Center forEducation Statistics, 1995), 83 and 85.
8. Mathematics Achievement
See general technical notes regarding NAEP and theNAGB achievement levels.
Source: Reese, C.M., Miller, K.E., Mazzeo, J. andDossey, J.A. NAEP 1996 Mathematics Report Card for theNation and the States (Washington, DC: National Cen-ter for Education Statistics, 1997).
9. Science Achievement
See general technical notes regarding NAEP and theNAGB achievement levels.
Source: Bourque, M.L., Champagne, A. and Crissman,S. 1996 Science Performance Standards: AchievementResults for the Nation and States, A First Look (NationalAssessment Governing Board, 1997, in press).
10. History Achievement
See general technical notes regarding NAEP and theNAGB achievement levels.
According to NCES, the U.S. history results presentedhere for Grades 4, 8, and 12 illustrate one of the difficul-ties in setting achievement levels. NAGB is concernedabout the discrepancy between actual student perfor-mance and the expectations for performance that are
contained in the achievement levels. Simply stated, stu-dents are not performing as well on the NAEP U.S. his-tory assessment, particularly at Grade 12, as NAGB andthe many panelists and reviewers think that thesestudents should perform. For example, most studentstake at least one high school course in U.S. history bythe end of the 11th grade. Yet the achievement levelsindicate that more than half (57%) of 12th graders areperforming below the basic level, with 1% scoring at theadvanced level. In contrast, data from The CollegeBoard show that about 2.4% of all graduating seniorsscore well enough on the Advanced Placementexamination in U.S. history to be considered qualifiedfor college credit.
Since NAEP is a cross-sectional survey of studentachievement, it cannot readily identify cause-and-effectrelationships to explain why students scored high or low.Although one hypothesis is that students’ performancewas found to be too low because the achievement levelsare set too high, NAGB does not believe that this is thecase. At present, validity studies on these achievementlevels, conducted by American College Testing (ACT),have pointed in opposite directions — one suggestedthat the levels were too high, the other that they were too low. NAGB intends to look carefully at this gapbetween expected and actual performance, andencourages others to do so as well.
Nevertheless, there are several other hypotheses thatmight account for this gap between actual student scoresand the achievement levels. Motivation, particularly atGrade 12, is a perennial problem in an assessment likeNAEP for which there are no stakes or rewards forstudents to do well. (However, it is not clear whystudents should be less motivated in taking this historyassessment than other NAEP assessments in whichhigher percentages of students reached the various“cutpoints.”) There may be differences between what istaught in the broad array of U.S. history classes and thecontent of this NAEP assessment. A lack of consistencybetween the grade levels at which the subject is taughtand the NAEP assessment of Grades of 4, 8, and 12could account for some of this discrepancy. The judgesfor the 12th grade levels may have had relatively higherexpectations than judges for the other grades. Finally,the difference between more conventional testing prac-tices in some classrooms and the NAEP assessmentquestions may be another factor. NAEP includes a vari-ety of questions, from multiple-choice items to open-ended tasks that require students to apply knowledgeand demonstrate skills by writing their answers.
Many of these factors, or a combination of all of them,could explain the gap between standards for student per-formance contained in the NAGB achievement levels
Appendix A, B, C, D 10/30/97 12:14 PM Page 315
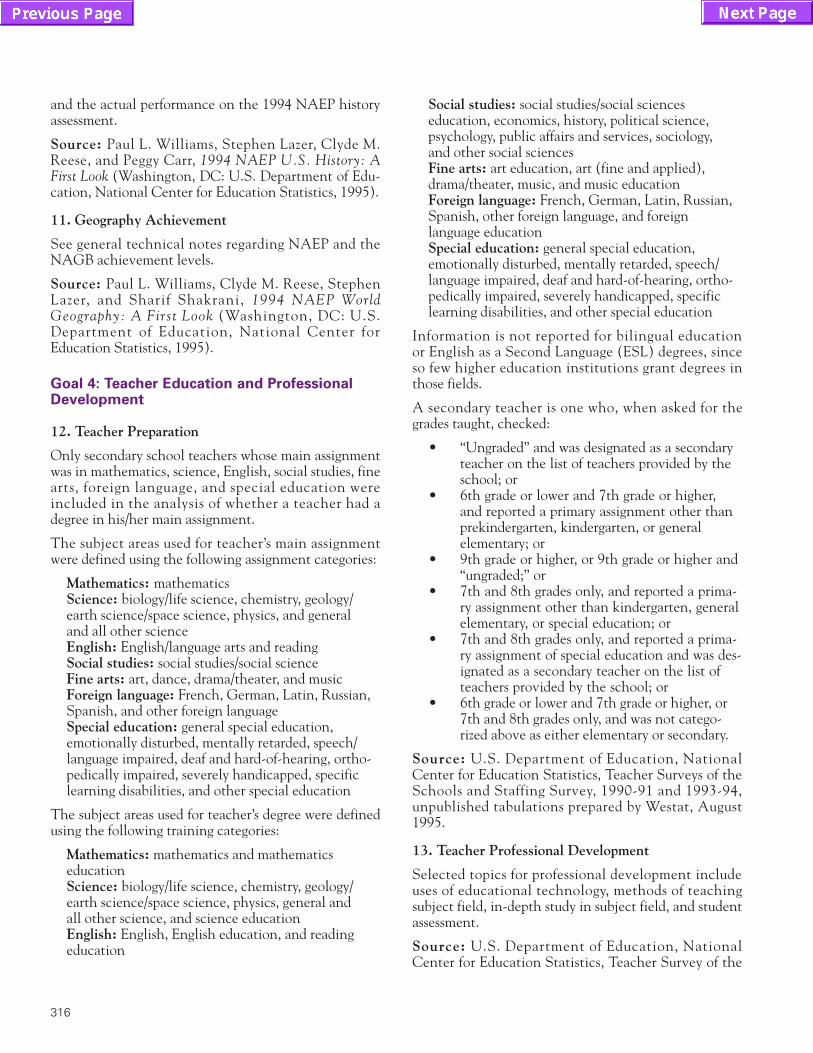
316
and the actual performance on the 1994 NAEP historyassessment.
Source: Paul L. Williams, Stephen Lazer, Clyde M.Reese, and Peggy Carr, 1994 NAEP U.S. History: AFirst Look (Washington, DC: U.S. Department of Edu-cation, National Center for Education Statistics, 1995).
11. Geography Achievement
See general technical notes regarding NAEP and theNAGB achievement levels.
Source: Paul L. Williams, Clyde M. Reese, StephenLazer, and Sharif Shakrani, 1994 NAEP WorldGeography: A First Look (Washington, DC: U.S.Department of Education, National Center forEducation Statistics, 1995).
Goal 4: Teacher Education and ProfessionalDevelopment
12. Teacher Preparation
Only secondary school teachers whose main assignmentwas in mathematics, science, English, social studies, finearts, foreign language, and special education wereincluded in the analysis of whether a teacher had adegree in his/her main assignment.
The subject areas used for teacher’s main assignmentwere defined using the following assignment categories:
Mathematics: mathematicsScience: biology/life science, chemistry, geology/earth science/space science, physics, and general and all other scienceEnglish: English/language arts and readingSocial studies: social studies/social scienceFine arts: art, dance, drama/theater, and musicForeign language: French, German, Latin, Russian,Spanish, and other foreign languageSpecial education: general special education,emotionally disturbed, mentally retarded, speech/language impaired, deaf and hard-of-hearing, ortho-pedically impaired, severely handicapped, specificlearning disabilities, and other special education
The subject areas used for teacher’s degree were definedusing the following training categories:
Mathematics: mathematics and mathematics educationScience: biology/life science, chemistry, geology/earth science/space science, physics, general and all other science, and science educationEnglish: English, English education, and readingeducation
Social studies: social studies/social scienceseducation, economics, history, political science,psychology, public affairs and services, sociology, and other social sciencesFine arts: art education, art (fine and applied),drama/theater, music, and music educationForeign language: French, German, Latin, Russian,Spanish, other foreign language, and foreignlanguage educationSpecial education: general special education,emotionally disturbed, mentally retarded, speech/language impaired, deaf and hard-of-hearing, ortho-pedically impaired, severely handicapped, specificlearning disabilities, and other special education
Information is not reported for bilingual education or English as a Second Language (ESL) degrees, since so few higher education institutions grant degrees inthose fields.
A secondary teacher is one who, when asked for thegrades taught, checked:
• “Ungraded” and was designated as a secondaryteacher on the list of teachers provided by theschool; or
• 6th grade or lower and 7th grade or higher, and reported a primary assignment other thanprekindergarten, kindergarten, or generalelementary; or
• 9th grade or higher, or 9th grade or higher and“ungraded;” or
• 7th and 8th grades only, and reported a prima-ry assignment other than kindergarten, generalelementary, or special education; or
• 7th and 8th grades only, and reported a prima-ry assignment of special education and was des-ignated as a secondary teacher on the list ofteachers provided by the school; or
• 6th grade or lower and 7th grade or higher, or7th and 8th grades only, and was not catego-rized above as either elementary or secondary.
Source: U.S. Department of Education, NationalCenter for Education Statistics, Teacher Surveys of theSchools and Staffing Survey, 1990-91 and 1993-94,unpublished tabulations prepared by Westat, August1995.
13. Teacher Professional Development
Selected topics for professional development includeuses of educational technology, methods of teachingsubject field, in-depth study in subject field, and studentassessment.
Source: U.S. Department of Education, NationalCenter for Education Statistics, Teacher Survey of the
Appendix A, B, C, D 10/30/97 12:14 PM Page 316

317
Schools and Staffing Survey, 1993-94, unpublishedtabulations prepared by Westat, August 1995.
Goal 5: Mathematics and Science
14. International Mathematics Achievement
For the Third International Mathematics and ScienceStudy (TIMSS), the following countries did not meetinternational guidelines at Grade 4: Australia, Austria,Hungary, Israel, Kuwait, Latvia (LSS), Netherlands,Slovenia, and Thailand.
In England, more than 10 percent of the population wasexcluded from testing at Grade 4. In England and Scot-land, a participation rate of 75 percent of the schoolsand students combined for Grade 4 was achieved onlyafter replacements for refusals were substituted.
The following countries did not meet internationalguidelines at Grade 8: Australia, Austria, Belgium(French), Bulgaria, Colombia, Denmark, Germany,Greece, Israel, Kuwait, Netherlands, Romania, Scot-land, Slovenia, South Africa, and Thailand.
In four countries, more than 10 percent of the popula-tion was excluded from testing at Grade 8: England,Germany, Israel, and Lithuania. In Belgium (Flemish),England, Germany, Latvia (LSS), Switzerland, and theUnited States, a participation rate of 75 percent of theschools and students combined for Grade 8 was achievedonly after replacements for refusals were substituted.
Sources: U.S. Department of Education, National Cen-ter for Education Statistics, Pursuing Excellence: A Studyof U.S. Eighth-Grade Mathematics and Science Teaching,Learning, Curriculum, and Achievement in InternationalContext, NCES 97-198, Washington, DC: U.S. Govern-ment Printing Office, 1996.
U.S. Department of Education, National Center forEducation Statistics, Pursuing Excellence: A Study ofU.S. Fourth-Grade Mathematics and Science Achievementin International Context, NCES 97-255, Washington,DC: U.S. Government Printing Office, 1997.
15. International Science Achievement
See technical note under indicator 14.
Sources: Ibid.
16. Mathematics and Science Degrees
Data include only U.S. citizens and resident aliens onpermanent visas, and include institutions in U.S. terri-tories.
Mathematical sciences is the only field of study includedin the mathematics category for this report.
Fields of study in the science category for this reportinclude: engineering; physical sciences; geosciences;computer science; life sciences (includes medical andagricultural sciences); social sciences; and science andengineering technologies (includes health technologies).
Source: Integrated Postsecondary Education Data System (IPEDS 1991 and 1995), which is conducted by the National Center for Education Statistics. Thedata were analyzed by Westat, using the NationalScience Foundation’s WebCASPAR Database System,August 1997.
Goal 6: Adult Literacy and Lifelong Learning
17. Adult Literacy
Adult Literacy Scales
The U.S. Department of Education and the EducationalTesting Service (ETS) characterized the literacy of America’s adults in terms of three “literacy scales”representing distinct and important aspects of literacy:prose, document, and quantitative literacy. Each of theliteracy scales has five levels.
Prose literacy, selected as a national core indicator forthis report, is defined as the knowledge and skills neededto understand and use information from texts thatinclude editorials, news stories, poems, and fiction; forexample, finding a piece of information in a newspaperarticle, interpreting instructions from a warranty, infer-ring a theme from a poem, or contrasting viewsexpressed in an editorial. The five levels are:
Level 1 – Most of the tasks in this level require thereader to read relatively short text to locate a singlepiece of information which is identical to or synony-mous with the information given in the question ordirective. If plausible but incorrect information ispresent in the text, it tends not to be located nearthe correct information.
Level 2 – Some tasks in this level require readers tolocate a single piece of information in the text; how-ever, several distractors or plausible but incorrectpieces of information may be present, or low-levelinferences may be required. Other tasks require thereader to integrate two or more pieces of informationor to compare and contrast easily identifiable informa-tion based on a criterion provided in the question ordirective.
Level 3 – Tasks in this level tend to require readers tomake literal or synonymous matches between the textand information given in the task, or to make match-es that require low-level inferences. Other tasks askreaders to integrate information from dense or
Appendix A, B, C, D 10/30/97 12:14 PM Page 317

318
lengthy text that contains no organizational aids suchas headings. Readers may also be asked to generate aresponse based on information that can be easilyidentified in the text. Distracting information is pre-sent, but is not located near the correct information.
Level 4 – These tasks require readers to performmultiple-feature matches and to integrate or synthe-size information from complex or lengthy passages.More complex inferences are needed to performsuccessfully. Conditional information is frequentlypresent in tasks at this level and must be taken intoconsideration by the reader.
Level 5 – Some tasks in this level require the readerto search for information in dense text which con-tains a number of plausible distractors. Others askreaders to make high-level inferences or use special-ized background knowledge. Some tasks ask readersto contrast complex information.
Source: Irwin S. Kirsch, Ann Jungeblut, Lynn Jenkins,and Andrew Kolstad, Adult Literacy in America: A FirstLook at the Results of the National Adult Literacy Survey(Washington, DC: U.S. Department of Education,National Center for Education Statistics, September1993), 17.
18. Participation in Adult Education
Adults 17 years old and older who participated in one ormore adult education activities on a full-time, but noton a part-time, basis in the previous 12 months areexcluded from both the numerator and denominator inthe calculations of adult education participation.
Sources: U.S. Department of Education, NationalCenter for Education Statistics, National HouseholdEducation Survey: 1991 Adult Education Component,unpublished tabulations prepared by Westat, August1994.
U.S. Department of Education, National Center forEducation Statistics, National Household EducationSurvey: 1995 Adult Education Interview, unpublishedtabulations prepared by Westat, August 1995.
19. Participation in Higher Education
Sources: U.S. Department of Commerce, Bureau of theCensus, October Current Population Surveys, 1989-1996, unpublished tabulations from the NationalCenter for Education Statistics, prepared by PinkertonComputer Consultants, Inc., August 1997.
U.S. Department of Commerce, Bureau of the Census,1992-1996 March Current Population Surveys, unpub-lished tabulations from the National Center for Edu-cation Statistics, prepared by Pinkerton ComputerConsultants, Inc., August 1997.
Goal 7: Safe, Disciplined, and Alcohol- andDrug-free Schools
20. Overall Student Drug and Alcohol Use
Use of any illicit drug includes any use of marijuana,hallucinogens, cocaine, heroin, inhalants, or any use ofstimulants or tranquilizers not under a doctor’s orders.
Source: Lloyd D. Johnston, Patrick M. O’Malley, andJerald G. Bachman, Selected Outcome Measures from theMonitoring the Future Study for Goal 7 of the NationalEducation Goals: A Special Report for the NationalEducation Goals Panel (Ann Arbor: University ofMichigan’s Institute for Social Research, June 1997).
21. Sale of Drugs at School
Source: Ibid.
22. Student and Teacher Victimization
Student Victimization
Source: Ibid.
Teacher Victimization
Sources: U.S. Department of Education, NationalCenter for Education Statistics, Fast Response SurveySystem, Teacher Survey on Safe, Disciplined, and Drug-free Schools, FRSS 42, unpublished tabulationsprepared by Westat, August 1994.
U.S. Department of Education, National Center forEducation Statistics, Teacher Survey of the Schools andStaffing Survey, 1993-94, unpublished tabulationsprepared by Westat, August 1995.
23. Disruptions in Class by Students
Student Reports
Source: Lloyd D. Johnston, Patrick M. O’Malley, andJerald G. Bachman, Selected Outcome Measures from theMonitoring the Future Study for Goal 7 of the NationalEducation Goals: A Special Report for the NationalEducation Goals Panel (Ann Arbor: University ofMichigan’s Institute for Social Research, June, 1997).
Teacher Reports
See technical note for Goal 4, indicator 12 regardingthe definition of a secondary teacher.
Source: U.S. Department of Education, NationalCenter for Education Statistics, Teacher Surveys of theSchools and Staffing Survey, 1990-91 and 1993-94,unpublished tabulations prepared by Westat, August1995.
Appendix A, B, C, D 10/30/97 12:14 PM Page 318

319
Goal 8: Parental Participation
24. Schools’ Reports of Parent Attendance at Parent-Teacher Conferences
An elementary school was any school where the highestgrade identified on the survey questionnaire was 6 or lower. A middle school was any school where thehighest grade identified was 7 or 8, and three or fewergrades were served. All other schools (for example,where the highest grade identified was 7 or 8, and more than three grades were served) were not includedin the analysis.
Source: U.S. Department of Education, NationalCenter for Education Statistics, Fast Response SurveySystem, Survey on Family and School Partnerships in Public Schools, K-8, FRSS 58, 1996, unpublishedtabulations prepared by Westat, August 1996.
25. Schools’ Reports of Parent Involvement inSchool Policy Decisions
See technical note under indicator 24.
Source: Ibid.
26. Parents’ Reports of Their Involvement in School Activities
In the NHES:96, data for the three variables included inthis report (attendance at a general school meeting,attendance at a school or class event, and acting as avolunteer at the school or serving on a school commit-tee) were collected for a split-half of the sample. Theother split-half of the sample included items that wereworded slightly differently.
Sources: U.S. Department of Education, NationalCenter for Education Statistics, National HouseholdEducation Survey: 1993 School Safety and DisciplineComponent, unpublished tabulations, NCES, August1995.
U.S. Department of Education, National Center forEducation Statistics, National Household EducationSurvey: 1996 Parent Interview, unpublished tabulationsprepared by Westat, August 1996.
Appendix A, B, C, D 10/30/97 12:14 PM Page 319

320
Readers interested in further information from data sources for the national core indicators presented in the 1997Goals Report can contact the sponsoring agencies, as follows:
Data Source Sponsoring Agency Contact
Children’s Health Index National Center for Health Sally Clarke(Indicator 1) Statistics (NCHS) (301) 436-8500
Fast Response Survey System (FRSS) National Center for Education Edith McArthur(Indicators 24 and 25) Statistics (NCES) (202) 219-1442
Integrated Postsecondary Education NCES Roslyn KorbData System (IPEDS) (202) 219-1587(Indicator 16)
International Education Surveys NCES Eugene Owen(Indicators 14 and 15) (202) 219-1746
Monitoring the Future University of Michigan, Lloyd Johnston(Indicators 20-23) Institute for Social Research (313) 763-5043
National Adult Literacy Survey (NALS) NCES Andrew Kolstad(Indicator 17) (202) 219-1773
National Assessment of NCES Gary PhillipsEducational Progress (NAEP) (202) 219-1763(Indicators 6-11)
National Immunization Survey Centers for Disease Control Victor Coronado(Indicator 2) and Prevention (404) 639-8892
National Household Education NCES Kathryn ChandlerSurvey (NHES) (202) 219-1767(Indicators 3, 4, and 26)
NHES Adult Education Component NCES Peter Stowe(Indicator 18) (202) 219-2099
NCES items in the Current NCES Kathryn ChandlerPopulation Survey (CPS) (202) 219-1767(Indicators 5 and 19)
Schools and Staffing Survey (SASS) NCES Daniel Kasprzyk(Indicators 12, 13, 22, and 23) (202) 219-1588
Appendix A, B, C, D 10/30/97 12:14 PM Page 320

321
Readers interested in further analyses from NCES data sources can contact the National Education Data ResourceCenter (NEDRC) at the National Center for Education Statistics. NCES has established the NEDRC to enable stateeducation personnel, education researchers, and others to obtain special statistical tabulations and analyses of data setsmaintained by NCES. Researchers and others can ask the Data Center to perform specific tabulations or analyses, orthey can work on-site directly with confidential files upon signing a confidentiality pledge. This service currently isprovided free of charge by NCES.
The Data Center has files available from the:
Common Core of Data (CCD),Integrated Postsecondary Education Data System (IPEDS), National Education Longitudinal Study (NELS:88), National Household Education Survey (NHES), National Postsecondary Student Aid Study (NPSAS),National Study of Postsecondary Faculty, and Schools and Staffing Survey (SASS).
In the future, the Data Center plans to add additional databases to its inventory.
To contact the National Education Data Resource Center, write or call:
c/o Pinkerton Computer Consultants, Inc.1900 North Beauregard Street, Suite 200Alexandria, VA 22311-1722
Fax requests to: (703) 820-7465Phone: (703) 845-3151http://www.ed.gov/
Appendix A, B, C, D 10/30/97 12:14 PM Page 321

322
Appendix A, B, C, D 10/30/97 12:14 PM Page 322

323
General Information
See general technical notes regarding data accuracy,sampling errors, and nonsampling errors in Appendix B.
Baseline and Most Recent Update Years
State participation may vary by data collection year forreporting dropout data using the National Center forEducation Statistics’ (NCES) uniform definition (indi-cator 7), state-level National Assessment of EducationalProgress (NAEP) reading (indicator 8), state-levelNAEP mathematics (indicator 9), and data from the Youth Risk Behavior Survey (YRBS) (indicators 23-29). The baseline year and the most recent update year for each state are reported in parentheses next tothe indicator.
For these indicators, the range of state stores and themedian are calculated using the data for all states thatparticipated in that year, whether or not that year repre-sents all states’ baseline year or most recent update year.For example, 14 states have 1992 as their baseline yearfor indicator 7 and five states have 1993 as their baselineyear. For these five states, the range of state scores and themedian score for indicator 7 include data for the 18 statesthat reported dropout rates in 1993.
State and U.S. Comparisons
For the state-level indicators on student achievement(8-10) and the mathematics instructional practices (17-18), the state data are for public school students, whilethe U.S. data are for public and private school students.For the indicators on teacher education and professionaldevelopment (12-15), and teacher victimization andstudent disruptions (30-31), the state data are for publicschool teachers, while the U.S. data are for public andprivate school teachers.
Data for the U.S. that is reported on the state pages do notinclude the territories. Range of state scores and medianscores reported on the state pages do include the territories.
Goal 1: Ready to Learn
1. Children’s Health Index
The percentages of infants at risk are based on thenumber of births used to calculate the health index, notthe actual number of births. The percentage of completeand usable birth records used to calculate the 1995health index varied from a high of 99.81 to a low of69.24. Four states (California, Indiana, New York, andSouth Dakota) did not collect information on all fourrisks in 1995; five states (California, Indiana, New York,Oklahoma, and South Dakota) did not collect informa-tion on all four risks in 1990.
The National Center for Health Statistics notes that alcohol use during pregnancy, which is one of themeasures used to calculate the Children’s Health Index,is likely to be underreported on the birth certificate.
Source: Nicholas Zill and Christine Winquist Nord ofWestat developed the concept of the Children’s HealthIndex. Stephanie Ventura and Sally Clarke of theNational Center for Health Statistics provided the spe-cial tabulations of the 1990 and 1995 birth certificatedata needed to produce the index, July 1997.
2. Immunizations
The Goals Panel reports data from 1994 as the baselineyear for immunizations. This was the first year for whichdata were collected using the National ImmunizationSurvey (NIS). In prior years, the Centers for DiseaseControl collected data on immunization using theNational Health Interview Survey (NHIS). The GoalsPanel does not compare data from NIS and NHIS, due tomethodological differences between the two instruments.
Sources: 1994 National Immunization Survey, Centersfor Disease Control and Prevention. Morbidity and Mor-tality Weekly Report, August 25, 1995, 619; unpublishedtabulations from Abt Associates, July 1997.
Appendix C:
Technical Notes and Sources for the State Indicators
Appendix A, B, C, D 10/30/97 12:14 PM Page 323

324
1996 National Immunization Survey, Centers for Dis-ease Control and Prevention. Morbidity and MortalityWeekly Report, July 25, 1997, 658; unpublished tabula-tions from Abt Associates, July 1997.
3. Low Birthweight
Source: U.S. Department of Health and Human Ser-vices, unpublished tabulations from Division of VitalStatistics, National Center for Health Statistics; pre-pared by Westat, July 1997.
4. Early Prenatal Care
Prenatal care refers to the first visit for health care ser-vices during pregnancy.
Source: Ibid.
5. Preschool Programs for Children with Disabilities
The Individuals with Disabilities Education Act(IDEA) supports the improvement of services for veryyoung children with disabilities through several pro-grams, including the Program for Infants and Toddlerswith Disabilities (Part H), the Preschool Grants Pro-gram (Section 619 of Part B), and the Early EducationProgram for Children with Disabilities (Section 623 ofPart C). The Congressional mandate required states tohave a mandate in place by school year 1991-92 thatensures a free appropriate education (FAPE) for all eligi-ble 3- to 5-year-old children with disabilities.
Data are based on state information submitted to theU.S. Department of Education, Office of Special Educa-tion and Rehabilitative Services (OSERS) on the num-ber of children with disabilities served under IDEA, PartB and Chapter 1 (ESEA State-Operated Programs[SOP]) programs.
Source: U.S. Department of Education, Office of Spe-cial Education Programs, Data Analysis System(DANS), unpublished tabulations prepared by Westat,July 1997. Percentage of children served is based onU.S. Census Bureau Estimated Resident Population, bystate, for July 1995.
Goal 2: School Completion
6. High School Completion Rates
The high school completion rates for 18- to 24-year-oldsare computed as a percentage of the non-high schoolenrolled population at these ages who hold a highschool credential (either a high school diploma or analternative credential, such as a General EducationalDevelopment (GED) certificate, Individual EducationPlan (IEP) credential, or certificate of attendance).
Because of small sample sizes, the state-level completiondata are calculated using three-year averages. For exam-ple, for the baseline year, state data for 1990 reflect anaverage of 1989, 1990, and 1991. The data for the U.S.that is shown on the state pages are for 1990. For themost recent update year, state data for 1995 reflect anaverage of 1994, 1995, and 1996. The data for the U.S.that is shown on the state pages are for 1996.
Source: U.S. Department of Commerce, Bureau of the Census, 1989-1996 October Current PopulationSurveys, unpublished tabulations prepared by theNational Center for Education Statistics and MPRAssociates, Inc., August 1997.
7. High School Dropout Rates
The 1991-92 school year was the first for which statesreported school district level data on the numbers andtypes of dropouts in the Common Core of Data (CCD)Agency Universe Survey. The CCD defined a dropoutas an individual who: (1) was enrolled in school at sometime during the previous school year; (2) was notenrolled on October 1 of the current school year; (3) hasnot graduated from high school or completed a state- ordistrict-approved educational program; and (4) does notmeet any exclusionary conditions. For the 1991-92school year, 13 states and the District of Columbiareported data that were considered to meet the CCDstandards to allow publication of their dropout data. Forthe 1992-93 school year, 17 states and the District ofColumbia reported data that met CCD standards. Forthe 1993-94 year, 26 states and the District of Columbiareported data that met CCD standards.
Sources: Lee M. Hoffman, State Dropout Data Collec-tion Practices: 1991-92 School Year (Washington, DC:U.S. Department of Education, National Center forEducation Statistics, 1995).
Marilyn M. McMillen and Phillip Kaufman, DropoutRates in the United States: 1994 (Washington, DC: U.S.Department of Education, National Center for Educa-tion Statistics, 1996).
Marilyn M. McMillen, Phillip Kaufman, and SteveKlein, Dropout Rates in the United States: 1995 (Wash-ington, DC: U.S. Department of Education, NationalCenter for Education Statistics, 1997).
Goal 3: Student Achievement and Citizenship
General
National Assessment of Educational Progress(NAEP)
NAEP is a survey of the educational achievement ofAmerican students and changes in that achievement
Appendix A, B, C, D 10/30/97 12:14 PM Page 324

325
across time. Since 1969, NAEP has assessed theachievement of national samples of 9-, 13-, and 17-year-old students in public and private schools. In 1983, itexpanded the samples so that grade-level results couldbe reported.
The assessments, conducted annually until the 1979-80school year and biennially since then, have includedperiodic measures of student performance in reading,mathematics, science, writing, U.S. history, civics,geography, and other subject areas. NAEP also collectsdemographic, curricular, and instructional backgroundinformation from students, teachers, and schooladministrators.
In 1988, Congress added a new dimension to NAEP byauthorizing, on a trial basis, voluntary participation ofpublic schools in state-level assessments.
National Assessment Governing Board (NAGB)Achievement Levels
The NAEP data shown under Goal 3 should be inter-preted with caution. The Goals Panel’s performancestandard classifies student performance according toachievement levels devised by the National AssessmentGoverning Board. These achievement level data (inreading and mathematics) have been previously report-ed by the National Center for Education Statistics(NCES). Students with NAEP scores falling below theGoals Panel’s performance standard have been classifiedas “Basic” or below; those above have been classified as“Proficient” or “Advanced.”
The NAGB achievement levels represent a useful wayof categorizing overall performance on the NAEP. They are also consistent with the Panel’s efforts toreport such performance against a high-criterionstandard. However, both NAGB and NCES regard theachievement levels as developmental; the reader of thisreport is advised to interpret the achievement levelswith caution.
NAGB has established standards for reporting theresults of the National Assessment of EducationalProgress. This effort has resulted in three achievementlevels: basic, proficient, and advanced. The NAGBachievement levels are reasoned judgements of whatstudents should know and be able to do. They areattempts to characterize overall student performance inparticular subject matters. Readers should exercisecaution, however, in making particular inferences aboutwhat students at each level actually know and can do. ANAEP assessment is a complex picture of studentachievement, and applying external standards forperformance is a difficult task. Evaluation studies haveraised questions about the degree to which the standardsin the NAGB achievement levels are actually reflected
in an assessment and, hence, the degree to which inferences about actual performance can be made fromthese achievement levels. The Goals Panel acknowl-edges these limitations but believes that, used with cau-tion, these levels convey important information abouthow American students are faring in reaching Goal 3.
Basic: This level, below proficient, denotes partial masteryof knowledge and skills that are fundamental for proficientwork at each grade — 4, 8, and 12. For 12th grade, this ishigher-than-minimum competency skills (which arenormally taught in elementary and junior high school)and covers significant elements of standard high-school-level work.
Proficient: This central level represents solid academicperformance for each grade tested — 4, 8, and 12. Itreflects a consensus that students reaching this levelhave demonstrated competency over challenging sub-ject matter and are well prepared for the next level ofschooling. At Grade 12, the proficient level encompass-es a body of subject-matter knowledge and analyticalskills, and of cultural literacy and insight, that all highschool graduates should have for democratic citizenship,responsible adulthood, and productive work.
Advanced: This higher level signifies superior performancebeyond proficient grade-level mastery at Grades 4, 8, and 12.For 12th grade, the advanced level shows readiness forrigorous college courses, advanced training, or employ-ment requiring advanced academic achievement.
Only three academic subjects are presented at the statelevel. Thus far, state-level assessments have only beenconducted in reading, mathematics, and science, andstudent achievement levels have been established byNAGB in these three subject areas. The indicators forGoal 3 will be expanded as new NAEP assessments aredeveloped in other subject areas and achievement levelsare established.
8. Reading Achievement
See general technical notes regarding NAEP and theNAGB achievement levels.
In 1992, 43 jurisdictions (states and territories)participated in the 4th-grade reading assessment. In 1994, 44 jurisdictions participated in the voluntaryprogram. However, two states, Idaho and Michigan, didnot meet the minimum school participation guidelinesfor public schools; therefore, their results were notreleased. Also, Washington, DC, withdrew from theTrial State Assessment after the data collection phase. Itshould also be noted that Montana, Nebraska, New Hampshire, Pennsylvania, Rhode Island,Tennessee, and Wisconsin did not satisfy one of theguidelines for school sample participation rates.
Appendix A, B, C, D 10/30/97 12:14 PM Page 325
326
Source: Jay Campbell, Patricia Donahue, Clyde Reese,and Gary Phillips, NAEP 1994 Reading Report Card for the Nation and the States (Washington, DC: U.S.Department of Education, National Center forEducation Statistics, 1996).
9. Mathematics Achievement
See general technical notes regarding NAEP and theNAGB achievement levels.
Forty jurisdictions (states and territories) participated in the 1990 trial mathematics assessment of 8th graders,and 44 jurisdictions participated in the 1992 state math-ematics assessments of 4th and 8th graders.
In 1996, 45 jurisdictions participated in the voluntaryassessment of 4th and 8th graders. However, three states(Nevada, New Hampshire, and New Jersey) failed tomeet the minimum school participation guidelines forpublic schools at Grade 8; therefore, their results werenot released. The following states did not satisfy one ofthe guidelines for school sample participation rates atGrade 4: Alaska, Arkansas, Iowa, Michigan, Montana,Nevada, New Jersey, New York, Pennsylvania, SouthCarolina, and Vermont. The following states did notsatisfy one of the guidelines for school sample participa-tion rates at Grade 8: Alaska, Arkansas, Iowa, Mary-land, Michigan, Montana, New York, South Carolina,Vermont, and Wisconsin.
Sources: Reese, C.M., Miller, K.E., Mazzeo, J. andDossey, J.A. NAEP 1996 Mathematics Report Card for theNation and the States (Washington, DC: National Cen-ter for Education Statistics, 1997).
National Center for Education Statistics, 1990 and 1992NAEP Mathematics Data (revised), October 1996.
10. Science Achievement
See general technical notes regarding NAEP and theNAGB achievement levels.
In 1996, 45 jurisdictions participated in the voluntaryprogram. However, three states (Nevada, New Hamp-shire, and New Jersey) failed to meet the minimumschool participation guidelines for public schools; there-fore, their results were not released. The following statesdid not satisfy one of the guidelines for school sampleparticipation rates: Alaska, Arkansas, Iowa, Maryland,Michigan, Montana, New York, South Carolina, Ver-mont, and Wisconsin.
Source: Bourque, M.L., Champagne, A. and Crissman,S. 1996 Science Performance Standards: AchievementResults for the Nation and States, A First Look (NationalAssessment Governing Board, 1997, in press).
11. Advanced Placement Performance
The Advanced Placement program, sponsored by theCollege Board, provides a way for high schools to offercollege-level coursework to students. At present, one ormore course descriptions, examinations, and sets of cur-ricular materials are available in art, biology, chemistry,computer science, economics, English, French, German,government and politics, history, Latin, mathematics,music, physics, and Spanish. Advanced Placementexaminations, which are given in May, are graded on afive-point scale: 5 - extremely well qualified; 4 - wellqualified; 3 - qualified; 2 - possibly qualified; and 1 - norecommendation. Grades of 3 and above generally areaccepted for college credit and advanced placement atparticipating colleges and universities.
The subject areas used for this report include the follow-ing Advanced Placement examinations:
English: English Language & Composition and English Literature & CompositionScience: Biology, Chemistry, Physics B, Physics C - Mechanics, and Physics C - Electricity and MagnetismMathematics: Calculus AB and Calculus BCHistory: U.S. History and European HistoryForeign Language: French Language, French Literature, Spanish Language, Spanish Literature, and GermanFine Arts: Art History, Studio Art (Drawing and General), and Music TheoryEconomics: Macro-economics and Micro-economicsGovernment: U.S. Government and Politics and Comparative Government and Politics
The number of Advanced Placement examinationsgraded 3 or above per 1,000 11th and 12th graders ispresented in this report. The number of 11th and 12thgraders includes public and private students. The enroll-ment figures were arrived at by multiplying the publicenrollment by a private-enrollment adjustment factor.
Source: The College Board, Advanced Placement Program, Results from the 1991 and 1997 AdvancedPlacement Examinations, unpublished tabulations,August 1991 and August 1997
Goal 4: Teacher Education and ProfessionalDevelopment
12. Teacher Preparation
Only secondary school teachers whose main assignmentwas in mathematics, science, English, social studies, finearts, foreign language, and special education were
Appendix A, B, C, D 10/30/97 12:14 PM Page 326

327
included in the analysis of whether a teacher had adegree in his/her main assignment.
The subject areas used for teacher’s main assignmentwere defined using the following assignment categories:
Mathematics: mathematicsScience: biology/life science, chemistry,geology/earth science/space science, physics, andgeneral and all other scienceEnglish: English/language arts and readingSocial studies: social studies/social scienceFine arts: art, dance, drama/theater, and musicForeign language: French, German, Latin, Russian,Spanish, and other foreign languageSpecial education: general special education,emotionally disturbed, mentally retarded, speech/language impaired, deaf and hard-of-hearing, ortho-pedically impaired, severely handicapped, specificlearning disabilities, and other special education
The subject areas used for teacher’s degree were definedusing the following training categories:
Mathematics: mathematics and mathematics educationScience: biology/life science, chemistry, geology/earth science/space science, physics, general and allother science, and science educationEnglish: English, English education, and readingeducationSocial studies: social studies/social sciences educa-tion, economics, history, political science, psycholo-gy, public affairs and services, sociology, and othersocial sciencesFine arts: art education, art (fine and applied),drama/theater, music, and music educationForeign language: French, German, Latin, Russian,Spanish, other foreign language, and foreign lan-guage educationSpecial education: general special education,emotionally disturbed, mentally retarded, speech/language impaired, deaf and hard-of-hearing, ortho-pedically impaired, severely handicapped, specificlearning disabilities, and other special education
Information is not reported for bilingual education orEnglish as a Second Language (ESL) degrees, since so fewhigher education institutions grant degrees in those fields.
A secondary teacher is one who, when asked for thegrades taught, checked:
• “Ungraded” and was designated as a secondaryteacher on the list of teachers provided by theschool; or
• 6th grade or lower and 7th grade or higher, and reported a primary assignment other than
prekindergarten, kindergarten, or generalelementary; or
• 9th grade or higher, or 9th grade or higher and“ungraded;” or
• 7th and 8th grades only, and reported a prima-ry assignment other than kindergarten, generalelementary, or special education; or
• 7th and 8th grades only, and reported a prima-ry assignment of special education and was des-ignated as a secondary teacher on the list ofteachers provided by the school; or
• 6th grade or lower and 7th grade or higher, or7th and 8th grades only, and was not catego-rized above as either elementary or secondary.
Source: U.S. Department of Education, NationalCenter for Education Statistics, Public School TeacherSurveys of the Schools and Staffing Survey, 1990-91 and1993-94, unpublished tabulations prepared by Westat,August 1995.
13. Teacher Professional Development
Selected topics for professional development includeuses of educational technology, methods of teachingsubject field, in-depth study in subject field, and studentassessment.
Source: U.S. Department of Education, NationalCenter for Education Statistics, Public School TeacherSurvey of the Schools and Staffing Survey, 1993-94,unpublished tabulations prepared by Westat, August1995.
14. Preparation to Teach Limited English Proficient (LEP) Students
Source: Ibid.
15. Teacher Support
Source: U.S. Department of Education, NationalCenter for Education Statistics, Public School TeacherSurveys of the Schools and Staffing Survey, 1990-91 and1993-94, unpublished tabulations prepared by Westat,August 1995.
Goal 5: Mathematics and Science
16. International Mathematics and Science Achievement
NCES is conducting a research study that will link thedata from the 1995 Third International Mathematicsand Science Study (TIMSS) to the data from the 1996mathematics and science assessments of the NationalAssessment of Educational Progress (NAEP). The link-ing will result in projections of how each state that
Appendix A, B, C, D 10/30/97 12:14 PM Page 327

328
participated in the mathematics and science NAEPassessments in 1996 would have performed on the 1995TIMSS assessment. We expect that these results will beavailable for the 1998 Goals Report and other futureGoals Panel publications.
17. Mathematics Instructional Practices
Source: NAEP 1996 Mathematics Cross-State Data Com-pendium for the Grade 4 and Grade 8 Assessment. Findingsfrom the State Assessment in Mathematics of the NationalAssessment of Educational Progress. NCES 97-495, (inpress); and unpublished tabulations from EducationalTesting Service, August, 1997.
18. Mathematics Resources
Source: Ibid.
19. Mathematics and Science Degrees
Data include only U.S. citizens and resident aliens on permanent visas, and include institutions in U.S.territories.
Mathematical sciences is the only field of study includedin the mathematics category for this report.
Fields of study in the science category for this reportinclude: engineering; physical sciences; geosciences;computer science; life sciences (includes medical andagricultural sciences); social sciences; and science andengineering technologies (includes health technologies).
No percentages are reported for minority mathematicsand science degrees in Guam due to insufficient popula-tion size.
Source: Integrated Postsecondary Education DataSystem (IPEDS 1991 and 1995), which is conducted by the National Center for Education Statistics. Thedata were analyzed by Westat, using the NationalScience Foundation’s WebCASPAR Database System,August 1997.
Goal 6: Adult Literacy and Lifelong Learning
20. Adult Literacy
The U.S. Department of Education and the EducationalTesting Service (ETS) characterized the literacy of America’s adults in terms of three “literacy scales”representing distinct and important aspects of literacy:prose, document, and quantitative literacy. Each of theliteracy scales has five levels.
Prose literacy, presented in this report, is defined as theknowledge and skills needed to understand and use information from texts that include editorials, newsstories, poems, and fiction; for example, finding a piece
of information in a newspaper article, interpretinginstructions from a warranty, inferring a theme from apoem, or contrasting views expressed in an editorial.The five levels are:
Level 1 – Most of the tasks in this level require thereader to read relatively short text to locate a singlepiece of information which is identical to or synony-mous with the information given in the question ordirective. If plausible but incorrect information ispresent in the text, it tends not to be located nearthe correct information.Level 2 – Some tasks in this level require readers tolocate a single piece of information in the text; how-ever, several distractors or plausible but incorrectpieces of information may be present, or low-levelinferences may be required. Other tasks require thereader to integrate two or more pieces of informationor to compare and contrast easily identifiable infor-mation based on a criterion provided in the questionor directive.Level 3 – Tasks in this level tend to require readers tomake literal or synonymous matches between thetext and information given in the task, or to makematches that require low-level inferences. Othertasks ask readers to integrate information from denseor lengthy text that contains no organizational aidssuch as headings. Readers may also be asked to gen-erate a response based on information that can beeasily identified in the text. Distracting informationis present, but is not located near the correct infor-mation.Level 4 – These tasks require readers to performmultiple-feature matches and to integrate or synthe-size information from complex or lengthy passages.More complex inferences are needed to performsuccessfully. Conditional information is frequentlypresent in tasks at this level and must be taken intoconsideration by the reader.Level 5 – Some tasks in this level require the readerto search for information in dense text which con-tains a number of plausible distractors. Others askreaders to make high-level inferences or use special-ized background knowledge. Some tasks ask readersto contrast complex information.
Twelve states (California, Florida, Illinois, Indiana,Iowa, Louisiana, New Jersey, New York, Ohio, Pennsyl-vania, Texas, and Washington) participated in the 1992State Adult Literacy Survey. The Oregon ProgressBoard conducted an independent study in 1990, whichwas validated by the Educational Testing Service.Adults aged 16-65 participated in the 1990 Oregonstudy; in other states that participated in 1992, thesample included adults aged 16 and older.
Appendix A, B, C, D 10/30/97 12:14 PM Page 328

Sources: Educational Testing Service, unpublishedtabulations from the 1992 State Adult Literacy Survey,August 1993. The Oregon Progress Board conducted anindependent study in 1990, which was validated by theEducational Testing Service.
21. Voter Registration and Voting
Sources: U.S. Department of Commerce, Bureau of theCensus, Voting and Registration in the Election ofNovember 1988, Current Population Reports, Series P-20, no. 440 (Washington, DC: U.S. Government Print-ing Office, 1989), and unpublished tabulations, calcula-tions by Westat.
U.S. Department of Commerce, Bureau of the Census,Voting and Voter Registration in the Election ofNovember 1992, Current Population Reports, Series P-20, no. 466 (Washington, DC: U.S. Government Print-ing Office, 1993), and unpublished tabulations, calcula-tions by Westat.
22. Participation in Higher Education
The Residence and Migration portion of the FallEnrollment Survey is administered every two years.Data on high school graduates are for the previousspring; however, public and private school data on highschool graduates are for different years because theCommon Core of Data (CCD) is collected annually andthe Private School Universe Survey is administeredevery two years. The 1992-93 CCD provides thenumber of public high school graduates in the 1991-92school year; the 1991-92 Private School UniverseSurvey provides the number of private high school grad-uates in the 1990-91 school year. Similarly, the 1994-95CCD provides the number of public high school gradu-ates in the 1993-94 school year; the 1993-94 PrivateSchool Universe Survey provides the number of privatehigh school graduates in the 1992-93 school year.
The Private School Universe Survey uses a combinationof list frame and area frame samples to produce nationalestimates; the state estimates of private high schoolgraduates are not considered representative. For 12states, however, the area frame sample is large enoughthat standard errors can be calculated; for these states,change between 1992 (the baseline year) and 1994 (themost recent update) can be measured. For the remaining38 states, the sample size is insufficient to permit a reli-able estimate of change between 1992 and 1994.
The Private School Universe Survey does not collectdata on private high school graduates in the U.S.territories (American Samoa, Guam, NorthernMarianas, Puerto Rico, and the Virgin Islands). This report does not include data for the territories.
Sources: U.S. Department of Education, National Centerfor Education Statistics, Residence and Migration ofFirst-Time Freshmen Enrolled in Higher EducationInstitutions: Fall 1992, 1995; Common Core of Data1992-93; and Private School Universe Survey, 1991-92.
U.S. Department of Education, National Center forEducation Statistics, Residence and Migration of First-Time Freshmen Enrolled in Higher EducationInstitutions: Fall 1994, 1996; Common Core of Data1994-95; and Private School Universe Survey, 1993-94.
Goal 7: Safe, Disciplined, and Alcohol- andDrug-free Schools
23. Student Marijuana Use
The information from the Youth Risk Behavior Survey(YRBS) includes only states with weighted data.
Sources: Centers for Disease Control and Prevention,Current Tobacco, Alcohol, Marijuana, and Cocaine UseAmong High School Students - United States, 1991(Atlanta, GA: 1992).
Centers for Disease Control and Prevention, CurrentTobacco, Alcohol, Marijuana, and Cocaine Use Among HighSchool Students - United States, 1993 (Atlanta, GA: 1994).
Centers for Disease Control and Prevention, CurrentTobacco, Alcohol, Marijuana, and Cocaine Use Among HighSchool Students - United States, 1995 (Atlanta, GA: 1996).
24. Student Alcohol Use
See technical note under indicator 23.
Source: Ibid.
25. Availability of Drugs on School Property
See technical note under indicator 23.
Sources: Centers for Disease Control and Prevention,Current Tobacco, Alcohol, Marijuana, and Cocaine UseAmong High School Students - United States, 1993(Atlanta, GA: 1994).
Centers for Disease Control and Prevention, CurrentTobacco, Alcohol, Marijuana, and Cocaine Use Among HighSchool Students - United States, 1995 (Atlanta, GA: 1996).
26. Student Victimization
See technical note under indicator 23.
Source: Ibid.
27. Physical Fights
See technical note under indicator 23.
Source: Ibid.
329
Appendix A, B, C, D 10/30/97 12:14 PM Page 329

28. Carrying a Weapon
See technical note under indicator 23.
Source: Ibid.
29. Student Safety
See technical note under indicator 23.
Source: Ibid.
30. Teacher Victimization
Source: U.S. Department of Education, National Centerfor Education Statistics, Public School Teacher Surveyof the Schools and Staffing Survey, 1993-94, unpub-lished tabulations prepared by Westat, August 1995.
31. Disruptions in Class by Students
See technical note for Goal 4, indicator 12, regarding thedefinition of a secondary teacher.
Source: U.S. Department of Education, NationalCenter for Education Statistics, Public School TeacherSurveys of the Schools and Staffing Survey, 1990-91 and1993-94, unpublished tabulations prepared by Westat,August 1995.
Goal 8: Parental Participation
32. Parental Involvement in Schools
Sources: U.S. Department of Education, National Centerfor Education Statistics, Public School Teacher Surveys ofthe Schools and Staffing Survey, 1990-91 and 1993-94, un-published tabulations prepared by Westat, August 1995.
U.S. Department of Education, National Center forEducation Statistics, Public School Principal Surveys of
the Schools and Staffing Survey, 1990-91 and 1993-94,unpublished tabulations prepared by Westat, August1995.
33. Influence of Parent Associations
Areas of school policy include establishing curriculum,hiring new full-time teachers, and setting discipline policy.
In 1990-91, data from principals reporting that the par-ent association in their school has substantial influenceon hiring new teachers were not reported for the follow-ing states due to small sample size: Arkansas, Georgia,Idaho, Kansas, Maine, Massachusetts, Montana, Neva-da, New Mexico, North Dakota, Pennsylvania, RhodeIsland, Vermont, West Virginia, and Wyoming. Also,for South Carolina, the value was 0 in this year, which isnot shown on the graph.
In 1993-94, data from principals reporting that the par-ent association in their school has substantial influenceon hiring new teachers were not reported for the follow-ing states due to small sample size: South Carolina andWest Virginia. Also, for North Dakota, the value was 0in this year, which is not shown on the graph.
In 1990-91, data from principals reporting that the par-ent association in their school has substantial influenceon setting discipline policy were not reported for thestate of Maine due to small sample size.
Source: U.S. Department of Education, NationalCenter for Education Statistics, Public School PrincipalSurveys of the Schools and Staffing Survey, 1990-91 and1993-94, unpublished tabulations prepared by Westat,August 1995.
330
Appendix A, B, C, D 10/30/97 12:14 PM Page 330

331
Readers interested in further information from data sources for the state indicators presented in the 1997 Goals Reportcan contact the sponsoring agencies, as follows:
Data Source Sponsoring Agency Contact
Advanced Placement The College Board Wade Curry(Indicator 11) (212) 713-8066
Birth Certificate Data National Center for Health Sally Clarke(Indicators 1, 3, and 4) Statistics (NCHS) (301) 436-8500
Stephanie Ventura(301) 436-8954
Common Core of Data National Center for Lee Hoffman(CCD) Education Statistics (NCES) (202) 219-1621(Indicators 7 and 22)
Current Population Surveys Bureau of the Census Lynn Casper(Indicator 21) (301) 457-2445
Data Analysis System Office of Special Education Jane C. Williams(Indicator 5) (202) 205-9039
Integrated Postsecondary NCES Roslyn KorbEducation Data System (202) 219-1587(Indicators 19 and 22)
International Education Surveys NCES Eugene Owen(Indicator 16) 202-219-1746
National Adult Literacy Survey (NALS) NCES Andrew Kolstad(Indicator 20) (202) 219-1773
Educational Testing Service Doug Rhodes(ETS) (800) 551-1230
National Assessment of NCES Gary PhillipsEducational Progress (NAEP) (202) 219-1763(Indicators 8-10, 17, and 18)
National Immunization Survey Centers for Disease Control Victor Coronado(Indicator 2) and Prevention (CDC) (404) 639-8892
NCES items in the Current NCES Kathryn ChandlerPopulation Survey (CPS) (202) 219-1767(Indicator 6)
Private School Survey NCES Steve Broughman(Indicator 22) (202) 219-1744
Schools and Staffing Survey (SASS) NCES Daniel Kasprzyk(Indicators 12-15, and 30-33) (202) 219-1588
Youth Risk Behavior Survey (YRBS) CDC Laura Kann(Indicators 23-29) (770) 488-3251
Appendix A, B, C, D 10/30/97 12:14 PM Page 331

Readers interested in further analyses from NCES data sources can contact the National Education Data ResourceCenter (NEDRC) at the National Center for Education Statistics. NCES has established the NEDRC to enable stateeducation personnel, education researchers, and others to obtain special statistical tabulations and analyses of data setsmaintained by NCES. Researchers and others can ask the Data Center to perform specific tabulations or analyses, orthey can work on-site directly with confidential files upon signing a confidentiality pledge. This service currently isprovided free of charge by NCES.
The Data Center has files available from the:
Common Core of Data (CCD),Integrated Postsecondary Education Data System (IPEDS), National Education Longitudinal Study (NELS:88), National Household Education Survey (NHES), National Postsecondary Student Aid Study (NPSAS),National Study of Postsecondary Faculty, and Schools and Staffing Survey (SASS).
In the future, the Data Center plans to add additional databases to its inventory.
To contact the National Education Data Resource Center, write or call:
c/o Pinkerton Computer Consultants, Inc.1900 North Beauregard Street, Suite 200Alexandria, VA 22311-1722
Fax requests to: (703) 820-7465Phone: (703) 845-3151http://www.ed.gov/
332
Appendix A, B, C, D 10/30/97 12:14 PM Page 332

333
Planning, design, writing, and production of the 1997National Education Goals Report and Summary were
the responsibility of Leslie Lawrence and CynthiaPrince. Babette Gutmann, Jennifer Hamilton, AllisonHenderson, and Ann Webber of Westat suppliedinvaluable technical assistance and statistical supportservices. Tracey Summerall and Michael Walker of Westat contributed expertise in graphic design, layout,and report production. Scott Miller of Editorial Experts,Inc., provided editorial support.
The National Education Goals Panel and staff gratefullyacknowledge the contributions of many other thought-ful and knowledgeable people who helped develop the1997 National Education Goals Report and Summary.Some served on the Panel’s Working Group as staff tothe Goals Panel members. Others were invaluable con-sultants offering their expertise on data acquisition andanalysis or report production. We extend a specialthanks to G. Thomas Houlihan and Lynda McCulloch,representatives of the 1997 Chair of the Panel, Gover-nor James B. Hunt of North Carolina, for their contribu-tions. We remain appreciative of the good counsel andsupport we received from all.
REPORT PRODUCTION
Julie Daft, WestatBabette Gutmann, WestatJennifer Hamilton, WestatAllison Henderson, WestatScott Miller, Editorial ExpertsTracey Summerall, WestatMichael Walker, WestatAnn Webber, WestatJohn Woods, U.S. Department of Education
REPORTING COMMITTEE
John Barth, National Governors’ Association Carol Hedges, Office of the Governor of Colorado
G. Thomas Houlihan, Office of the Governor of North Carolina
Sherry Kaiman, U.S. Senate, Office of Senator JeffordsTim Kelly, Office of the Governor of MichiganLynda McCulloch, Office of the Governor of North
Carolina Drew Petersen, Office of the Governor of WisconsinMary Rollefson, U.S. Department of Education,
National Center for Education StatisticsAlexander Russo, U.S. Senate, Office of Senator
BingamanPatty Sullivan, National Governors’ AssociationLisa Weil, Office of the Governor of ColoradoDwayne Williams, Wisconsin State Legislature,
Office of State Representative CoggsLinda Wilson, Office of the Governor of New Jersey
WORKING GROUP
Governors’ Representatives
Debra Bryant, Office of the Governor of North CarolinaJulie Booth, Office of the Governor of Mississippi Carol Hedges, Office of the Governor of Colorado Dan Hermes, Office of the Governor of KansasG. Thomas Houlihan, Office of the Governor
of North Carolina Julie Kane, Office of the Governor of WisconsinTim Kelly, Office of the Governor of Michigan Leo Klagholz, New Jersey Department of EducationLynda McCulloch, Office of the Governor of
North Carolina Drew Petersen, Office of the Governor of WisconsinRoy Peterson, Kentucky Department of Education LeAnne Redick, Office of the Governor of Michigan Jerome Smith, Office of the Governor of Mississippi Sally Vogler, Office of the Governor of ColoradoLisa Weil, Office of the Governor of ColoradoLinda Wilson, Office of the Governor of New Jersey
Appendix D:
Acknowledgements
Appendix A, B, C, D 10/30/97 12:14 PM Page 333

334
Administration Representatives
Mary Cassell, Office of Management and BudgetMike Cohen, The White House, Office of Domestic
PolicyJennifer Davis, U.S. Department of Education,
Office of Intergovernmental and Interagency AffairsMaggie McNeely, U.S. Department of Education,
Office of Educational Research and ImprovementMary Rollefson, U.S. Department of Education,
National Center for Education Statistics
Congressional Representatives
Callie Coffman, U.S. House of Representatives, Office of Representative Kildee
Pam Devitt, U.S. Senate, Office of Senator Jeffords Sherry Kaiman, U.S. Senate, Office of Senator JeffordsVic Klatt, U.S. House of Representatives, Office of
Representative GoodlingHans Meeder, U.S. House of Representatives, Office
of Representative GoodlingAlexander Russo, U.S. Senate, Office of Senator
BingamanBecky Voslow, U.S. House of Representatives, Office
of Representative Goodling
State Legislators’ Representatives
Ron Cowell, Pennsylvania State Legislature, Office of State Representative Cowell
Jana Jones, Idaho State Legislature, Office of State Representative Jones
Dwayne Williams, Wisconsin State Legislature, Office of State Representative Coggs
Gayle Sabdo, Illinois State Legislature, Office of State Representative Cowlishaw
Other Working Group Contributors
John Barth, National Governors’ AssociationDavid Shreve, National Conference of State
LegislaturesPatty Sullivan, National Governors’ Association
DATA ACQUISITION
Steve Agbayani, Pinkerton Susan Ahmed, U.S. Department of EducationNabeel Alsalam, U.S. Department of EducationEllen Anderson, Centers for Disease Control
and PreventionLeslye Arsht, Coalition for Goals 2000Yupin Bae, PinkertonMike Battaglia, Abt AssociatesJonaki Bose, U.S. Department of EducationMary Lyn Bourque, National Assessment
Governing Board
Steve Broughman, U.S. Department of EducationJoyce Buchanon, University of MichiganRobert Burton, U.S. Department of EducationJim Carlson, Educational Testing ServicePeggy Carr, U.S. Department of EducationKathryn Chandler, U.S. Department of EducationChristopher Chapman, Education Statistics
Services InstituteSally Clarke, U.S. Department of Health and
Human ServicesWade Curry, College BoardSally Curtin, National Center for Health StatisticsMike Davis, WestatSherry Everett, Centers for Disease Control and
PreventionLaura Flicker, WestatPascal D. Forgione, Jr., U.S. Department of EducationDavid Freund, Educational Testing ServiceArnold Goldstein, U.S. Department of EducationSteve Gorman, U.S. Department of EducationTeresa Grimes, Quantum Research CorporationMargaret Daly Hunker, WestatLee Hoffman, U.S. Department of EducationLaura Jerry, Educational Testing ServiceLloyd Johnston, University of MichiganLaura Kann, Centers for Disease Control and
PreventionPhillip Kaufman, MPR Associates, Inc.Laura Mitchell King, Aspen Systems CorporationSteve Klein, MPR Associates, Inc.Roslyn Korb, U.S. Department of EducationGinger Maggio, University of MichiganEdith McArthur, U.S. Department of EducationMarilyn McMillen, U.S. Department of EducationSteve Meshanko, Educational Testing ServiceFrank Morgan, U.S. Department of EducationChristine Winquist Nord, WestatPatrick O’Malley, University of MichiganEugene Owen, U.S. Department of EducationLois Peak, U.S. Department of EducationGary Phillips, U.S. Department of EducationPaul Planchon, U.S. Department of EducationIsabelle Puskas, Educational Testing ServiceTrina Zetti Rice, U.S. Department of Health
and Human ServicesMary Rollefson, U.S. Department of EducationJohn Seitsema, U.S. Department of EducationJeffrey Stunkard, WestatSayuri Takahira, Education Statistics Services
InstituteStephanie Ventura, U.S. Department of Health
and Human ServicesRay Wiles, WestatNicholas Zill, Westat
Appendix A, B, C, D 10/30/97 12:14 PM Page 334

335
The Goals Panel also wishes to thank the followingindividuals who continue to serve or who have
served as advisors to the Panel on a wide variety of educational policy, practice, and research issues,including data collection and analysis, measurementand assessment, standards-setting, basic and appliedresearch, and promising and effective practices.
RESOURCE AND TECHNICAL PLANNING GROUPS
GOAL 1: READY TO LEARN
Goal 1 Ready Schools Resource Group
Leaders: Asa Hilliard, Georgia State University Sharon Lynn Kagan, Yale University
Members:Barbara Bowman, Erikson InstituteCynthia Brown, Council of Chief State School OfficersFred Brown, Boyertown Elementary SchoolLinda Espinosa, University of MissouriDonna Foglia, Norwood Creek SchoolPeter Gerber, MacArthur FoundationSarah Greene, National Head Start AssociationJudith Heumann, U.S. Department of EducationMogens Jensen, National Center for Mediated LearningLilian Katz, ERIC Clearinghouse for Elementary and
Early Childhood Education Michael Levine, Carnegie Corporation of New YorkEvelyn Moore, National Black Child Development
InstituteTom Schultz, National Association of State Boards of
EducationBarbara Sizemore, DePaul UniversityRobert Slavin, Johns Hopkins University
Goal 1 Assessments Resource Group
Leaders: Sharon Lynn Kagan, Yale University Lorrie Shepard, University of Colorado
Members:Sue Bredekamp, National Association for the
Education of Young ChildrenEdward Chittenden, Educational Testing ServiceHarriet Egertson, Nebraska State Department
of EducationEugene García, University of California, BerkeleyM. Elizabeth Graue, University of WisconsinKenji Hakuta, Stanford UniversityCarollee Howes, University of California, Los AngelesLuís Laosa, Educational Testing ServiceAnnemarie Palincsar, University of MichiganTej Pandey, California State Department of EducationCatherine Snow, Harvard University
Maurice Sykes, District of Columbia Public SchoolsValora Washington, The Kellogg FoundationNicholas Zill, Westat
Technical Planning Group on Readiness for School
Leader: Sharon Lynn Kagan, Yale University
Members:Sue Bredekamp, National Association for the
Education of Young ChildrenM. Elizabeth Graue, University of WisconsinLuís Laosa, Educational Testing ServiceSamuel Meisels, University of MichiganEvelyn Moore, National Black Child Development
InstituteLucile Newman, Brown UniversityLorrie Shepard, University of ColoradoValora Washington, The Kellogg FoundationNicholas Zill, Westat
GOAL 2: SCHOOL COMPLETION
Resource Group Convener: Rafael Valdivieso, Academy for Educational Development, Inc.
Members:Janet Baldwin, General Education Development
Testing ServiceJosé Cardenas, The Intercultural Development
Research AssociationBarbara Clements, Council of Chief State School
OfficersEdmond Gordon, City College of New YorkNoreen López, Illinois State Board of EducationPamela Keating, University of WashingtonSteven Neilson, Milliman and Robertson, Inc.Bill Padia, California State Department of EducationAaron Pallas, Michigan State UniversityRichard Wallace, University of Pittsburgh
Technical Planning Subgroup on Core Data Elements
Leader:Barbara Clements, Council of Chief State School Officers
Members:Linda Baker, Maryland State Department of EducationPaul Barton, Educational Testing ServiceMatthew Cohen, Ohio Department of EducationDennis Jones, National Center for Higher Education
Management SystemsGlynn Ligon, Evaluation Software PublicationJohn Porter, Urban Education Alliance, Inc.Ramsay Selden, Education Statistics Services Institute,
American Institutes for ResearchNicholas Zill, Westat
Appendix A, B, C, D 10/30/97 12:14 PM Page 335

336
GOAL 3: STUDENT ACHIEVEMENT AND CITIZENSHIP
Resource Group Convener: Lauren Resnick, University of Pittsburgh
Members:Gordon Ambach, Council of Chief State School
OfficersChester Finn, Jr., Hudson InstituteAsa Hilliard, Georgia State UniversityDavid Hornbeck, Philadelphia Public SchoolsRichard Mills, New York Department of EducationClaire Pelton, San Jose Unified School District
Goals 3/5 NAEP Technical Advisory Subgroup
Leader: Ramsay Selden, Education Statistics Services Institute, American Institutes for Research
Members:Eva Baker, University of California, Los AngelesDorothy Gilford, National Academy of SciencesRobert Glaser, University of PittsburghSteven Leinwand, Connecticut State Department
of EducationRobert Linn, University of ColoradoMichael Nettles, University of MichiganSenta Raizen, National Center for Improving
Science EducationWilliam Schmidt, Michigan State UniversityElizabeth Stage, National Research CouncilUri Treisman, University of Texas, AustinJames Wilsford, Jim Wilsford Associates, Inc.
GOAL 4: TEACHER EDUCATION AND PROFESSIONAL DEVELOPMENT
Resource Group Convener: David Imig, AmericanAssociation of Colleges for Teacher Education
Members:Marsha Berger, American Federation of TeachersGene Carter, Association for Supervision and
Curriculum DevelopmentLinda Darling Hammond, Teachers College,
Columbia UniversityLauna Ellison, Clara Barton School, Minneapolis,
MinnesotaEarlene Gillan-Smith, Delaware State Education
AssociationHoward Jensen, Pioneer High School, Cupertino,
CaliforniaJames Kelly, National Board for Professional
Teaching StandardsJudith Lanier, Michigan State University
Marion Payne, Mount View Middle School, Marriottsville, Maryland
Stan Paz, El Paso School District, TexasJudith Renyi, National Foundation for the
Improvement of EducationTed Sanders, Southern Illinois UniversityClaudette Scott, Hickman Mills Consolidated School
District #1, Kansas City, MissouriMarilyn Scannel, Indiana Professional Standards BoardMary Strandburg, Eagleton School, Denver, ColoradoArthur Wise, National Council for the Accreditation
of Teacher EducationWayne Worner, Virginia Tech
Advisors for Resource Group on Teacher Education and Professional Development:Sharon Bobbitt, U.S. Department of EducationPatricia Brown, National Governors’ AssociationTerry Dozier, U.S. Department of EducationJean Miller, Council of Chief State School OfficersMary Rollefson, U.S. Department of EducationJoe Vaughan, U.S. Department of Education
GOAL 5: MATHEMATICS AND SCIENCE
Resource Group Convener: Alvin Trivelpiece, Oak Ridge National Laboratory
Members:Iris Carl, National Council of Teachers of MathematicsSteven Leinwand, Connecticut State Department of
EducationMichael Nettles, University of MichiganAlba Ortiz, University of Texas, AustinSenta Raizen, National Center for Improving Science
EducationRamsay Selden, Education Statistics Services Institute,
American Institutes for Research
Goals 3/5 Standards Review Technical Planning Subgroup
Leader: Shirley Malcom, American Association for the Advancement of Science
Members:Iris Carl, National Council of Teachers of MathematicsThomas Crawford, U.S. Olympic CommitteeMihaly Csikszentmihalyi, University of ChicagoPhillip Daro, University of CaliforniaChester Finn, Jr., Hudson InstituteAnne Heald, University of MarylandDavid Hornbeck, Philadelphia Public SchoolsDavid Kearns, Xerox CorporationRichard Mills, New York Department of EducationHarold Noah, Teachers College, Columbia University
Appendix A, B, C, D 10/30/97 12:14 PM Page 336

337
Claire Pelton, San Jose Unified School DistrictJames Renier, Honeywell CorporationSidney Smith, Coalition of Essential Schools/AtlasJames Wilsford, Jim Wilsford Associates, Inc.
Goals 3/5 Higher Education Advisory Group on Standards
Leader: Michael Timpane, Teachers College, Columbia University
Members:Bob Albright, Educational Testing ServiceMichael Behnke, Massachusetts Institute of TechnologyKenneth Boutte, Xavier UniversityDavid Conley, University of OregonJon Fuller, National Association of Independent
Colleges and UniversitiesClaire Gaudiani, Connecticut CollegeTerry Hartle, American Council of EducationDoris Helms, Clemson UniversityBob McCabe, Miami-Dade Community CollegeArturo Pacheco, University of Texas-El PasoPaul Ruiz, American Association of Higher EducationDonald Stewart, The College BoardArthur Wise, National Council for the Accreditation
of Teacher Education
GOAL 6: ADULT LITERACY AND LIFELONGLEARNING
Resource Group Convener: Mark Musick, Southern Regional Education Board
Members:Paul Barton, Educational Testing ServiceForest Chisman, Southport Institute for Policy AnalysisPeter Ewell, National Center for Higher Education
Management SystemsJoy McLarty, American College TestingWilliam Spring, Federal Reserve Bank of BostonThomas Sticht, Applied, Behavioral, and Cognitive
Sciences, Inc.Marc Tucker, National Center on Education and
the Economy
GOAL 7: SAFE, DISCIPLINED, AND ALCOHOL- AND DRUG-FREE SCHOOLS
Resource Group Convener: John Porter, Urban Education Alliance
Members:C. Leonard Anderson, Portland Public SchoolsMichael Guerra, National Catholic Education
Association
J. David Hawkins, Social Development Research GroupFred Hechinger, Carnegie Corporation of New YorkBarbara Huff, Federation of Families for Children’s
Mental HealthLloyd Johnston, University of MichiganRonda Talley, American Psychological Association
Advisors for Resource Group on Safe, Disciplined,and Alcohol- and Drug-free Schools:Janet Collins, Centers for Disease Control and
PreventionVincent Giordano, New York City Public SchoolsOliver Moles, U.S. Department of EducationEd Zubrow, Independent Consultant
Task Force on Disciplined Environments Conducive to Learning
Leader: Ronda Talley, American Psychological Association
Members:C. Leonard Anderson, Portland Public SchoolsMichael Guerra, National Catholic Education
AssociationJ. David Hawkins, Social Development Research GroupFred Hechinger, Carnegie Corporation of New YorkBarbara Huff, Federation of Families for Children’s
Mental Health
Advisors for Task Force on Disciplined Environments Conducive to Learning:Oliver Moles, U.S. Department of EducationEd Zubrow, Independent Consultant
GOAL 8: PARENTAL PARTICIPATION
Resource Group Convener: Joyce Epstein, Johns Hopkins University
Members:Marilyn Aklin, National Coalition of Title 1/
Chapter 1 ParentsJa Net´ Crouse, National PTAJacquelynne Eccles, University of MichiganJane Grinde, Wisconsin Department of Public
InstructionAnne Henderson, National Coalition for Parent
Involvement in EducationThomas Hoffer, National Opinion Research
CorporationAdrian Lewis, National Urban LeagueDouglas Powell, Purdue UniversityJeana Preston, San Diego City SchoolsDiane Scott-Jones, Temple UniversityRalph Smith, The Annie E. Casey Foundation
Appendix A, B, C, D 10/30/97 12:14 PM Page 337

338
Layla Suleiman, Family Resource CoalitionSherry West, Prevention Partnership (National
Head Start Association)
Advisors for Resource Group on Parental Participation:Kathryn Chandler, U.S. Department of EducationAdriana de Kanter, U.S. Department of EducationOliver Moles, U.S. Department of Education
GOALS 3-4-5 STANDARDS IMPLEMENTATIONADVISORY GROUP
Leader: G. Thomas Houlihan, Office of the Governor of North Carolina
Members:Adrienne Bailey, Council of the Great City SchoolsTom Davis, National Association of State Boards
of Education Pat Dingsdale, National PTALily Eskelsen, National Education AssociationSusan Galletti, National Association of Secondary
School Principals Milton Goldberg, National Alliance of BusinessKarl Hertz, American Association of School
AdministratorsGary M. Huggins, Education Leaders CouncilDavid Imig, American Association of Colleges
for Teacher Education Senator David Kerr, Chair, Kansas Senate Ways and
Means CommitteeHenry Marockie, Council of Chief State School OfficersJanice Marston, National Association of Elementary
School Principals Tom Needles, Office of the Governor of OhioMike Resnick, National School Boards AssociationRepresentative Stephen M. Stoll, Chair, Missouri
House Education Committee Susan Traiman, The Business RoundtableTerry Wyatt, American Federation of Teachers
DATA AND REPORTING TASK FORCE
Leader: Rolf Blank, Council of Chief State School Officers
Members:Paul Barton, Educational Testing ServiceMatthew Cohen, Ohio Department of EducationMark Musick, Southern Regional Education BoardCecilia Ottinger, Council of the Great City SchoolsThomas Soltys, Delaware Department of Public
InstructionNicholas Zill, Westat
Task Force Advisors:Patricia Brown, National Governors’ AssociationKaren Greene, U.S. Department of LaborJeanne Griffith, U.S. Department of EducationMary Rollefson, U.S. Department of Education
TASK FORCE ON EDUCATION NETWORK TECHNOLOGY
Leader: Robert Palaich, Education Commission of the States
Members:Laura Breeden, U.S. Department of CommerceJohn Clement, National Science FoundationJan Hawkins, Bank Street College of EducationRobert Kansky, National Academy of SciencesPamela Keating, University of WashingtonGlenn Kessler, Fairfax County Public Schools, VirginiaMark Musick, Southern Regional Education BoardBill Padia, California State Department of EducationNora Sabelli, National Science FoundationRafael Valdivieso, Academy for Educational
Development, Inc.
Task Force Advisors:Steven Gould, Congressional Research ServiceGerald Malitz, U.S. Department of EducationLinda Roberts, U.S. Department of Education
Appendix A, B, C, D 10/30/97 12:14 PM Page 338

339
National Education Goals Panel Staff
Ken Nelson
Executive Director
PROGRAM STAFF
Leslie A. Lawrence
Senior Education Associate
Cynthia D. Prince
Associate Director for Analysis and Reporting
Emily O. Wurtz
Senior Education Associate
ADMINISTRATIVE STAFF
Cynthia M. Dixon
Program Assistant
John Masaitis
Executive Officer
Appendix A, B, C, D 10/30/97 12:14 PM Page 339

1997 National Education Goals Report
Q U E S T I O N N A I R E
The National Education Goals Panel values your feedback on the 1997 National Education Goals Report.Please take a few moments to fill out and return this questionnaire so that we can continue to improvefuture reports. Mail or fax to:
National Education Goals Panel
1255 22nd Street, NW, Suite 502, Washington, DC 20037PHONE (202) 724-0015
FAX (202) 632-0957E-MAIL: [email protected]
Website: http://www.negp.gov
Name: ____________________________________________________________________________________________
Organization: ______________________________________________________________________________________
Address: __________________________________________________________________________________________
City: __________________________________________ State: ____________ Zip: ________________________
Phone: ________________________________________ Fax: ____________________________________________
E-mail: ________________________________________
Please circle all that apply:
Student / Parent / Educator / Business or Community Leader /
Federal, State, or Local Policymaker / Concerned Citizen
1. For what purpose do you use this report?
2. How well has the report served that purpose?
____ Very Well ____ Well ____ Poorly ____ Very Poorly
3. How, if at all, could the report have served you better?
4. How do you rate the usefulness of the following parts of the report?
(1 = not very useful and 5 = very useful)
• Chapter 1 - Mathematics and Science Achievement for the 21st Century
1 2 3 4 5 N/A
• Chapter 2 - U.S. Scorecard and National Exhibits
1 2 3 4 5 N/A
• Chapter 3 - State Scorecards
1 2 3 4 5 N/A
Appendix A, B, C, D 10/30/97 12:14 PM Page 341
The National Education Goals Panel thanks you for your interest.
Place First Class
Postage Here or Fax to:
(202) 632-0957
National Education Goals Panel
1255 22nd Street, NW, Suite 502
Washington, DC 20037
Tape here
Benchmarks and Standards as Tools for Science Education Reform (George Nelson, American Association for theAdvancement of Science)
Clarifying Questions About Persistence and Change: Standards-Based Reform in Nine States (Diane Massell, Consortium forPolicy Research in Education)
Improving Student Learning in Mathematics and Science: TheRole of National Standards in State Policy (National Council ofTeachers of Mathematics and the National Research Council)
Overcoming Structural Barriers to Good Textbooks (Harriet Tyson)
Reflections on State Efforts to Improve Mathematics and Science Education in Light of Findings from TIMSS (Andrew Zucker, SRI International)
Teaching for High Standards: What Policymakers Need to Know and Be Able to Do (Linda Darling Hammond, and D. Loewenberg Ball, Teachers College, ColumbiaUniversity)
5. Please check if you would like to obtain free copies of the following:
How many?
1997 National Education Goals Report ____1997 Summary: Mathematics and Science Achievement for the 21st Century ____1996 National Education Goals Report ____1996 Executive Summary: Commonly Asked Questions About Standards and Assessments ____1995 National Education Goals Report ____1995 Executive Summary: Improving Education Through Family-School-Community Partnerships ____CD-ROM with 1994 and 1995 Goals Reports ____Getting a Good Start in School ____Special Early Childhood Report, 1997 ____Implementing Academic Standards: Papers Commissioned by the National Education Goals Panel, 1997 ____
This volume includes:
Appendix A, B, C, D 10/30/97 12:14 PM Page 342


![Update National Science Foundation - A research and ... · services to serve national goals in basic research and education in the Earth sciences [and] would support mission goals](https://static.fdocuments.net/doc/165x107/5fa434f161a8a24a86211617/update-national-science-foundation-a-research-and-services-to-serve-national.jpg)