The National Climate Predictions and Projections (NCPP...
18
The National Climate Predictions and Projections (NCPP) Platform: Development of Capacity to Support Planning and Management NCPP Core Team Richard B. Rood November 15, 2013 MAPP / CPO / Webinar
Transcript of The National Climate Predictions and Projections (NCPP...
The National Climate Predictions and Projections (NCPP) Platform:
Development of Capacity to Support Planning and Management
NCPP Core Team Richard B. Rood
November 15, 2013 MAPP / CPO / Webinar
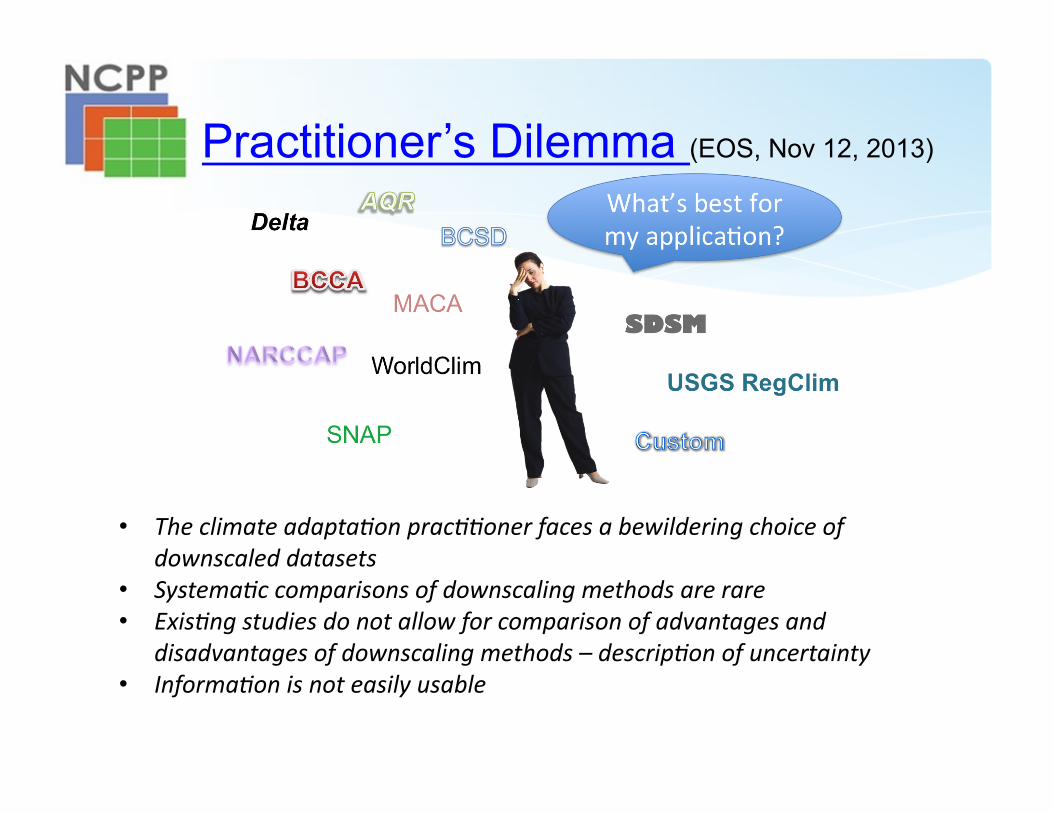
Practitioner’s Dilemma (EOS, Nov 12, 2013)
• The climate adapta-on prac--oner faces a bewildering choice of downscaled datasets
• Systema-c comparisons of downscaling methods are rare • Exis-ng studies do not allow for comparison of advantages and
disadvantages of downscaling methods – descrip-on of uncertainty • Informa-on is not easily usable
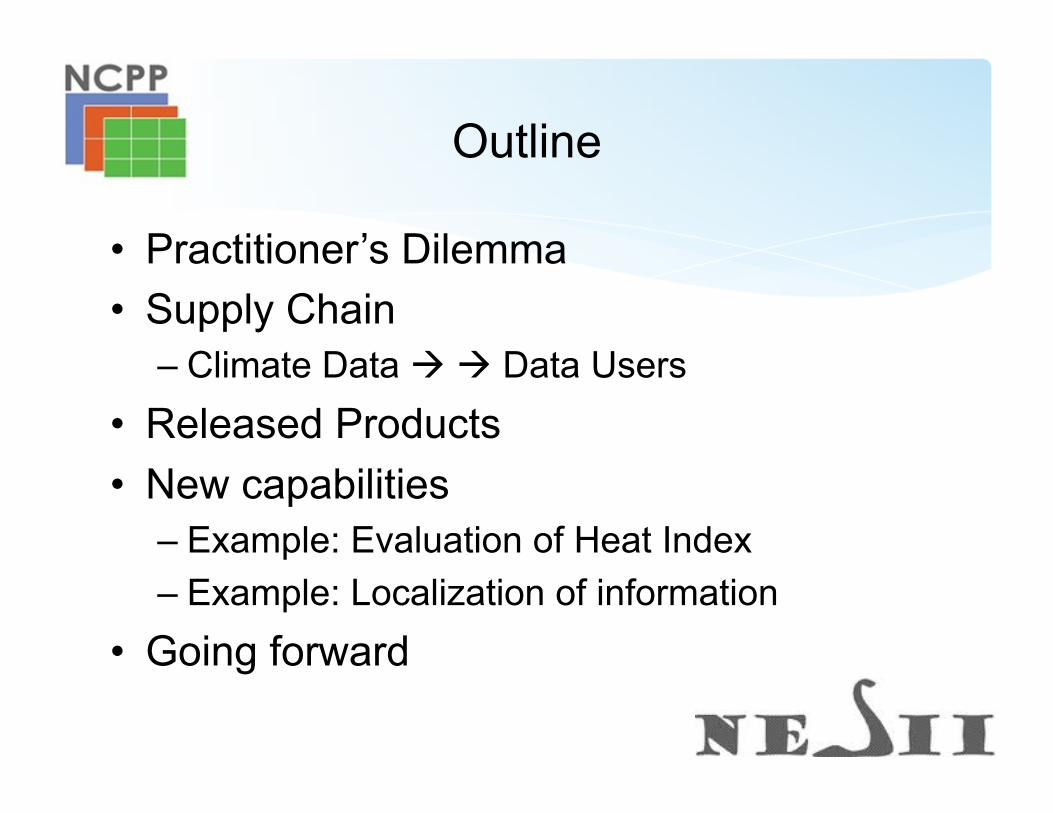
Outline
• Practitioner’s Dilemma • Supply Chain
– Climate Data Data Users • Released Products • New capabilities
– Example: Evaluation of Heat Index – Example: Localization of information
• Going forward
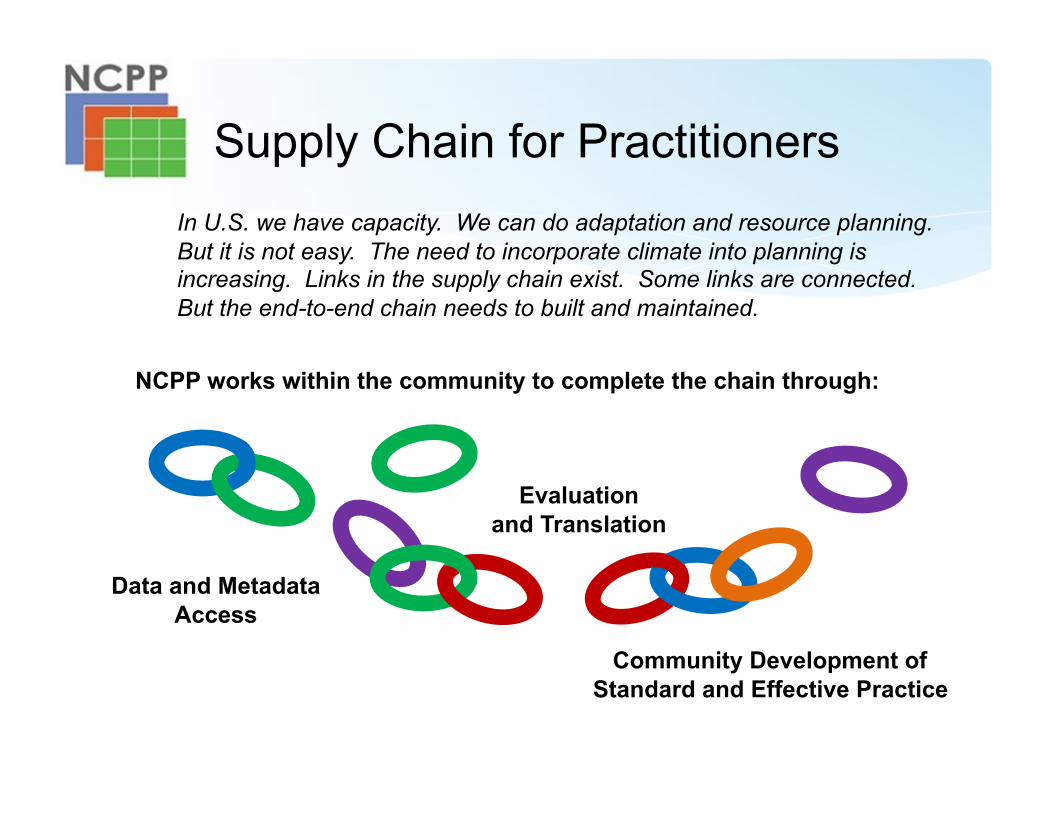
Supply Chain for Practitioners In U.S. we have capacity. We can do adaptation and resource planning. But it is not easy. The need to incorporate climate into planning is increasing. Links in the supply chain exist. Some links are connected. But the end-to-end chain needs to built and maintained.
Data and Metadata Access
Evaluation and Translation
Community Development of Standard and Effective Practice
NCPP works within the community to complete the chain through:
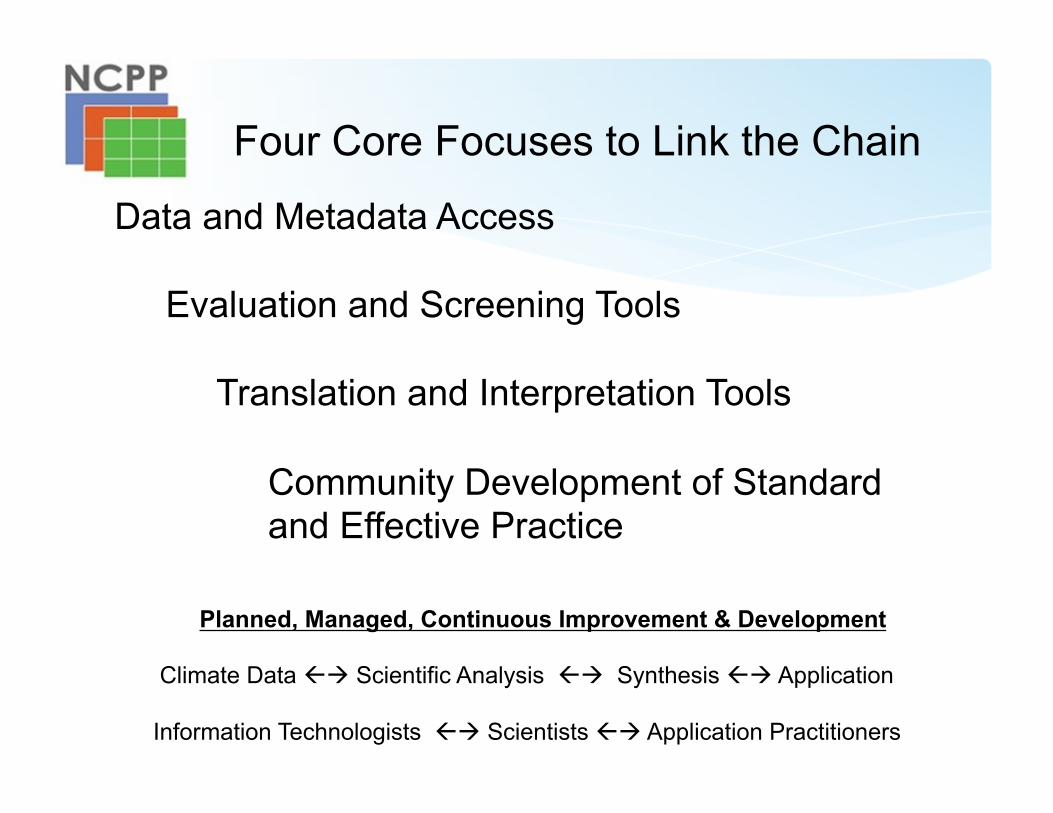
Four Core Focuses to Link the Chain
Data and Metadata Access
Evaluation and Screening Tools
Translation and Interpretation Tools
Community Development of Standard and Effective Practice
Climate Data Scientific Analysis Synthesis Application
Information Technologists Scientists Application Practitioners
Planned, Managed, Continuous Improvement & Development
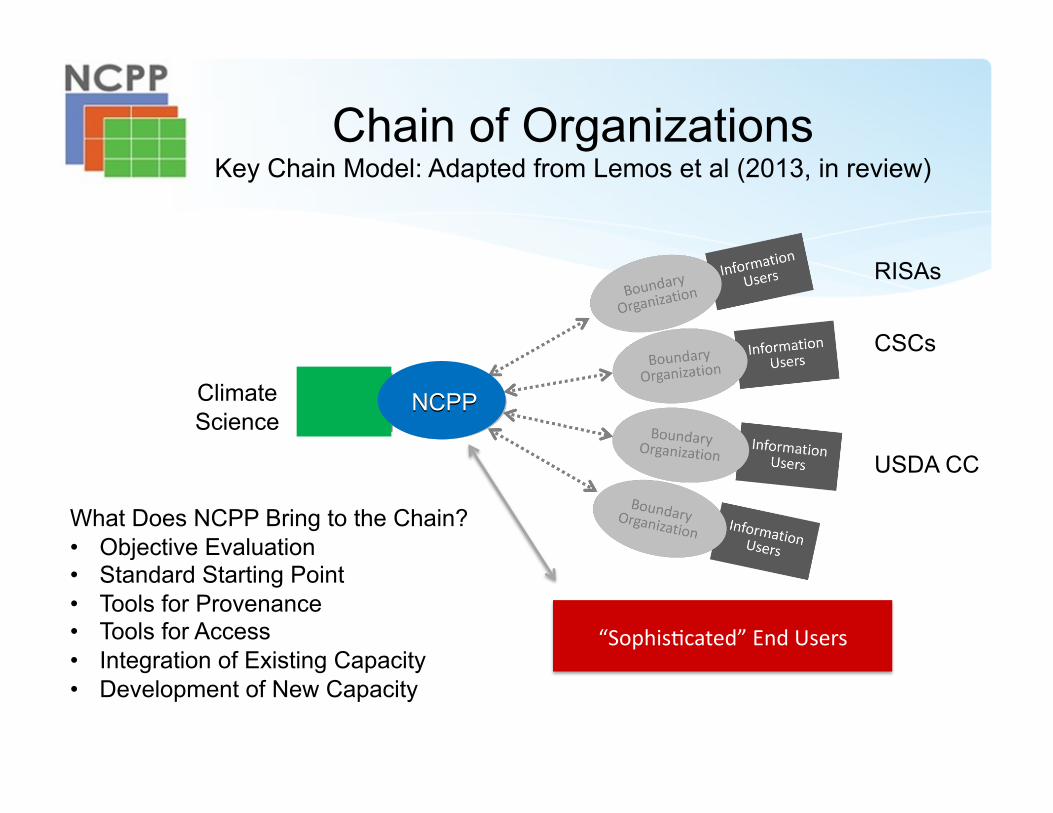
“Sophis(cated” End Users
Chain of Organizations Key Chain Model: Adapted from Lemos et al (2013, in review)
Climate Science
CSCs
USDA CC
RISAs
What Does NCPP Bring to the Chain? • Objective Evaluation • Standard Starting Point • Tools for Provenance • Tools for Access • Integration of Existing Capacity • Development of New Capacity
NCPP NCPP
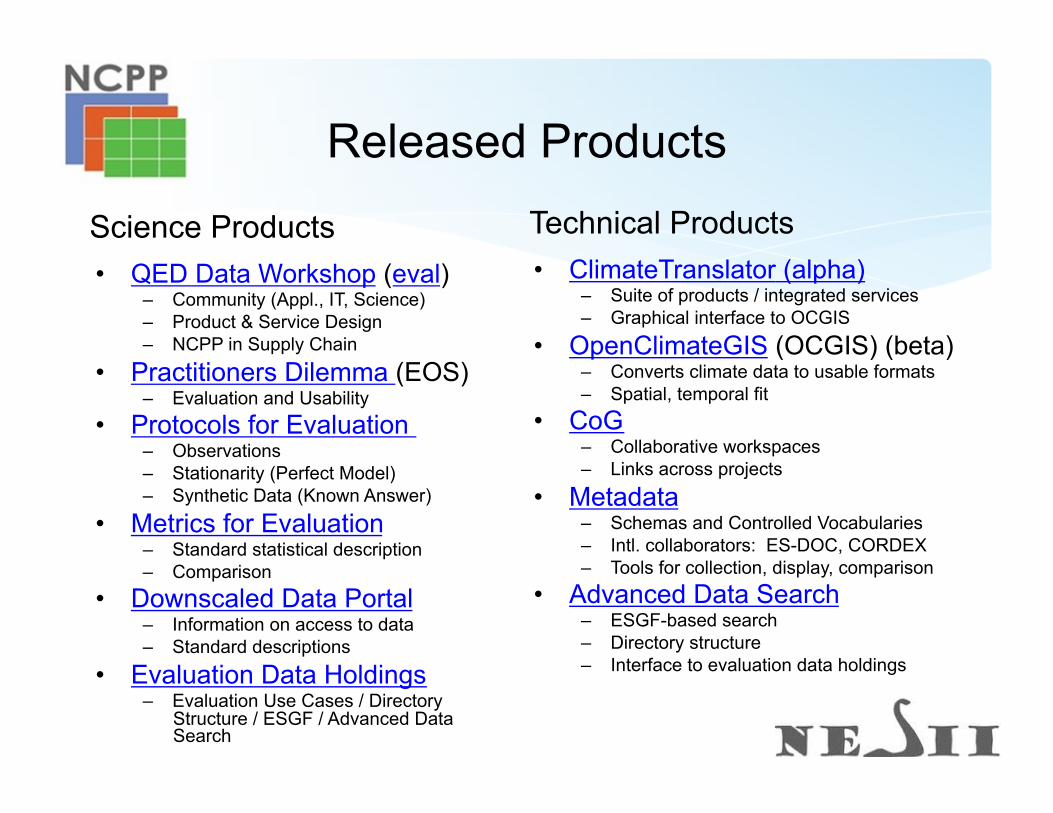
Released Products
• ClimateTranslator (alpha) – Suite of products / integrated services – Graphical interface to OCGIS
• OpenClimateGIS (OCGIS) (beta) – Converts climate data to usable formats – Spatial, temporal fit
• CoG – Collaborative workspaces – Links across projects
• Metadata – Schemas and Controlled Vocabularies – Intl. collaborators: ES-DOC, CORDEX – Tools for collection, display, comparison
• Advanced Data Search – ESGF-based search – Directory structure – Interface to evaluation data holdings
• QED Data Workshop (eval) – Community (Appl., IT, Science) – Product & Service Design – NCPP in Supply Chain
• Practitioners Dilemma (EOS) – Evaluation and Usability
• Protocols for Evaluation – Observations – Stationarity (Perfect Model) – Synthetic Data (Known Answer)
• Metrics for Evaluation – Standard statistical description – Comparison
• Downscaled Data Portal – Information on access to data – Standard descriptions
• Evaluation Data Holdings – Evaluation Use Cases / Directory
Structure / ESGF / Advanced Data Search
Technical Products Science Products
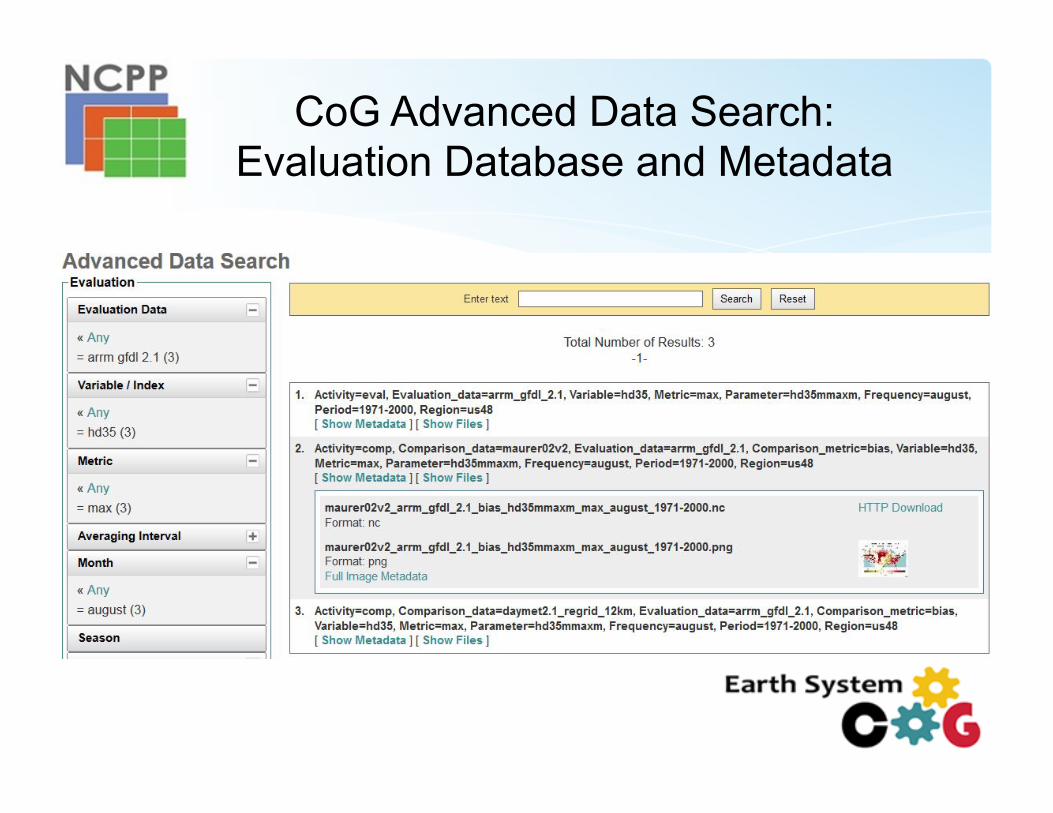
CoG Advanced Data Search: Evaluation Database and Metadata
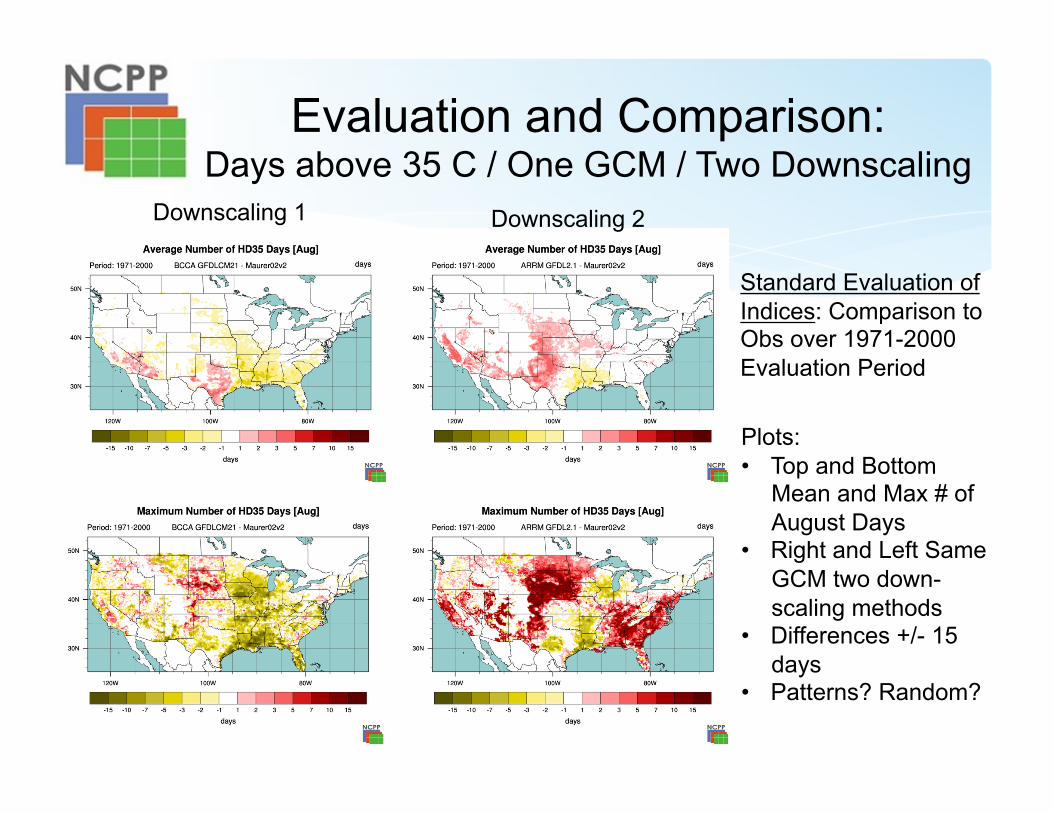
Evaluation and Comparison: Days above 35 C / One GCM / Two Downscaling
Downscaling 2 Downscaling 1
Plots: • Top and Bottom
Mean and Max # of August Days
• Right and Left Same GCM two down-scaling methods
• Differences +/- 15 days
• Patterns? Random?
Standard Evaluation of Indices: Comparison to Obs over 1971-2000 Evaluation Period
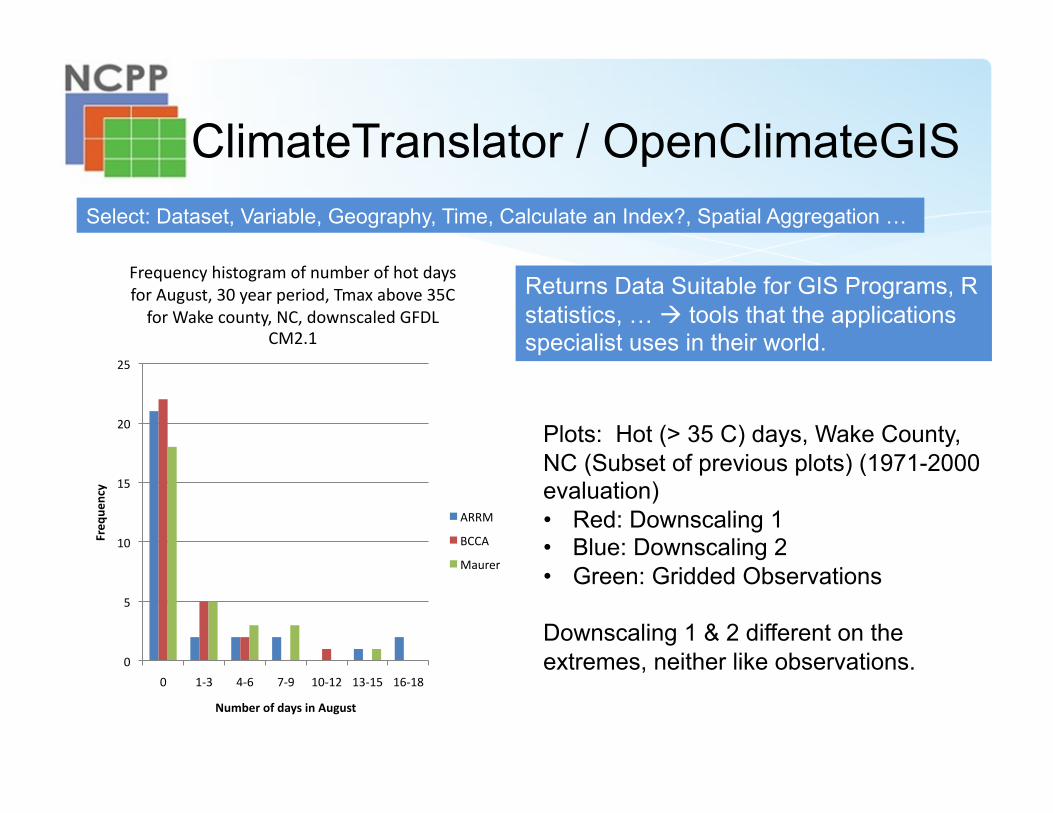
ClimateTranslator / OpenClimateGIS
0
5
10
15
20
25
0 1-‐3 4-‐6 7-‐9 10-‐12 13-‐15 16-‐18
Freq
uency
Number of days in August
Frequency histogram of number of hot days for August, 30 year period, Tmax above 35C for Wake county, NC, downscaled GFDL
CM2.1
ARRM
BCCA
Maurer
Returns Data Suitable for GIS Programs, R statistics, … tools that the applications specialist uses in their world.
Plots: Hot (> 35 C) days, Wake County, NC (Subset of previous plots) (1971-2000 evaluation) • Red: Downscaling 1 • Blue: Downscaling 2 • Green: Gridded Observations
Downscaling 1 & 2 different on the extremes, neither like observations.
Select: Dataset, Variable, Geography, Time, Calculate an Index?, Spatial Aggregation …
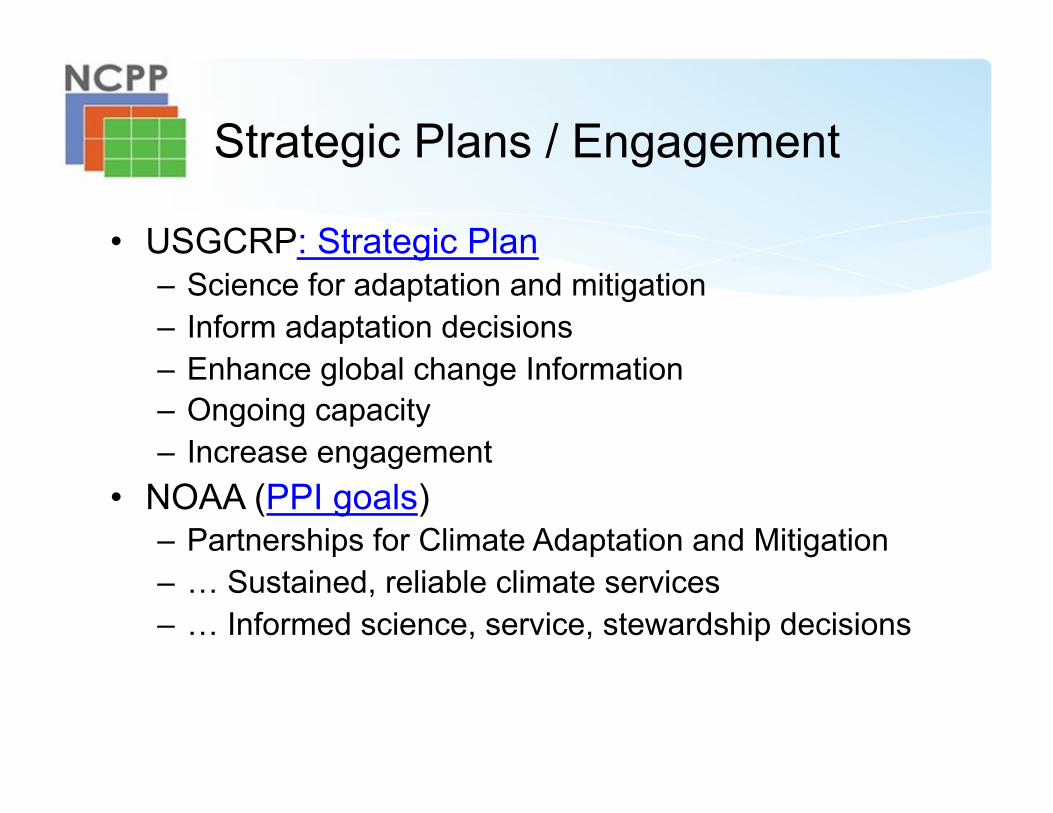
Strategic Plans / Engagement
• USGCRP: Strategic Plan – Science for adaptation and mitigation – Inform adaptation decisions – Enhance global change Information – Ongoing capacity – Increase engagement
• NOAA (PPI goals) – Partnerships for Climate Adaptation and Mitigation – … Sustained, reliable climate services – … Informed science, service, stewardship decisions
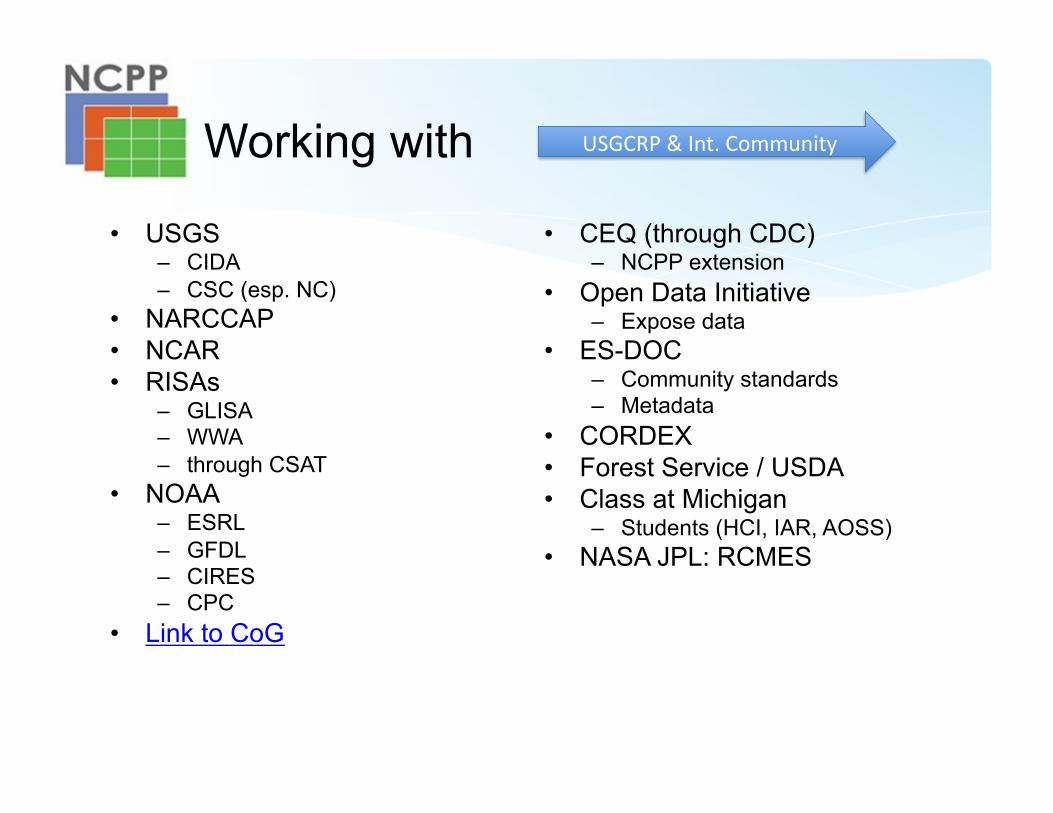
Working with
• USGS – CIDA – CSC (esp. NC)
• NARCCAP • NCAR • RISAs
– GLISA – WWA – through CSAT
• NOAA – ESRL – GFDL – CIRES – CPC
• Link to CoG
• CEQ (through CDC) – NCPP extension
• Open Data Initiative – Expose data
• ES-DOC – Community standards – Metadata
• CORDEX • Forest Service / USDA • Class at Michigan
– Students (HCI, IAR, AOSS) • NASA JPL: RCMES
USGCRP & Int. Community
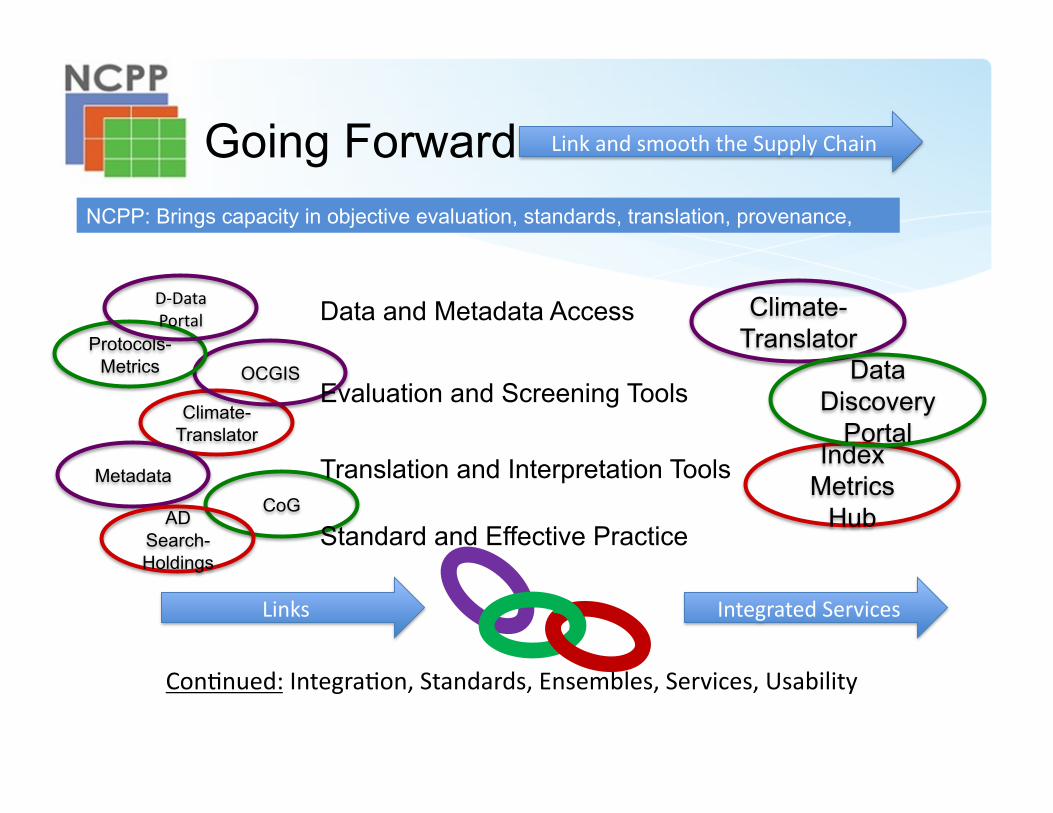
Index Metrics
Hub
Climate-Translator
Data Discovery
Portal
Going Forward
Con(nued: Integra(on, Standards, Ensembles, Services, Usability
Links
Climate-Translator
OCGIS Protocols-
Metrics
Metadata CoG
D-‐Data Portal
AD Search-Holdings
Data and Metadata Access
Evaluation and Screening Tools
Translation and Interpretation Tools
Standard and Effective Practice
Link and smooth the Supply Chain
Integrated Services
NCPP: Brings capacity in objective evaluation, standards, translation, provenance,


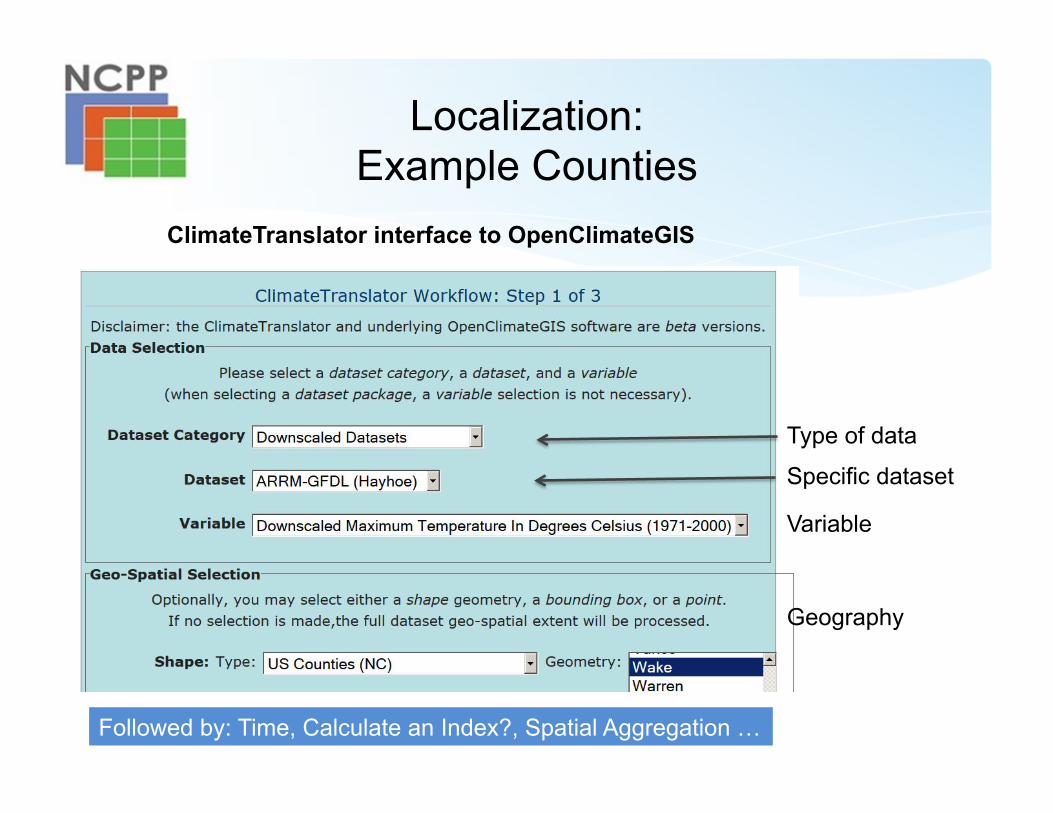
Localization: Example Counties
ClimateTranslator interface to OpenClimateGIS
Variable
Geography
Type of data
Specific dataset
Followed by: Time, Calculate an Index?, Spatial Aggregation …
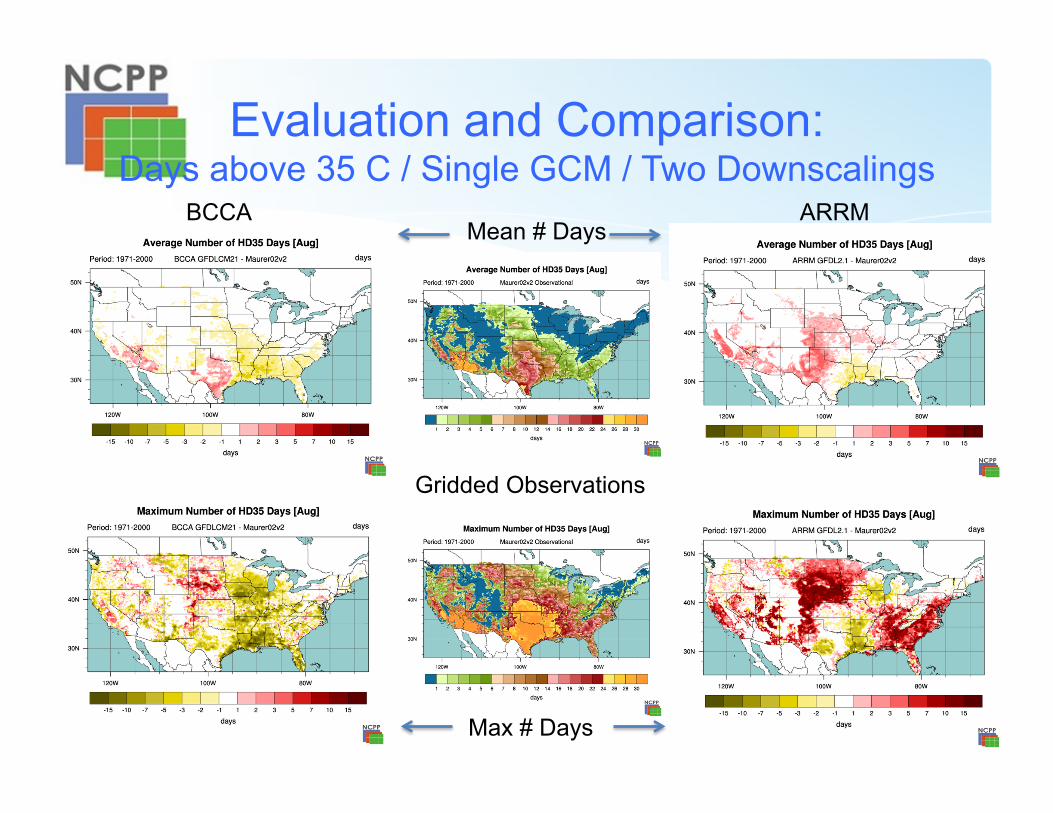
Evaluation and Comparison: Days above 35 C / Single GCM / Two Downscalings
Gridded Observations
Mean # Days
Max # Days
ARRM BCCA
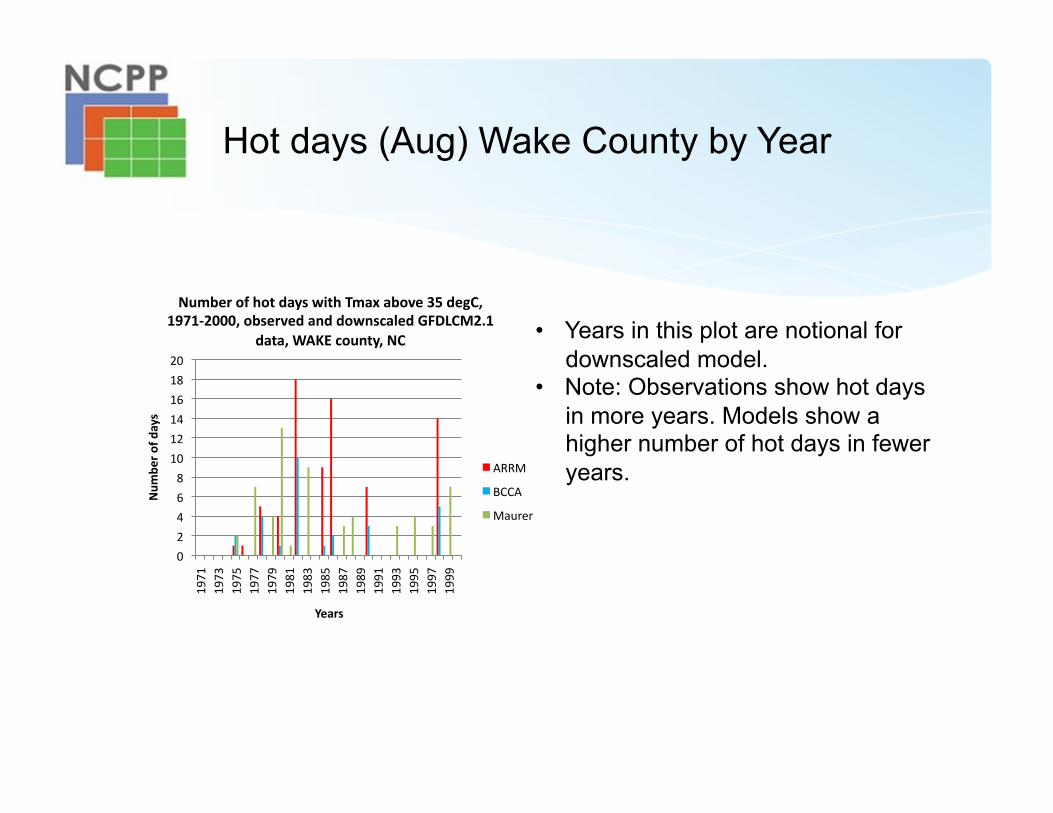
Hot days (Aug) Wake County by Year
0
2
4
6
8
10
12
14
16
18
20
1971
1973
1975
1977
1979
1981
1983
1985
1987
1989
1991
1993
1995
1997
1999
Num
ber of days
Years
Number of hot days with Tmax above 35 degC, 1971-‐2000, observed and downscaled GFDLCM2.1
data, WAKE county, NC
ARRM
BCCA
Maurer
• Years in this plot are notional for downscaled model.
• Note: Observations show hot days in more years. Models show a higher number of hot days in fewer years.