The mutual diffusion coefficient for the van der Waals ...
13
The mutual diffusion coefficient for the van der Waals binary mixture of type I R. Castiilo, C. Garza, and H. Dominguez Instituto de Fisica. UNAM., P.O. Box 20-364 Mexico, D.F.01000 Mexico (Received 16 April 1993; accepted 10 September 1993) In the framework of the mean-field kinetic variational theory, the explicit dependence of the mutual diffusion coefficient of the van der Waals binary mixture with composition and interaction parameters is obtained. The different kinds of behavior shown by this coefficient can be classified according to the scheme of van Konynenburg and Scott devised to describe the global phase diagram of this model mixture. A numerical study to understand the concentration dependence of the mutual diffusion coefficients for mixtures of type I is presented here, in terms of molecular masses, sizes, and interaction parameters. Moreover, the behavior of the mutual diffusion coefficient of the van der Waals mixture is compared with that of a hard-sphere mixture. In addition, a comparison is made between our calculations and experimental data of binary systems classified as belonging to type I: HzO/D,O, hexane/heptane, toluene/hexane, and benzene/hexane. From the explicit model presented here, one can obtain semiquantitative explanations of the role played by the variables that determine the concentration dependence of the mutual diffusion coefficient. I. INTRODUCTION The mutual diffusion coefficient (MDC) measures the rate at which the concentration fluctuations (gradients) in a solution approach their equilibrium values. Therefore, the decay of these gradients to obtain the equalization of the concentration throughout the binary mixture takes place by direct change of the composition of every small portion of the fluid. The thermodynamic theory of inter- diffusion has provided unequivocal statements concerning the minimum number of independent coefficients required to describe the mass transport in an isothermal fluid con- taining any specified number of components.’ In some bi- nary systems within this framework, it is possible to dem- onstrate some regularities in the diffusion behavior of a series of related solutes in the same solvent.’ But, from a more fundamental point of view, theory has not been able to explain how the MDC is related to the intermolecular interaction parameters. Although some developments have been presented,3-‘0 the interpretation of diffusion coeffi- cients of binary mixtures in a more fundamental way has been pursued for a long time without great success. Probably, one of the most used theories to correlate mutual diffusion data relies on the empirical equations of Hartley and Crank.3*4V6”0 Here the MDC is related to two self-diffusion coefficients and it can be helpful in some ap- plications,6*1 ’ but these equations provide little insight into the nature of mutual diffusion at a microscopic level. Moreover, to be useful as a predictive tool two self- diffusion coefficients measurements are required, each of which is nearly as difficult to make as the direct measure- ment of the MDC itself. Hence, this approach has little value for predicting MDCs. Another approach used to cor- relate mutual diffusion data is the rough hard-sphere the- 01$,8 Here a hard-sphere theory, the so-called standard Enskog theory’* (SET), is amended to allow for the trans- fer of angular momentum through the rough hard-sphere concept developed by Chandler.i3 This theory although quite popular’“” is incorrect. It relies on the standard Enskog theory which is at odds with linear irreversible thermodynamics.18 A further development in kinetic the- ory due to van Beijeren and Ernst” gave rise to a corrected version for the Enskog theory, the revised Enskog theory (RET). The partial success of the rough hard-sphere the- ory for predicting diffusion in binary solutions, nearly ideal, arises from the way in which it includes the correc- tion due to correlated motion. A density dependent correc- tion factor,7’8 coming from comparing SET and molecular dynamics simulations*’ is used. Therefore, other effects in addition to correlated motion are included in this correc- tion factor. The RET is prominent for transport properties, since it is a kinetic theory for hard-sphere fluids, beyond the low density limit, that can give explicit calculations.21722 The first computer simulation studies to test the predictions for the mutual diffusion coefficients given in the RET have been presented recently by Erpenbeck.23’24 In the most ex- tended work,24 that author studied equimolar mixtures having a diameter ratio of 0.4, a mass ratio of 0.03, and at volumes 5, 10, and 20 times the close-packed volume. He found evidence of negative deviations form the RET at low densities. Notwithstanding those studies, it is still an open question if the RET can predict correctly the MDC for binary mixtures of hard spheres, in particular at high den- sities. More simulation studies are needed to understand the contribution of correlated motion to the MDC in hard- sphere mixtures. In binary liquid systems with a somewhat realistic in- termolecular model potential, simulations of one particle dynamic phenomena are frequently studied to yield self- diffusion, but investigations of collective properties in such systems as the MDC are scarce. Hence, it is difficult to obtain a clear view of the role played by the several pa- rameters that influence the MDC values. The best model J. Chem. Phys. 99 (12), 15 December 1993 0021-9606/93/99(12)/9899/13/$6.00 @ 1993 American institute of Physics 9899 Downloaded 03 Jan 2008 to 138.23.2.156. Redistribution subject to AIP license or copyright; see http://jcp.aip.org/jcp/copyright.jsp
Transcript of The mutual diffusion coefficient for the van der Waals ...

The mutual diffusion coefficient for the van der Waals binary mixture of type I
R. Castiilo, C. Garza, and H. Dominguez Instituto de Fisica. UNAM., P.O. Box 20-364 Mexico, D.F.01000 Mexico
(Received 16 April 1993; accepted 10 September 1993)
In the framework of the mean-field kinetic variational theory, the explicit dependence of the mutual diffusion coefficient of the van der Waals binary mixture with composition and interaction parameters is obtained. The different kinds of behavior shown by this coefficient can be classified according to the scheme of van Konynenburg and Scott devised to describe the global phase diagram of this model mixture. A numerical study to understand the concentration dependence of the mutual diffusion coefficients for mixtures of type I is presented here, in terms of molecular masses, sizes, and interaction parameters. Moreover, the behavior of the mutual diffusion coefficient of the van der Waals mixture is compared with that of a hard-sphere mixture. In addition, a comparison is made between our calculations and experimental data of binary systems classified as belonging to type I: HzO/D,O, hexane/heptane, toluene/hexane, and benzene/hexane. From the explicit model presented here, one can obtain semiquantitative explanations of the role played by the variables that determine the concentration dependence of the mutual diffusion coefficient.
I. INTRODUCTION
The mutual diffusion coefficient (MDC) measures the rate at which the concentration fluctuations (gradients) in a solution approach their equilibrium values. Therefore, the decay of these gradients to obtain the equalization of the concentration throughout the binary mixture takes place by direct change of the composition of every small portion of the fluid. The thermodynamic theory of inter- diffusion has provided unequivocal statements concerning the minimum number of independent coefficients required to describe the mass transport in an isothermal fluid con- taining any specified number of components.’ In some bi- nary systems within this framework, it is possible to dem- onstrate some regularities in the diffusion behavior of a series of related solutes in the same solvent.’ But, from a more fundamental point of view, theory has not been able to explain how the MDC is related to the intermolecular interaction parameters. Although some developments have been presented,3-‘0 the interpretation of diffusion coeffi- cients of binary mixtures in a more fundamental way has been pursued for a long time without great success.
Probably, one of the most used theories to correlate mutual diffusion data relies on the empirical equations of Hartley and Crank.3*4V6”0 Here the MDC is related to two self-diffusion coefficients and it can be helpful in some ap- plications,6*1 ’ but these equations provide little insight into the nature of mutual diffusion at a microscopic level. Moreover, to be useful as a predictive tool two self- diffusion coefficients measurements are required, each of which is nearly as difficult to make as the direct measure- ment of the MDC itself. Hence, this approach has little value for predicting MDCs. Another approach used to cor- relate mutual diffusion data is the rough hard-sphere the- 01$,8 Here a hard-sphere theory, the so-called standard Enskog theory’* (SET), is amended to allow for the trans- fer of angular momentum through the rough hard-sphere
concept developed by Chandler.i3 This theory although quite popular’“” is incorrect. It relies on the standard Enskog theory which is at odds with linear irreversible thermodynamics.18 A further development in kinetic the- ory due to van Beijeren and Ernst” gave rise to a corrected version for the Enskog theory, the revised Enskog theory (RET). The partial success of the rough hard-sphere the- ory for predicting diffusion in binary solutions, nearly ideal, arises from the way in which it includes the correc- tion due to correlated motion. A density dependent correc- tion factor,7’8 coming from comparing SET and molecular dynamics simulations*’ is used. Therefore, other effects in addition to correlated motion are included in this correc- tion factor.
The RET is prominent for transport properties, since it is a kinetic theory for hard-sphere fluids, beyond the low density limit, that can give explicit calculations.21722 The first computer simulation studies to test the predictions for the mutual diffusion coefficients given in the RET have been presented recently by Erpenbeck.23’24 In the most ex- tended work,24 that author studied equimolar mixtures having a diameter ratio of 0.4, a mass ratio of 0.03, and at volumes 5, 10, and 20 times the close-packed volume. He found evidence of negative deviations form the RET at low densities. Notwithstanding those studies, it is still an open question if the RET can predict correctly the MDC for binary mixtures of hard spheres, in particular at high den- sities. More simulation studies are needed to understand the contribution of correlated motion to the MDC in hard- sphere mixtures.
In binary liquid systems with a somewhat realistic in- termolecular model potential, simulations of one particle dynamic phenomena are frequently studied to yield self- diffusion, but investigations of collective properties in such systems as the MDC are scarce. Hence, it is difficult to obtain a clear view of the role played by the several pa- rameters that influence the MDC values. The best model
J. Chem. Phys. 99 (12), 15 December 1993 0021-9606/93/99(12)/9899/13/$6.00 @ 1993 American institute of Physics 9899 Downloaded 03 Jan 2008 to 138.23.2.156. Redistribution subject to AIP license or copyright; see http://jcp.aip.org/jcp/copyright.jsp

9900 Castillo, Garza, and Dominguez: Diffusion coefficient for type I mixture
potential studied has been the Lennard-Jones poten- tia1.25-31 The work of Hoheisel and collaborators29-31 has been particularly important to understand how the particle volumes and the interaction strength affect the MDC for equimolar mixtures, as well as the role of cross correlation.
The purpose of this paper is to present an alternative route to study the mutual diffusion coefficient of binary mixtures. Of course, a point of interest here is to under- stand the effect on the MDC due to molecular masses, short-range forces (molecular volumes), and attractive po- tential interactions. There are a few model mixtures for which theory can be handled almost without approxima- tions, and can give explicit equations relating their molec- ular parameters to the MDC. One of these is the van der Waals binary mixture. Hence, this paper is addressed to study the MDC of that model mixture, and to show how this procedure can be helpful to understand the way in which the interaction parameters affect the concentration dependence of the MDC of actual systems.
phase diagrams. The behavior of the MDC is similar to that of the free energy curvature, except that the MDC is modulated by a compressibility factor,43P44 and factors re- lated to the dynamics of a two-particle collision. Although, a preliminary survey using these ideas relating diffusion and phase diagram have been presented by one of us else- where,@ they are neither critically discussed nor con- fronted with actual systems.
More than a century ago, van der Waals developed a simple model which turned out to be extremely fruitful in describing the main properties of realistic fluids. In modem language, a rigorous formulation of this model can be given by writing the molecular pair interaction in the form
An outline of the paper is as follows. In Sec. II, we review the kinetic variational theory I, i.e., the van der Waalsian theory of transport processes. In Sec. III, the main features of the scheme of van Konynenburg and Scott are reviewed. Section IV is devoted to presenting a numer- ical study to understand how the different parameters in- volved in the van der Waals theory affect the concentration dependence of the MDC. In addition here, the differences between the calculations using the van der Waals theory and the RET are discussed. In Sec. V, calculations are presented for several actual systems belonging to the dia- grams of type I: H,O/D,O, hexane/heptane, toluene/ hexane and benzene/hexane. These calculations are com- pared with experimental data and with similar calculations performed with the RET.
V(r) = VS(r) +ywyr>, (1)
where Vs refers to the short-range reference system, while VL is the long-range part of the potential, with range y-l. If the properties of this model are analyzed in the limit of y-0, the van der Waals equation combined with the Max- well equal-area construction is obtained.32 Besides, the van der Waals theory has been developed to understand fluid phase equilibria in binary mixtures, and it has revealed a rich variety of behaviors accounting in a qualitatively way, for most of the types of fluid phase equilibria shown by actual mixtures.33’34 This model potential has been also used to understand a long list of related problems such as the theory of capillarity,35 nonuniform fluids,36 interphase properties,37 and density fluctuations.38
There are several points of departure to study the mu-
II. KINETIC VARIATIONAL THEORY
The kinetic variational theory is defined by a set of coupled nonlinear mean-field kinetic equations given be- low, first obtained by Karkheck et ai.43 They were derived for a system of particles interacting through a pair poten- tial consisting of a hard-sphere part plus a smooth but, otherwise arbitrary attractive tail. The set of equations for the two single particle distribution functions defined in a binary mixture fi(rl,Vl,t), (i= 1,2), are the following:
[&+h- &]fi(r,,vl,t)
tual diffusion of the van der Waals mixtures,3943 although, the best suited for obtaining explicit expressions for the MDC in terms of molecular parameters is the mean-field kinetic variational theory.43 Here the expression for the MDC is given in such a way that it can be related to the curvature of the free energy of the binary mixture. The free energy curvature in a binary mixture is responsible of the specific characteristics of the equilibrium phase diagrams. The multiplicity of phases and the connectivity of their associated critical points are determined by the form of the spinodal surfaces (free energy curvature= 0). The different kinds of phase diagrams obtained for the van der Waals mixture have been classified according to a scheme devised by van Konynenburg and Scott.33 With this classification, these authors were able to reproduce most of the known types of fluid-fluid phase equilibria observed in actual fluid mixtures. The relation between the free energy curvature and the MDC can give us a useful way to describe the global behavior of mutual diffusion on the same basis as in
=CRET(filfj) +i, jil Jm r12’“i,
dr2 nj(r2,t)$(rl ,rl
a. a +aijeI Cnkl) - q7l(‘1*) * - fi(rl,Vl,t),
hl ah (2)
where fi(r, ,vl ,t) is the average number of particles of component i (with mass m) at the position ri, at the ve- locity vi, and at the time t. ni= s&i f i( rl ,v, ,t).
The Kac limit
p$+=lirn r’Vij(rr), (3) P-0
can be done in the mean field term (aij -+ O,gii + 1 ), and a kinetic equation can be obtained that embodies the exact thermodynamic description43 of a system interacting with a potential consisting of a hard-sphere core, and an infinitely weak long-range attraction, i.e., the van der Waals inter- action. We shall call this theory KVT I.45 The collision term CaET has exactly the form of that which appears in the revised Enskog theory introduced by van Beijeren and Ernst,”
J. Chem. Phys., Vol. 99, No. 12, 15 December 1993
Downloaded 03 Jan 2008 to 138.23.2.156. Redistribution subject to AIP license or copyright; see http://jcp.aip.org/jcp/copyright.jsp

Castillo, Garza, and Dominguez: Diffusion coefficient for type I mixture 9901
Here Vji=vj-vj is the relative velocity of two particles with velocities Vi and vi, respectively. i is a unit vector directed along the line of centers from the particle of com- ponent j to the particle of component i upon collision, and 0 is the Heaviside step function. vl and vJ denote the velocities of the restituting collision, which are connected to those of the direct collision vi and Vi by the relations
Vi=Vi+2Mji(Vji' Z)E”, (5)
where Mij=mi/(mi+mj). The es are the radial distri- bution functions of a binary hard-sphere mixture. They are the same functionals of the local number densities {ni}, as in the case of the binary mixture in nonuniform equilib- rium.”
Explicit expressions for the transport coefficients up to
I
I
the Navier-Stokes level can be directly obtained by ex- panding the heat, the momentum and the mass fluxes to linear order in the gradients. This is done by solving Eqs. (2) in the Kac limit, in the form fi(” = fi(‘) [I +@J via the Chapman-Enskog development.‘* Here the fro’ are the local Maxwell distribution functions, and @i= B (V). The thermal conductivity and the viscosities obtained are iden- tical to those given in the RET.43 The diffusion coefficients are the only ones that exhibit explicit dependence on the tail strength.43
We will limit our derivation to the case of the MDC of a binary mixture. Here an explicit derivation to obtain this coefficient will be presented on the basis of the procedure developed by Lopez de Haro et al.*’ for the case of hard spheres. The starting point for our discussion will be the linearized integral equations given for the Q’/s in Ref. 43
2 dy;jfj”‘JdV2 f;‘)J j=l
dZ(E^'Vji)e(E"'Vji) [@j(Vi) +cPi(V;)-*j(V*)
/mol+2/3[ %‘f-i] $ *U[ l+g+ (f) it o>ijny,/mij] 1. (6)
The Yij are the contact values of g?, gi = d mi/2kT(vi-u), mij=mi+mj, and GFi%i=%P%‘i- (l/3)%;?, 7 being the unit dyadic and u the local velocity. k is the Boltzmann constant. di = dys + d:, where
(7)
and
d:=(ni,n)8[2~,aij~ni-(~) :“I. (*I
Here the total number density is n=2F=tni, p=$= ,nimi =Zfzlpi, p= l/(kT), the temperature is T= (3/2nk) XHf=‘=,Jdvt( 1/2)mi(vl--u)*fi, and the pressure is P=p’-j-P’, where
(9)
and
P’= i tlijninj. i,j= I
(10)
(11)
The chemical potential is expressed as ~i( T,{nj}) = pyS + ,uLf , where
/Liz2 2 aijnj. i,j=l
(12)
,uyS is the chemical potential for component i in a binary mixture of hard spheres.46
As mentioned, Eq. (6) can be solved on the basis of the method developed for hard-sphere mixtures presented in Ref. 21, with some appropriate changes. Hence, to follow the derivation given there, we will define some variables
J. Chem. Phys., Vol. 99, No. 12, 15 December 1993 Downloaded 03 Jan 2008 to 138.23.2.156. Redistribution subject to AIP license or copyright; see http://jcp.aip.org/jcp/copyright.jsp

9902 Castillo, Garza, and Dominguez: Diffusion coefficient for type I mixture
Ki= 1 + ( fh/5 > j;, azyijn+ij/mij 3 (13) Ky=1+PHS/nkT+(4r/3) C ofyijn+i/mijs (15) j=1
K; = 1 + ( 8~/ 15 ) jzi af’ijn+ij/mij 7 (14) Now, Eq. (6) can be written in the following form:
Equation ( 16) is the same as Eq. (25a) of Ref. 21. The only difference relies on the definition of di, where the tail contribution is included. Hence, following the method of solution presented there,” the independent mass flux in a binary system under the condition of no external forces, mechanical equilibrium and isothermal conditions can be obtained. This mass flux, relative to the local center of mass velocity, can be obtained by substituting the solution for the fi to the first order in the gradients, into the ex- pression
Ji( r,t) = s ml(V1-U)fidvl. (17)
The most relevant steps of the derivation are presented in Appendix A. The final result is as follows:
Jj”= -(pi/2n2) i (l--6jL) j=l
1 a X (Ekj- (Pj/f'L)EkL) 5 nj, (18)
where the Jj” are the macroscopic mass fluxes to the first order in the gradients, relative to the local center of mass velocity, and
j=* *
and
(19)
These functions defined in Ref. 21 should not be confused with the pressure.
Equation (18) has been written in such a way that all the gradients occurring in it are independent. The choice of component L, the dependent component, is arbitrary.47 Although not explicitly indicated, the diffusion coefficients will depend on the choice of L. In the case of solutions, L is usually identified with the solvent.
The macroscopic isothermal-isobaric mass-diffusion coefficient for a binary system is defined by the relation
I
2
Ji=- C (l--6jL)D$“mjinj. (20) j=1
In binary mixtures there is only one independent dif- fusion coefficient.’ Equation (20) has been written in such a way that all the gradients occurring there are indepen- dent. Now, if Eqs. ( 18) and (20) are compared, one can obtain the expression for the MDC for the van der Waals binary mixture in the KVT I
D~~=(p1/2mln2) i di;‘d[Ejl-(P,/PL)Ejt]. (21) j=l
Here the d@ are the coefficients that appear in the Sonine polynomial expansion given by Eq. (Al 1). In order to obtain practical results, one restricts the number of Sonine polynomials in the expansion. We shall adopt here the con- vention usually called the Nth Enskog approximation, i.e., only N Sonine polynomials are taken into account. For details see Appendix B. Equation (2 1) can be transformed straightforwardly into the expression given by Karkheck et aL43 for the MDC. The dependence on the tail contri- bution in Eq. (2 1) comes through the chemical potential, Eqs. (12) and (19). The coefficients di$ depend on the hard core part of the interaction only.
Although, our final formula is the same of that given by Karkheck et al.,43 our procedure has an additional prac- tical advantage. In our derivation, the explicit dependence of the tail contribution is handled in such a way that the structure of the equations given in Ref. 21 for the case of hard spheres is conserved. Thus the tail contribution is included into the chemical potential and the pressure. This makes easier the task of developing numerical solutions to calculate MDCs. In particular, comparisons between the KVT I and the RET are very simple, since we only need to turn off the tail contribution to recover the MDCs given in the RET.
Equation (2 1) can be used for calculating the MDC in binary mixtures, but if one is interested in comparisons with experimental MDCs of actual mixtures, some addi- tional calculations are needed. From the experimental point of view, the natural MDCs are those given relative to the mean volume velocity. Therefore, a transformation is needed. The relationship between the MDC for a binary
J. Chem. Phys., Vol. 99, No. 12, 15 December 1993
Downloaded 03 Jan 2008 to 138.23.2.156. Redistribution subject to AIP license or copyright; see http://jcp.aip.org/jcp/copyright.jsp

Castillo, Garza, and Dominguez: Diffusion coefficient for type I mixture 9903
PIG. 1. Classification of Scott and van Konynenburg. (a) Values of A and c defining the main regions of similar phase diagram (modified from Ref. 33). The shield region is not shown. (b) Sketches of the pressure-temperature projections of the six possible types of fluid phase equilibria exhibited by binary mixtures [modified from K. E. Gubbins, K. S. Shing, and W. B. Street, J. Phys. Chem. 87, 4573 ( 1983)]. The vapor-pressure curves of pure components are shown as solid curves. The gas-liquid-liquid three-phase lines are shown as dash-dot, and the gas-liquid and liquid-liquid critical lines are shown dashed. The U and L are the upper and lower critical end points, respectively.
mixture relative to the local center of mass velocity, DylM, and to the mean volume velocity, Of;, is given by’
D,‘,=(p,)D:,? (22)
where v2 is the partial specific volume of component 2. For details see Appendix C.
III. FLUID PHASE EQUILIBRIA FROM THE VAN DER WAALS MODEL
Studies of fluid phase equilibria have shown that there are continuous transitions between phase diagrams that exhibit gas-liquid, liquid-liquid, and gas-gas phase sepa- rations. Critical lines are often observed to change contin- uously from one type of phase separation to another. When the lines representing a single degree of freedom (pure- component vapor pressure curves, three-phase lines, criti- cal lines, etc.) are plotted on P-T diagrams, the resulting graphs fall naturally into several different categories, pro- viding a convenient basis for classification of the fluid phase equilibria.
A very useful classification scheme has been devised some time ago by van Konynenburg and Scott,33 who used the van der Waals equation of state in a systematic study of fluid phase equilibria. They characterized the mixtures by three adimensional parameters.
(2W
t=($-$) /($+$$ (23b)
(23~)
For g=O, f is related to the difference in critical temper- atures or pressures of the pure components, and A is re- lated to the molar heat of mixing. The van der Waals con- stants am and b, for the mixture depend upon mole fraction Xi as
2 2
a,,,= s XFpij b, = C x$jbij e ij
(24)
The constants a, t and a22 measure the attractive forces between pairs of molecules of the pure components 1 and 2, respectively, and aI2 is the corresponding parameter for the interaction between molecules 1 and 2. The constants bl t , bz2, and b12 are the size parameters for the pure com- ponents and for mixed pairs, respectively. Here in agree- ment with the van Konynenburg and Scott convention,33 we have used for the cross interaction
bn= (bll+bd/2. (25)
On the basis of selected parameters 5‘ and A, and of the P-T diagrams resulting from their calculations, van Kony- nenburg and Scott33 grouped fluid phase equilibria dia- grams into five types, see Fig. 1. As we can see in this figure, the diagrams were distinguished mainly by the con- figurations of the critical lines and the three-phase lines on P-T graphs. They recognized a sixth type of diagram that occurs in some aqueous systems, but it was not among those predicted by the van der Waals equation. In the di-
J. Chem. Phys., Vol. 99, No. 12, 15 December 1993 Downloaded 03 Jan 2008 to 138.23.2.156. Redistribution subject to AIP license or copyright; see http://jcp.aip.org/jcp/copyright.jsp

9904 Castillo, Garza, and Dominguez: Diffusion coefficient for type I mixture
agrams of types I and II, the gas-liquid critical line is continuous between the critical points of the pure compo- nents, C, and Cs. In the diagrams of type II, there is a liquid-liquid phase separation bounded by a three-phase region LLG and a liquid-liquid critical line LL; These two lines intersect at an upper critical end point. In the dia- grams of type IV, the liquid-liquid-gas three-phase region is bounded above and below by critical end points. In the diagrams of type III, IV, and V, the gas-liquid critical line is divided into two or three branches. In the diagrams of type IV and V, the branch of the gas-liquid critical line originating in Cp terminates in an upper critical end point, while the branch originating in C, rises to a maximum pressure and passes continuously into a liquid-liquid crit- ical line, terminating in a lower critical end point. In the diagrams of type IV, there is a second liquid-liquid phase separation at lower temperatures, with a critical line end- ing in a second upper critical end point. Finally, in the diagrams of type III, the branch of the critical line origi- nating in C, rises to high pressures, sometimes passing through maximum and minimum pressures and/or a min- imum in temperature.
The usefulness of the above described scheme lies in that it gives a qualitative description of the properties of the liquid mixtures, and very rarely yields non-physical results. Then, the fluid phase behavior that occurs in bi- nary mixtures can be qualitatively discussed in terms of interaction parameters and changes of thermodynamic properties near the critical points. Therefore, a very natu- ral extension of the work of van Konynenburg and Scott is to use this scheme to describe the behavior of diffusion coefficients of binary mixtures.@
IV. MUTUAL DIFFUSION COEFFICIENTS FOR SYSTEMS OF TYPE I
The MDCs for several van der Waals liquid binary mixtures were calculated through Eqs. (21) and (22), in the third Sonine approximation. They were denoted by DK. The parameters of the liquid mixtures were selected to fall into the diagrams of type I, of the van Konynenburg- Scott classification scheme. Here, we will present a numer- ical study to understand the influence of each parameter on the MDC. Moreover, several calculations for hard spheres are presented to clearly show the difference between the RET and the KVT I predictions.
There are several sets of parameters that can be used to define a binary mixture under study. We have used the following set: m, , ml, az2, bz2, A, 6, 5; n, T, and X,. To make easier the interpretation of the results obtained in this numerical study, some of the mentioned parameters are fixed for most of the calculations. As a final goal, we shall use the procedure presented here to understand the behavior of the concentration dependence of the MDC for actual binary mixtures. Therefore, we selected the fixed parameters close to that of simple fluids, like liquid argon. These fixed parameters are m,=6.6335x 1O-23 g, a22 = 1.305 L2 at molm2, b2,=49.79X 10m3 L mol-‘, T= 168 K, n=2.03 X 1O22 L-‘. Changes in these parameters will be explicitly mentioned.
1 A CI + -&
1.2 - q/m =2
2 d
4 l- 0 .A A
m,/m 7 5 \
2
2 0.6 - k A A i
llJ/lll=8
0.6 -
- .2 0.4 -
+ A
0.2 - x2=
* .6
* .6 0 I , I 1 I I I 1 1 1 1
0 0.1 0.2 0.3 0.4 0.6 0.6 0.7 0.6 0.9 1 1.1 1.2
l/N
FIG. 2. The mutual diffusion coefficient as a function of the order N of the Enskog approximation for three values of the mass ratio ml/m2, and four mole fractions (A= -0.2, t=O, and (=O).
A first test of the theory was to show that the calcu- lated coefficients, with respect to the mean volume velocity, have the property4’ that 0; = 0;. For this test, we calcu- lated these diffusion coefficients along all the concentration range in the third Enskog approximation. The deviations between them never were greater than 0.01%.
Calculations with Eq. (21) are in the Nth Enskog ap- proximation, i.e., we are taking into account N Sonine polynomials in Eq. (Al 1). Hence, our second test was devoted to determine the most convenient Enskog approx- imation to be used in our calculations. Figure 2 shows the dependence of the MDC with the Enskog approximation for several mass ratios, and mole fractions (c=O, g=O, A= -0.2). As we can see in Fig. 2, it is not necessary to calculate MDCs to an Enskog approximation greater than the third, since the error introduced is negligible. The cal- culations reported here will be in the third Enskog approx- imation.
Our next calculations were addressed to study the de- pendence of the MDC on the molecular mass. Here two hypothetical binary systems at several concentrations were studied (Xi denotes mole fraction of component i). The first one was made up of hard spheres, and the second one was made up of van der Waals molecules of type I (A = -0.2, g=O, c=O). In both systems, the molecular volume was the same, as well as the temperature and the number density. Thus, the only difference between these two sys- tems was the tail interaction. We studied these systems for three mass ratios, ml/m2=0.25, 1, and 4, but with a re- striction: The total mass, ml + m,=6.6335 X 1O-23 g, should be a constant (in this case we changed the specified value for m2 to fulfill the conditions required for this cal- culation). In Fig. 3, the calculations for the MDCs for both systems are presented, for each mass ratio. As we can see there, when the system is modeled as hard spheres the MDC is almost constant with respect to concentration changes. The total mass is the same for each case, whereas, there is an effect due to the asymmetry in the mass. The
J. Chem. Phys., Vol. 99, No. 12, 15 December 1993
Downloaded 03 Jan 2008 to 138.23.2.156. Redistribution subject to AIP license or copyright; see http://jcp.aip.org/jcp/copyright.jsp
16 r--3
4
t * M,/%=.25
2r *M&=1
01. 1 I * M,iM3=4
0 0.2 0.4 0.6 0.6 1
*w/M;=.6 I 2
r
l M/M,=1
o 0 -..LALL- .-, F”i/GF2~
0 0.1 0.2 0.3 0.4 0.5 0.6 0.7 0.8 0.9 1
x2 x2
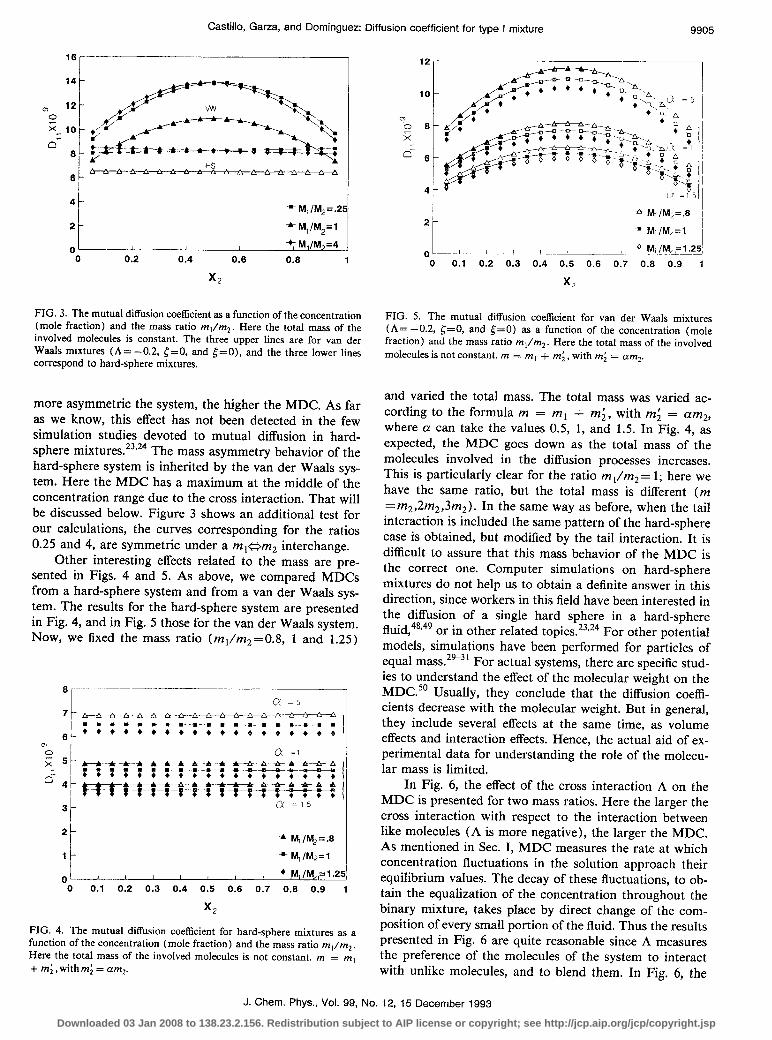
FIG. 3. The mutual diffusion coefficient as a function of the concentration (mole fraction) and the mass ratio ml/m*. Here the total mass of the involved molecules is constant. The three upper lines are for van der Waals mixtures (A= -0.2, [=O, and E=O), and the three lower lines correspond to hard-sphere mixtures.
more asymmetric the system, the higher the MDC. As far as we know, this effect has not been detected in the few simulation studies devoted to mutual diffusion in hard- sphere mixtures.23’24 The mass asymmetry behavior of the hard-sphere system is inherited by the van der Waals sys- tem. Here the MDC has a maximum at the middle of the concentration range due to the cross interaction. That will be discussed below. Figure 3 shows an additional test for our calculations, the curves corresponding for the ratios 0.25 and 4, are symmetric under a m,um, interchange.
Other interesting effects related to the mass are pre- sented in Figs. 4 and 5. As above, we compared MDCs from a hard-sphere system and from a van der Waals sys- tem. The results for the hard-sphere system are presented in Fig. 4, and in Fig. 5 those for the van der Waals system. Now, we fixed the mass ratio (m1/m2=0.8, 1 and 1.25)
8 _--.-----~- -
7 A-A -A A-A A n-n- L A s 22 62 ‘5 G .-• •-~I .-,--.--I--*- l l e-s* w---t I
6 i- l ***~***+***0*6**~6
k---t A A t A-A+ t-&A---
tr-i 7~ : : +T-isiimT
21 *M,/M,=.6
1 * PA, /P&=1
Castillo, Garza, and Dominguez: Diffusion coefficient for type I mixture
FIG. 5. The mutual diffusion coefficient for van der Waals mixtures (A=-0.2, <=O, and c=O) as a function of the concentration (mole fraction) and the mass ratio ml/m 2. Here the total mass of the involved molecules is not constant. m = m, + rn; , with rn; = am2.
and varied the total mass. The total mass was varied ac- cording to the formula m = ml + m;, with rni = am2, where a can take the values 0.5, 1, and 1.5. In Fig. 4, as expected, the MDC goes down as the total mass of the molecules involved in the diffusion processes increases. This is particularly clear for the ratio m,/m,= 1; here we have the same ratio, but the total mass is different (m =m2,2m2,3m2). In the same way as before, when the tail interaction is included the same pattern of the hard-sphere case is obtained, but modified by the tail interaction. It is difficult to assure that this mass behavior of the MDC is the correct one. Computer simulations on hard-sphere mixtures do not help us to obtain a definite answer in this direction, since workers in this field have been interested in the diffusion of a single hard sphere in a hard-sphere fluid,48,49 or in other related topics.23924 For other potential models, simulations have been performed for particles of equal mass.29-31 For actual systems, there are specific stud- ies to understand the effect of the molecular weight on the MDC5’ Usually, they conclude that the diffusion coeffi- cients decrease with the molecular weight. But in general, they include several effects at the same time, as volume effects and interaction effects. Hence, the actual aid of ex- perimental data for understanding the role of the molecu- lar mass is limited.
1 o-- ’ I I I I l pJ /M,,= I.251 0 0.1 0.2 0.3 0.4 0.5 0.6 0.7 0.6 0.9 1
x2
FIG. 4. The mutual diffusion coefficient for hard-sphere mixtures as a function of the concentration (mole fraction) and the mass ratio m,/m,. Here the total mass of the involved molecules is not constant. m = m, + rn; , with rn; = amz.
In Fig. 6, the effect of the cross interaction A on the MDC is presented for two mass ratios. Here the larger the cross interaction with respect to the interaction between like molecules (A is more negative), the larger the MDC. As mentioned in Sec. I, MDC measures the rate at which concentration fluctuations in the solution approach their equilibrium values. The decay of these fluctuations, to ob- tain the equalization of the concentration throughout the binary mixture, takes place by direct change of the com- position of every small portion of the fluid. Thus the results presented in Fig. 6 are quite reasonable since A measures the preference of the molecules of the system to interact with unlike molecules, and to blend them. In Fig. 6, the
J. Chem. Phys., Vol. 99, No. 12, 15 December 1993
Downloaded 03 Jan 2008 to 138.23.2.156. Redistribution subject to AIP license or copyright; see http://jcp.aip.org/jcp/copyright.jsp

9906 Castillo, Garza, and Dominguez: Diffusion coefficient for type I mixture
20
15 9 0
2 F
o 10
5
II
“lJY=’ , , ( , , , ^: ;iJ 0 0.1 0.2 0.3 0.4 0.5 0.6 0.7 0.8 0.9 1
X2
FIG. 6. The effect of the cross interaction on the mutual diffusion coef- ficient for the van der Waals mixture (c=O and {=O) for two mass ratios. The three upper lines are for m,/m,=0.5 and the three lower lines are for ml/m, = 1.
D,, -X, curves have a maximum at X,= l/2, because the mean interaction in the mixture has a maximum there, see Eq. (24) and (23~) for c=O. The described behavior can not be obtained with a hard-sphere system. Moreover, in Fig. 6 we can see how the total mass effect aids to increase the maximum of the Dll -X, curves. The MDC is larger for lighter particles.
The effect of changing the tail interactions between the particles of the fluid mixture can modify abruptly the D,, --X2 diagrams. As an example, we present in Fig. 7 four different van der Waals binary mixtures corresponding to the diagrams of type I, where the value of al2 has been varied. The parameters defining these binary mixtures are A=O, c=O, [=0.3, and m,/mz= 1. Here it is very clear to see how the D,,-X, curves are modified as the value of the interaction parameter u22 is increased. Figure 7 sug- gests that, as uz2 is increased, the system losses its capabil-
6 a22 =
* m.5 b-l.3052 w-3 --5
0 I I I I I I 1 1 0 0 0.1 0.2 0.3 0.4 0.5 0.6 0.7 0.8 0.9 1
x2
FIG. 7. The mutual diffusion coefficient for four van der Waals binary mixtures, where the value of urs has been varied. The parameters defining the binary mixtures are A=O, {=O, 5‘=0.3, and m,/m,= 1.
d (a) I 4-------
n
E= - .94 + .77
D,, XfO-" 1
;:
D,, X10-'
41
2\\
/g~~-~~__II,~ - ‘4
O 63 I I t
<z -.94 + .?l a- .40 8 .15
4- x10-8
3-
2-
1 -
1
0 0.2 0.4 0.6 0.8 1 x2
FIG. 8. The effect of the molecular volume on the mutual diffusion coefficient-concentration (mole fraction) curves. (a) Hard-sphere mix- ture. (b) van der Waals mixture with m,/m,= 1 (A= -0.2 and C=O). (c) van der Waals mixture with m,/m,=OS (A= -0.2 and C=O).
ity to diffuse. Qualitatively our interpretation is as follows: For A =0, there is not enough cross interaction ai2. Thus, the mixture does not have a particular preference to mixing or demixing. However, as the interaction between mole- cules of compound 2 increases, the system response to the concentration fluctuations is to promote diffusion in the sense that the molecules of compound 2 can be, as far as possible, close together. Probably, this is the reason for which the minimum of the D,, -X, curves moves to the region rich in compound 2. After this minimum, the MDC grows with the mole fraction of compound 2 to facilitate the departure of molecules of species 1, during the concen- tration fluctuations, making possible to leave the system richer in compound 2.
The effect of the molecular volume can be obtained from Fig. 8. In Fig. 8(a), the MDCs for several binary hard-sphere systems as a function of the concentration are presented, for four values of {=0.157, 0.489, 0.777, and 0.947. In all these cases the number density is constant. Here the MDC increases with the parameter 5. This sug- gests that the diffusion process increases due to the motion of small molecules through the free space left by the larger molecules. At low 6, we can see that the MDC decreases as the concentration of the larger component (2) goes to 1.
J. Chem. Phys., Vol. 99, No. 12, 15 December 1993
Downloaded 03 Jan 2008 to 138.23.2.156. Redistribution subject to AIP license or copyright; see http://jcp.aip.org/jcp/copyright.jsp

Castillo, Garza, and Dominguez: Diffusion coefficient for type I mixture
10 r---- -.--
I I s- .g ’ 7 4, A-
;: @Y?. . . . . . 7”. . . . . . . . . i
4 ‘-
2
I
* .I m,/m,= 5
<= *.3
I 4 I 8 I F .O! 0 ^. .1 ..- 5
0 0.1 0.2 0.3 0.4 0.5 0.6 0.7 0.8 0.9 1
x2
FIG. 9. The effect of the parameter C on the concentration dependence of the mutual diffusion coefficient using the KVT I (VW) and the RET (HS).
Since density is constant, the mixture has less molecules of component 1, thus the larger molecules have not enough room to diffuse. They block their motion themselves, like a cage effect. At greater values of 6, Fig. 8 (a) suggests that the diffusion of small molecules goes through the free space left by the larger molecules, and it can find a maximum at some specified concentration.
In Fig. 8(b), we have almost the same system as before in Fig. 8(a), i.e., have the same molecular volumes and l values, but now the molecules have tail interaction (A = -0.2, c=O). Here as before the higher 6, the higher MDC. This suggests that, diffusion through the holes left by the larger molecules is as important as in the hard- sphere system. Whereas, the situation in this case is more complicated, since we have two effects competing, the vol- ume asymmetry and the cross interaction. At low 6, the effect of the tail is dominant. But, at higher 6 both com- peting effects change completely the D,,--X2 curve. It is quite suggestive in Fig. 8(b) that, the minimum in the curve corresponding to 6=0.947 occurs in the same region where the hard-sphere system has a maximum, due to the diffusion of the small molecules through the holes left by the larger molecules. When the attractive tails are turned on, the cross interaction between larger and smaller mole- cules must be more effective than at other concentration regions, probably due to the geometrical disposition of the hard cores. In this way the unexpected minimum of this curve can be explained. In Fig. 8(c) we present the same calculation as in Fig. 8 (b) , but for another mass ratio. The trend is similar although the MDCs are larger, since the total mass in this case is less than in the case shown in Fig. 8(b).
Figure 9 shows the dependence of the MDC on the parameter g for a van der Waals mixture of type I. Here it is clear that as the parameter [ increases the MDC in- creases too, although, the effect of varying [ is not very important. For comparison, we also present the same kind of calculations for a hard-sphere system obtained by tum- ing off the attractive tails in the van der Waals mixture.
-VW
+HS
m EXI
I I I I _1 0 0.2 0.4 0.6 0.8 1
FIG. 10. Comparison between experimental mutual diffusion coefficients of hexane/heptane(2) (EXP) at 298.15 K, calculations using the van der Waals model (VW), and the hard-sphere theory (HS).
V. CALCULATIONS FOR ACTUAL MIXTURES
To evaluate the usefulness of our procedure in the case of actual binary mixtures, the MDCs of several mixtures were calculated. This test is possible only if experimental MDCs are provided for mixtures previously classified as belonging to the diagrams of type I in the van Konynen- burg and Scott convention. Those selected were four? H20/D,0,16 hexane/heptane,15 toluene/hexane,” and benzene/hexane.52 We performed calculations for those systems and the results are shown in Figs. 10-13 for sev- eral mole fractions. The interaction parameters used for these calculations are presented in Table I.
As expected, when predictions for actual fluids are per- formed, the most difficult problem is to obtain a reliable set of interaction parameters. Here an initial set of parameters was estimated as follows: each component was modeled as
121 10
? 0 8 ;;: “VW
o= 6 +HS
m EXP
4
2[*.
0’
K-- i; -.--*. .I
I I I I I
0 0.2 0.4 0.6 0.8 1
x2
FIG. 11. Comparison between experimental mutual diffusion coefficients of H,O/D,O(Z) at 298.15 K (EXP), calculations using the van der Waals model (VW), and the hard-sphere theory (HS).
J. Chem. Phys., Vol. 99, No. 12, 15 December 1993 Downloaded 03 Jan 2008 to 138.23.2.156. Redistribution subject to AIP license or copyright; see http://jcp.aip.org/jcp/copyright.jsp

9908 Castillo, Garza, and Dominguez: Diffusion coefficient for type I mixture
10 -VW +HS “EXP TABLE I. Parameters for the actual mixtures.
0’ I I I I I
0 0.1 0.2 0.3 0.4 0.5 0.6 0.7 0.8 0.9 1
x2
FIG. 12. Comparison between experimental mutual diffusion coefficients of toluene/hexane(2) at 298.15 K (EXP), calculations using the van der Waals model (VW), and the hard-sphere theory (HS).
a hard sphere of diameter u ( Lennard-Jones length param- eter), plus an attractive Lennard-Jones tail. The Q’S and b,‘S can be estimated through standard formulas.46 The Lennard-Jones parameters, (T and E, were obtained from Ref. 53. Since, our main interest was to understand how the different parameters affect to the D, 1 -X2 curves, we were not interested in developing a procedure to obtain the best parameters that match the experimental data. More- over, it is not known to what extent the correlated motion affect the MDC. Therefore, any intent of quantitative fit- ting can be misleading. Thus, the initial set of interacting parameters are modified for each mixture, in such a way that one can obtain the form of the experimental D,,--X2 curves. In this way, we arrived to the final set of interacting parameters given in Table I. The cross interactions were selected in such a way that the binary mixtures ever fall into the region of the A< diagram corresponding to the
lOI
8-
? 0 z 6-
0=
4-
--VW +HS 3 EXP
0’ I , I , , I I I I I
0 0.1 0.2 0.3 0.4 0.5 0.6 0.7 0.8 0.9 1
x2
FIG. 13. Comparison between experimental mutual diffusion coefficients ofbenzene/hexane(2) at 293.15 K (EXP), calculations using the van der Waals model (VW) and the hard-sphere theory (HS).
Hexane( 1 )/heptane(2) WV 1 )/D@(2)
30.0 4.05 319.0 26.23
-O.cOl 0.0 -0.001 0.0 0.1 0.004
Benzene(l)/hexane(2) Toluene( I)/hexane(2)
a22 18.0 18.0 b 22 261.0 261.0
t -0.001 -0.53 -O.COl -0.45 E 0.13 0.05
diagrams of type I (see Fig. 1). One important point to mention is that, the initial and the final sets of parameters are very close.
The different capability of the van der Waals model and of the hard-sphere model to predict the MDCs of ac- tual mixtures can be compared. In the Figs. 10-13, calcu- lations for the MDCs given in the RET were included, also in the third Enskog approximation. The hard-sphere diam- eters were exactly the same to those used for the van der Waals calculations, and Eq. (25) was used to define the volume cross interaction. The actual difference between the van der Waals and the RET calculations is the tail inter- action.
Figures 10 and 11 present calculations for hexane/ heptane and for of H,O/D,O, respectively. In both cases along all the concentration range. These examples suggest that the volume of the hard core interaction rules the be- havior of the MDCs, since the cross interactions are almost zero. It is important to mention that our procedure pre- dicts better the experimental data than the rough hard- sphere mode1.15Y’6
Figure 12 presents calculations for toluene/hexane and Fig. 13 for benzene/hexane. In both cases along all the concentration range. We clearly see how the van der Waals model predicts qualitatively the same behavior as does the experimental data. For the case of toluene/hexane, the agreement with the experimental data is excellent. In gen- eral, the hard-sphere calculations cannot give the proper curvature shown by the experimental D,, --X2 curves.
In summary, the results shown in this paper are en- couraging. Here we have presented a model with attractive interaction where the MDC of binary liquid mixtures can be explicitly calculated. Moreover, within this model one is able to explain how the different parameters affect this coefficient. On the other hand, the procedure we have fol- lowed can be used to correlate experimental data of actual mixtures, and it requires very little input while still yield- ing reasonable qualitative good results. This procedure can be helpful to understand the MDC behavior of the remain- ing mixtures of the van Konynenburg Scott diagram. This study is underway and will be published shortly.
J. Chem. Phys., Vol. 99, No. 12, 15 December 1993
Downloaded 03 Jan 2008 to 138.23.2.156. Redistribution subject to AIP license or copyright; see http://jcp.aip.org/jcp/copyright.jsp
ACKNOWLEDGMENTS
We acknowledge partial support from DGAPAUNAM and CONACYT, Grants No. IN 102689 and 0114E, respectively. H.D. acknowledges DGAPA sup- port for this work.
APPENDIX A: SOLUTION TO THE INTEGRAL EQUATIONS FOR 4q
Equations ( 16) are a set of two linear inhomogeneous integral equations for the pi. These equations are soluble if the inhomogeneous part of the integral equations are or- thogonal to the solutions of the homogeneous equations. However, the only solutions of the homogeneous equations are the conserved quantities in a binary collision. These conserved quantities are indeed orthogonal to the inhomo- geneous part of Eqs. ( 16). Hence, one can find the solu- tions and they are fixed, apart from a linear combination of the solutions of the homogeneous equations. The solution of Eqs. (16) for the Qi can be made unique by using the following conditions:54*55
I fjO’Qi dv[=o, C-41)
i J f~‘O’QimiVi dVi=O, i=l
t-42)
i J f~“‘@imiV~ dVi=O. i=l
(A31
Here, Vi=Vl -u.
Equations ( 16) are linear in the gradients of the mac- roscopic quantities of different tensorial character, hence it is possible write the @i as21T54p55
@i=-i Ai* $1, T+Ji:E-jfig .u ( s
+ c Df’*dk . (A41 k=l
Here we will restrict our derivation to obtain the MDC at constant temperature and pressure. This can be performed by substituting Eq. (A4) into fi=fFO’ [I +~i], and the result must be substituted into the mass flux Eq. ( 17). Therefore, a expression for the mass flux in the first order of the gradients can be written in the form
)I d k * (A51
Now, the task is to calculate the integrals in the mass flux Eqs. (A5). If Eqs. (A4) are substituted into Eqs. ( 16), these integrals can be obtained through the following equa- tions:55
Castillo, Garza, and Dominguez: Diffusion coefficient for type I mixture 9909
j-W X (D,k’+DF’+Df+D:)d<dVj=-k
I
where
I.@) =a IJ I tlflj I I
~j8(E^'Vij)(E^'Vij)fi(O)f~)
X (D:‘+Dr’+DF+D,k)dCdVj. C-47)
An expression for Eqs. (A5) can be obtained, in terms of the bracket integrals,55 if Eqs. (A7) are multiplied by a vector M, then integrating over velocities and summing over i
s
s
i;l j$l ylij(Dk)Mi dvi
Here the conditions to obtain a unique solution were used. In particular, for the case where M,=Di’) the integrals given in Eq. (A8) are equal to those appearing in Eq. (A5). Thus, Eqs. (A5) can be written in the form
k$l n,lDI”,Dj’)ldk]. (A91
A explicit expression for the bracket integrals can be obtained in terms of Djk’ (Vi), if we take into account two facts. First, the integral operators of Eqs. ( 16) are isotro- pic in the velocity space, thus the Df are isotropic tensors in that space, i.e.,
D~(vl--u)=D:(I~~--uI)(v~-u). (AlO)
Second, Df can be expanded in terms of the Sonine poly- nomials in the following way:21y54y55
D!k’(V.) = 1 1 2 $ d~,~‘S$$( miVF/2kT), (All)
where d$’ are the Sonine coefficients, and S$;‘, are the Sonine polynomials.
To calculate the bracket integrals given in Eq. (A9), we need to substitute Eqs. (AIO) and (Al 1) into Eq. (A8). Then, this result must be multiplied by S$. A working expression can be found if the orthogonality prop- erties of the Sonine polynomials are used, as well as con- ditions (Al )-( A3 ) . (See Ref. 21 for details. ) The bracket integrals for DC ‘) can be written in terms of the Sonine coefficients in the form
[D(k) D!“] = -? d!k’ I ’ I 2 I,0 *
Equation (A9) can be written as
J. Chek. Phys., Vol. 99, No. 12, 15 December 1993
Downloaded 03 Jan 2008 to 138.23.2.156. Redistribution subject to AIP license or copyright; see http://jcp.aip.org/jcp/copyright.jsp

E661 J=Wa=‘Cl 91 ‘21 ‘ON ‘66 ‘PA “sh4d ‘~43 T
IyBno.u$$ pauyap s! aumIoA cg!Dads Iayucd aq~ ‘( ,u‘u)up=m *dqaoIaA 3yIacA.wq PUE ‘[(zU.4+1U)/zU4]=z~ ‘[(z”+h4.4)/‘U4]=1Jf ‘a.IaH
aql wag r.u3 put! ‘Q30Iah au.mIoa uaatu a91 u10.13 pams +a~ saypuenb loj fl :uope)ou aq$ ~0110~ aM a.xaH *Qsuap SSBLU ayl s! d pm ‘au.mIoA cgpads Iayed ayl s! Zn ‘aJarI& Ql4f’u4 . -=Z’J.q
~UA.U SZ,[ (“w/si2) =a
‘&Qd = or
r~oj ay3 u! uall+ aq um uoy -au.~ojsus.~~ aqL ~?olzp Isluawyadxa ql!~ suoyeIn3pm mo amzduro3 0% saxnu ay$ uaamlaq uopeuuojsue~~ e ayes $snw aM ‘amaH *Q30IaA 3yua3hrsq aql 0~ ahyyal ua@ sl ‘( 1~) ‘bg 11 *DaS ‘uoynba 3yaug aylu10.1~ pauyqo Dc[K arIJ, *&oIaA awnIoA ut?atu aql 0~ aqqa2 saxnu SS~ZU 411~
pauuogad 6IIensn a.m s3aw jo s~uawamsaaw Ianpv
SlN313Hd303
casts z- it I +dZ)ihZ = bd
1 i(j +b+&) (‘)’
‘ i(Iyy+d) r-bz-;(!;+‘$;;=(;;tT
NOISfl~dlCl N33M138 SNOllVl3kl 3 XlClN3ddV Y4M
(9a) i ‘ (gg ;(!;;;(i;zd;) of;;; o=b pd
I ‘f* 1 II (Z/I+u~J%z/l+,u)~ I 1 m a$-=;;AT=.,r 1
(sa) ‘(q+I+u4)(zJr--JvT) - - - (d sz wz b+,u+u:W~b-,-d+,!~~~~ x
i”i(6--l-I))i(d--s---,U)i(d--s---U) isipi(I+b+d) O=.I o=b o=tu
(z/I+6-r-ur-dZ-sZ-,u+u)J s-d-m d-m m
f9g .jaa jo slInsa3 aq3 %uIsn pahIos aq utm (~8) uoyenba wlaqds p-ivq JO st8 a]nI!p ZT jo sI&?aw! saycmq aq$ol Impuap! aJIe (~a) .sba JO sIe.t%awi 3ay3wq ayl ‘uoyf~~~.~ojsu~~~ sgl 3apun s,*(9a) uogm1.10j -sump ayl yBno.tql punoj aq um (~8) ‘ba u! uaap sIe&falu! lay3elq aqL yrr2uytma~ap NXN aq3 %U!AIOS AIImyaumu pauyqo aq ue3 waprJao3 asoyL .$‘$ slua!3rJao3 auluos aql pug 01 uoyauyxoldda %oysug 91~ aql LX! pahIos aq um asaqL .suopenba mauy JO $as e am ( I a) suopanbg
(P8)
. “x!-p = J! gaJay
’ ! Ap !,hp ,3p $0 (z . ‘!A) X
‘!Ap !Ap ,3p ;‘$(z. ‘!A) X
,,:sMoIIoj se pauyap a.w ,,[ ] PUT? , [ ] sIwJ%a~u! laymlq aql aJaqM
(za) ‘%i,,,%%) x
~6~S’AZ,~ $3 ( 53 );$$I &+!lLlz,$m x
~;$‘riz,~ S-3 ( 23 &?SL J-!& ,,,(‘~‘W)8
sfz uay% aq um Liv aql ~oj uorssaldxa v woysw~xoldde 802pg ql& ac[t salouap N ‘1 -N ‘Z ‘1 ‘o=d pua ‘z ‘I =.z ‘w.p OS paugap am saxapu! aql ‘alaH
(10)
am pauyqo suopmba au ‘55 gas aas sIyap .IO~ *( 1~) ‘ba u! ua$3 sluapygao:, au!uoS aql uyqo 03 sn aIqe -ua ( LV) *ba olu! (gv) purr (ZIV) *sba 8upnwqng
SIN313kkl303 3NINOS 3Hl klOd SNOISSWdX3 113lldX3 4 XlClN3ddV
‘(8 I ) .sb ui ua@ moj ayl u! paIp -my aq um (E IV) *sbg ‘uoyanba waqna-sqq!f> ayl pm
(PIV) ‘d’J(!dA(u/!u)=d’.L(!p ‘o=!p ‘z- s
suop!puo:, aql Bysn ‘6IImn~
(EIV)
aJnyc!w 1 ad4 JO) $uap!&3oo uo!snJga :zanfkJ!woa PUB ‘ezm~) ‘oll!pq Downloaded 03 Jan 2008 to 138.23.2.156. Redistribution subject to AIP license or copyright; see http://jcp.aip.org/jcp/copyright.jsp

Castillo, Garza, and Dominguez: Diffusion coefficient for type I mixture 9911
av *i=q. TPs 1,
where Mi is the total mass of compound i. Then, Eq. (Cl ) can be handled in the form
((3)
Since pi=/-Li( T,ni), the derivative in Eqs. (C2) can be written the following form:
dpi a~i/an,+a~j/anz(n,/nl> -= dP aP/dn , + aP/an2 ( n2/n, )
, i=1,2. (C3)
+,/an, and aP/ank can be calculated from Eqs. (9) and ( lo), and ( 12) and from the hard-sphere expression of the chemical potential.&
’ S. R, De Groot and P. Mazur, Non-Equilibrium Thermodynamics (Do- ver Publications, New York, 1944).
‘H. J. V. Tyrrell and K. R. Harris, Dtfusion in Liquids (Butterworths, London, 1984).
‘L. S. Darken, Trans. Am. Inst. Mining Met. Eng. 175, 184 (1949). ‘G. S. Hartley and J. Crank, Trans. Faraday Sot. 4.5, 801 (1949). s P. A. Johnson and A. L. Babb, Chem. Rev. 56, 387 (1956). 6P. C. Carman, J. Phys. Chem. 71, 2565 (1967). ‘S. J. Bertucci and W. H. Flygare, J. Chem. Phys. 63, 1 (1975). ‘K. J. Czwomiak, H. Andersen, and R. Pecora, Chem. Phys. 11, 45 1
(1975). ‘H. L. Fiedman and R. Mills, J. Solution Chem. 10, 395 ( 1981).
“W. Hess, G. Nagele, and A. Z. Akcasu, J. Polym. Sci. B 28, 2233 (1990).
” R. K. Ghai and F. A. L. Dullien, J. Phys. Chem. 78, 2283 (1974). 12S. Chapman and T. G. Cowling, The Mathematical Theory of Non-
Uniform Gases (Cambridge University, Cambridge, 1970). 13D. Chandler, J. Chem. Phys. 60, 3500 (1974). “S. F. Y. Li and L. S. Yue, Int. J. Thermophys. 11, 537 (1990). “C. M. Padre1 de Oliveira, J. M. N. A. Fareleira, and C. A. Nieto de
Castro, Int. J. Thermophys. 10, 973 (1989). ‘(‘M L. S. Matos Lopes and C. A. Nieto de Castro, Int. J. Thermophys.
7,699 (1986). “S. F. Y. Li and W. A. Wakeham, Int. J. Thermophys. 10, 995 (1989). ‘*L. Barajas, L. S. Garcia-Colin, and E. Piiia, J. Stat. Phys. 7, 161 (1973). 19H. van Beijeren and M. H. Ernst, Physica (Utrecht) 68, 437 (1973). 20B. J. Alder, W. E. Alley, and J. H. Dymond, J. Chem. Phys. 61, 1415
(1974). ” M. Lopez de Haro, E. G. D. Cohen, and J. M. Kincaid, J. Chem. Phys.
78, 2746 (1983).
22J. M. Kincaid, M. Lopez de Haro, and E. G. D. Cohen, J. Chem. Phys. 79, 4509 (1983).
23J. J. Erpenbeck, Phys. Rev. A 39‘4718 (1989). 24J. J. Erpenbeck, Phys. Rev. A 45, 2298 (1992). 25D. L. Jolly and R. J. Bearman, Mol. Phys. 41, 137 (1980). 26D. MacGowan and D. J. Evans, Phys. Rev. A 34, 2133 (1986). 27P. J. Gardner, D. M. Heyes, and S. R. Preston, Mol. Phys. 73, 141
(1991). 28S. Sarman and D. J. Evans, Phys. Rev. A 45, 2370 ( 1992). 29M. Schoen and C. Hoheisel, Mol. Phys. 52, 33 (1984). “M. Schoen and C. Hoheisel, Mol. Phys. 52, 1029 ( 1984). “R. Vogelsang and C. Hoheisel, Phys. Rev. A 38, 6296 (1988). “M. Kac, P. C. Hemmer, and G. E. Uhlenbeck, J. Math. Phys. 4, 216
(1963). 33P. H. van Konynenburg and R. L. Scott, Philos. Trans. R. Sot. London,
298, 495 (1980); R. L. Scott and P. H. van Konynenburg, Discuss. Faraday Sot. 49, 87 (1970).
34D. Furman and R. B. Griffiths, Phys. Rev. A 17, 1139 (1978). 35J. W. Cahn and J. E. Hilliard, J. Chem. Phys. 28, 258 (1958). 36R. Evans, Adv. Phys. 28, 143 (1979). 37C. Varea, A. Valderrama, and A. Robledo, J. Chem. Phys. 73, 6265
(1980). 38C. Varea and A. Robledo, J. Chem. Phys. 75, 5080 (1981). 39K. Kawasaki, Prog. Thoer. Phys. 41, 1190 (1969). mB. Cichocki, Physica. 75, 157 ( 1974). “J. Piasecki and P. Resibois, J. Math. Phys. 14, 1984 (1973). 42P. Resibois, Y. Pomeau, and J. Piasecki, J. Math. Phys. 15, 1238
(1974). 43J. Karkheck, E. Martina, and G. Stell, Phys. Rev. A 25, 3328 ( 1982). UR. Castillo, M. E. Costas, and A. Robledo, Int. J. Thermophys. 10,427
(1989). “G. Stell, J. Karkheck, and H. van Beijeran, J. Chem. Phys. 79, 3166
(1983). &T. M. Reed and K. E. Gubbins, Applied Statistical Mechanics
(McGraw-Hill, New York, 1973). “0. D. Fitts, Nonequilibrium Thermodynamics (McGraw-Hill, New
York, 1962). 48P. T. Herman and B. J. Alder, J. Chem. Phys. 56, 987 (1972). 49G Subramanian, D. Levitt, and H. Davis, J. Chem. Phys. 60, 591
(I974). “E. Grushka and E. J. Kikta, J. Am. Chem. Sot. 98, 643 (1976). “J S Rowlinson, and F. L. Swinton, Liquids and Liquids Mixtures (But- . .
terworths Scientific, London, 1982). 52W. Kranh, G. Schwelger, and K. Lucas, J. Phys. Chem. 87, 4515
(1983). j3R. C. Reid, J. M. Prausnitz, and T. K. Sherwood, The Properties of
Gases and Liquids, 3rd ed. (McGraw-Hill, New York, 1979). “C. Cercignani, The Boltzmann Equation and its Applications (Springer,
New York, 1988). 55J H. Ferziger and G. H. Kaper, Mathematical Theory Of Transport
f&xess in Gases (North Holland, Amsterdam, 1972). 56M. J. Lindenfeld and B. Shizgal, Chem. Phys. 41, 81 ( 1979).
J. Chem. Phys., Vol. 99, No. 12, 15 December 1993
Downloaded 03 Jan 2008 to 138.23.2.156. Redistribution subject to AIP license or copyright; see http://jcp.aip.org/jcp/copyright.jsp