The MSDD in the Automotive Electronics Industry …sysdesign.org/pdf/paper19.pdf · The...
19
To be submitted to the Journal of Production Research Monday, April 16, 2001 1 The Manufacturing System Design Decomposition in the Automotive Electronics Industry Guillermo Oropeza, Carlos Tapia and David S. Cochran Massachusetts Institute of Technology, Cambridge, Massachusetts Abstract The objective of this paper is to present a method for developing a set of requirements for the design of manufacturing systems. The effectiveness of this method is evaluated through an analysis of the evolution of the manufacturing system design in the automotive electronic components industry. Designing a manufacturing system is a highly complex process due to the interaction of the many elements that comprise it. It is sometimes difficult to fully understand the effect of specific physical implementations on the achievement of system goals. The Manufacturing System Design Decomposition (MSDD) is a tool to address this problem and to aid the designers of manufacturing systems in making lower-level decisions while understanding the impact on higher-level requirements. The methodology promotes overall system performance optimization over local sub- optimization. In this paper, an analysis of two different approaches to the fabrication of an electronic component for automotive production is presented as a case study. The performance of the two systems, as measured by traditional performance metrics, is determined. Also, compliance to the requirements derived from the MSDD in this particular case is evaluated. Part of these requirements includes a subset related to equipment design. 1. Introduction The manufacturing system analyzed manufactures Electronic Engine Controllers (EECs). These devices are responsible for engine control functions generally described as power train control. Basic functions controlled by the EECs include spark timing control (what a distributor and timing belt used to do), transmission control, and engine management (air-fuel mix and diagnostics). The manufacturing process consists of four stages: two Surface Mount Device (SMD) processes, assembly, and packing. During SMD processing, different components are added to both sides of a circuit board. At assembly, the populated circuit board is mated to the connector and the casting case. Also, software is programmed into the board. During packing, automated high-speed lines and robotic arms prepare ready-to-ship products. The plant studied is particularly interesting for the analysis as it performs the assembly of the EECs using two very different manufacturing system designs. One system is a traditional asynchronous high-speed line, and the other is a volume flexible linked cell system. The scope of this project is partly to analyze the material and information flow of this product as it is processed through these two different systems. Also, by using the Manufacturing System Design Decomposition (MSDD), a thorough assessment of the two assembly methods is made. The results of this analysis are compared to the evaluation of these two systems using traditional performance metrics. By using the MSDD evaluation method, it was possible to point out potential areas for improvement at the implementation level of the cell that are not immediately obvious from just observing performance results. Furthermore, by using the Equipment Evaluation Tool [Gomez, Dobbs and Cochran, 2000], which was derived from the MSDD, an analysis of some of the stations within the two assembly systems is performed. This analysis shows how equipment designed with a systems perspective leads to improved overall system performance. 2. Material and Information Flow 2.1. Material Flow The manufacturing system studied produces 200-300 different types of EECs to accommodate many different vehicle variations. The manufacturing system starts with approximately 20 different circuit board configurations that constitute the different product family groups. These boards are populated with electronic components in different patterns to make up to 60 different types of ready-to-assemble boards (approximately 3 patterns per family group) as shown in Figure 1. Because of the similarities between board designs and to reduce the scheduling complexity, the products were grouped into families. Each one of these 60 populated boards represents a product family. At assembly, the boards can be programmed differently to form the vast variation of EECs.
Transcript of The MSDD in the Automotive Electronics Industry …sysdesign.org/pdf/paper19.pdf · The...
To be submitted to the Journal of Production Research Monday, April 16, 2001
1
The Manufacturing System Design Decomposition in the Automotive Electronics Industry
Guillermo Oropeza, Carlos Tapia and David S. Cochran Massachusetts Institute of Technology, Cambridge, Massachusetts
Abstract The objective of this paper is to present a method for developing a set of requirements for the design of manufacturing systems. The effectiveness of this method is evaluated through an analysis of the evolution of the manufacturing system design in the automotive electronic components industry. Designing a manufacturing system is a highly complex process due to the interaction of the many elements that comprise it. It is sometimes difficult to fully understand the effect of specific physical implementations on the achievement of system goals. The Manufacturing System Design Decomposition (MSDD) is a tool to address this problem and to aid the designers of manufacturing systems in making lower-level decisions while understanding the impact on higher-level requirements. The methodology promotes overall system performance optimization over local sub-optimization. In this paper, an analysis of two different approaches to the fabrication of an electronic component for automotive production is presented as a case study. The performance of the two systems, as measured by traditional performance metrics, is determined. Also, compliance to the requirements derived from the MSDD in this particular case is evaluated. Part of these requirements includes a subset related to equipment design.
1. Introduction The manufacturing system analyzed manufactures Electronic Engine Controllers (EECs). These devices are responsible for engine control functions generally described as power train control. Basic functions controlled by the EECs include spark timing control (what a distributor and timing belt used to do), transmission control, and engine management (air-fuel mix and diagnostics). The manufacturing process consists of four stages: two Surface Mount Device (SMD) processes, assembly, and packing. During SMD processing, different components are added to both sides of a circuit board. At assembly, the populated circuit board is mated to the connector and the casting case. Also, software is programmed into the board.
During packing, automated high-speed lines and robotic arms prepare ready-to-ship products. The plant studied is particularly interesting for the analysis as it performs the assembly of the EECs using two very different manufacturing system designs. One system is a traditional asynchronous high-speed line, and the other is a volume flexible linked cell system. The scope of this project is partly to analyze the material and information flow of this product as it is processed through these two different systems. Also, by using the Manufacturing System Design Decomposition (MSDD), a thorough assessment of the two assembly methods is made. The results of this analysis are compared to the evaluation of these two systems using traditional performance metrics. By using the MSDD evaluation method, it was possible to point out potential areas for improvement at the implementation level of the cell that are not immediately obvious from just observing performance results. Furthermore, by using the Equipment Evaluation Tool [Gomez, Dobbs and Cochran, 2000], which was derived from the MSDD, an analysis of some of the stations within the two assembly systems is performed. This analysis shows how equipment designed with a systems perspective leads to improved overall system performance.
2. Material and Information Flow
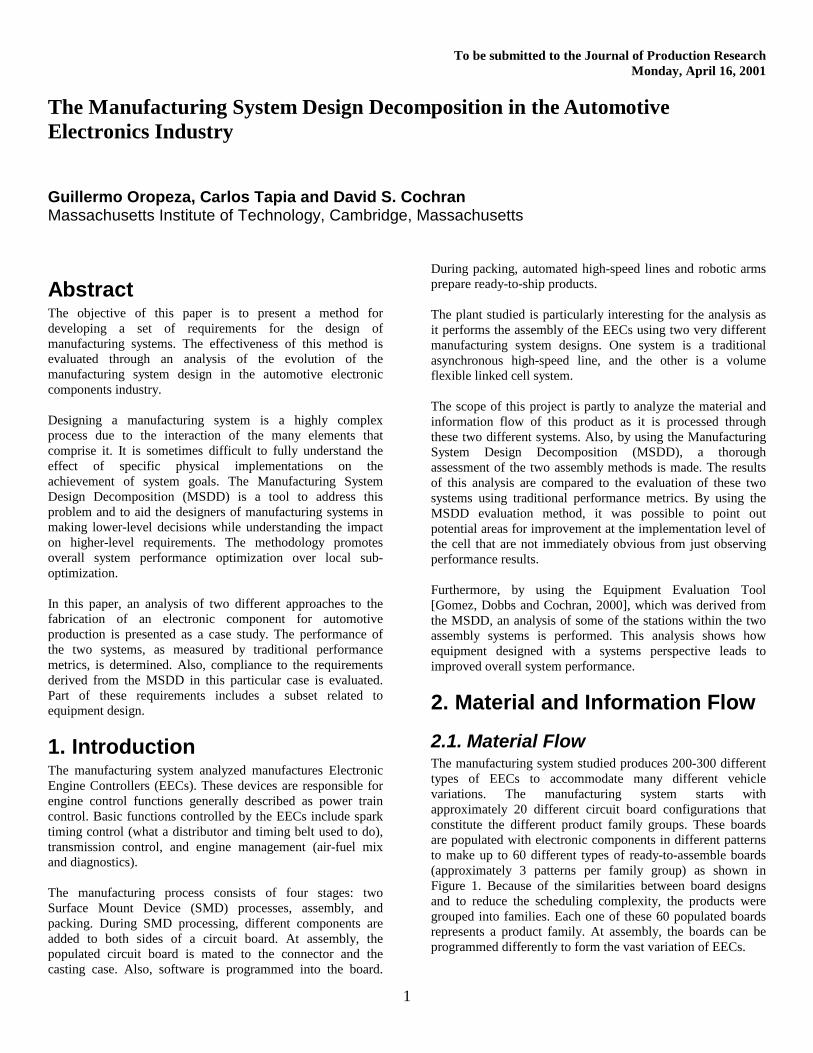
2.1. Material Flow The manufacturing system studied produces 200-300 different types of EECs to accommodate many different vehicle variations. The manufacturing system starts with approximately 20 different circuit board configurations that constitute the different product family groups. These boards are populated with electronic components in different patterns to make up to 60 different types of ready-to-assemble boards (approximately 3 patterns per family group) as shown in Figure 1. Because of the similarities between board designs and to reduce the scheduling complexity, the products were grouped into families. Each one of these 60 populated boards represents a product family. At assembly, the boards can be programmed differently to form the vast variation of EECs.
The Manufacturing System Design Decomposition in the Automotive Electronics Industry
2
Family Group Families Final products
SMDLamination/Assembly
Figure 1: EEC production steps
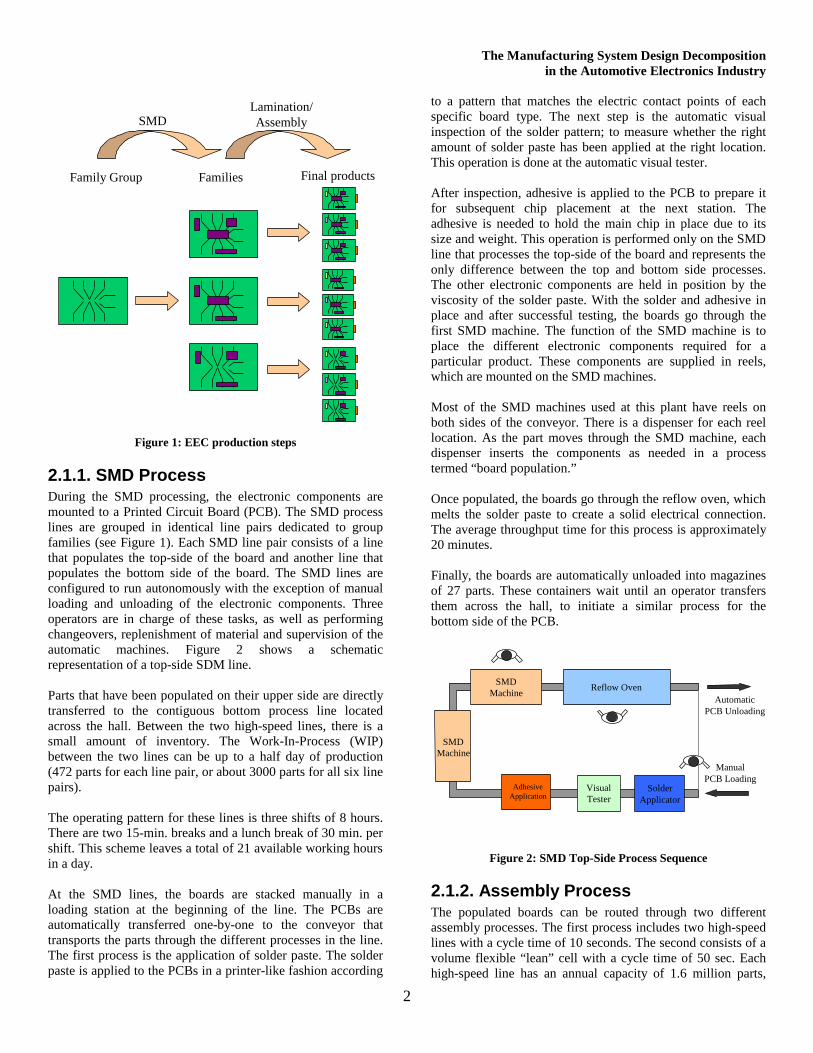
2.1.1. SMD Process During the SMD processing, the electronic components are mounted to a Printed Circuit Board (PCB). The SMD process lines are grouped in identical line pairs dedicated to group families (see Figure 1). Each SMD line pair consists of a line that populates the top-side of the board and another line that populates the bottom side of the board. The SMD lines are configured to run autonomously with the exception of manual loading and unloading of the electronic components. Three operators are in charge of these tasks, as well as performing changeovers, replenishment of material and supervision of the automatic machines. Figure 2 shows a schematic representation of a top-side SDM line. Parts that have been populated on their upper side are directly transferred to the contiguous bottom process line located across the hall. Between the two high-speed lines, there is a small amount of inventory. The Work-In-Process (WIP) between the two lines can be up to a half day of production (472 parts for each line pair, or about 3000 parts for all six line pairs). The operating pattern for these lines is three shifts of 8 hours. There are two 15-min. breaks and a lunch break of 30 min. per shift. This scheme leaves a total of 21 available working hours in a day. At the SMD lines, the boards are stacked manually in a loading station at the beginning of the line. The PCBs are automatically transferred one-by-one to the conveyor that transports the parts through the different processes in the line. The first process is the application of solder paste. The solder paste is applied to the PCBs in a printer-like fashion according
to a pattern that matches the electric contact points of each specific board type. The next step is the automatic visual inspection of the solder pattern; to measure whether the right amount of solder paste has been applied at the right location. This operation is done at the automatic visual tester. After inspection, adhesive is applied to the PCB to prepare it for subsequent chip placement at the next station. The adhesive is needed to hold the main chip in place due to its size and weight. This operation is performed only on the SMD line that processes the top-side of the board and represents the only difference between the top and bottom side processes. The other electronic components are held in position by the viscosity of the solder paste. With the solder and adhesive in place and after successful testing, the boards go through the first SMD machine. The function of the SMD machine is to place the different electronic components required for a particular product. These components are supplied in reels, which are mounted on the SMD machines. Most of the SMD machines used at this plant have reels on both sides of the conveyor. There is a dispenser for each reel location. As the part moves through the SMD machine, each dispenser inserts the components as needed in a process termed “board population.” Once populated, the boards go through the reflow oven, which melts the solder paste to create a solid electrical connection. The average throughput time for this process is approximately 20 minutes. Finally, the boards are automatically unloaded into magazines of 27 parts. These containers wait until an operator transfers them across the hall, to initiate a similar process for the bottom side of the PCB.
Reflow OvenSMD Machine
Adhesive Application
Solder Applicator
Visual Tester
ManualPCB Loading
AutomaticPCB Unloading
SMD Machine
Figure 2: SMD Top-Side Process Sequence
2.1.2. Assembly Process The populated boards can be routed through two different assembly processes. The first process includes two high-speed lines with a cycle time of 10 seconds. The second consists of a volume flexible “lean” cell with a cycle time of 50 sec. Each high-speed line has an annual capacity of 1.6 million parts,

The Manufacturing System Design Decomposition in the Automotive Electronics Industry
3
whereas the cell produces only 350,000 parts per year. The relative size of each line is shown in Figure 3. At a first glance, there is a marked difference in the two systems, as can be seen in Figure 4 and Figure 5. The subsequent sections herein will quantify these differences and provide a rationale for a sound manufacturing system design evaluation.
High-speed Automated line
Volume flexible Cell
Figure 3: Relative Size Comparison between Cell and
automated Line
2.1.2.1. High-speed, Automated line process sequence
Most of the EECs at the plant are assembled at one of the two high-speed lines. Figure 4 shows a diagram of the process sequence. The sequence of process steps is described in Table 1 and illustrated in Appendix A.
Table 1: High-speed Line Process Steps
1. Automatic unload of PCBs from the magazines and into the conveyor. 2. In-circuit test of the PCBs. In the future, this step will take place at the SMD process lines. This step is required to ensure that the necessary components are put in place. 3. Mating of the PCB with the prepared casting-connector. Previous to this point, an incoming line branch delivers the assembled casting-connector. The lamination material has also been applied to the connector subassembly in preparation for its mating with the PCB. 4. Screw board to casting. A six-spindle fully automatic screw-driving machine fastens both components. 5. Solder connector to board. A rotating machine picks up the boards and dips the connector in a curtain of molten solder. 6. Bar code reading to identify the PCB family 7. Visual inspection for proper solder pattern as well as to detect housing shape integrity 8. Voltage-stress-test station 9. Conformal coating (dip in silicon and oven curing) 10. Bottom plate placement and attachment with screws 11. Gasket application (to seal EEC) 12. Burn-in process to induce failure of weak components 13. Unload
2.1.2.2. Volume flexible cell process sequence The “lean” cell represents an innovative process alternative at this plant for the assembly of the PCBs. Most of the EECs produced by this cell are supplied to a single vehicle assembly plant. Although the product is the same as that produced by the high-speed lines, the process in the cell illustrated in Figure 5 and Appendix B, and described in Table 2 varies slightly from the high-speed line sequence described above. The variations in the process were introduced to satisfy special customer requests. The flexibility of the cellular approach allowed these modifications.
300 ft
25 ft ft
1) Automatic unloading of
PCB’s 2) In-Circuit testers
IncomingCasting Cases
IncomingConnectors
Lamination Application
3) Mating of PCB with
Casting/Connector
4) Screw Board to casting
5) Solder connector to board
6) Bar Code reader
ProgrammingVisual inspection
Solder and warping
7) Voltage Stress Test
8) Conformal Coater
(8’x 30’)
Incoming Bottom Plates
11) Oven Burn-in
(10’x 30’)9) Screw in the bottom
plate
10) Gasket application
EEC’s from cell to be burnt-in
Automatic load and unload
Figure 4: High-speed, asynchronous, automated assembly line layout (CT=10sec.)
The Manufacturing System Design Decomposition in the Automotive Electronics Industry
4
13) Incoming bottom plates
7,8) Solder Pot
9,10) Testers
17) Hot Final Test
4) Incoming Boards
1) Laminate Dispense
2,3) Incoming Connectors
Incoming Castings
5) Board Screwdown
6) Programmer
14) Bottom plateScrewdown
15) Refrigerators
12) Dip Coater
(10’x 20’)
16) Dry in oven
30 ft
40 ft
10 ft
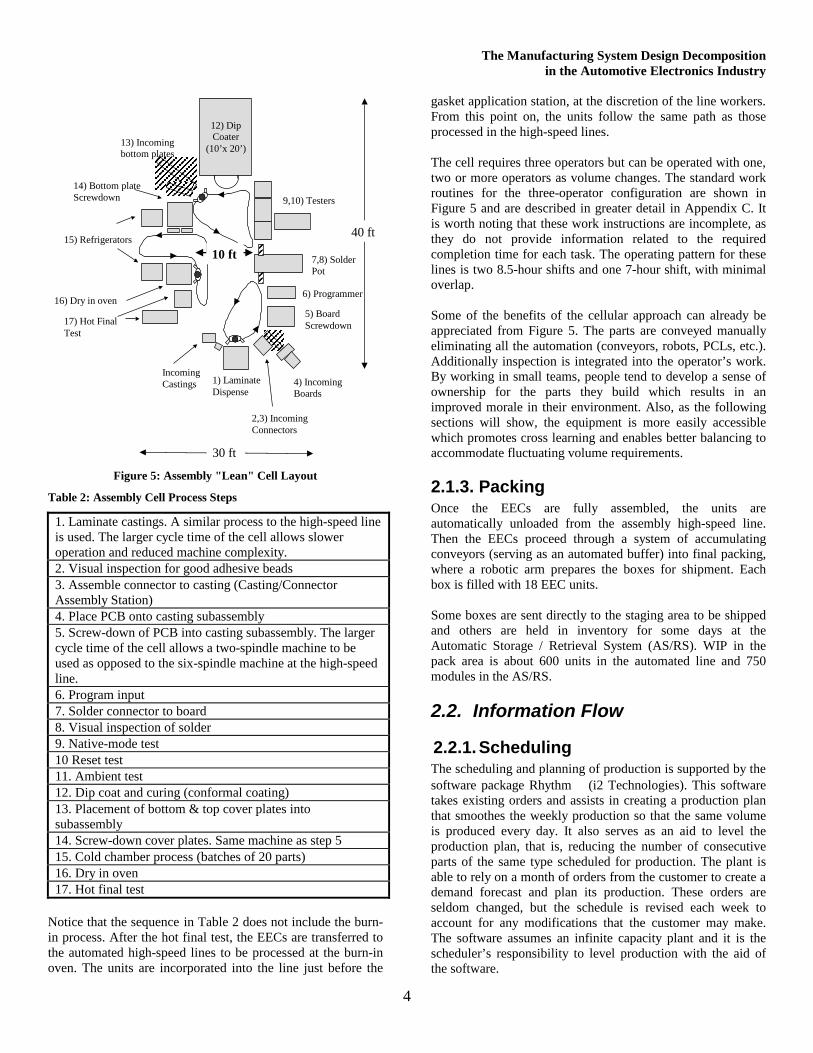
Figure 5: Assembly "Lean" Cell Layout
Table 2: Assembly Cell Process Steps
1. Laminate castings. A similar process to the high-speed line is used. The larger cycle time of the cell allows slower operation and reduced machine complexity. 2. Visual inspection for good adhesive beads 3. Assemble connector to casting (Casting/Connector Assembly Station) 4. Place PCB onto casting subassembly 5. Screw-down of PCB into casting subassembly. The larger cycle time of the cell allows a two-spindle machine to be used as opposed to the six-spindle machine at the high-speed line. 6. Program input 7. Solder connector to board 8. Visual inspection of solder 9. Native-mode test 10 Reset test 11. Ambient test 12. Dip coat and curing (conformal coating) 13. Placement of bottom & top cover plates into subassembly 14. Screw-down cover plates. Same machine as step 5 15. Cold chamber process (batches of 20 parts) 16. Dry in oven 17. Hot final test
Notice that the sequence in Table 2 does not include the burn-in process. After the hot final test, the EECs are transferred to the automated high-speed lines to be processed at the burn-in oven. The units are incorporated into the line just before the
gasket application station, at the discretion of the line workers. From this point on, the units follow the same path as those processed in the high-speed lines. The cell requires three operators but can be operated with one, two or more operators as volume changes. The standard work routines for the three-operator configuration are shown in Figure 5 and are described in greater detail in Appendix C. It is worth noting that these work instructions are incomplete, as they do not provide information related to the required completion time for each task. The operating pattern for these lines is two 8.5-hour shifts and one 7-hour shift, with minimal overlap. Some of the benefits of the cellular approach can already be appreciated from Figure 5. The parts are conveyed manually eliminating all the automation (conveyors, robots, PCLs, etc.). Additionally inspection is integrated into the operator’s work. By working in small teams, people tend to develop a sense of ownership for the parts they build which results in an improved morale in their environment. Also, as the following sections will show, the equipment is more easily accessible which promotes cross learning and enables better balancing to accommodate fluctuating volume requirements.
2.1.3. Packing Once the EECs are fully assembled, the units are automatically unloaded from the assembly high-speed line. Then the EECs proceed through a system of accumulating conveyors (serving as an automated buffer) into final packing, where a robotic arm prepares the boxes for shipment. Each box is filled with 18 EEC units. Some boxes are sent directly to the staging area to be shipped and others are held in inventory for some days at the Automatic Storage / Retrieval System (AS/RS). WIP in the pack area is about 600 units in the automated line and 750 modules in the AS/RS.
2.2. Information Flow
2.2.1. Scheduling The scheduling and planning of production is supported by the software package Rhythm (i2 Technologies). This software takes existing orders and assists in creating a production plan that smoothes the weekly production so that the same volume is produced every day. It also serves as an aid to level the production plan, that is, reducing the number of consecutive parts of the same type scheduled for production. The plant is able to rely on a month of orders from the customer to create a demand forecast and plan its production. These orders are seldom changed, but the schedule is revised each week to account for any modifications that the customer may make. The software assumes an infinite capacity plant and it is the scheduler’s responsibility to level production with the aid of the software.
The Manufacturing System Design Decomposition in the Automotive Electronics Industry
5
FINISHEDGOODS
Rhythm - MRP Production Planing and Scheduling System
ASRS Warehouse
FinishedGoods
Inventory
Staging
RawMaterials
VehicleAssembly
Plant
Forecast of Vehicle AssemblyRequirements (Weekly Schedule)
INCOMING
Suppliers
MATERIAL
Warehouse
10a
10c
6
10b
2
11a
8
9
4
3
5
11aLamination/Assembly
WIP
Automated
High-speed
Line PackingWIPWIP
Top SMD Bottom SMD
WIPWIP
Cycle time: 32 sec
Cycle time: 32 sec
3 CT:10 sec
2 CT:10 sec
Cell CT:50 sec
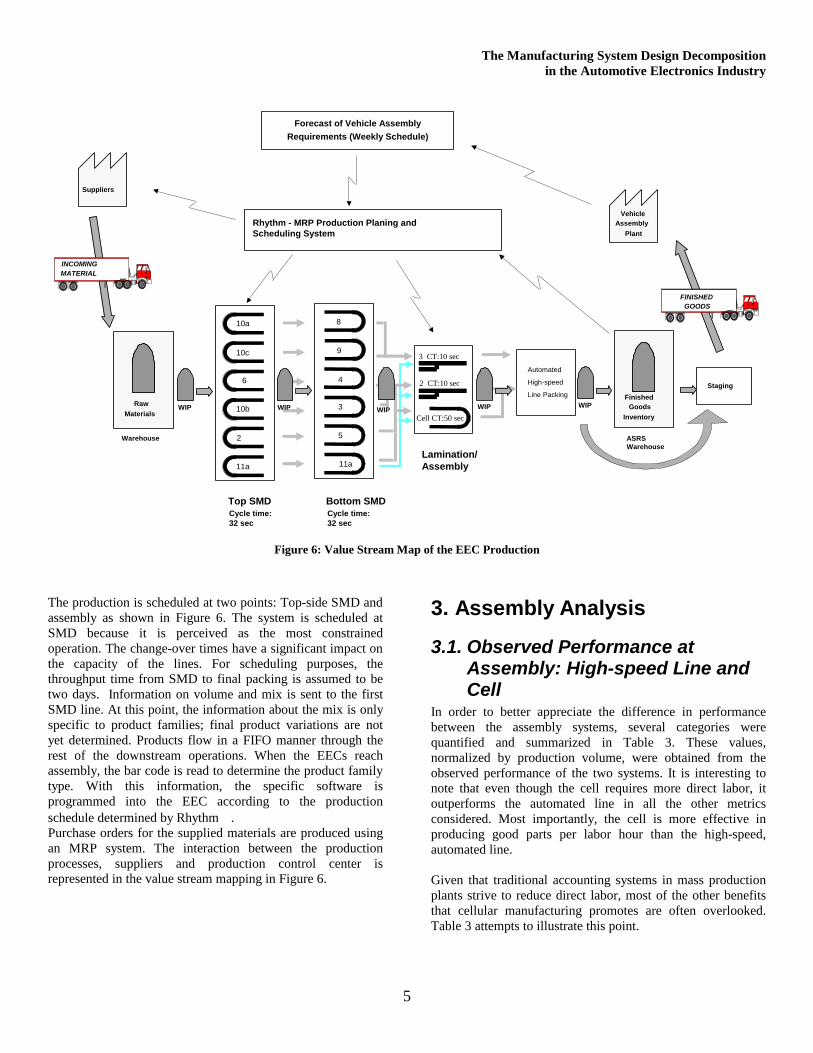
Figure 6: Value Stream Map of the EEC Production
The production is scheduled at two points: Top-side SMD and assembly as shown in Figure 6. The system is scheduled at SMD because it is perceived as the most constrained operation. The change-over times have a significant impact on the capacity of the lines. For scheduling purposes, the throughput time from SMD to final packing is assumed to be two days. Information on volume and mix is sent to the first SMD line. At this point, the information about the mix is only specific to product families; final product variations are not yet determined. Products flow in a FIFO manner through the rest of the downstream operations. When the EECs reach assembly, the bar code is read to determine the product family type. With this information, the specific software is programmed into the EEC according to the production schedule determined by Rhythm . Purchase orders for the supplied materials are produced using an MRP system. The interaction between the production processes, suppliers and production control center is represented in the value stream mapping in Figure 6.
3. Assembly Analysis
3.1. Observed Performance at Assembly: High-speed Line and Cell
In order to better appreciate the difference in performance between the assembly systems, several categories were quantified and summarized in Table 3. These values, normalized by production volume, were obtained from the observed performance of the two systems. It is interesting to note that even though the cell requires more direct labor, it outperforms the automated line in all the other metrics considered. Most importantly, the cell is more effective in producing good parts per labor hour than the high-speed, automated line. Given that traditional accounting systems in mass production plants strive to reduce direct labor, most of the other benefits that cellular manufacturing promotes are often overlooked. Table 3 attempts to illustrate this point.
The Manufacturing System Design Decomposition in the Automotive Electronics Industry
6
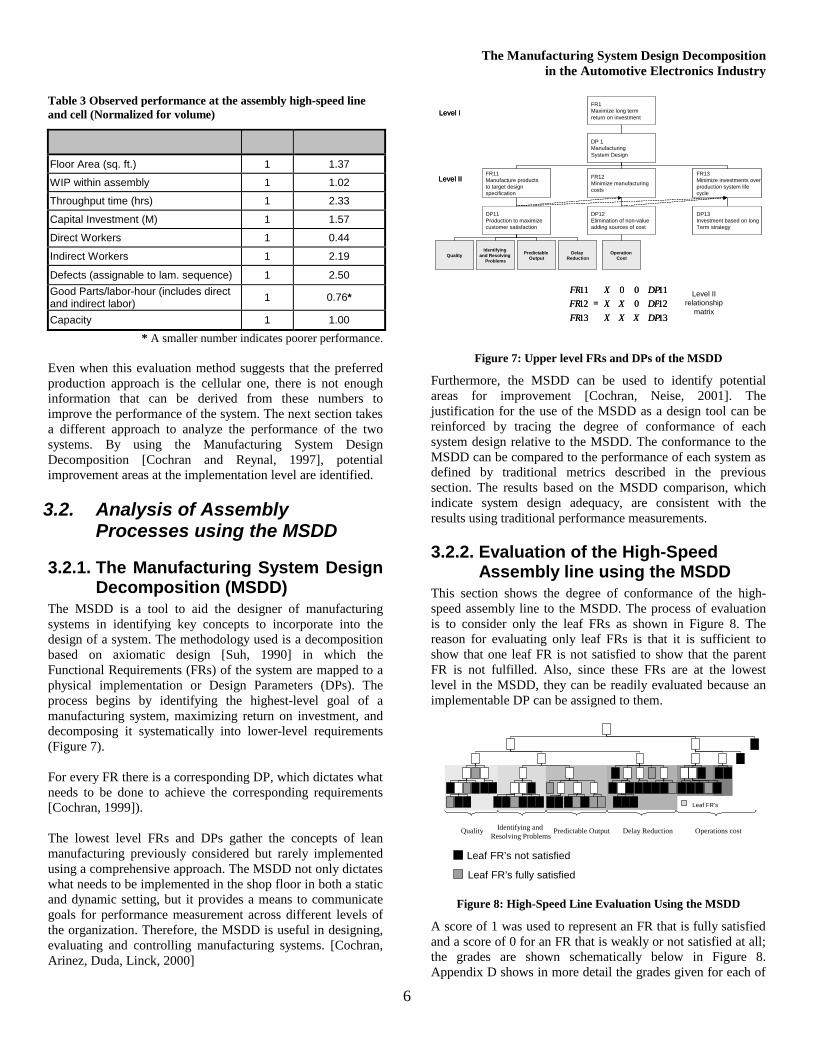
Table 3 Observed performance at the assembly high-speed line and cell (Normalized for volume)
Metric Cell High-Speed
Floor Area (sq. ft.) 1 1.37
WIP within assembly 1 1.02
Throughput time (hrs) 1 2.33
Capital Investment (M) 1 1.57
Direct Workers 1 0.44
Indirect Workers 1 2.19
Defects (assignable to lam. sequence) 1 2.50 Good Parts/labor-hour (includes direct and indirect labor) 1 0.76*
Capacity 1 1.00
* A smaller number indicates poorer performance. Even when this evaluation method suggests that the preferred production approach is the cellular one, there is not enough information that can be derived from these numbers to improve the performance of the system. The next section takes a different approach to analyze the performance of the two systems. By using the Manufacturing System Design Decomposition [Cochran and Reynal, 1997], potential improvement areas at the implementation level are identified.
3.2. Analysis of Assembly Processes using the MSDD
3.2.1. The Manufacturing System Design Decomposition (MSDD)
The MSDD is a tool to aid the designer of manufacturing systems in identifying key concepts to incorporate into the design of a system. The methodology used is a decomposition based on axiomatic design [Suh, 1990] in which the Functional Requirements (FRs) of the system are mapped to a physical implementation or Design Parameters (DPs). The process begins by identifying the highest-level goal of a manufacturing system, maximizing return on investment, and decomposing it systematically into lower-level requirements (Figure 7). For every FR there is a corresponding DP, which dictates what needs to be done to achieve the corresponding requirements [Cochran, 1999]). The lowest level FRs and DPs gather the concepts of lean manufacturing previously considered but rarely implemented using a comprehensive approach. The MSDD not only dictates what needs to be implemented in the shop floor in both a static and dynamic setting, but it provides a means to communicate goals for performance measurement across different levels of the organization. Therefore, the MSDD is useful in designing, evaluating and controlling manufacturing systems. [Cochran, Arinez, Duda, Linck, 2000]
=
131211
000
131211
DPDPDP
XXXXX
X
FRFRFR
FR1Maximize long term return on investment
DP 1Manufacturing System Design
FR11Manufacture products to target design specification
FR12Minimize manufacturing costs
FR13Minimize investments overproduction system life cycle
DP11Production to maximize customer satisfaction
DP12Elimination of non-value adding sources of cost
DP13Investment based on longTerm strategy
Quality Predictable Output
Identifying and Resolving
Problems
Operation Cost
Level I
Level II
Delay Reduction
Level II relationship
matrix
Figure 7: Upper level FRs and DPs of the MSDD
Furthermore, the MSDD can be used to identify potential areas for improvement [Cochran, Neise, 2001]. The justification for the use of the MSDD as a design tool can be reinforced by tracing the degree of conformance of each system design relative to the MSDD. The conformance to the MSDD can be compared to the performance of each system as defined by traditional metrics described in the previous section. The results based on the MSDD comparison, which indicate system design adequacy, are consistent with the results using traditional performance measurements.
3.2.2. Evaluation of the High-Speed Assembly line using the MSDD
This section shows the degree of conformance of the high-speed assembly line to the MSDD. The process of evaluation is to consider only the leaf FRs as shown in Figure 8. The reason for evaluating only leaf FRs is that it is sufficient to show that one leaf FR is not satisfied to show that the parent FR is not fulfilled. Also, since these FRs are at the lowest level in the MSDD, they can be readily evaluated because an implementable DP can be assigned to them.
Leaf FR’s
Quality Predictable Output Delay Reduction Operations costIdentifying and Resolving Problems
Leaf FR’s not satisfied
Leaf FR’s fully satisfied
Figure 8: High-Speed Line Evaluation Using the MSDD
A score of 1 was used to represent an FR that is fully satisfied and a score of 0 for an FR that is weakly or not satisfied at all; the grades are shown schematically below in Figure 8. Appendix D shows in more detail the grades given for each of

The Manufacturing System Design Decomposition in the Automotive Electronics Industry
7
the leaf FRs for both the assembly high-speed line and the cell. The conformance to the MSDD FRs by areas is summarized in Table 4
3.2.3. Evaluation of “Lean” Cell Assembly system using the MSDD
The methodology used to assess this system is the same as that used to evaluate the high-speed automated line. The satisfaction of the leaf FRs of the MSDD is shown schematically below in Figure 9.
Leaf FR’s
Quality Predictable Output Delay Reduction Operations costIdentifying and Resolving Problems
Leaf FR’s not satisfied
Leaf FR’s fully satisfied
Figure 9: Lean Cell Evaluation Using the MSDD
The conformance to the MSDD functional requirements for the cell is also summarized in Table 4. By using this analysis, we can observe where the system can be improved. Due to the nature of the MSDD, the leaf FRs can be traced to implementable solutions. Therefore, special attention can be paid to low performing FRs. The next section outlines the low performing leaves based on this approach for present and future cellular implementation improvements.
Table 4: Satisfaction of MSDD leaf FRs at Assembly
FRs High-Speed Cell Quality 3 of 9 5 of 9
Identifying and resolving problems 1 of 7 3 of 7
Predictable output 4 of 8 8 of 8
Delay reduction 2 of 12 10 of 12
Operations cost 1 of 10 9 of 10
Total 11 of 46 35 of 46
3.3. Recommendations for cellular implementation derived from the MSDD
Based on the experience of this first cellular implementation in the assembly area, and using the MSDD-based analysis from the previous section, some recommendations can be made for present and future cellular implementations as well as for overall plant design. It is first worthwhile to note that, in comparison with the high-speed line represented by Figure 8, the schematic in Figure 9 reveals a design that more adequately satisfies the overall
system goals. This result is an indication that the design of the cell achieves more of the FRs congruent with a world-class manufacturing system design. However, based on the MSDD analysis, some leaf FRs were not satisfied by the current cellular design. Identifying these FRs gives valuable information for improving the performance of current and future systems. The FR/DP pairs that received a grade of 1, and therefore the ones that provide room for improvement and attention, are outlined in Table 5.
Table 5: Low performing FR/DPs for the cellular system
FR/DP FR DP
Q11 Eliminate machine assignable causes
Failure mode and effects analysis
Q14 Eliminate material assignable causes
Supplier quality program
Q31 Reduce noise in process inputs
Conversion of common causes into assignable causes
Q32 Reduce impact of input noise on process output
Robust process design
R113 Identify what the disruption is Context sensitive feedback R121 Identify correct support
resources Specified support resources for each failure mode
R122 Minimize delay in contacting correct support resources
Rapid support contact procedure
R123 Minimize time for support resource to understand disruption
System that conveys what the disruption is
P131 Reduce variability of task completion time
Variance in task completion time
T31 Provide knowledge of demanded product mix (part types and quantities)
Information flow from downstream customer
T32 Produce in sufficiently small run sizes
Design quick changeover for material handling and equipment
I2 Eliminate information disruptions
Seamless information flow (visual factory)
In order to address some of these low performing FRs, it is necessary to analyze the plant again with a broader perspective. It can be seen in Table 5 that some problems with traceability of defective incoming parts remain. Also, information disruptions and defective repair procedures are still present in the system. Furthermore, the standardized procedures to respond to production disruptions must be designed and communicated to the workforce. Another area where the system design must be improved is the standardized work definition. It should include information on the expected time to complete each task. Also, the manufacturing system design should be able to immediately communicate if the production pace (takt time) is being kept or if the system is falling behind. Although the assembly cell was able to improve dramatically on its predecessors as Figure 8 and Figure 9 show, the MSDD and the plant value stream mapping reveal potential areas of improvement from a system design perspective on these low performing FRs.
The Manufacturing System Design Decomposition in the Automotive Electronics Industry
8
Production Planing and Scheduling System
ASRS Warehouse
FinishedGoods
Inventory
Staging
RawMaterials
VehicleAssembly
Plant
Actual Consumption from Vehicle AssemblyRequirements (Weekly Schedule)
FINISHEDGOODS
INCOMING
Suppliers
MATERIAL
Warehouse
10a
10c
6
10b
2
11a
8
9
4
3
5
11a
Lamination/Assembly
WIPWIP
Top SMD Bottom SMD
WIPWIP
a
b
c
d
e
f
Cycle time: 32 sec
Cycle time: 32 sec
Cycle time: 32 sec
Automated
High-speed
Line Packing
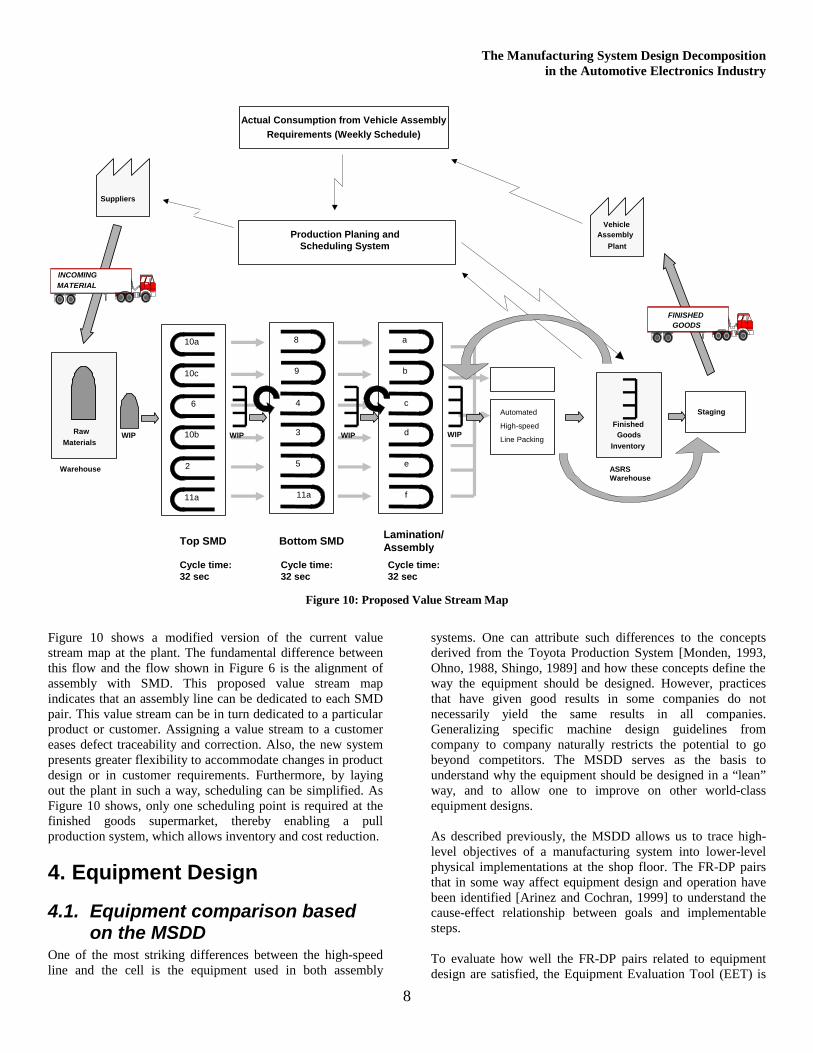
Figure 10: Proposed Value Stream Map
Figure 10 shows a modified version of the current value stream map at the plant. The fundamental difference between this flow and the flow shown in Figure 6 is the alignment of assembly with SMD. This proposed value stream map indicates that an assembly line can be dedicated to each SMD pair. This value stream can be in turn dedicated to a particular product or customer. Assigning a value stream to a customer eases defect traceability and correction. Also, the new system presents greater flexibility to accommodate changes in product design or in customer requirements. Furthermore, by laying out the plant in such a way, scheduling can be simplified. As Figure 10 shows, only one scheduling point is required at the finished goods supermarket, thereby enabling a pull production system, which allows inventory and cost reduction.
4. Equipment Design
4.1. Equipment comparison based on the MSDD
One of the most striking differences between the high-speed line and the cell is the equipment used in both assembly
systems. One can attribute such differences to the concepts derived from the Toyota Production System [Monden, 1993, Ohno, 1988, Shingo, 1989] and how these concepts define the way the equipment should be designed. However, practices that have given good results in some companies do not necessarily yield the same results in all companies. Generalizing specific machine design guidelines from company to company naturally restricts the potential to go beyond competitors. The MSDD serves as the basis to understand why the equipment should be designed in a “lean” way, and to allow one to improve on other world-class equipment designs. As described previously, the MSDD allows us to trace high-level objectives of a manufacturing system into lower-level physical implementations at the shop floor. The FR-DP pairs that in some way affect equipment design and operation have been identified [Arinez and Cochran, 1999] to understand the cause-effect relationship between goals and implementable steps. To evaluate how well the FR-DP pairs related to equipment design are satisfied, the Equipment Evaluation Tool (EET) is
The Manufacturing System Design Decomposition in the Automotive Electronics Industry
9
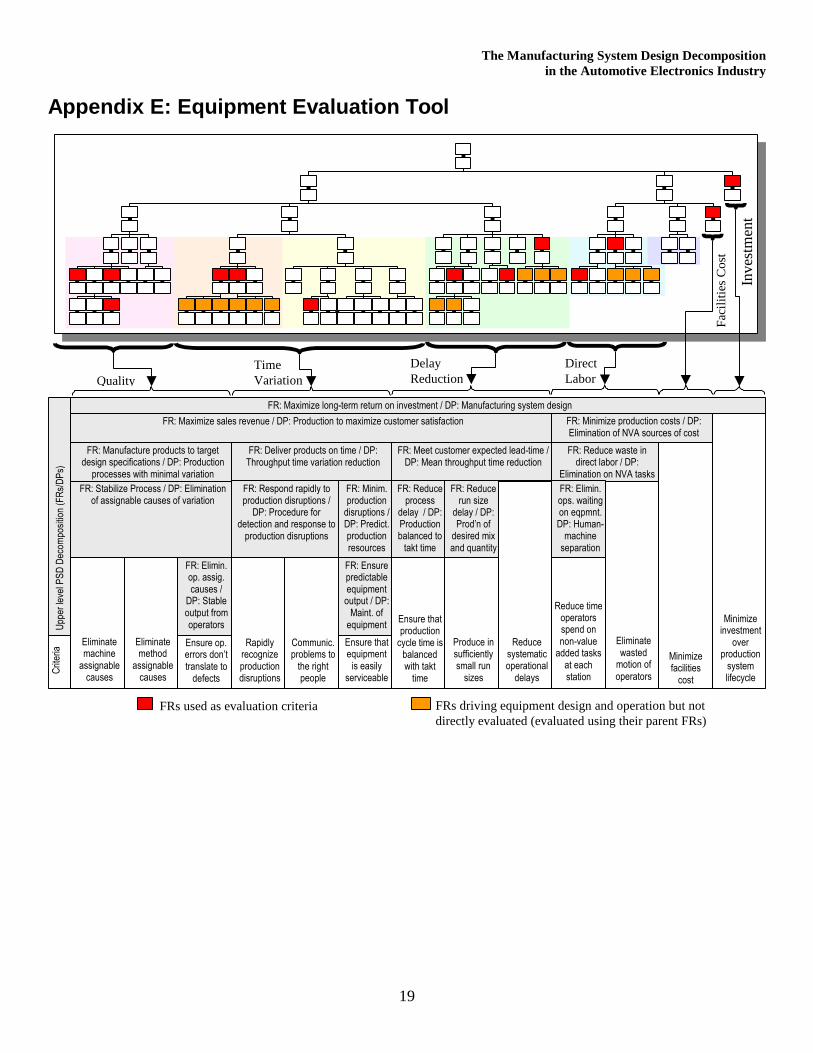
used [Gomez, Dobbs and Cochran, 2000]. The EET is used to assess how well a particular piece or set of equipment conforms to the requirements imposed by the equipment-related FRs. This evaluation procedure can be used to ensure that equipment designs better align with overall manufacturing system objectives. The tool can also be used to identify problems in existing equipment and to set goals for the improvement of equipment to better satisfy the requirements placed on it by the MSDD [Gomez, Dobbs and Cochran, 2000]. The criteria used by the EET are presented in Appendix E.
4.1.1 Application of the Equipment Evaluation Tool
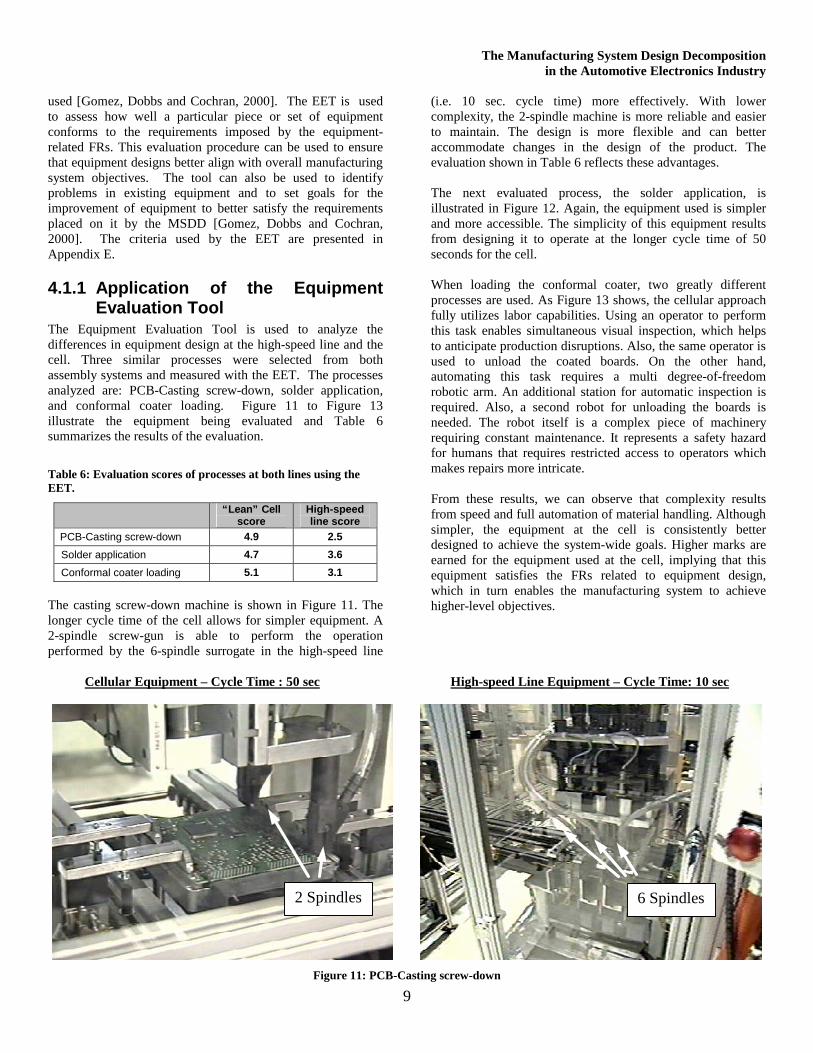
The Equipment Evaluation Tool is used to analyze the differences in equipment design at the high-speed line and the cell. Three similar processes were selected from both assembly systems and measured with the EET. The processes analyzed are: PCB-Casting screw-down, solder application, and conformal coater loading. Figure 11 to Figure 13 illustrate the equipment being evaluated and Table 6 summarizes the results of the evaluation.
Table 6: Evaluation scores of processes at both lines using the EET.
Machine “Lean” Cell score
High-speed line score
PCB-Casting screw-down 4.9 2.5
Solder application 4.7 3.6
Conformal coater loading 5.1 3.1
The casting screw-down machine is shown in Figure 11. The longer cycle time of the cell allows for simpler equipment. A 2-spindle screw-gun is able to perform the operation performed by the 6-spindle surrogate in the high-speed line
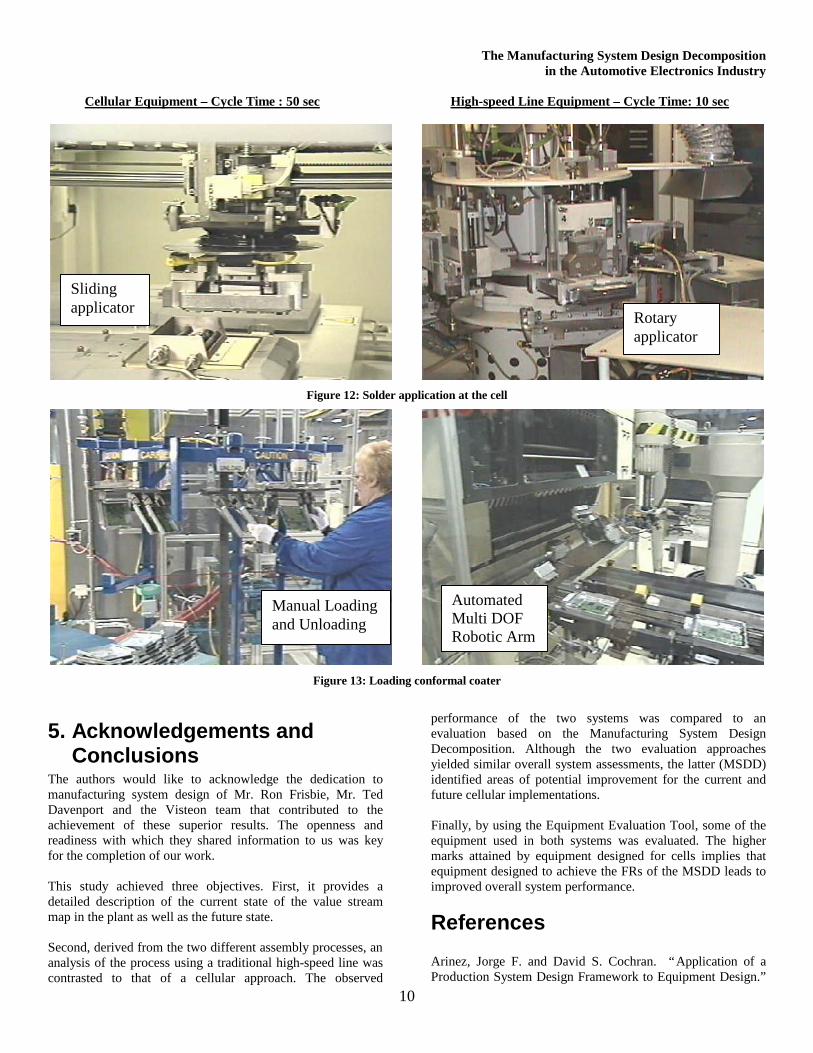
(i.e. 10 sec. cycle time) more effectively. With lower complexity, the 2-spindle machine is more reliable and easier to maintain. The design is more flexible and can better accommodate changes in the design of the product. The evaluation shown in Table 6 reflects these advantages. The next evaluated process, the solder application, is illustrated in Figure 12. Again, the equipment used is simpler and more accessible. The simplicity of this equipment results from designing it to operate at the longer cycle time of 50 seconds for the cell. When loading the conformal coater, two greatly different processes are used. As Figure 13 shows, the cellular approach fully utilizes labor capabilities. Using an operator to perform this task enables simultaneous visual inspection, which helps to anticipate production disruptions. Also, the same operator is used to unload the coated boards. On the other hand, automating this task requires a multi degree-of-freedom robotic arm. An additional station for automatic inspection is required. Also, a second robot for unloading the boards is needed. The robot itself is a complex piece of machinery requiring constant maintenance. It represents a safety hazard for humans that requires restricted access to operators which makes repairs more intricate. From these results, we can observe that complexity results from speed and full automation of material handling. Although simpler, the equipment at the cell is consistently better designed to achieve the system-wide goals. Higher marks are earned for the equipment used at the cell, implying that this equipment satisfies the FRs related to equipment design, which in turn enables the manufacturing system to achieve higher-level objectives.
Cellular Equipment – Cycle Time : 50 sec High-speed Line Equipment – Cycle Time: 10 sec
Figure 11: PCB-Casting screw-down
2 Spindles 6 Spindles
The Manufacturing System Design Decomposition in the Automotive Electronics Industry
10
Cellular Equipment – Cycle Time : 50 sec High-speed Line Equipment – Cycle Time: 10 sec
Figure 12: Solder application at the cell
Figure 13: Loading conformal coater
5. Acknowledgements and Conclusions
The authors would like to acknowledge the dedication to manufacturing system design of Mr. Ron Frisbie, Mr. Ted Davenport and the Visteon team that contributed to the achievement of these superior results. The openness and readiness with which they shared information to us was key for the completion of our work. This study achieved three objectives. First, it provides a detailed description of the current state of the value stream map in the plant as well as the future state. Second, derived from the two different assembly processes, an analysis of the process using a traditional high-speed line was contrasted to that of a cellular approach. The observed
performance of the two systems was compared to an evaluation based on the Manufacturing System Design Decomposition. Although the two evaluation approaches yielded similar overall system assessments, the latter (MSDD) identified areas of potential improvement for the current and future cellular implementations. Finally, by using the Equipment Evaluation Tool, some of the equipment used in both systems was evaluated. The higher marks attained by equipment designed for cells implies that equipment designed to achieve the FRs of the MSDD leads to improved overall system performance.
References Arinez, Jorge F. and David S. Cochran. “Application of a Production System Design Framework to Equipment Design.”
Sliding applicator
Rotary applicator
Manual Loading and Unloading
Automated Multi DOF Robotic Arm

The Manufacturing System Design Decomposition in the Automotive Electronics Industry
11
Proceedings of the 32nd CIRP International Seminar on Manufacturing Systems. Leuven, Belgium, May 24-26, 1999. Cochran, David and Reynal, Vicente. “Axiomatic Design of Manufacturing Systems - Creating a Methodology for Process Improvement”. Proceedings of The Second World Congress of Intelligent Manufacturing Processes and Systems, June 10-13, 1997. Cochran, David and Neise, Patrick. “Evaluation of the Plant Design of two Automotive Suppliers using the Manufacturing System Design Decomposition”. Submitted to NAMRC XXIX, 2001. Gomez, Deny D., Daniel C. Dobbs and David S. Cochran. “Equipment Evaluation Tool Based on the Manufacturing System Design Decomposition.” Proceedings of the Third World Congress on Intelligent Manufacturing Processes and Systems. Cambridge, MA, June 28-30, 2000. Monden, Yasuhiro. Toyota Production System: An Integrated Approach to Just In Time. 2nd ed. Norcross, Georgia: Industrial Engineering and Management Press, 1993. Ohno, Taiichi. Toyota Production System. Beyond Large-Scale Production. Portland, OR: Productivity Press, 1988. Shingo, Shigeo. A Study of the Toyota Production System From an Industrial Engineering Viewpoint. Trans. Andrew P. Dillon. Portland, OR: Productivity Press, 1989 Suh, Nam P. The Principles of Design. New York: Oxford University Press, 1990.
Cochran, David S. “The Production System Design and Deployment Framework.” Proceedings of the 1999 SAE International Automotive Manufacturing Conference. Detroit, MI, May 11-13, 1999. Cochran, D. S., Arinez, J. F., Duda, J. W., Linck, J., “A Decomposition Approach for Manufacturing System Design” Journal of Manufacturing Systems, 2000
Biographies David Cochran is an Associate Professor of mechanical engineering at the Massachusetts Institute of Technology. He directs the Production System Design group at MIT. The group conducts research in the development of a comprehensive approach for the design and implementation of lean production systems. Before coming to MIT, Dr. Cochran was employed at Lord Aerospace Corporation as a Manufacturing Engineer. He has worked at Ford Motor Company in the Electronics Division, Information Systems, Operations Engineering and Simulation groups. In addition to his work experience, Dr. Cochran teaches companies the Production System Design approach. He is a recipient of the Shingo Prize for his Masters work at the Penn State University. Guillermo Oropeza and Carlos Tapia are graduate students pursuing master’s degrees in the Mechanical Engineering Department at the Massachusetts Institute of Technology. Their research focuses on the design and development of new manufacturing systems in existing mass production industries.
The Manufacturing System Design Decomposition in the Automotive Electronics Industry
12
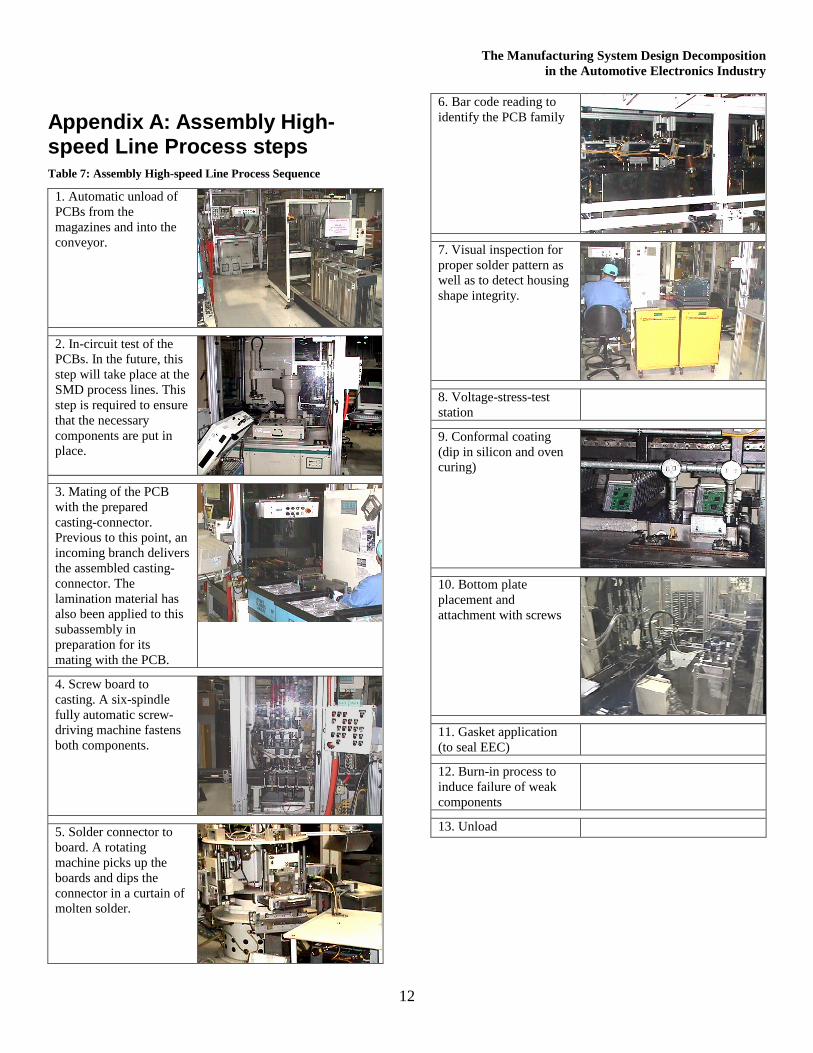
Appendix A: Assembly High-speed Line Process steps Table 7: Assembly High-speed Line Process Sequence
1. Automatic unload of PCBs from the magazines and into the conveyor.
2. In-circuit test of the PCBs. In the future, this step will take place at the SMD process lines. This step is required to ensure that the necessary components are put in place.
3. Mating of the PCB with the prepared casting-connector. Previous to this point, an incoming branch delivers the assembled casting-connector. The lamination material has also been applied to this subassembly in preparation for its mating with the PCB.
4. Screw board to casting. A six-spindle fully automatic screw-driving machine fastens both components.
5. Solder connector to board. A rotating machine picks up the boards and dips the connector in a curtain of molten solder.
6. Bar code reading to identify the PCB family
7. Visual inspection for proper solder pattern as well as to detect housing shape integrity.
8. Voltage-stress-test station
9. Conformal coating (dip in silicon and oven curing)
10. Bottom plate placement and attachment with screws
11. Gasket application (to seal EEC)
12. Burn-in process to induce failure of weak components
13. Unload
The Manufacturing System Design Decomposition in the Automotive Electronics Industry
13
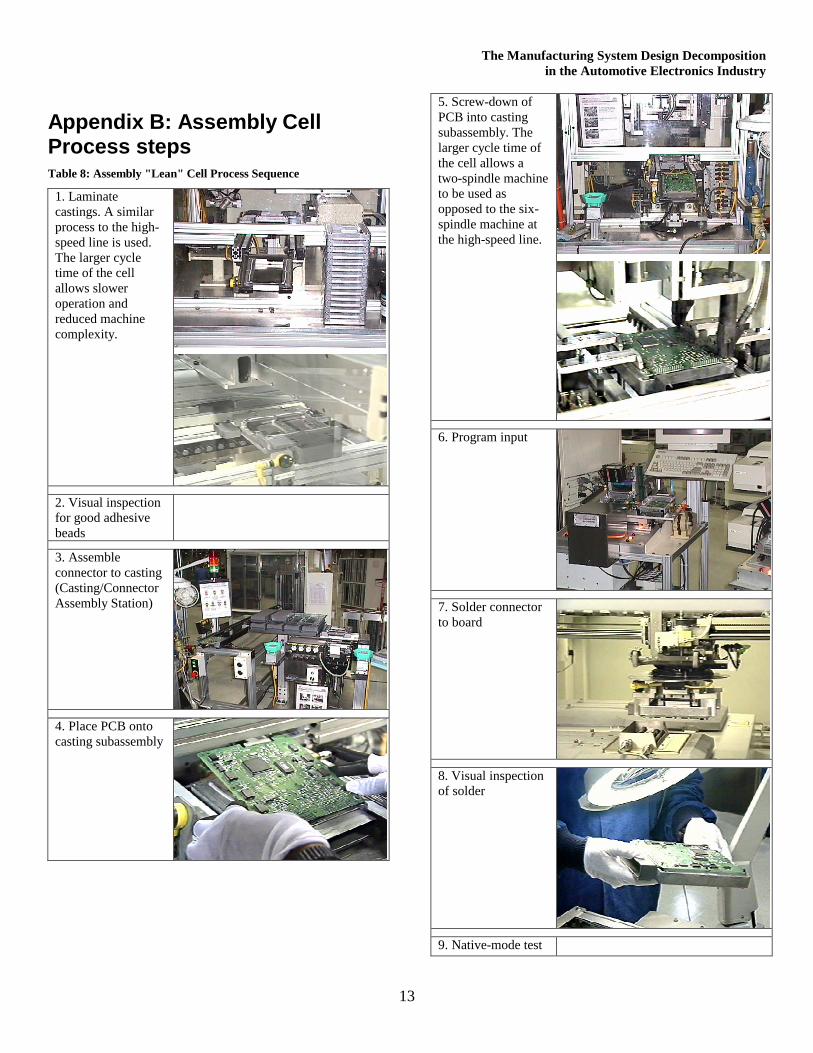
Appendix B: Assembly Cell Process steps Table 8: Assembly "Lean" Cell Process Sequence
1. Laminate castings. A similar process to the high-speed line is used. The larger cycle time of the cell allows slower operation and reduced machine complexity.
2. Visual inspection for good adhesive beads
3. Assemble connector to casting (Casting/Connector Assembly Station)
4. Place PCB onto casting subassembly
5. Screw-down of PCB into casting subassembly. The larger cycle time of the cell allows a two-spindle machine to be used as opposed to the six-spindle machine at the high-speed line.
6. Program input
7. Solder connector to board
8. Visual inspection of solder
9. Native-mode test
The Manufacturing System Design Decomposition in the Automotive Electronics Industry
14
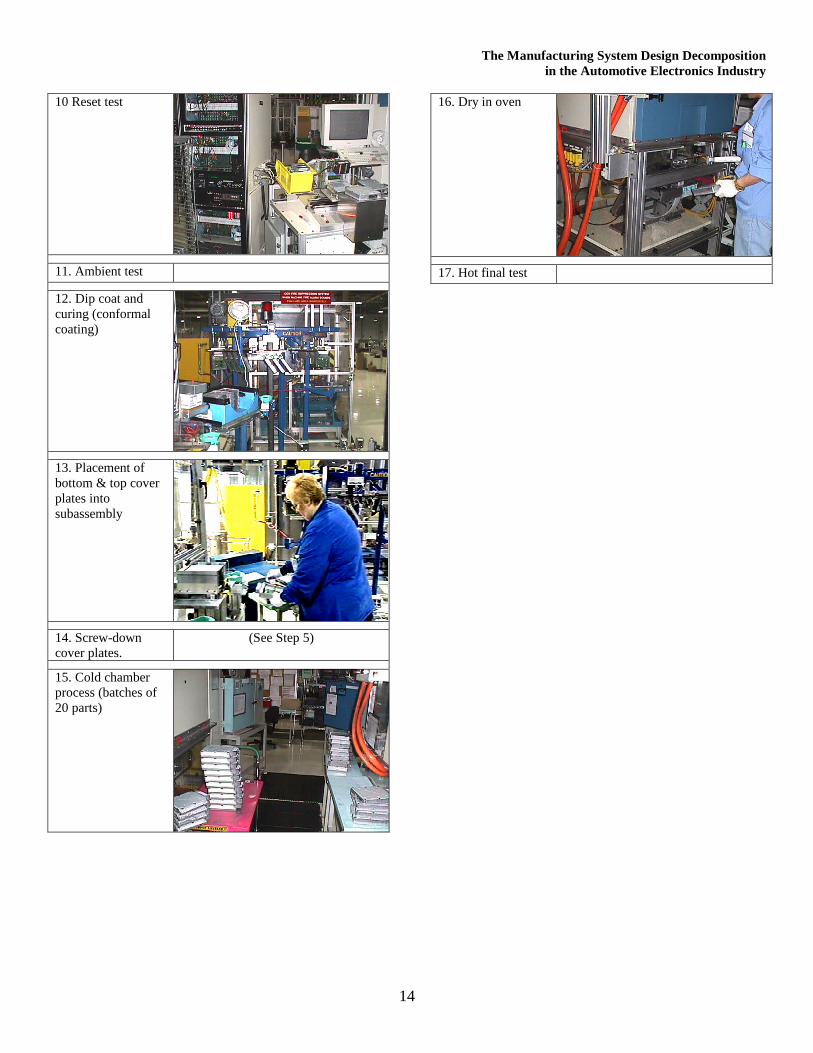
10 Reset test
11. Ambient test
12. Dip coat and curing (conformal coating)
13. Placement of bottom & top cover plates into subassembly
14. Screw-down cover plates.
(See Step 5)
15. Cold chamber process (batches of 20 parts)
16. Dry in oven
17. Hot final test

The Manufacturing System Design Decomposition in the Au
15
Appendix C: Work loops for the “lean” cell Quality Process System Operator Instruction Sheet Optional: Tact Time Cycle Time Plant: North Penn Electronics Facility Product: EEC Process: Manufacturing Operation - EEC Lean Cell (sec/pc) (sec/pc) Rev. Date Authorized Job ID: Work Cell Operator # 1 of 3 4/5/00 VPS / EEC
ERROR PROOFING
OTHER JSA
Step # Work Steps
Optional Area
Possible Health & Safety
Hazards
Recommended Job Procedures
file: lean_***.ppt
lam dispenselam bead inspect
1
casting to connectgrohman stacklight2
2
board screwdown3 board handling
TGAflow.ppt
4
5 selective solder
6
QPS Sheet #: 1 of 1Zone: EEC
Sign-off / Reps Shift Code 1 Shift Code 2 Shift Code 3RESPIRATOR APRON GROUND STRAP
OR HEEL STRAPOperators
Workgroup Leader Supervisor
Health & Safety Maintenance Engineering
EYE PROTECTION
X
HAND PROTECTION
X
SAFETY LOCKS
SMOCK
QUALITY CHECKDELTA CRITICAL QUICK CHANGE OVER Q C O
FORD TOTAL PROD. MAINT.
VISUAL FACTORY
IN PROCESS STOCK
F T M
P
FOOT PROTECTION
HEARING PROTECTION
HARD HAT
5/2/00 EEC
Walk to front of Laminate Dispense machine. While taking casting from tote with right hand, use left hand to remove finished casting with laminate. While placing new casting on machine conveyor with right hand, use left hand to place and position casting with laminate into connector to casting nest. Visually inspect for good adhesive beads.Walk to front of Connector to Casting machine, and with left hand, take a connector from the tray and place it over the edge of the casting. Activate the machine by placing both hands on the palm switches. After waiting for cycle to finish, pick up finished casting with connector with right hand. Either check to ensure board label matches bar code label, or make sure machine scanner did not fault.Walk to Board Screwdown machine. Place casting with connector on conveyor. Pick up the panel with right hand and use both hands to carefully place board over casting. Place hand over palm switch. Pick up completed module from tray with right hand.Walk to Programmer. When in front of machine, check computer screen to ensure previous module did not fail. Then, pick up completed module with left hand and use right hand to place new module in machine fixture (pins facing you and label facing up). For TGA modules, reference "lean_TGAflow.ppt"Transfer module to right hand. Turn towards Solder Pot and use right hand to place module on machine conveyor, with label facing up and connector pins facing forward (going in first).Repeat loop from step 1.
D
D
X
X
NON-REPETITIVE TASKSIf not done by material handler, update schedule daily and load/unload grohmann.If not done by mechanic, load board screwdown screw-bowls.
EEC LEAN CELL
N4
N5
Coater
Laminate Dispense
Hot Final
The Manufacturing System Design Decomposition in the Au
16
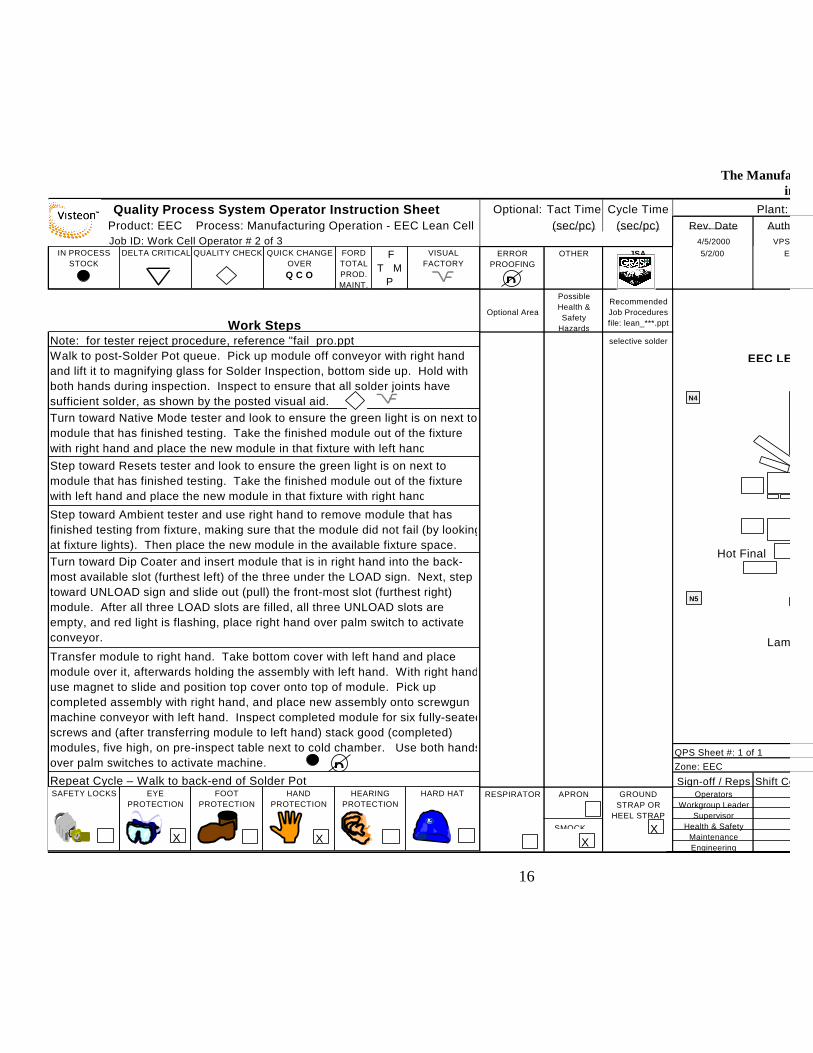
Quality Process System Operator Instruction Sheet Optional: Tact Time Cycle Time Plant: North Penn Electronics Facility Product: EEC Process: Manufacturing Operation - EEC Lean Cell (sec/pc) (sec/pc) Rev. Date Authorized Job ID: Work Cell Operator # 2 of 3 4/5/2000 VPS / EEC
ERROR PROOFING
OTHER JSA
Work StepsOptional Area
Possible Health & Safety
Hazards
Recommended Job Procedures file: lean_***.ppt
selective solder
QPS Sheet #: 1 of 1Zone: EEC
Sign-off / Reps Shift Code 1 Shift Code 2 Shift Code 3RESPIRATOR APRON GROUND
STRAP OR HEEL STRAP
Operators Workgroup Leader
Supervisor Health & Safety
Maintenance Engineering
SAFETY LOCKS
SMOCK
QUALITY CHECKDELTA CRITICAL QUICK CHANGE OVER Q C O
FORD TOTAL PROD. MAINT.
VISUAL FACTORY
IN PROCESS STOCK
F T M
P
EYE PROTECTION
FOOT PROTECTION
HAND PROTECTION
HEARING PROTECTION
HARD HAT
5/2/00 EEC
Walk to post-Solder Pot queue. Pick up module off conveyor with right hand and lift it to magnifying glass for Solder Inspection, bottom side up. Hold with both hands during inspection. Inspect to ensure that all solder joints have sufficient solder, as shown by the posted visual aid.Turn toward Native Mode tester and look to ensure the green light is on next to module that has finished testing. Take the finished module out of the fixture with right hand and place the new module in that fixture with left hand.Step toward Resets tester and look to ensure the green light is on next to module that has finished testing. Take the finished module out of the fixture with left hand and place the new module in that fixture with right hand.
Step toward Ambient tester and use right hand to remove module that has finished testing from fixture, making sure that the module did not fail (by looking at fixture lights). Then place the new module in the available fixture space.Turn toward Dip Coater and insert module that is in right hand into the back-most available slot (furthest left) of the three under the LOAD sign. Next, step toward UNLOAD sign and slide out (pull) the front-most slot (furthest right) module. After all three LOAD slots are filled, all three UNLOAD slots are empty, and red light is flashing, place right hand over palm switch to activate conveyor.
Repeat Cycle – Walk to back-end of Solder Pot.
Transfer module to right hand. Take bottom cover with left hand and place module over it, afterwards holding the assembly with left hand. With right hand, use magnet to slide and position top cover onto top of module. Pick up completed assembly with right hand, and place new assembly onto screwgun machine conveyor with left hand. Inspect completed module for six fully-seated screws and (after transferring module to left hand) stack good (completed) modules, five high, on pre-inspect table next to cold chamber. Use both hands over palm switches to activate machine.
D
D
X XX
X
Note: for tester reject procedure, reference "fail_pro.ppt"EEC LEAN CELL
N4
N5
Laminate Dispense
Hot Final
The Manufacturing System Design Decomposition in the Au
17
Quality Process System Operator Instruction Sheet Optional: Tact Time Cycle Time Plant: North Penn Electronics Facility Product: EEC Process: Manufacturing Operation - EEC Lean Cell (sec/pc) (sec/pc) Rev. Date Authorized Job ID: Work Cell Operator # 3 of 3 4/5/00 VPS / EEC
ERROR PROOFING
OTHER JSA
Step # Work Steps
Optional Area
Possible Health & Safety
Hazards
Recommended Job Procedures
lean_***.ppt
1
2
3
defrost
4
5
6QPS Sheet #: 1 of 1Zone: EEC
Sign-off / Reps Shift Code 1 Shift Code 2 Shift Code 3RESPIRATOR APRON GROUND
STRAP OR HEEL STRAP
Operators Workgroup Leader
Supervisor Health & Safety
Maintenance Engineering
SAFETY LOCKS
SMOCK
QUALITY CHECKDELTA CRITICAL QUICK CHANGE OVER Q C O
FORD TOTAL PROD. MAINT.
VISUAL FACTORY
IN PROCESS STOCK
F T M
P
EYE PROTECTION
FOOT PROTECTION
HAND PROTECTION
HEARING PROTECTION
HARD HAT
5/2/005/16/00
EECEEC
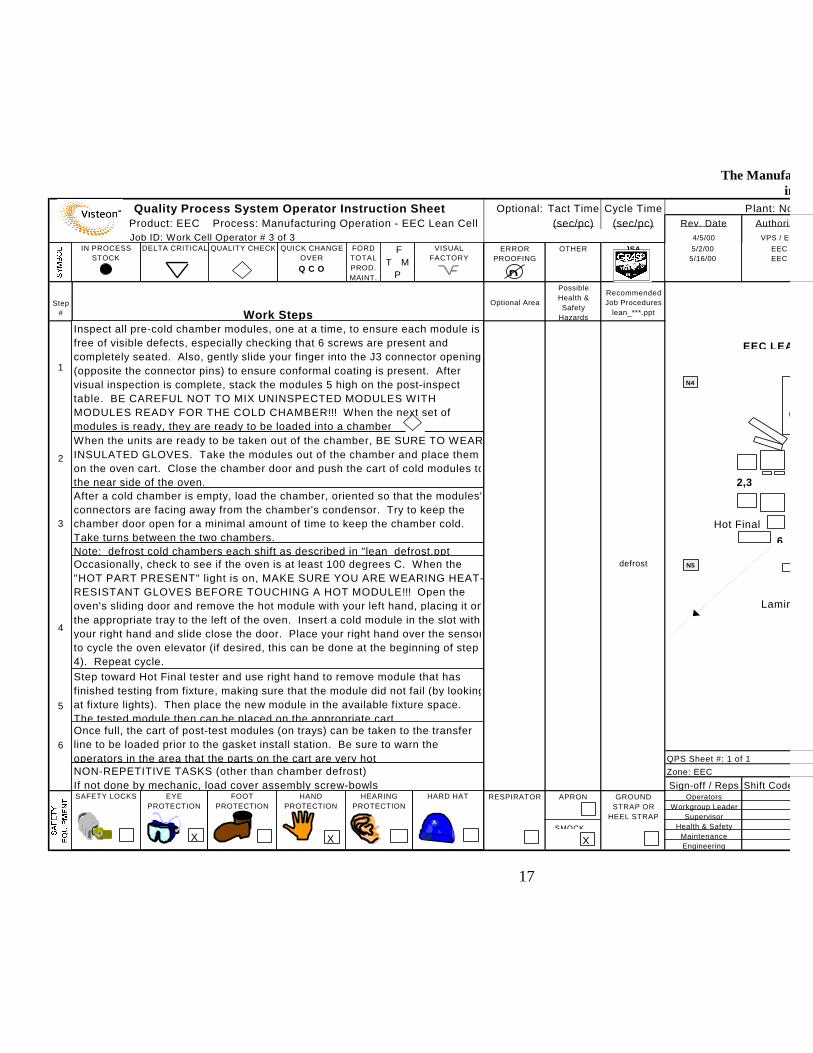
Inspect all pre-cold chamber modules, one at a time, to ensure each module is free of visible defects, especially checking that 6 screws are present and completely seated. Also, gently slide your finger into the J3 connector opening (opposite the connector pins) to ensure conformal coating is present. After visual inspection is complete, stack the modules 5 high on the post-inspect table. BE CAREFUL NOT TO MIX UNINSPECTED MODULES WITH MODULES READY FOR THE COLD CHAMBER!!! When the next set of modules is ready, they are ready to be loaded into a chamber.
After a cold chamber is empty, load the chamber, oriented so that the modules' connectors are facing away from the chamber's condensor. Try to keep the chamber door open for a minimal amount of time to keep the chamber cold. Take turns between the two chambers.
When the units are ready to be taken out of the chamber, BE SURE TO WEAR INSULATED GLOVES. Take the modules out of the chamber and place them on the oven cart. Close the chamber door and push the cart of cold modules to the near side of the oven.
Occasionally, check to see if the oven is at least 100 degrees C. When the "HOT PART PRESENT" light is on, MAKE SURE YOU ARE WEARING HEAT-RESISTANT GLOVES BEFORE TOUCHING A HOT MODULE!!! Open the oven's sliding door and remove the hot module with your left hand, placing it on the appropriate tray to the left of the oven. Insert a cold module in the slot with your right hand and slide close the door. Place your right hand over the sensor to cycle the oven elevator (if desired, this can be done at the beginning of step 4). Repeat cycle.
D
Once full, the cart of post-test modules (on trays) can be taken to the transfer line to be loaded prior to the gasket install station. Be sure to warn the operators in the area that the parts on the cart are very hot!
X X X
Note: defrost cold chambers each shift as described in "lean_defrost.ppt"
NON-REPETITIVE TASKS (other than chamber defrost)If not done by mechanic, load cover assembly screw-bowls.
Step toward Hot Final tester and use right hand to remove module that has finished testing from fixture, making sure that the module did not fail (by looking at fixture lights). Then place the new module in the available fixture space. The tested module then can be placed on the appropriate cart.
2,3
6
EEC LEAN CELL
N4
N5
Coater
Laminate Dispense
Hot Final
The Manufacturing System Design Decomposition in the Automotive Electronics Industry
18
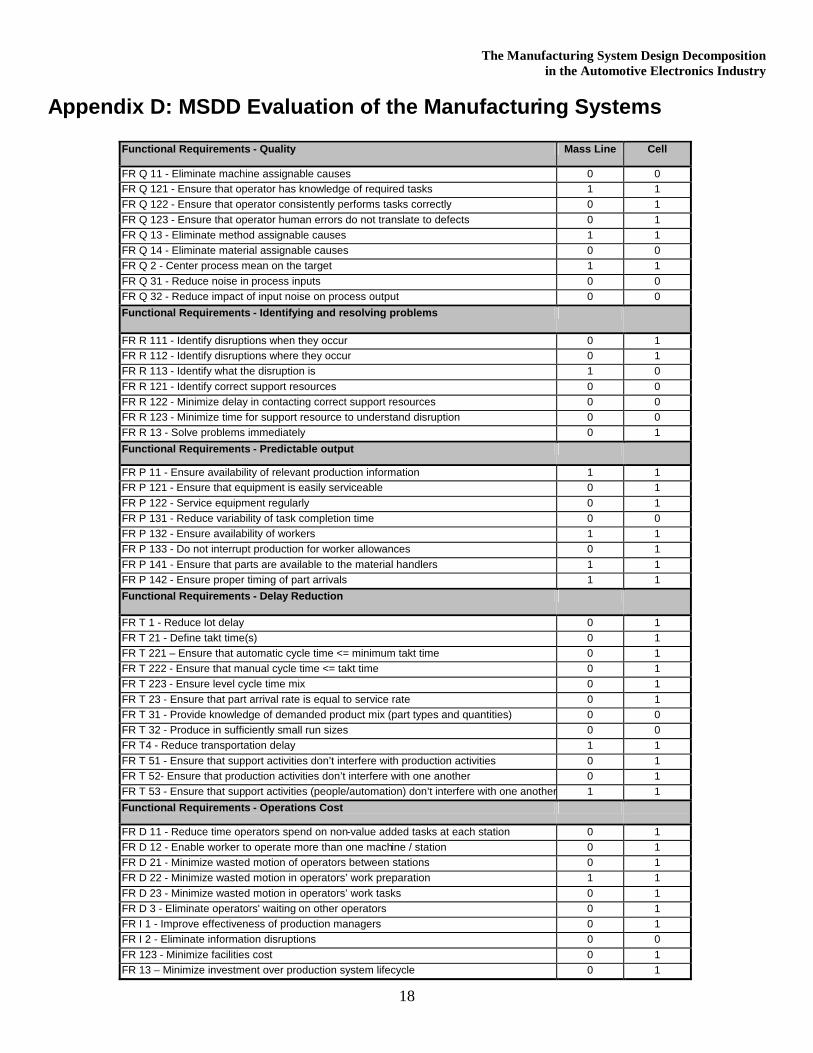
Appendix D: MSDD Evaluation of the Manufacturing Systems
Functional Requirements - Quality Mass Line Cell
FR Q 11 - Eliminate machine assignable causes 0 0 FR Q 121 - Ensure that operator has knowledge of required tasks 1 1 FR Q 122 - Ensure that operator consistently performs tasks correctly 0 1 FR Q 123 - Ensure that operator human errors do not translate to defects 0 1 FR Q 13 - Eliminate method assignable causes 1 1 FR Q 14 - Eliminate material assignable causes 0 0 FR Q 2 - Center process mean on the target 1 1 FR Q 31 - Reduce noise in process inputs 0 0 FR Q 32 - Reduce impact of input noise on process output 0 0 Functional Requirements - Identifying and resolving problems
FR R 111 - Identify disruptions when they occur 0 1 FR R 112 - Identify disruptions where they occur 0 1 FR R 113 - Identify what the disruption is 1 0 FR R 121 - Identify correct support resources 0 0 FR R 122 - Minimize delay in contacting correct support resources 0 0 FR R 123 - Minimize time for support resource to understand disruption 0 0 FR R 13 - Solve problems immediately 0 1 Functional Requirements - Predictable output
FR P 11 - Ensure availability of relevant production information 1 1 FR P 121 - Ensure that equipment is easily serviceable 0 1 FR P 122 - Service equipment regularly 0 1 FR P 131 - Reduce variability of task completion time 0 0 FR P 132 - Ensure availability of workers 1 1 FR P 133 - Do not interrupt production for worker allowances 0 1 FR P 141 - Ensure that parts are available to the material handlers 1 1 FR P 142 - Ensure proper timing of part arrivals 1 1 Functional Requirements - Delay Reduction
FR T 1 - Reduce lot delay 0 1 FR T 21 - Define takt time(s) 0 1 FR T 221 – Ensure that automatic cycle time <= minimum takt time 0 1 FR T 222 - Ensure that manual cycle time <= takt time 0 1 FR T 223 - Ensure level cycle time mix 0 1 FR T 23 - Ensure that part arrival rate is equal to service rate 0 1 FR T 31 - Provide knowledge of demanded product mix (part types and quantities) 0 0 FR T 32 - Produce in sufficiently small run sizes 0 0 FR T4 - Reduce transportation delay 1 1 FR T 51 - Ensure that support activities don’t interfere with production activities 0 1 FR T 52- Ensure that production activities don’t interfere with one another 0 1 FR T 53 - Ensure that support activities (people/automation) don’t interfere with one another 1 1 Functional Requirements - Operations Cost
FR D 11 - Reduce time operators spend on non-value added tasks at each station 0 1 FR D 12 - Enable worker to operate more than one machine / station 0 1 FR D 21 - Minimize wasted motion of operators between stations 0 1 FR D 22 - Minimize wasted motion in operators’ work preparation 1 1 FR D 23 - Minimize wasted motion in operators’ work tasks 0 1 FR D 3 - Eliminate operators' waiting on other operators 0 1 FR I 1 - Improve effectiveness of production managers 0 1 FR I 2 - Eliminate information disruptions 0 0 FR 123 - Minimize facilities cost 0 1 FR 13 – Minimize investment over production system lifecycle 0 1
The Manufacturing System Design Decomposition in the Automotive Electronics Industry
19
Appendix E: Equipment Evaluation Tool
Ensure that equipment
is easily serviceable
Eliminate method
assignable causes
Eliminate machine
assignable causes
Crite
ria
Uppe
r lev
el P
SD D
ecom
posit
ion
(FRs
/DPs
)
FR: Deliver products on time / DP: Throughput time variation reduction
FR: Stabilize Process / DP: Elimination of assignable causes of variation
FR: Maximize long-term return on investment / DP: Manufacturing system design
FR: Respond rapidly to production disruptions /
DP: Procedure for detection and response to
production disruptions
FR: Maximize sales revenue / DP: Production to maximize customer satisfaction
FR: Manufacture products to target design specifications / DP: Production
processes with minimal variation FR: Minim. production
disruptions / DP: Predict. production resources
FR: Meet customer expected lead-time / DP: Mean throughput time reduction
FR: Elimin. op. assig. causes /
DP: Stable output from operators
Rapidly recognize production disruptions
Communic. problems to
the right people
FR: Ensure predictable equipment
output / DP: Maint. of
equipment
FR: Reduce run size
delay / DP: Prod’n of
desired mix and quantity
Produce in sufficiently small run
sizes
FR: Reduce process
delay / DP: Production balanced to
takt time
Ensure that production
cycle time is balanced with takt
time
FR: Minimize production costs / DP: Elimination of NVA sources of cost
FR: Reduce waste in direct labor / DP:
Elimination on NVA tasks FR: Elimin. ops. waiting on eqpmnt. DP: Human-
machine separation
Reduce time operators spend on non-value
added tasks at each station
Reduce systematic operational
delays
Minimize investment
over production
system lifecycle
Minimize facilities
cost
Eliminate wasted
motion of operators
Ensure op. errors don’t translate to
defects
Direct Labor Quality
Time Variation
Inve
stm
ent
Faci
litie
s C
ost
Delay Reduction
FRs used as evaluation criteria FRs driving equipment design and operation but not directly evaluated (evaluated using their parent FRs)