THE MOTIVATIONS AND TOURIST SATISFACTION ROLES ON...
118
THE MOTIVATIONS AND TOURIST SATISFACTION ROLES ON DESTINATION LOYALTY (Study Of Muslim Tourist in Yogyakarta, Central Java) UNDERGRADUATE THESIS Submitted to Faculty of Economics and Business For Acquiring Bachelor Degree of Economics by: Nugroho Wicaksono 1113081100007 MANAGEMENT DEPARTMENT INTERNATIONAL PROGRAM FACULTY OF ECONOMICS AND BUSINESS SYARIF HIDAYATULLAH STATE ISLAMIC UNIVERSITY JAKARTA 1439H/ 2018
Transcript of THE MOTIVATIONS AND TOURIST SATISFACTION ROLES ON...
THE MOTIVATIONS AND TOURIST SATISFACTION ROLES ON
DESTINATION LOYALTY
(Study Of Muslim Tourist in Yogyakarta, Central Java)
UNDERGRADUATE THESIS
Submitted to Faculty of Economics and Business
For Acquiring Bachelor Degree of Economics
by:
Nugroho Wicaksono
1113081100007
MANAGEMENT DEPARTMENT
INTERNATIONAL PROGRAM
FACULTY OF ECONOMICS AND BUSINESS
SYARIF HIDAYATULLAH STATE ISLAMIC UNIVERSITY
JAKARTA
1439H/ 2018
i

ii

iii

iv
v
CURICULUM VITAE
Name : Nugroho Wicaksono
Place, Date of Birth : Tangerang, April 3 1994
Address : Reni Jaya Flamboyan I AA 13/9, West Pamulang
South Tangerang - 15417
Hoby : Motorcycle Touring
Phone Number : 085693902129
Email : [email protected]
Religion : Islam
Formal Educational background :
State Islamic University Syarif Hidayatullah Jakarta, Faculty Economic
and business (2013-2018)
vi
Bogor Agricultural University, Major enviromental resource economic
Faculty Economic and management (2012 – 2013)
SMA N 1 Tangerang Selatan, Major Sains (2009-2012)
SMP N 1 Pamulang (2006 – 2009)
SD N Pamulang 1 ( 2000 – 2006)
Informal educational background :
Nurul Fikri (2009-2012)
Maestro (2006-2009)
Cambridge School of English (2005-2009)
Organization Record :
Member of management internal organization division of external college
relationship ( 2013 -2014)
Chairman of division arts and culture internal student organitation SMAN
1 Tangerang Selatan (2011-2012)
Member of Young green leaders national organization chapter
Jabodetabek (2011-2012)
Member division appreciation of nationality internal student organization
SMAN 1 Tangerang Selatan (2010-2011)
Vice chairman of Islamic organitation SMPN 1 Pamulang (2008-2009)
vii
ABSTRAK
Penelitian ini ditujukan untuk menganalisis pengaruh dari push
motivation dan pull motivation terhadap kepuasan wisatawan dan loyalitas
wisatawan terhadap destinasi wisata. Responden untuk penelitian ini adalah
wisatawan yang pernah berkunjung ke Yogyakarta. Penelitian ini menggunakan
hasil dari responden sebanyak 100 orang responden. Penelitian ini menggunakan
metode Partial Least Square (PLS) untuk menganalisa data Dengan menggunakan
software SmartPls3.0. Hasil dari penelitian ini menunjukan tujuh hipotetsis
diterima dari jumlah sembilan hipotesis yang diuji untuk menunjukan hubungan
antar variable. Pull motivation menunjukan hubungan signifikan terhadap variable
loyalitas destinasi secara langsung ataupun dengan melalui variable kepuasan
turis.
Kata kunci : pull , push , kepuasan wisatawan, loyalitas destinasi, Yogyakarta
viii
ABSTRACT
This research analyze the influence of push motivation motivation and
pull motivation towards tourists satisfaction roles destination loyalty .The
respondents for this research were tourists who has visited yogyakarta .This
research result was used 100 respondents. This reseacrh used model Partial Least
Square (PLS) to analyze data this research used software SmartPLS3.0. The
result of this research show that there are seven hypoteses significant from total
nine hypoteses that tested to show relationship with other variable.Pull motivation
shows significant relationship with variable destination loyalty directly or indirect
through tourist satisfaction
Key words : pull , push, tourist satisfaction, Destination loyalty, Yogyakarta
ix
FOREWORD
Bismillahirrahmanirrahim
Assalamua‟laikum warahmatullahi wabarakatuh
Alhamdullilah, thanks to my almighty God Allah Subhanahu Wataa‟la who
have been provide islam as a guidance for people in the world, with justice,
walfare, perfection and blessing.. Sholawat and salam deliver to prophet
Muhammad Shallalllahu Alayhi wa Sallam, as the deliver the message, deliver
amanah,and giving good advice to people
This thesis title is “The motivation and tourist satisfaction rolos on
destination loyalty, study case of muslim tourist in Yogyakarta,Central Java” then
i complete this thesis in order to obtain bachelor degree of Economy in Faculty
Economics and Business faculty State Islamic University Syarif Hidayatullah
Jakarta. Alhamdulillah,
With the help and blessing from Allah Subhanahu Wataa‟la, this thesis can
be done, although i realized there are still many deficient for writing this thesis.
Hope this thesis can be usefull for others.
I say thanks to the people who have helped me in the preparation of this
thesis :
1. Allah Subhanahu Wataa‟la yang maha segalanya, yang melimpahkan
karunianya, serta ilmu pengetahuan yang tidak terhingga sehingga saya
dapat menyelesaikan skripsi ini
2. Prof. Dr. Dede Rosyada, MA as a rector of State Islamic University Syarif
Hidayatullah Jakarta
x
3. Dr. M. Arief Mufraini, LC, M.si ad Dean of Economic and business faculty
State Islamic university Syarif Hidayatullah Jakarta
4. Titi Dewi Warninda, M.si, as a head of Major Management Economic and
business faculty State Islamic University Syarif Hidayatullah Jakarta
5. Ela Patriana, MM as a secretary of Major Management, Thank you for all
your patient, and suggestion while i‟m as a student in Management. Thank
you Mrs Ela.
6. Cut Erika Ananda F, MBA, as thesis supervisor. Thank you for the time
that given to me for consultation, and give me recommendations during
finishing thesis.
7. Dra. Madinatul Musyarofah, as a head of Academic economic and business
faculty, Thank you for your care and give advice to me during finishing my
studies in management international program.
8. Mardiani Bonik S.Far, Ahmad Ghazali, Ajib, as academic staff economic
and business faculty, all of you very helpful and care thankyou.
Jakarta, February 2018

xi
SPECIAL THANKS
This thesis I dedicate to :
1. My beloved mother, Hj. Yumami. and my beloved father Drs. H.
Suyatin MM, who never tired to give love, support, and prayer to
me. Also your advice to me so far, Drop sweat “Bapak” that can be
my motivation and love from “Mama” for your unlimited prayers
and support towards me. I don‟t know how my life without my
mom and my father. Love you so much.
2. My old brother, H.Widhi Wicaksono SE, MM, and his wife Ria
Yunita, S.Gz also my nephew Khalisa Hanifa Wicaksono. Thank
you for all your suggestion and support me also sharing of
happiness with warm every weekend in our parents house.
3. My young sister, Tri Wulandari. Who helping me and be my place
confide for all my activities and my concerned. I hope you can be
better than your brother and may allah bless you to be a doctor
pediatrician
4. Umaymah Azmy, Thank you for helping me, teach me with patient
and kindness. May Allah give you barakah that everything you
have done for me.
5. Khalis Dea “My coffe girl” who never tired to give support , care,
motivate and listen while i‟m worry. Thank you for give me
“lessons” and accompnied me in the last time of my studies in
Syarif Hidayatullah Jakarta.
6. My touring team, Andhika Putra S.Ant, and Setyaji Laksono. who
always accompanied me for the trip with two wheels. Thank you so
much to be good friends so far. I hope we can still trip togehther in
other time.
7. Last population of Management International Program 2013, Rizqo
Yanu, Naufal Khozin, Rendy Budi, Siti Nurma, Sahila Diniswara,

xii
Agnes Kartika, Ahmad Idun, Wendy, Abdulmajid, Riajani
Garniera, Ida Rosidah, Anindya, Enggar, Dhani ramdani. As a
kindness friend, thankyou for sharing, discussion, and moment of
happiness in class.
8. Fitria Ramawanti S.Keb, who give me good advice for love affair
in maturity process. Thanks for all moment that we share together
with “Uni young sister‟‟, Silfia sisil. May allah give barakah and
happiness for both of you.
9. My junior in islamic state university syarif hidayatullah Jakarta ,
Hani Afrahanifah, Liza Septiana, Kamil, Miftah, Salsabila salcy,
Ruby, Nisrina Nuryuzha, Milla khalifah. Thank you for everything
that i got from you. Hope all of you can be finished your thesis
ontime.
10. All canteen crew of Economics and business faculty , Teh ririn,
Teh Yuli, Teh Kokom, Bude, Teh Boby, Mpok Eti, Teh Wilda,
Teh Tini, Teh Cucu, Teh Lela. Thankyou so much for often give
Free Ice Cappucino and sharing happiness.
Thank you for everything that all of you that given to me.
Jakarta, February 2018
Nugroho Wicakson
xiii
TABLE OF CONTENT
APRROVAL THESIS SHEET ....................................................................... ...i
APPROVAL COMPREHENSION SHEET .................................................. ...ii
APPROVAL THESIS EXAM SHEET.............................................................iii
SHEET STATEMENT AUTHENCITY SCIENTIFIC WORKS ............... ..iv
CURRICULUM VITAE .................................................................................. ...v
ABSTRAK ........................................................................................................ .vii
ABSTRACT ...................................................................................................... viii
FOREWORD .................................................................................................... ..ix
SPECIAL THANKS ........................................................................................ ..xi
TABLE OF CONTENT ................................................................................... xiii
LIST OF TABLE ............................................................................................. ..xv
LIST OF FIGURE ........................................................................................... .xvi
CHAPTER I: PREFACE
A. Background ........................................................................................... 1
B. Problem Formulation........................................................................... 10
C. Objectives and Benefits of Research .................................................. 10
CHAPTER II: LITERATURE REVIEW
A. BASIC THEORY
1. Tourism ..................................................................................... 13
2. Tourist ....................................................................................... 16
3. Halal Tourism ........................................................................... 17
4. Motivation ................................................................................. 18
5. Push and Pull Factors .............................................................. 20
6. Tourist Satisfaction .................................................................. 21
7. Destination Loyalty .................................................................. 23
8. Relationship of Dependent and Independent variable ......... 25
9. Previous Research....................................................................26
B. Conceptual Framework ....................................................................... 28
C. Hypothesis ............................................................................................. 30
xiv
CHAPTER III: RESEARCH METHODOLOGY
A. Research scope.....................................................................................32
a. Sampling technique................................................................. 32
b. Collecting data technique........................................................33
B. Data Analysis Technique ..................................................................... 36
1. Definition and Basic Concept of PLS ..................................... 36
2. The Writing and Depiction of Variables ................................ 37
3. General Approach of PLS ....................................................... 42
4. Stages of PLS ............................................................................ 42
C. Operational Variable ........................................................................... 44
CHAPTER IV: ANALYSIS AND DISCUSSION
A. Analysis and Discussion ....................................................................... 49
1. Respondents descriptive .......................................................... 49
2. Evaluation of Measurement Model (Outer Model)............... 52
3. Evaluation of Structural Model (Inner Model) ..................... 61
4. Hypothesis Analysis ................................................................. 63
CHAPTER V: CONCLUSION AND RECOMMENDATION
1. Conclusion ................................................................................. 73
2. Recommendation ...................................................................... 75
ATTACHMENTS ............................................................................................ 73
a. Respondent Quisioner sheet....................................................73
b. Result of output SmartPLS 3.0...............................................85
BIBLIOGRAPHY ............................................................................................ 97
xv
LIST OF TABLE
Table 3.1: Likert Scale ........................................................................................ 35
Table 3.2: Operational Variables ...................................................................... 44
Table 4.1: Respondents Based on Gender......................................................... 49
Table 4.2: Respondents Based on Ages ............................................................. 50
Table 4.3: Respondents Based Occupation ....................................................... 51
Table 4.4: The Result of Loading Factor .......................................................... 53
Table 4.5: Cronbach’s Alpha Analysis Result .................................................. 55
Table 4.6: Composite Reliability Analisys ........................................................ 56
Table 4.7: AVE Analysis Result ......................................................................... 57
Table 4.8: Latent Variable Correlation ............................................................ 58
Table 4.9: Square Foot AVE .............................................................................. 58
Table 4.10: Cross Loading Values ..................................................................... 59
Table 4.11: R2
Result Analysis ........................................................................... 61
Table 4.12: Path Coefficient (Mean, STDVE, t values) ................................... 63
Table 4.13: R2 Adjusted ..................................................................................... 66
Table 4.14: Indirect Effects ................................................................................ 70
xvi
LIST OF FIGURE
Figure 1.1: Global Muslim Population .............................................................. 2
Figure 1.2: Number of International Tourist arrivals to Indonesia ............... 3
Figure 1.3: The top ten Organization Islamic Conference ............................. 4
Figure 1.4: International Tourist come to Yogyakarta ................................... 6
Figure 1.5: Domestic tourist come to Yogyakarta............................................ 6
Figure 2.1: Conceptual Framework Research ................................................. 29
Figure 3.1: Four latent variable path modeling ............................................... 37
Figure 3.2: Latent and manifest Variables Push motivations........................ 38
Figure 3.3: Inner and outer model....................................................................41
1
CHAPTER I
A. BACKGROUND.
Travel and tourism is an important economic activity in the most countries
around the world. It has both, significant direct and induced impact to industry
and societies. It generated US$7.6 trillion (10 % of global GDP) and 277 million
jobs for global economy in 2014 (World Travel and Tourism Council, 2015).
In globalization era increasingly strong along progress in transportation,
and communication more fast, easy and cheap. So that make barriers area is not
one of factor to visit one place. In this globalization era, there are business sector
grow fast. This phenomena is not separated from the role of marketing. Marketing
now is not only been held by the private company to raise products or brand. But,
now marketing start adopted by government in level district and city. Service
Marketing according to Lovelock and Wirtz (2011:37) is an economic activity
offered by one party to another .The services sector is a sector the most made up
in competition between regions.
According to Kartajaya and Yuswohadi (2005:6) Local customer and
regional communities requiring public services such as traders, participating, and
investors, well inside in local and others regions, talent, developer, and organizer,
and all parties who have contribution in establishing superiority and domination in
region competition
2
1.599.700.000 1.907.110.000
2.209.270.000 2.497.830.000
2.761.480.000
0
500.000.000
1.000.000.000
1.500.000.000
2.000.000.000
2.500.000.000
3.000.000.000
2010 2020 2030 2040 2050
Global Muslim Population
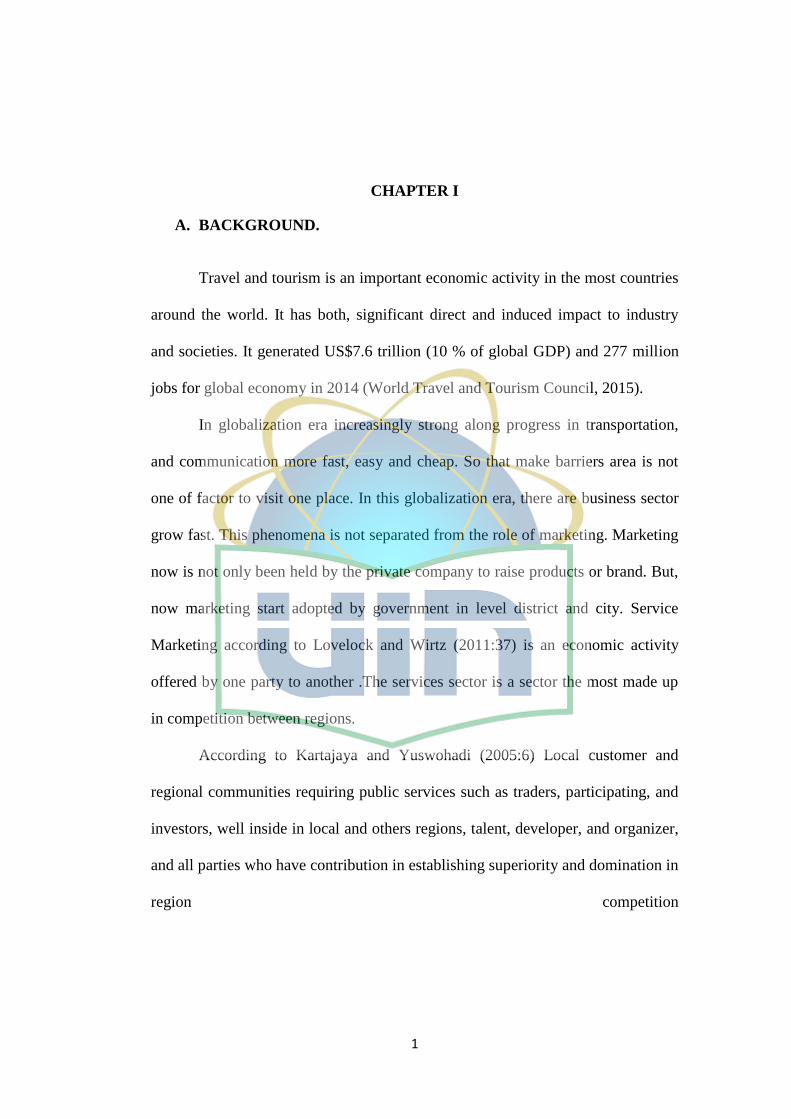
Figure 1.1
Global Muslim Population
Source : Pew Research Center, 2015
Total muslim population in the world in 2010 1.5 billion people and
prediction population grow rapidly and constantly significant. Muslim population
is estimated to grow to 1.9 billion of world population in 2020. In 2030 it
estimated to grow to 2.2 billion. in 2040 2.49 billion and it will still grow in 2050
about 2.76 billion of world population (Pew Research Center, 2015). Growing up
muslim population in the world, trend of Islamic Tourism will developed in
International. Based on data from GMTI (Global Muslim Travel Index) in 2017,
internatrional muslim tourist 121 million in 2016, and prediction will grow up
untill 156 million tourist in 2020 (Mastercard and CrescentRating 2017)
Global Muslim Tourist Index (GMTI) is trip index for global muslim
tourist which survey by Mastercard With the purpose of giving new insight and
updated about the marketplace tourist. The index include 130 countries to be used
as the basis of halal tourism. The majority muslim population derived from some
3
of the fastest growing countries such as Malaysia, Indonesia, Turkey, and others
middle east countires. (Mastercard and CrescentRating 2015
A few years ago, muslim travels to some specific destinations which
understood requirements of muslim travelers, while other destinations did not
have. Recently, muslim travelers behavior and profile already changed.
Nowadays, they seek destinations which can cater their special needs (Crescent
Rating and Master Card, 2016) such as hotel with prayer time reminders or at least
direction to Mecca, swimming pool that separated between men and women,
serving halal food and beverages, Ramadan services and separated SPA services
(Halal lifestyle, 2016).
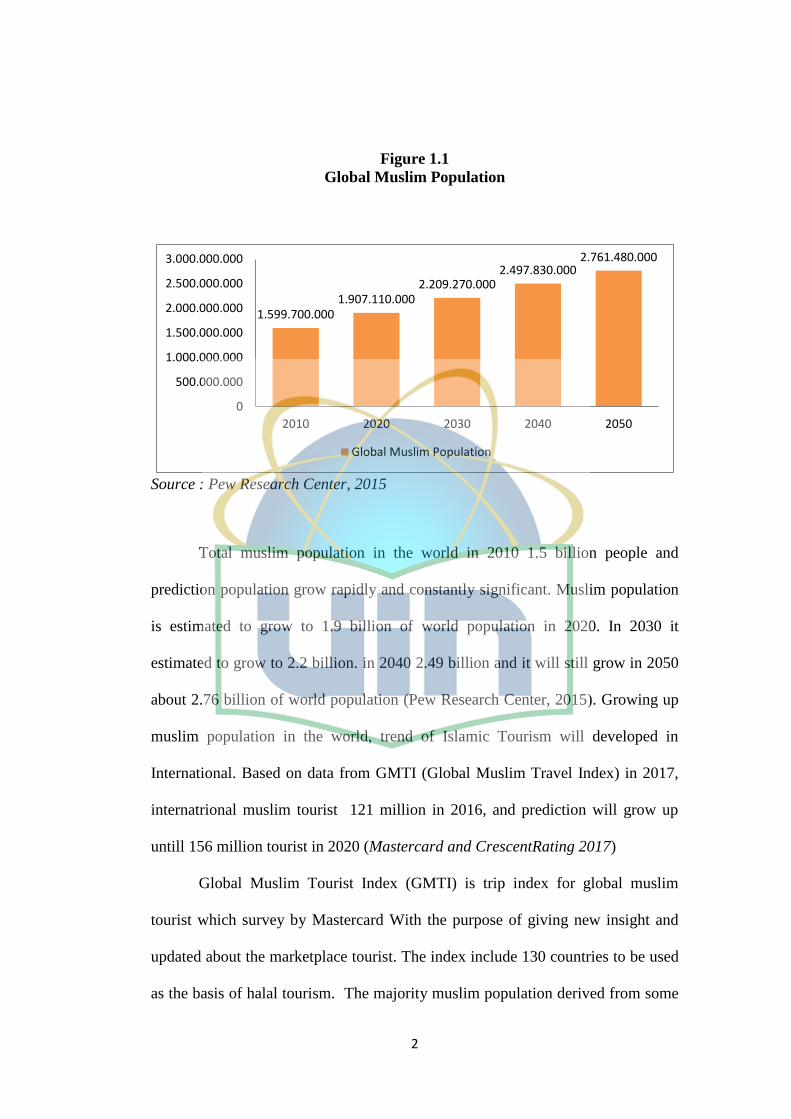
As well as its role in global, tourism industry also plays an important role
in Indonesia. It contributes IDR 946,087.0bn or 9.3% of GDP in Indonesia in
2014. Tourism industry also contributes to employment, including indirect jobs
that supported by the industry, was 8.4% of total employment (World Travel and
Tourism Council, 2015).
Figure 1.2
Number of International Tourists Arrivals to Indonesia 2011-2015
source : Badan Pusat Statistik
7.649.731 8.044.462 8.802.129 9.435.411 10.230.775
2011 2012 2013 2014 2015
Number of International Tourists
Number of International Tourists
4
The number of international tourist who came to Indonesia increased since
the last five years. Based on Indonesian Central Bureau of Statistics report, in
2011 7,649,731 international tourists arrived to Indonesia, in 2012 have increased
to 8,044,462, in 2013 8,802,129, in 2014 9,435,411 and in 2015 10,230,775.
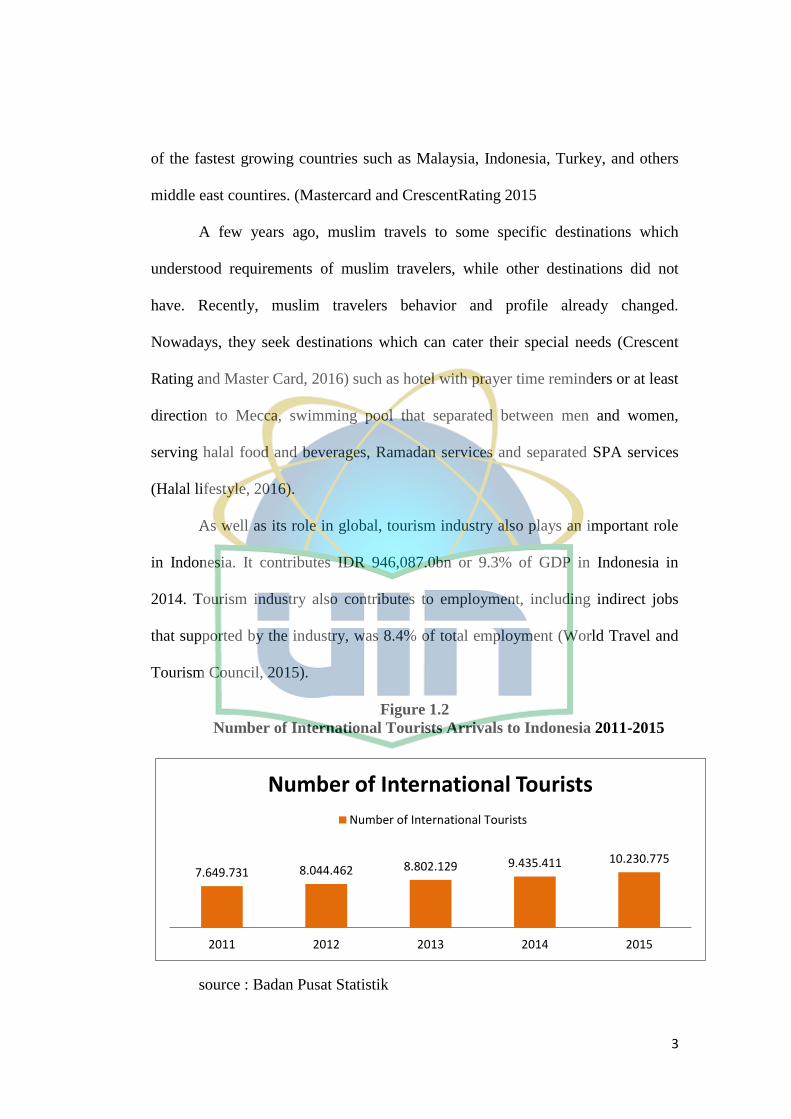
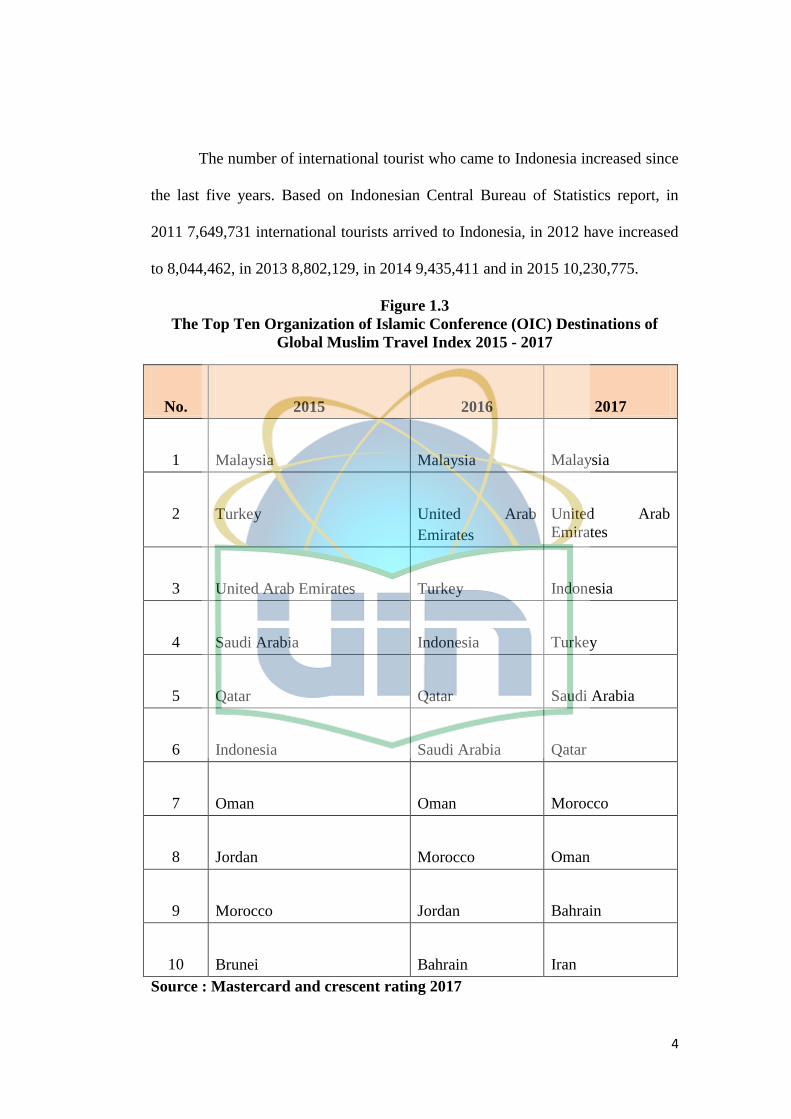
Figure 1.3
The Top Ten Organization of Islamic Conference (OIC) Destinations of
Global Muslim Travel Index 2015 - 2017
Source : Mastercard and crescent rating 2017
No. 2015 2016 2017
1 Malaysia Malaysia Malaysia
2 Turkey United Arab
Emirates
United Arab
Emirates
3 United Arab Emirates Turkey Indonesia
4 Saudi Arabia Indonesia Turkey
5 Qatar Qatar Saudi Arabia
6 Indonesia Saudi Arabia Qatar
7 Oman Oman Morocco
8 Jordan Morocco Oman
9 Morocco Jordan Bahrain
10 Brunei Bahrain Iran
5
Based on data research by Mastercard and CrescentRating 2017, country
in the first position as the best halal tourism destination is Malysia with the score
82.5, in second position Uni emirates Arab with the score 76.9, Indonesia in third
position with the score 72.6, Turkey in fourth posisiton with score 72.4, Saudi
arabia in fifth position 71.4, and others countries in top 10 destination halal
tourism.
Global Muslim Tourist Index (GMTI) predict that Indonesia have big
opportunity to be the best halal tourism destination in the world. Indonesia have a
big resources and good view in every region. Moreover countries that join in OIC
(Organization Islamic Conference) targeting muslim tourist, that compete each
others to make tourist interesting with all facilities in each destination, growing up
facility, services for support halal tourism. (Liputan 6 news 2017)
Tourism being one of the sectors that contribute large enough on each the
development and growth of a country including Indonesia. To strenghten image of
Indonesia in tourist mind, Indonesia intoduced tagline “wonderful indonesia” for
compete with others tourism brand countries. (Maharani, 2013). Especiality in
Yogyakarta have tagline to promote how wonderful this city with tagline “Jogja
Istimewa”. here no escaping the fact art and cultural awake authenticity and
beauties , until now Special region of yogyakarta have royal palace and place
arround royal palace .As a relic of a great dominion , so yogyakarta having high
culture and culture source of java .Which is stillart culture which carved into
history as temple and others historical reli in the society of Yogyakarta.
6
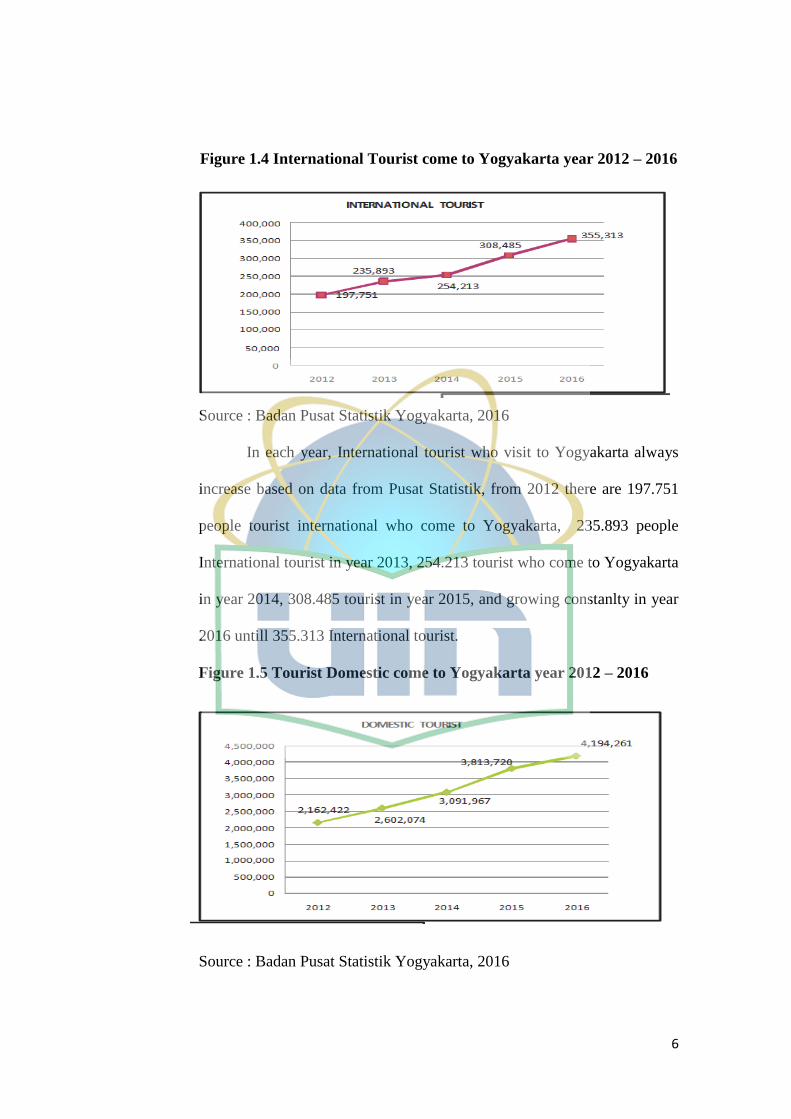
Figure 1.4 International Tourist come to Yogyakarta year 2012 – 2016
Source : Badan Pusat Statistik Yogyakarta, 2016
In each year, International tourist who visit to Yogyakarta always
increase based on data from Pusat Statistik, from 2012 there are 197.751
people tourist international who come to Yogyakarta, 235.893 people
International tourist in year 2013, 254.213 tourist who come to Yogyakarta
in year 2014, 308.485 tourist in year 2015, and growing constanlty in year
2016 untill 355.313 International tourist.
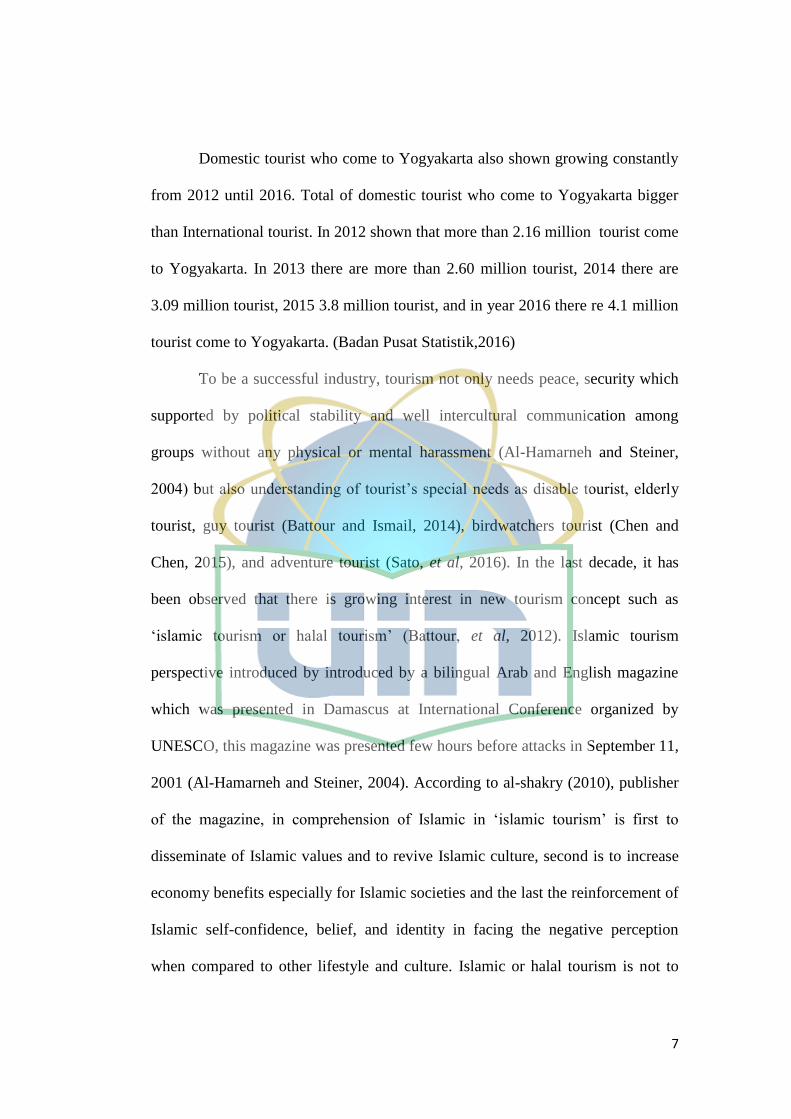
Figure 1.5 Tourist Domestic come to Yogyakarta year 2012 – 2016
Source : Badan Pusat Statistik Yogyakarta, 2016
7
Domestic tourist who come to Yogyakarta also shown growing constantly
from 2012 until 2016. Total of domestic tourist who come to Yogyakarta bigger
than International tourist. In 2012 shown that more than 2.16 million tourist come
to Yogyakarta. In 2013 there are more than 2.60 million tourist, 2014 there are
3.09 million tourist, 2015 3.8 million tourist, and in year 2016 there re 4.1 million
tourist come to Yogyakarta. (Badan Pusat Statistik,2016)
To be a successful industry, tourism not only needs peace, security which
supported by political stability and well intercultural communication among
groups without any physical or mental harassment (Al-Hamarneh and Steiner,
2004) but also understanding of tourist‟s special needs as disable tourist, elderly
tourist, guy tourist (Battour and Ismail, 2014), birdwatchers tourist (Chen and
Chen, 2015), and adventure tourist (Sato, et al, 2016). In the last decade, it has
been observed that there is growing interest in new tourism concept such as
„islamic tourism or halal tourism‟ (Battour, et al, 2012). Islamic tourism
perspective introduced by introduced by a bilingual Arab and English magazine
which was presented in Damascus at International Conference organized by
UNESCO, this magazine was presented few hours before attacks in September 11,
2001 (Al-Hamarneh and Steiner, 2004). According to al-shakry (2010), publisher
of the magazine, in comprehension of Islamic in „islamic tourism‟ is first to
disseminate of Islamic values and to revive Islamic culture, second is to increase
economy benefits especially for Islamic societies and the last the reinforcement of
Islamic self-confidence, belief, and identity in facing the negative perception
when compared to other lifestyle and culture. Islamic or halal tourism is not to
8
substitute existing tourism segment but to open up new opportunities (Al-
Hamarneh and Steiner, 2004).
Yogyakartais a potential market for halal tourism it does not mean
hospitality businessman in Yogyakarta support this program of halal tourism.
Most of the businessmen still do not take halal certification for halal food and
hotel yet. In order of facing stiff field of competition, gaining abundance
information of motivation and it interrelationship with consumer satisfaction and
loyalty is an important factor (Yoon and Uysal, 2005). Many researchers agreed
that motivation is vantage point to start understanding why people travel and
choose specific destination (Kim, 2008). Motivation is a part of psychological
factors besides perception, learning, beliefs and attitude which influence someone
purchase decision (Kotler and Amstrong, 2010).
Push motivations are factors that come from internal desire of tourist
(Uysal and Jurowski, 1994), for instance, achievement, exciting and adventure,
family togetherness, knowledge and education, escape, and sports (Battour, et all,
2012). On the other side, Pull motivations are emerged from external factors
which pulled tourist to the destination (Kim and Lee, 2002) such as, modern
atmospheres and activities, wide space and activities, small size and reliable
weather, natural scenery, different culture, cleanness and shopping, night life and
local cuisine, interesting town and village and water activities (Yoon and Uysal,
2005). Destination marketers could identify factors that affect tourist decision to
cater the physical and emotional needs of tourists through analysis of push and
pull motivation (Kim, et al, 2008).
9
Research that examined the influence of motivation towards satisfaction
conducted in the field of travel, tourism and vacation (Sato, et al, 2016).
Satisfaction is evaluation process that done by a customer in term of fulfilling the
customer needs and wants (Zeithaml, et al, 2009). Satisfaction as a result of
previous visit will effect to the loyalty (Um, et al, 2006). Sramek, et al (2008)
define loyalty as post purchase evaluation that produce result such as positive
attitude toward product, commitment, and willingness to recommend. Even
thought in term of tourism the repeaters will spend money less than first comers,
but they have intention to recommend to their relatives, and friends (Sato, et al,
2016).
Many researchers have found that there is significant relation of
motivations, satisfaction and destination loyalty. Sato, et al, (2016) found that
there is significant influence from pull motivation toward destination loyalty
through satisfaction for decision makers of destination. Another research
conducted by Battour, et al, (2012) found that tourism motivations significantly
and positively influence to tourist satisfaction
Therefore, by looking at the phenomenon that happens now, the author is
interested in conducting research entitled “The Motivations and Tourist
Satisfaction Roles on Destination Loyalty (Study of Muslim Tourists in
Yogyakarta, Central Java)”.
10
A. Problem Formulation.
1. Do push motivation influence tourist satisfaction and how it relationship with
tourist satisfaction?
2. Do pull motivation influence tourist satisfaction and how it relationship toward
tourist satisfaction?
3. Do push and pull motivation influence tourist satisfaction simultaneously?
4. Do tourist satisfaction influence destination loyalty and how it relationship
toward destination loyalty?
5. Do push motivation influence destination loyalty and how it relationship
toward destination loyalty?
6. Do pull motivation influence destination loyalty and how it relationship
toward destination loyalty?
7. Do push and pull motivation influence destination loyalty simultaneously?
8. Do pull motivation influence destination loyalty through tourist satisfaction?
9. Do push motivation influence destination loyalty through tourist satisfaction?
B. Objectives and Benefit of Research
Based on the previous explanation of the problem, the specific objectives of
this research are:
1. To analyze how push motivation‟s relationship and influence toward tourist
satisfaction.
2. To analyze how pull motivation‟s relationship and influence toward tourist
satisfaction.
11
3. To analyze how push and pull motivation‟s relationship and influence toward
tourist satisfaction simultaneously.
4. To analyze how overall tourist satisfaction‟s relationship and influence toward
destination loyalty.
5. To analyze how push motivation‟s relationship and influence toward
destination loyalty.
6. To analyze how pull motivation‟s relationship and influence toward
destination loyalty.
7. To analyze how push and pull motivation‟s relationship and influence toward
destination loyalty.
8. To analyze how pull motivation‟s relationship toward destination loyalty
through overall tourist satisfaction.
9. To analyze how push motivation‟s relationship toward destination loyalty
through overall tourist satisfaction.
this research, emphasize for groups below :
1. For the researcher
Adding research insight into phenomenon that happened recently in
tourism industry, and understanding about tourist satisfaction and their loyalty
to destination based on their motivations, here are push motivations which is
come from tourist internal desire and pull motivations which is come from
external factors such natural scenery and wide space and activities.

12
2. For Government.
The result of this research can be useful as consideration in making
decision or crating policy in special region of Yogyakarta. This research can
help government to arrange the suitable policy which can support the
development of tourism industry.
3. For Readers.
The result of this research can be useful as an insight for readers who
work in tourism sector, especially on motivations of tourist to come to current
destination, and how they impact on tourist satisfaction and destination loyalty
13
CHAPTER II
LITERATURE REVIEW
A. Basic Theory.
1. Tourism.
UNWTO (2012) defined tourism as “the cluster of productions units in
different industries that provide consumption goods and services demanded by
visitors” (Robinson et al, 2013). According to Jafari (1977) tourism can be
define as “the study of man away from his usual habitat, of the industry which
responds to his needs, and of the impacts that both he and the industry have on
the host‟s socio-cultural, economic, and physical environments” (as cited in
Batta, 2010) According to Indonesian law number 10 of 2009 on tourism that
tourism can be define as various activities of tourism and supported by
facilities and services that provided by local community, businessman, and
government (Ismayanti, 2010).
Emerging of tourism is caused by three main reasons, they are :
a. Tourist
Tourist is an actor in tourism, who does a lot of activities inside
tourism term. Tourism is where and when people can enjoy, anticipate and
recall moments in their life (Ismayanti, 2010)
b. Geography element.
Geography elements subdivide into three main areas:
14
1. Origin area of tourist.
The place where tourist usually been, where they do their daily life for
instance working, studying, sleeping, and other basic necessities
(Ismayanti, 2010). According to Batta (2000) the origin are of tourist is
location to generate demand of tourism activities. In this area marketing
fuctions such as promoting, advertising, retailing are conducted in way
attract tourist.
2. Transit area.
Transit area route is a way that related to origin area and destination of
tourist, along with tourist travel (Batta, 2000). Tourists do not have to stop
in this area if it do not needed. But, this area is important, and many
tourists go to other destinations through this area. Tourists sometimes
ended the journey here. Some countries that used as transit area such as
Singapore and Hongkong (Ismayanti, 2010).
3. Tourist destination.
This area usually called sharp end of tourism. This area affected so much
by tourism. To develop the potential of this area, careful planning and
right strategic management are needed. Tourist destination is a creator of
tourism flow, and demand from tourists to travel from origin area. This
area can conclude as a reason of existence and development of tourism
(Ismayanti, 2010).
15
c. Tourism Industry.
Industry is every unit which is supplied the facilities, services, and
demand for tourist. The industry is business unit that spread in the three main
area of tourism, such as travel agent that comply tourists‟ needs from the
origin place until they arrived in the destination. (Ismayanti, 2010).
According to Heeley (1980) definition of tourism subdivide into two
main groups. First is conceptual thinking which attempt to explain tourism as
an activity. Second is technical definition which attempt to explain tourism as
people who work in this industry and involve with this activity, they are
people who employed to do the report about the activity and do survey and
submit the statistics data.
Based on tourism statistics tourism divided into three types :
a. Domestic tourism.
Domestic tourism can be define as activities which done by visitors in
their own country, even though the activities are part of international or
domestic trip (Scott et al, 2012).
b. Inbound tourism.
Inbound tourism is activity of tourism which done by visitors (non
resident) outside their origin country in certain destination or economy and
the activity can be part of domestic or international trip (Scott et al, 2012).
16
c. Outbound tourism.
Outbound tourism can be define as activities of tourism which done by
visitors outside their own country or economy, and this trip can be part of
domestic and international trip (Scott et al, 2012).
2. Tourist.
According to Rahman (2014) tourist can be define as “people who stay
their unusual place over the night up to one year for the sake of business or
vacation”. According to Batta (2000) Tourists are people who stay out the
usual place of residence at least one night over and making free and temporary
trip, exclude trip that made for earning money. According to UNWTO, tourist
can be define as “Overnight visitor, visitor staying at least one night in a
collective or private accommodation in the place visited”(as cited in
Ismayanti, 2010)
Ismayanti subdivides tourist into three main groups, they are :
a. Leisure and recreation.
Tourist who included in this group, they are who have these several
purposes such as vacancy and recreation, visiting culture events, healthy
purposes, sport (not as professional athlete) and other vacation reasons for
seeking pleasure. Main activities of this group are eating (Culinary),
taking a walk around the destination, and enjoying city environment
(Ismayanti, 2010).
17
b. Business and Professional.
Tourist who included in this group travel due to some purposes for
instance meeting client, incentive travel, business and certain mission that
linked to work. Activities that tourist in this group do, have important
impact to work.
c. Other tourism purposes.
Some other tourism reasons are, studies, health treatment, transit
and others that can be include as other tourism for instance perform
pilgrimage and seeking activities that can add the tourist‟s insight
(Ismayanti, 2010).
3. Halal Tourism.
Halal derived from Arabic meaning “permissible” or “lawful” and 70
percent of Muslims follow this term as standard (Ozgen, and Kurt, 2013).
Nowadays halal used in larger scale, unlimited to food and beverages only, but
also reflected and implemented in every aspect in daily life (CSH, 2016).
According to Jefferey, Chairman of World Travel Market define halal
tourism as a type of religious tourism that represents allowable activities under
the Islamic teachings in term of behavior, dress, conduct and diet (as cited in
Battour, Battor and Ismail, 2012).
Actually there is no formal definition of halal tourism, but it accepted
predominantly in muslims‟ world by muslim with leisure purposes. Travel has
an important historical meaning in Islam, in religious term and function
18
(Handerson, 2009), it is exemplified by Prophet Muhammad who travel from
Madinah To Mecca in fathul makkah.
Allah wanted muslim to travel around the world to learn from others,
how disobedience to him should bring people to their damage, the damage
brought by themselves to themselves.
Thus, based on ayat from Qur'an that explained above, Allah
encouraged muslims to travel, to enjoy, muse and consider what God have
created, to do historical, social, and cultural encounters, to adding insight and
knowledge, to know others, learn from diversity, and to do da‟wah (Jafari and
Scott).
Then in the last decade halal tourism emerge as a new opportunity and
alternative to serve tourist in the tourist destination (Al-Hamarneh and Steiner,
2004). This opportunity also can be tools to disseminate of Islamic values,
introducing Islamic culture, increasing economy benefits especially for
muslim community and to affirm muslims‟ self-confidence, belief and identity
in order to face negative thinking and perception when compared to other
lifestyle and culture (Al-Hamarneh, and Steiner 2004) as ordered by Allah to
his servants.
4. Motivation.
To understand both tourists‟ travel behavior and decision making
process in deciding where to travel, motivation is a crucial key (Chen and
Chen, 2015), then important to define motivation in destination or tourism
term. Etymologically motive is derived from the Latin “movere” which means
19
to move (Dann, 1981). According to Murray‟s (1964) motive define as “an
internal factor that arouses, directs, and integrates a person‟s behavior” (as
cited in Chen and Chen 2015). According to Cambridge Advance Learner‟s
Dictionary a motive means “a reason for doing something” and motivation
define as “enthusiasm or the need or reason for doing something”. Motivation
also can be define as the processes that account for an individual intensity,
direction, and persistence of effort toward attaining a goal (Robbins and
Judge, 2013). Another definition of Motivation is derived from motive which
refers to the generic energizer for behavior while motivation refers to
interaction between motive and situation and cognitive in nature (Huang and
Hsu, 2009). Motivation can be define as a psychological condition in which an
individual is oriented towards and tries to achieve a kind of fulfillment (Jang
and Wu, 2006).
Tourist motivation refers to the amalgam of needs and wants which
influence a tendency to undertake traveling (Meng et al, 2006). Traveling
motive is tourist needs which make someone more likely to involve in certain
activity in tourism term (Mehmetoglu, 2011).
In tourism term, most accepted concept of tourist motivation is pull
and push factors due to much review about it (Battour et al, 2010).
20
5. Push and pull factors.
Push and pull factors in examining tourist motivation has been
accepted generally. This indication emerged from many literature review
about push and pull factors of tourist motivation (Uysal and Jurowski, 1994).
Consumers are likely to be pushed to travel by intangible factors and can be
pulled to decide destinations by tangible factors (Kim, 2008)
Crompton (1979) explored motivation in term “socio-psychological
motives” and “cultural motives” which indicated push and pull factor. He
concluded that there were nine factors of socio-psychological motives, and
two factors of cultural motives, influenced tourist decision in selecting a
destination. The factors of socio-psychological were, escape from a perceived
mundane environment, exploration and evaluation of self, relaxation, prestige,
regression, enhancement of kinship relationship, and facilitation of social
interaction. The factors of cultural motives were education and novelty.
Push factors are intrinsic motivators such as the desire for escape, rest,
relaxation, prestige, health and fitness, adventure, and social interaction. Pull
factors are those that emerge as result of the attractiveness of destinations as it
is perceived by those with the propensity to travel (Uysal and Jurowski, 1994).
According to Chen and Chen (2015), the push factors urge and pursue
tourist to travel on the other side pull factors influence tourists‟ decision about
destination. They conclude push factors as motivations and pull factors as
destination attribute.
21
6. Tourist satisfaction.
According to Oliver (2014) satisfaction can be define as judgment that
a product, or a service feature, or the product or service itself, provides a
pleasurable level of comparison-related fulfillment, including levels of under
or over fulfillment.
Satisfaction is the customer evaluation of a product or service in terms
of weather that product or service has met the customer‟s need and
expectations (Zaithmal et al, 2009).
Another definition of satisfaction came from Kotler (2000), he define
that satisfaction is a person‟s feeling of pleasure or disappointment resulting
from comparing a product‟s perceived performance (or outcome) in relation to
his or her expectations.
Purchasing that customers‟ done, does not end the marketers‟ effort in
selling their products. However, dealing with old customer is less expensive
that dealing with a new customer, so, marketers should interest to customer
post purchase behavior to engaging the old customer. Understanding post
purchase behavior of customer is closely related to understand whether
customer satisfied or dissatisfied with the product (Kotler and Armstrong,
2010).
According to Kotler and Amstrong (2010), satisfaction is a key to
building profitable relationship with customers‟ to keeping and growing
consumers and reaping their customer lifetime value. Of course gaining
satisfaction is not an easy work. Satisfaction is when perceived performance
suited or exceeds the customers‟ expectations. If perceived performance
22
cannot reach customers‟ expectation then the result is dissatisfaction.
Customers‟ satisfaction will lead to repeat buying behavior, good word of
mouth, decreasing customers‟ interest to another brands and its advertising
and less interest to purchase other companies‟ product (Kotler and Armstrong,
2010).
According to Meng et al,(2006) there nine theories on customer
satisfaction have been introduced in the literature, are : (1) Expectancy
disconfirmation, (2) assimilation or cognitive dissonance, (3) contrast, (4)
assimilation contrast, (5) Equity, (6) attribution, (7) comparison level, (8)
generalized negativity, (9) and value percept.
Expectancy-Disconfirmation approach basically measures satisfaction
as a degree level. This approach uses contentment of consumption as the
degree level that engage with fulfillment of needs toward a product or service.
Disconfirmation subdivides into three types, first is positive disconfirmation,
this occurs when product or service can exceed customers‟ expectation.
Second is negative disconfirmation happens when a product or service cannot
reach customers‟ expectation. Third is neutral disconfirmation, this happens
when a product or a service can reach the customers‟ expectation but cannot
exceed it (Peter and Olson, 2010).
According to Oliver and Swan (1989) who were interested in equity
theory, customer satisfaction is relationship between the costs that customer
has spent in gaining something, the costs here are such as money, time,
opportunity, efforts and benefits and what he/ she actually gain. In tourism
23
term can be concluded as value that customers received after spending their
time, efforts, benefits, money, and other opportunities. If what they have spent
is equal to what they have gained, that is mean the destination is worthwhile.
The other theory of satisfaction put forward by La Tour and Peat
(1979) is the Comparison Level Theory. They argue that there is more than
one basic determinant as standard to measure satisfaction which use in the
Expectation-Disconfirmation Theory. Then both argue three basic
determinants to measure satisfaction: 1) consumers‟ foregoing experience
towards similar product, 2) expectations produced through situation (those
created after exposed advertising and other promotional tools), 3) reference
group‟s experience. After applying the theory, both found that the experience
from consumers‟ they selves and the experience from reference groups‟ as
well, are the most important standard for comparison in consumer‟s
satisfaction (Yuksel and Yuksel, 2008)
Actually among those nine theories, expectation disconfirmation is the
most accepted theory to measure satisfaction (Peter and Olson, 2010).
7. Destination loyalty.
According to Kotler and Keller (2012) can be define as “a commitment
to repurchase or repatronize a preferred product or service.” Customer loyalty
well known as repeated purchase, positive attitude, long term commitment,
intention of continuing the affiliation, and positive word-of-mouth advertising
(Sramek et al, 2008).
24
According to Meleddu, et al (2015) loyalty subdivide into three main
groups, there are attitudinal loyalty, behavioral loyalty, and composite loyalty.
First definition define that loyalty is about customers‟ attitude toward the
product based on his/her value which received from the past experience and
willing to recommend the product toward his/ her relatives and friends.
Second definition explains loyalty as customer behavior toward the product,
for instance willingness to repurchase.
8. Relationship of Dependent Variables and Independents Variables
a. Relationship of Push and Pull motivation to Tourist Satisfaction
The relationship of motivations and tourist satisfaction and their roles
on determining the successful destination marketing already examine and
explain richly in the literature. Many of the studies and literatures used pull
and push motivations as basic (Battour, et all, 2012).
Well, satisfaction describe as customers‟ evaluation about how
destination fulfill their needs (Sato, et all, 2016) and motivations which
divided into two, pull and push motivations have specific effect on tourist
behavior and lead it to tourist satisfaction (Battour, et all, 2012). Many
researchers strongly agree that pull motivations are tourism attraction which
appropriate with previous literature about tourism attraction can produce
tourist satisfaction. Push motivations are derived from socio-psychological
motives which drive people to travel (Sato, et all, 2016). Push motivations can
be concluded as internal stimulation such as escape, relaxation, and education
(Battour, et all, 2012).
25
Tourism marketers need to enactive the motives behind certain types
of travel behavior including the selection of a destination and the attributes
found in the choice vacation spot (Yoon and Uysal, 2005). Then, it can be
reasoned that tourist satisfaction is related to motivations.
b. Relationship among Push and Pull motivation, Tourist Satisfaction, and
Destination Loyalty.
As well as relationship among satisfaction and motivations, many
researchers‟ who assume that both have significant influence to destination
loyalty have found out the positive relationship between them (Battour, et all,
2012). The destination loyalty has been observed as word of mouth or
recommendation and intention to visit (Meleddu, et all, 2015), similarly with
customer loyalty in context of theoretical (Battour, et all, 2012). Both of them
also already examine by many researcher as outcome of motivations and
tourist satisfaction (Sato, et all, 2016).
Yoon and Uysal (2005) supported that destination loyalty has a causal
relationship with motivation and satisfaction. Um, et all, (2006) also suggest
that revisit intentions is determined by perceived attractiveness, satisfaction,
perceived quality of service, and perceived value for money. They also
conclude that revisits are determined more by perceived attractiveness than by
overall satisfaction (Battour, et all, 2012). Then it can be reasoned that
destination loyalty is associated with motivation and satisfaction.
26
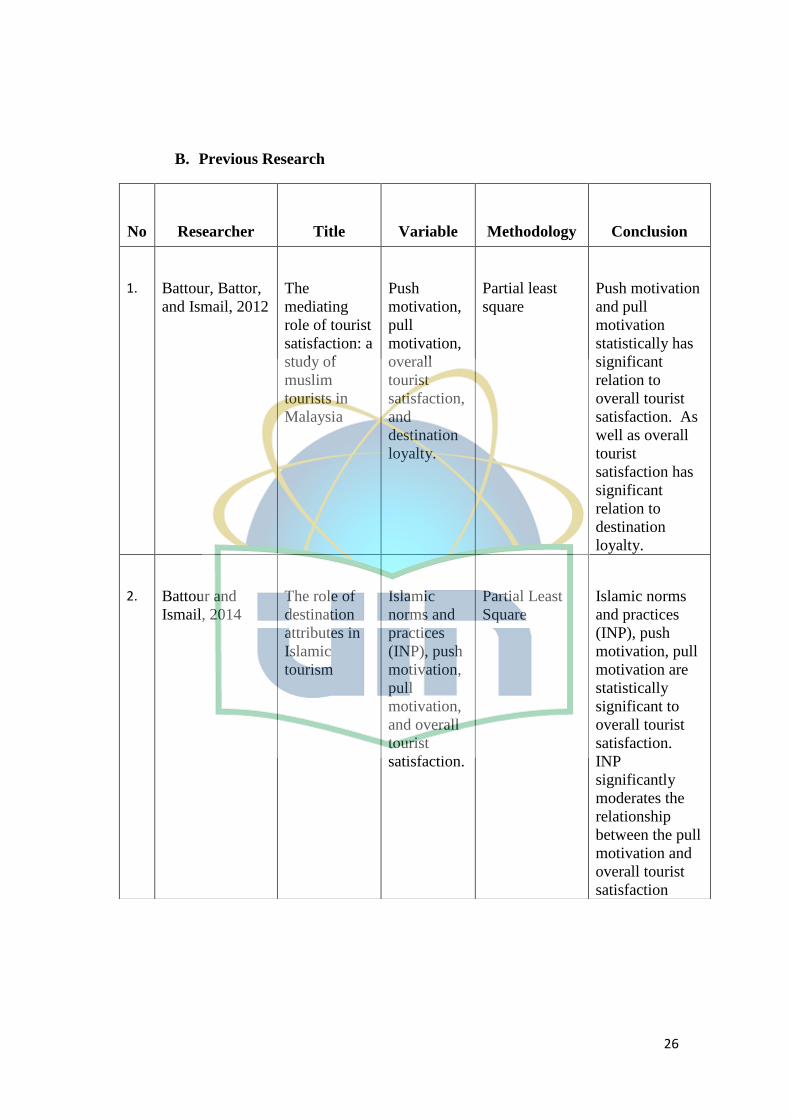
B. Previous Research
No Researcher Title Variable Methodology Conclusion
1. Battour, Battor,
and Ismail, 2012
The
mediating
role of tourist
satisfaction: a
study of
muslim
tourists in
Malaysia
Push
motivation,
pull
motivation,
overall
tourist
satisfaction,
and
destination
loyalty.
Partial least
square
Push motivation
and pull
motivation
statistically has
significant
relation to
overall tourist
satisfaction. As
well as overall
tourist
satisfaction has
significant
relation to
destination
loyalty.
2. Battour and
Ismail, 2014
The role of
destination
attributes in
Islamic
tourism
Islamic
norms and
practices
(INP), push
motivation,
pull
motivation,
and overall
tourist
satisfaction.
Partial Least
Square
Islamic norms
and practices
(INP), push
motivation, pull
motivation are
statistically
significant to
overall tourist
satisfaction.
INP
significantly
moderates the
relationship
between the pull
motivation and
overall tourist
satisfaction

27
3. Li-Ju Chen, and
Wei Peng Chen,
2015
Push-pull
factors in
international
birders‟
travel.
Push factors
as
motivation
and Pull
factors as
destination
attribute
Factors
analysis
The results
show that push
factors that bird-
related are
novelty seeking,
contribution and
sharing, spiritual
refreshment,
relationship
building, and
competition.
The pull factors
that important to
birders are avian
resources,
professional
guides, facilities
and
infrastructure
and local and
traditions.
28
C. Conceptual Frameworks.
Conceptual frameworks can be define as “an argument about why the
topic one wise to study matters, and why the means proposed to study it are
appropriate and rigorous.” (Ravitch and Riggan, 2016). According to Miles et
al (2014) a conceptual framework explains, either graphically or in narrative
form, the main things to be studied- the key factors, variables or constructs
and the presumed interrelationship among them.
Conceptual framework can ease researcher work due to its function as
the researcher‟s map, so the researcher can see the territory that have to be
observe and investigate (Miles, et al, 2014).
29
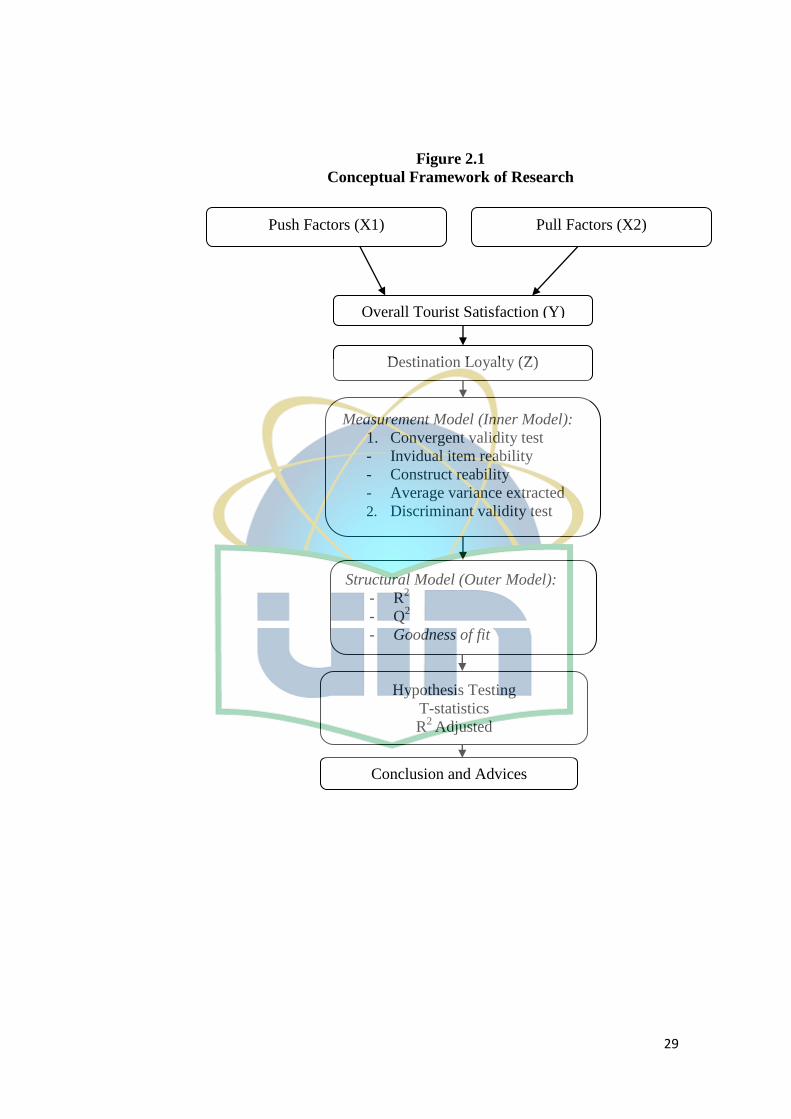
Figure 2.1
Conceptual Framework of Research
Push Factors (X1) Pull Factors (X2)
Overall Tourist Satisfaction (Y)
Destination Loyalty (Z)
Measurement Model (Inner Model):
1. Convergent validity test
- Invidual item reability
- Construct reability
- Average variance extracted
2. Discriminant validity test
Structural Model (Outer Model):
- R2
- Q2
- Goodness of fit
-
Hypothesis Testing
T-statistics
R2
Adjusted
Conclusion and Advices
30
D. Hypothesis.
According to Cooper and Schindler (2006) hypothesis can be define as “a
proposition formulated for empirical testing: a tentative descriptive statement that
describes the relationship between two or more variables.” Other definition of
hypothesis is concept or opinion that formed previously which based on theory of
marketing (Joseph et al, 2003). Hypothesis is assumption or guess that a
researcher or manager makes about some characteristic of the population being
investigated (McDaniel and Gates, 2004).
1. The relationship of push motivation and overall tourist satisfaction.
Ho1: push motivation has significant influence to tourist satisfaction
Ha1: push motivation no significant influence to tourist satisfaction
2. The relationship of pull motivation and overall tourist satisfaction.
Ho2: pull motivation has significant influence to tourist satisfaction
Ha2: pull motivation no significant influence to tourist satisfaction
3. The relationship of pull and push motivation towards tourist satisfaction
Ho3: pull and push motivation simultaneously has significant influence to
tourist satisfaction.
Ha3: pull and push motivation simultaneously has no significant influence to
tourist satisfaction.
4. The relationship of tourist satisfaction and destination loyalty.
Ho4: Tourist satisfaction has significant influence to destination loyalty.
Ha4: Tourist satisfaction no significant influence to destination loyalty.
5. The relationship of pull motivation and destination loyalty.
Ho5: pull motivation has significant influence to destination loyalty.
31
Ha5: pull motivation satisfaction no significant influence to destination loyalty.
6. The relationship of push motivation and destination loyalty.
Ho6: push motivation has significant influence to destination loyalty.
Ha6: push motivation satisfaction no significant influence to destination
loyalty.
7. The relationship of pull and push motivation simultaneously toward
destination loyalty.
Ho7: pull and push motivation simultaneously has significant influence to
destination loyalty.
Ha7: pull and push motivation simultaneously has no significant influence to
destination loyalty.
8. The relationship of pull toward destination loyalty through overall tourist
satisfaction.
Ho8: Pull motivation has significant influence toward destination loyalty
through overall tourist satisfaction.
Ha8: Pull motivation has no significant influence toward destination loyalty
through overall tourist satisfaction.
9. The relationship of push toward destination loyalty through overall tourist
satisfaction.
Ho9: Push motivation has significant influence toward destination loyalty
through overall tourist satisfaction.
Ha9: Push motivation has no significant influence toward destination loyalty
through overall tourist satisfaction
32
CHAPTER III
RESEARCH METHODOLOGY
A. Research Scope
The scope of research is research conducted in Yogyakarta, Central Java. The
period of research is April until Mei 2017. This research will examine the positive
correlation of push and pull motivation toward overall tourist satisfaction and it
correlation to destination loyalty.
a. Sampling Technique.
1. Population.
Population can be define as “the total collection of elements about
which we wish to make some inferences” (Cooper and Schindler, 2006).
According to McDaniel and Gates (2004) population can be define as “the
entire group of people about whom formation is needed; also called universe
or population of interest”. According to Malhotra (2009) that population can
be define as “the aggregate of all elements, sharing some common set of
characteristics, which can comprise the universe for the purpose of the
marketing research problem.”
Population in this research is domestic tourist and muslim in
Yogyakarta, Central Java, Indonesia.
33
2. Sample Technique
Sample is a group of cases, participants, events, or records consisting
portion of the target population, carefully selected to represent the population
(Cooper and Schindler, 2006). According to Malhotra (2009) sample is a
small group in population or small part of the elements of population that
selected to be used as respondent for certain research.
In this research, researcher will use purposive sampling which also
well known as judgmental sampling. Judgmental sampling is one of non
probability sampling which is has similar form of convenience sampling, but
added by researcher judgment to select the population elements (Malhotra,
2009). In this research, questionnaire will be filled by tourists who have both
criteria, muslim and have visited Yogyakarta once at least.
The researcher take 100 samples respondent, because according to
Goodhue, Lewis, and Thompson (2006) that the PLS at sample size 50 still
generated significant results.
b. Collecting Data technique
1. Type of data
Data are information (attitudes, behaviors, motivations, attribute, etc.)
collected from participants or observation (mechanical or direct) or from
secondary sources (Cooper, and Schindler, 2006).
Type of data that researcher used in this research is:
a. Primary data
34
Primary data are data the researcher collects to address the specific
problem at hand- the research questions (Cooper, and Schindler, 2006).
Primary data are data that have not been processed by anyone from any party
for certain purpose (Abdillah and Hartono, 2015). According to Malhotra
(2009) primary data can be define as “data originated by the researcher for
the specific purpose of addressing the research problem.”
The primary data was collected from questionnaire which filled by
respondent who has criteria which has been mentioned before. According to
Cooper and Schindler (2006) questionnaire is an instrument delivered to the
participant via personal or non personal means that is completed by the
participant. Other definition of questionnaire advanced by Malhotra (2009),
he defines questionnaire as “a structured technique for data collection that
consists of a series of questions, written or verbal, that respondent answers.”
The collected data will be process using SmartPLS 3.0
The questionnaire uses likert scale which consists of five level
answers. Likert scale is a variation of summated rating scale asks a rater to
agree or disagree with statements that express either favorable or unfavorable
attitudes toward the object. The strength of attitude is reflected in the
assigned score and individual score may be totaled for an overall attitude
measure (Cooper, and Schindler, 2006). Other definition of likert scale is a
measurement that range from “strongly disagree” to “strongly agree” with
five level degrees, it requires the participant to answers based on degrees that
suited the observed object (Malhotra, 2009).
35
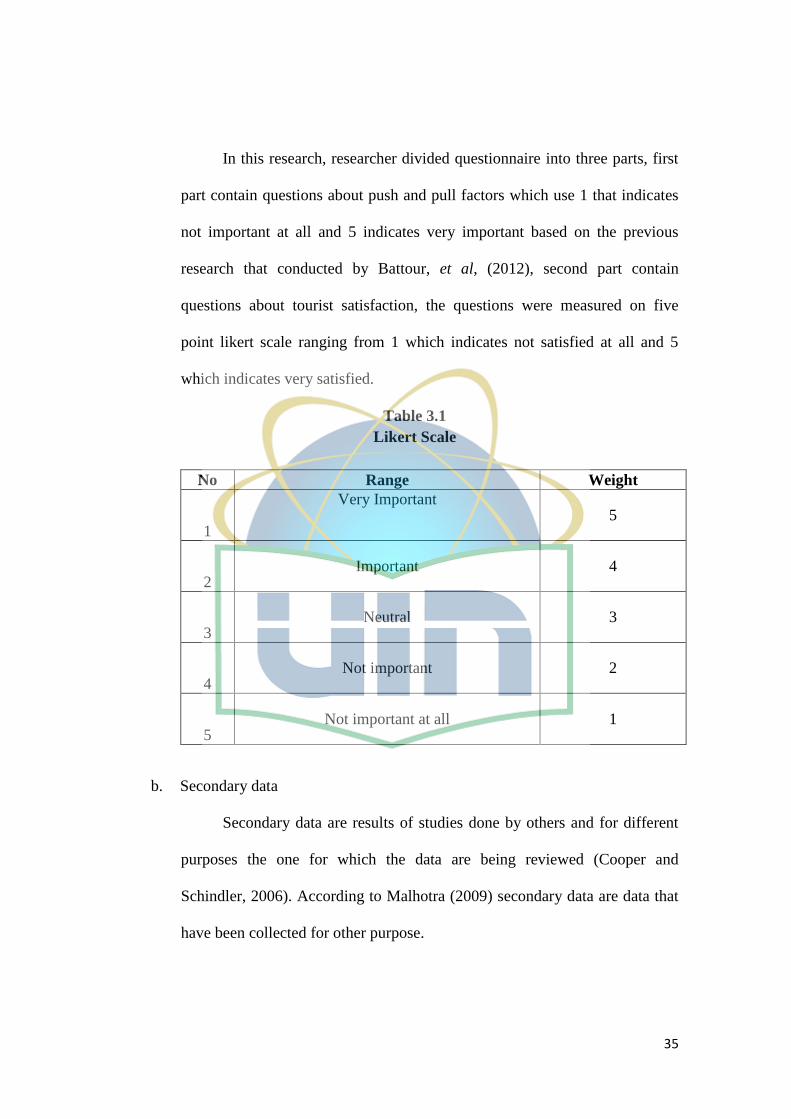
In this research, researcher divided questionnaire into three parts, first
part contain questions about push and pull factors which use 1 that indicates
not important at all and 5 indicates very important based on the previous
research that conducted by Battour, et al, (2012), second part contain
questions about tourist satisfaction, the questions were measured on five
point likert scale ranging from 1 which indicates not satisfied at all and 5
which indicates very satisfied.
Table 3.1
Likert Scale
No Range Weight
1
Very Important 5
2 Important 4
3 Neutral 3
4 Not important 2
5 Not important at all 1
b. Secondary data
Secondary data are results of studies done by others and for different
purposes the one for which the data are being reviewed (Cooper and
Schindler, 2006). According to Malhotra (2009) secondary data are data that
have been collected for other purpose.
36
c. Data Analysis Technique
1. Definition and Basic Concept of PLS.
Partial least square developed by Herman Wold, it is a variant-based
structural equation modeling (Mehmetoglu, 2012). Partial Least Square is a
multi variant technique statistics which can compare among multiple
dependent variables and multiple independent variables (Abdillah and
Hartono, 2015). PLS can also be regarded as powerful analysis method which
can be used in every scale of data such as nominal, ordinal, interval, and
ratio, with flexible requirement of assumption (Yamin and Kurniawan, 2011),
PLS developed by Herman Wold at the end of 1960s for econometrics which
previously used in chemistry for analytic study , Physics, and clinical
chemistry (Abdillah and Hartono, 2015). PLS-PM also known as a soft
modeling approach due to there is no strict assumption such as sample size,
the measurement scale and distributions (Vinzi et al, 2010).
The main purpose of Partial Least Square method is to predict the
relationship of variable X toward variable Y and explain the relationship
between them based on the theory. PLS is regression method analysis which
can be used to identify factor that is combination of variable X as predictor
and variable Y as respond variable (Abdillah and Hartono, 2015).
According to Yamin and Kurniawan (2011) PLS can be used to predict
existence of relationship among variables and then proportion to observation.
The other main purpose of PLS is to explain the relationship among
constructs and emphasize the value of it.
37
Here are some predominance of partial least square:
a. Be able to modeling multiple independent variables and multiple
dependent variables (complex model).
b. Be able to manage multicollinearity among independent variables.
c. Results remained robust although there are data that are not normal and
missing.
d. Be able to produce independent latent variable directly based on cross
product which involve dependent latent variable as prediction power.
e. Be able to be used for reflective construct and formative construct.
f. Be able to be used with small sample size.
g. Not requires normal distribution data.
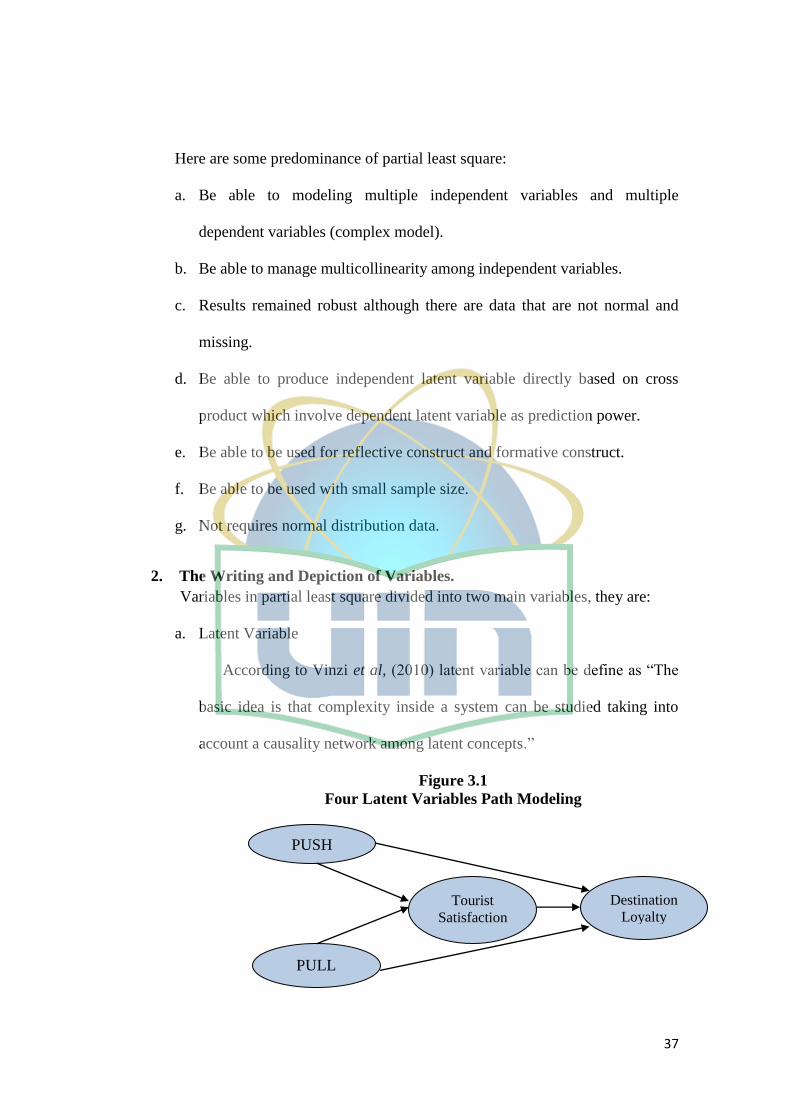
2. The Writing and Depiction of Variables.
Variables in partial least square divided into two main variables, they are:
a. Latent Variable
According to Vinzi et al, (2010) latent variable can be define as “The
basic idea is that complexity inside a system can be studied taking into
account a causality network among latent concepts.”
Figure 3.1
Four Latent Variables Path Modeling
PUSH
PULL
Tourist
Satisfaction
Destination
Loyalty
38
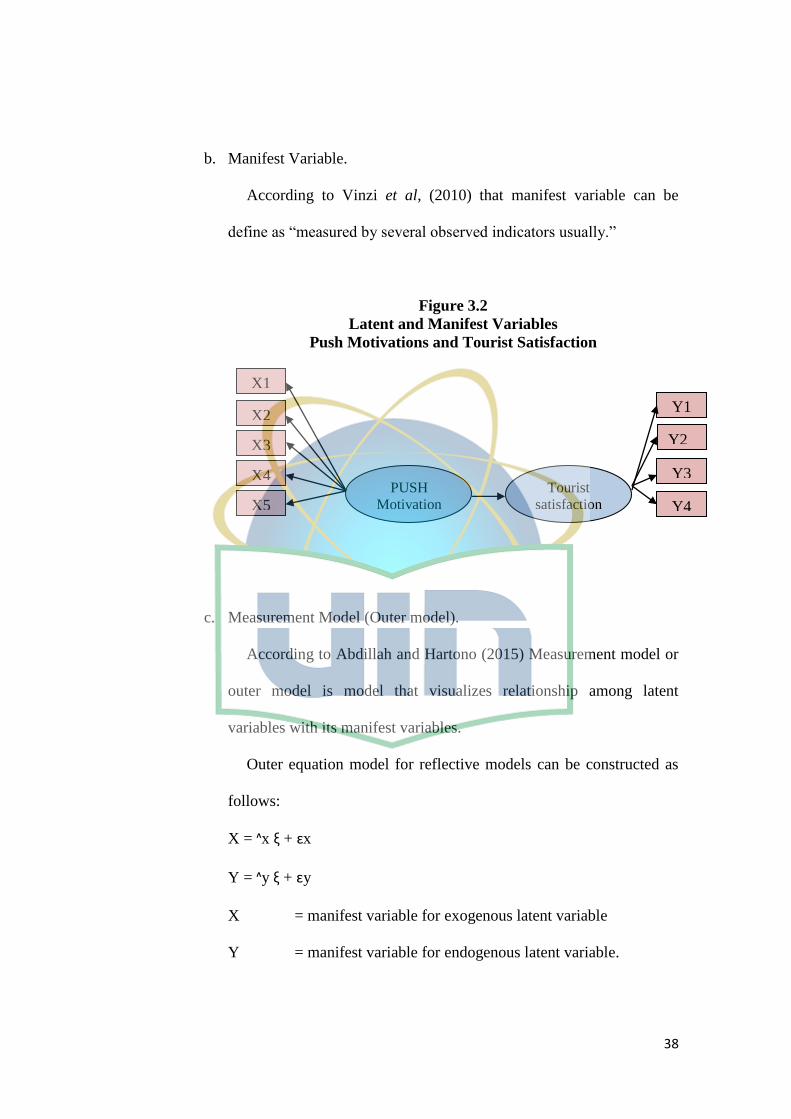
b. Manifest Variable.
According to Vinzi et al, (2010) that manifest variable can be
define as “measured by several observed indicators usually.”
Figure 3.2
Latent and Manifest Variables
Push Motivations and Tourist Satisfaction
c. Measurement Model (Outer model).
According to Abdillah and Hartono (2015) Measurement model or
outer model is model that visualizes relationship among latent
variables with its manifest variables.
Outer equation model for reflective models can be constructed as
follows:
X = ᶺx ξ + ԑx
Y = ᶺy ξ + ԑy
X = manifest variable for exogenous latent variable
Y = manifest variable for endogenous latent variable.
PUSH
Motivation
Tourist
satisfaction
X1
Y4
Y3
Y2
Y1 X2
X3
X4
X5
39
ᶺx, ᶺy = loading matrix that describe coefficient of regression that
linked to latent variable to its indicators.
ԑx, ԑy = measurement error.
Outer equation model for formative models can be constructed as
follows:
ξ = Πξx + δx
ε = Πεy + δy
ξ, η, x, y = indicator for independent variable.
Πx, Πy = coefficient multiple regression from latent variable and
block indicator.
δx, δy = residual error
According to Hussein (2015) there several tests have to be done to
measure the measurement model. The tests are follows:
Convergent Validity: The value of convergent validity is the value
of loading factor in the latent variable with its indicators. Expected
value> 0.7.Structural Model (Inner model)
Discriminant Validity. This value is a value of cross loading factor
that is useful to determine whether the construct has an adequate
discriminant that is by comparing the loading value on the intended
construct must be greater than the loading value with other constructs,
but according to Abdillah and Hartono (2015) that cross loading
factor >0.7 in one variable is still can be said accepted.
40
Composite Reliability. Data that has composite reliability> 0.7 has
high reliability.
Average Variance Extracted (AVE). Expected value of AVE is
>0.5
Cronbach Alpha. Reability test is strengthen by Cronbach‟s Alpha
Value, the expected value of cronbach‟s alpha is >0.6
Structural model or known as inner model in PLS is structure that
visualize interrelationship among latent variables that build based on
theories (Abdillah and Hartono, 2015).
Inner equation model models can be constructed as follows :
ε = β0 + β ε | + Гξ + δ
ε = Vektor independen variable
δ = unexplained variance.
The form of causal chain system equation can be arranged as follows:
ε = ∑ |βji εi + ∑i γji ξi + ζj
βji, γji = Path coefficient that connects independent variable.
ζ = residual error.
According to Yamin and Kurniawan (2011) to measure structural
model there steps have to be done by researcher. First, analyzing
specific relation among constructs, this can be evaluated from the
result of path coefficient. The next step is measuring coefficient
determination (R2), then measuring Q
2 predictive relevance which has
41
function to validate ability of prediction model, when the result of Q2
is bigger than 0 then it shown the goodness of exogenous as predictor
variable be able to explain endogenous variable.
According to Hussein (2015) the formula to measure Q2 is below:
Q2 = 1- (1-R12)(1-R2
2)
After measuring Q2, the next step is measuring Goodness of Fit
(GoF) which has function to validate the mixture performance of
inner model and outer model.
Goodness of Fit can be calculated by the formula below:
√
= Average Communalities
= Average of R
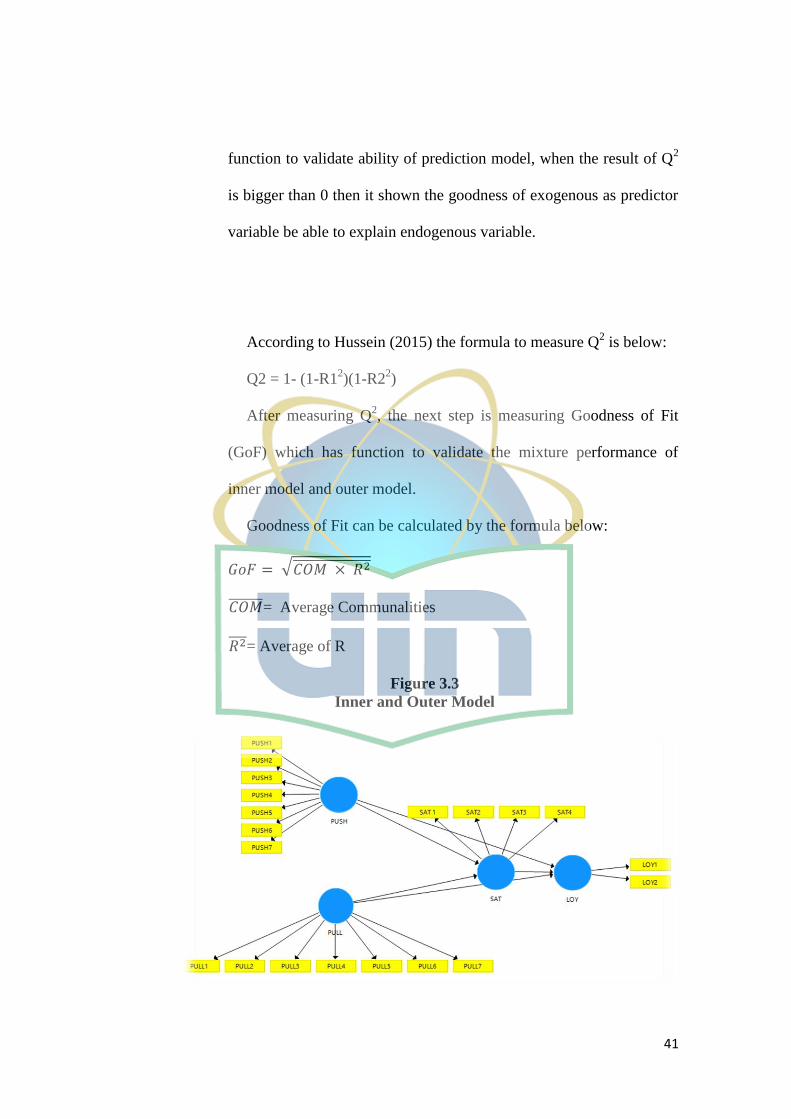
Figure 3.3
Inner and Outer Model
42
3. General Approach of PLS
According to Vinzi et al (Structural model of partial least square can be
written as:
ξj = β0j + ∑ βqj ξq + δj
q: ξq → ξj
ξ = Endogenous Latent Variable
β = Path coefficient
j can be 1 and so on, actually number of endogenous variable, q can be
1 and so on, actually number of endogenous variable. Β is path coefficient
which interrelate q-th as exogenous variable and j-th as endogenous variable.
Where δ is error of inner model.
4. Stages of PLS.
Steps that used to analyze a research with partial least square are
seven, they are:
Step one is devise structural model or inner model. In this step,
researcher formulates the relationship model among constructs. Concept of
construct has to be obvious and easy to define.
Step two is defining measurement model or outer model. In this phase,
researcher defines and specifies the relationship among latent variables and
its manifest variables (Yamin and Kurniawan, 2011). Measurement types
subdivide into three, reflective model or outwards directed model, formative
43
model or inwards directed model and MIMIC model or an amalgam of two
previous models (Vinzi et al, 2010) This phase is very important.
a. Reflective model is where indicator as manifestation of construct
(Yamin and Kurniawan, 2011).
b. Formative variable, indicator define characteristic of construct, so
relationship path direct from indicators to construct (Yamin and
Kurniawan, 2011).
c. MIMIC model.
MIMIC model is mixture of two previous models.
Step three, creating the diagram path. The main function of creating
diagram path is to visualize the relationship among latent variables and
manifest variables. This step also will ease the researcher to see the whole
model of variables. Generally, latent variable in PLS subdivide into two:
a. Exogenous latent variable.
Exogenous latent variable same as independent variable or
predictor variable in regression that researchers knew generally. This
variable is variable which explain endogenous variable (Yamin and
Kurniawan, 2011).
b. Endogenous latent variable.
Endogenous latent variable is variable which is explained by
exogenous variable. This variable has same function as dependent
variable in regression (Yamin and Kurniawan, 2011).
Step four, converting the path of diagram to the systems of equations.
44
Step five, estimation model. In this step, there are three weighting
schemes in the proses of estimation model.
Step six, evaluation of model. Evaluation of model including
evaluation of measurement model and structural model.
Step seven, interpretation model. This Interpretation based on the result
of model that build by researcher (Yamin and Kurniwan 2011).
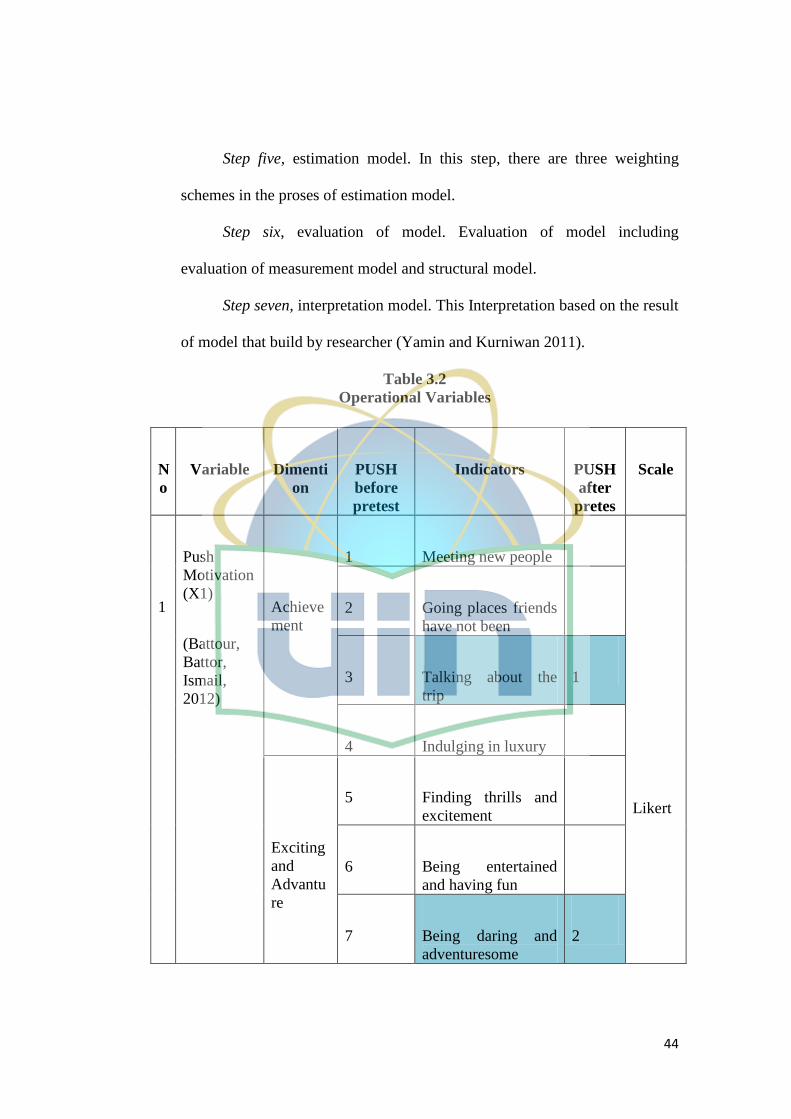
Table 3.2
Operational Variables
N
o
Variable Dimenti
on
PUSH
before
pretest
Indicators PUSH
after
pretes
Scale
1
Push
Motivation
(X1)
(Battour,
Battor,
Ismail,
2012)
Achieve
ment
1 Meeting new people
Likert
2 Going places friends
have not been
3 Talking about the
trip
1
4 Indulging in luxury
Exciting
and
Advantu
re
5 Finding thrills and
excitement
6 Being entertained
and having fun
7 Being daring and
adventuresome
2
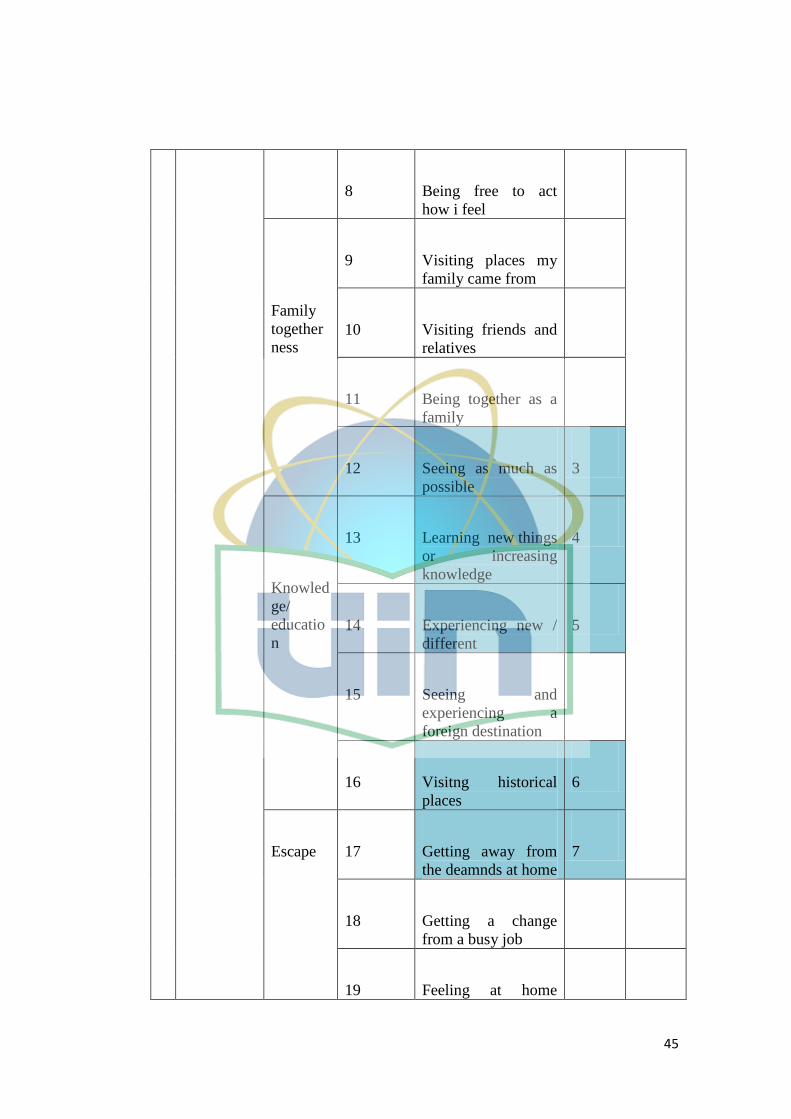
45
8 Being free to act
how i feel
Family
together
ness
9 Visiting places my
family came from
10 Visiting friends and
relatives
11 Being together as a
family
12 Seeing as much as
possible
3
Knowled
ge/
educatio
n
13 Learning new things
or increasing
knowledge
4
14 Experiencing new /
different
5
15 Seeing and
experiencing a
foreign destination
16 Visitng historical
places
6
Escape 17 Getting away from
the deamnds at home
7
18 Getting a change
from a busy job
19 Feeling at home
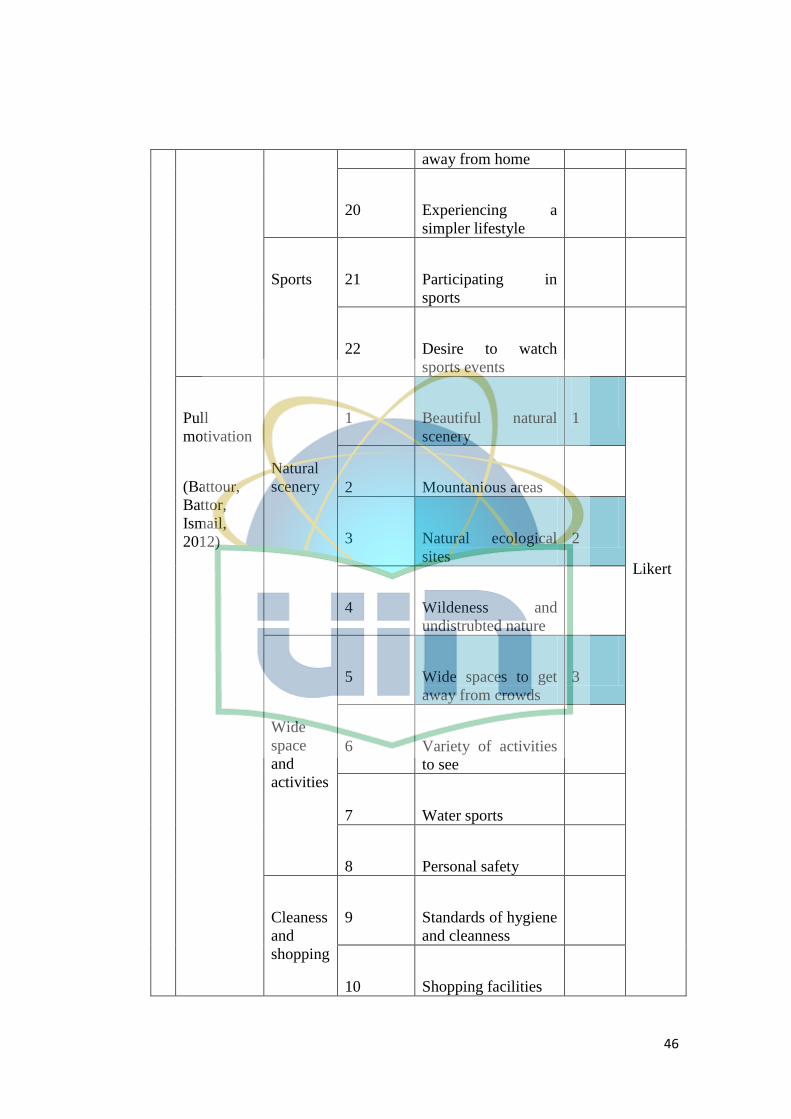
46
away from home
20 Experiencing a
simpler lifestyle
Sports 21 Participating in
sports
22 Desire to watch
sports events
Pull
motivation
(Battour,
Battor,
Ismail,
2012)
Natural
scenery
1 Beautiful natural
scenery
1
Likert
2 Mountanious areas
3 Natural ecological
sites
2
4 Wildeness and
undistrubted nature
Wide
space
and
activities
5 Wide spaces to get
away from crowds
3
6 Variety of activities
to see
7 Water sports
8 Personal safety
Cleaness
and
shopping
9 Standards of hygiene
and cleanness
10 Shopping facilities
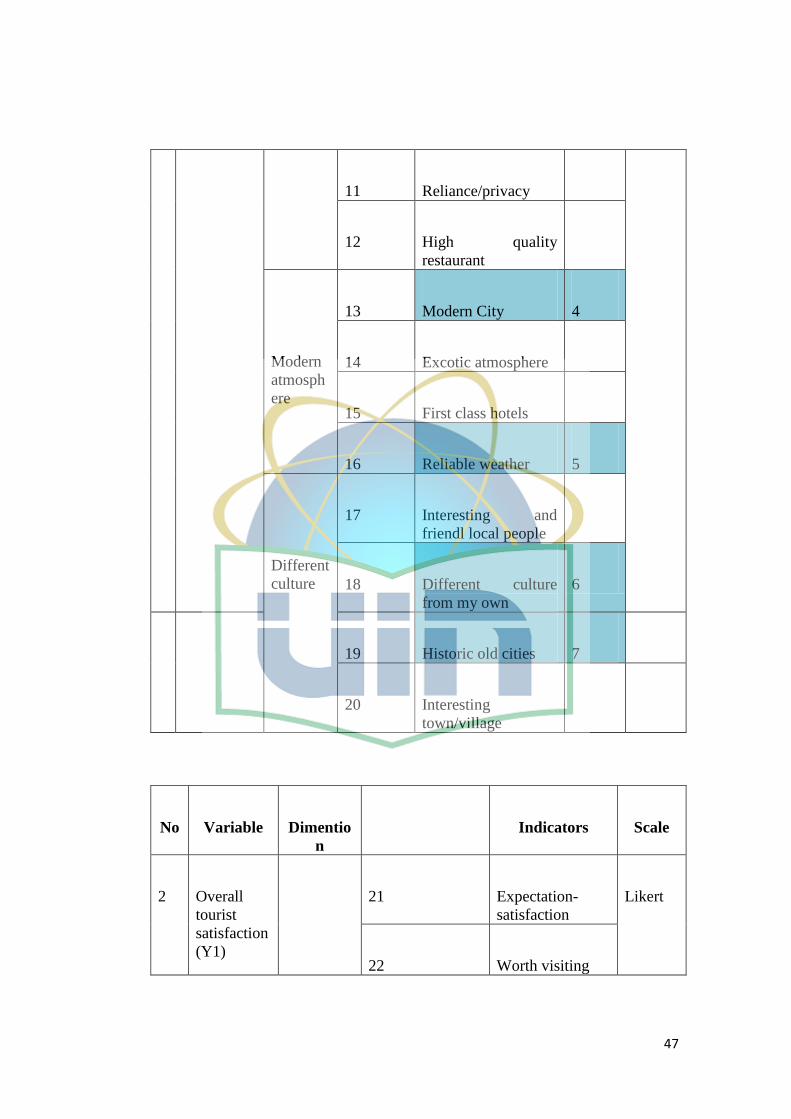
47
11 Reliance/privacy
12 High quality
restaurant
Modern
atmosph
ere
13 Modern City 4
14 Excotic atmosphere
15 First class hotels
16 Reliable weather 5
Different
culture
17 Interesting and
friendl local people
18 Different culture
from my own
6
19 Historic old cities 7
20 Interesting
town/village
No Variable Dimentio
n
Indicators Scale
2 Overall
tourist
satisfaction
(Y1)
21 Expectation-
satisfaction
Likert
22 Worth visiting
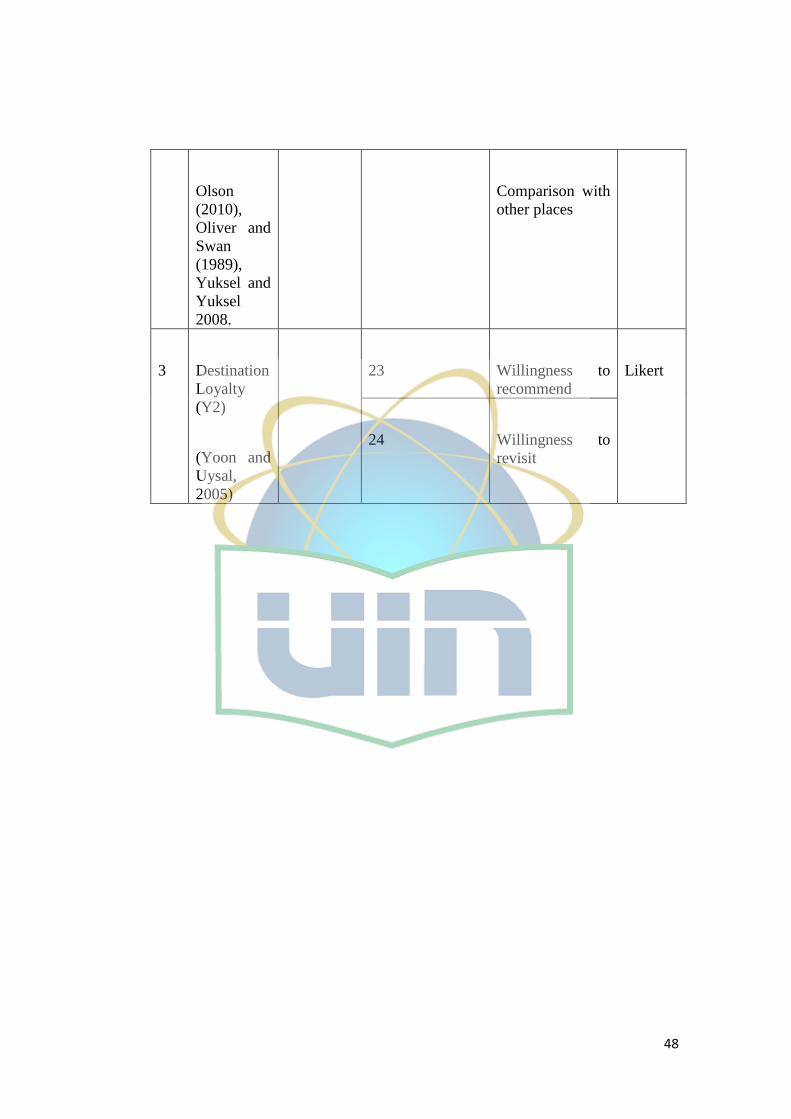
48
Olson
(2010),
Oliver and
Swan
(1989),
Yuksel and
Yuksel
2008.
Comparison with
other places
3 Destination
Loyalty
(Y2)
(Yoon and
Uysal,
2005)
23 Willingness to
recommend
Likert
24 Willingness to
revisit
49
CHAPTER IV
ANALYSIS AND DISCUSSION
A. Analysis and Discussion.
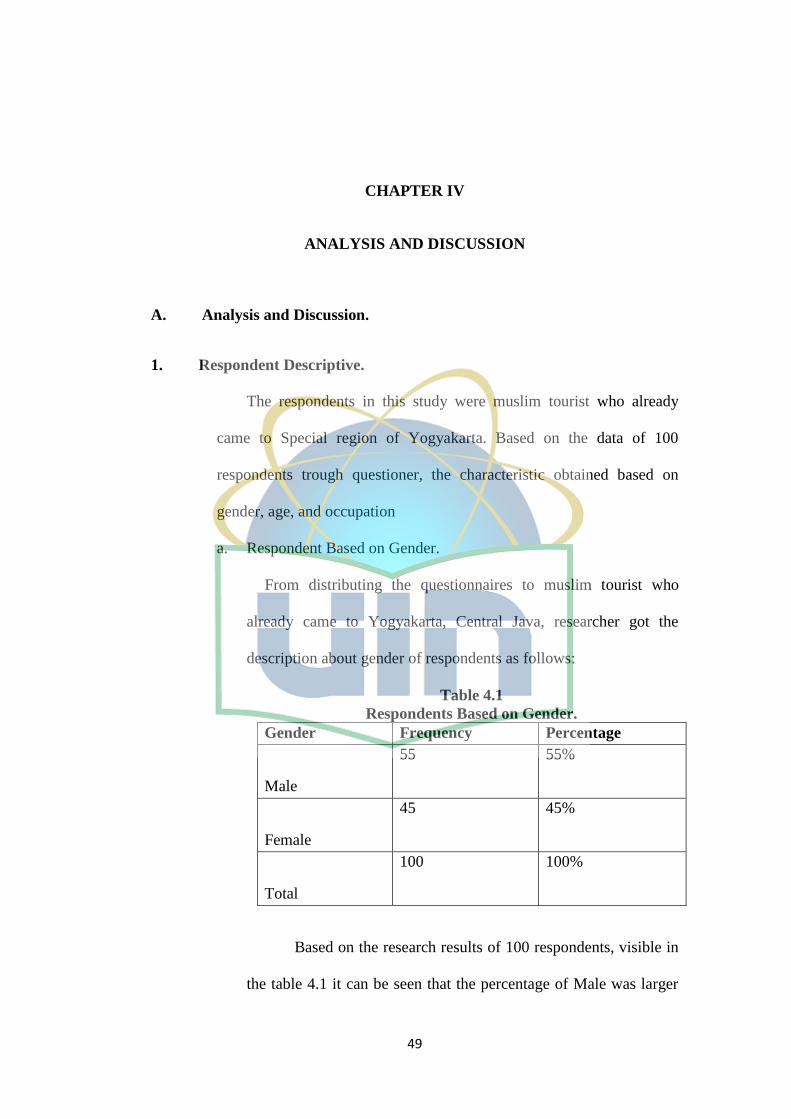
1. Respondent Descriptive.
The respondents in this study were muslim tourist who already
came to Special region of Yogyakarta. Based on the data of 100
respondents trough questioner, the characteristic obtained based on
gender, age, and occupation
a. Respondent Based on Gender.
From distributing the questionnaires to muslim tourist who
already came to Yogyakarta, Central Java, researcher got the
description about gender of respondents as follows:
Table 4.1
Respondents Based on Gender.
Gender Frequency Percentage
Male
55 55%
Female
45 45%
Total
100 100%
Based on the research results of 100 respondents, visible in
the table 4.1 it can be seen that the percentage of Male was larger
50
than female respondents. 55 respondents (55%) were male and 45
respondents (45%) were female from the results of gender
respondents.
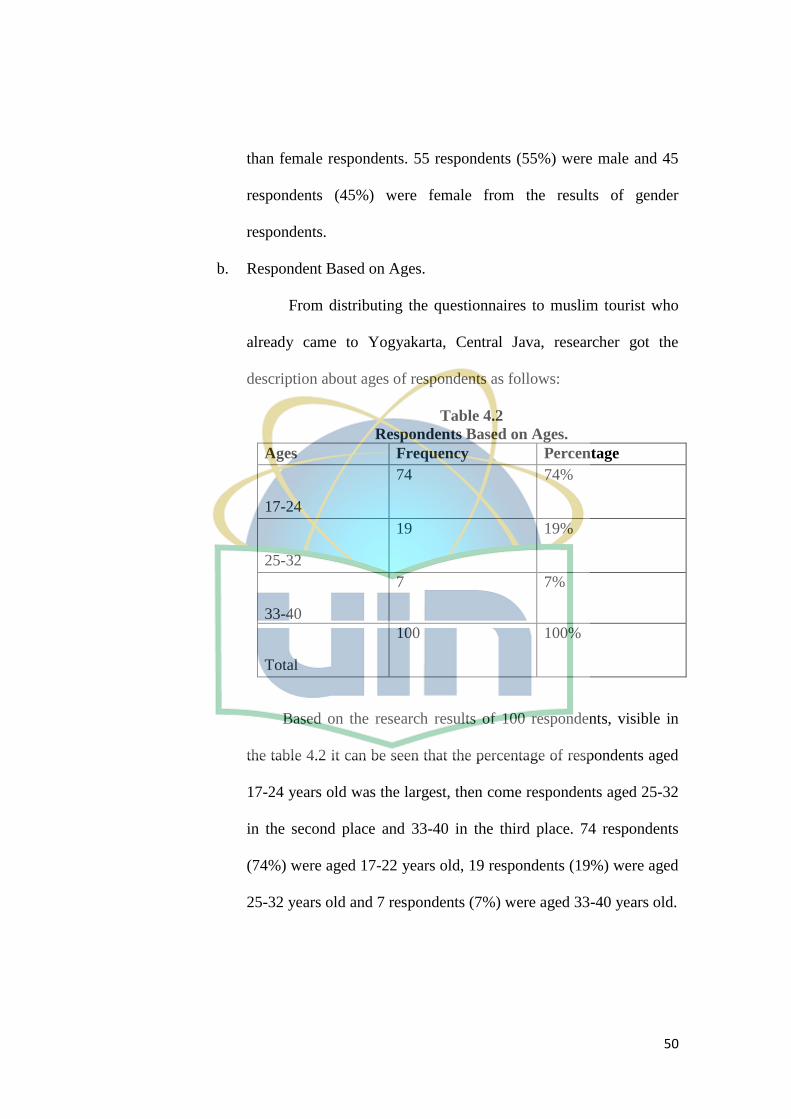
b. Respondent Based on Ages.
From distributing the questionnaires to muslim tourist who
already came to Yogyakarta, Central Java, researcher got the
description about ages of respondents as follows:
Table 4.2
Respondents Based on Ages.
Ages Frequency Percentage
17-24
74 74%
25-32
19 19%
33-40
7 7%
Total
100 100%
Based on the research results of 100 respondents, visible in
the table 4.2 it can be seen that the percentage of respondents aged
17-24 years old was the largest, then come respondents aged 25-32
in the second place and 33-40 in the third place. 74 respondents
(74%) were aged 17-22 years old, 19 respondents (19%) were aged
25-32 years old and 7 respondents (7%) were aged 33-40 years old.
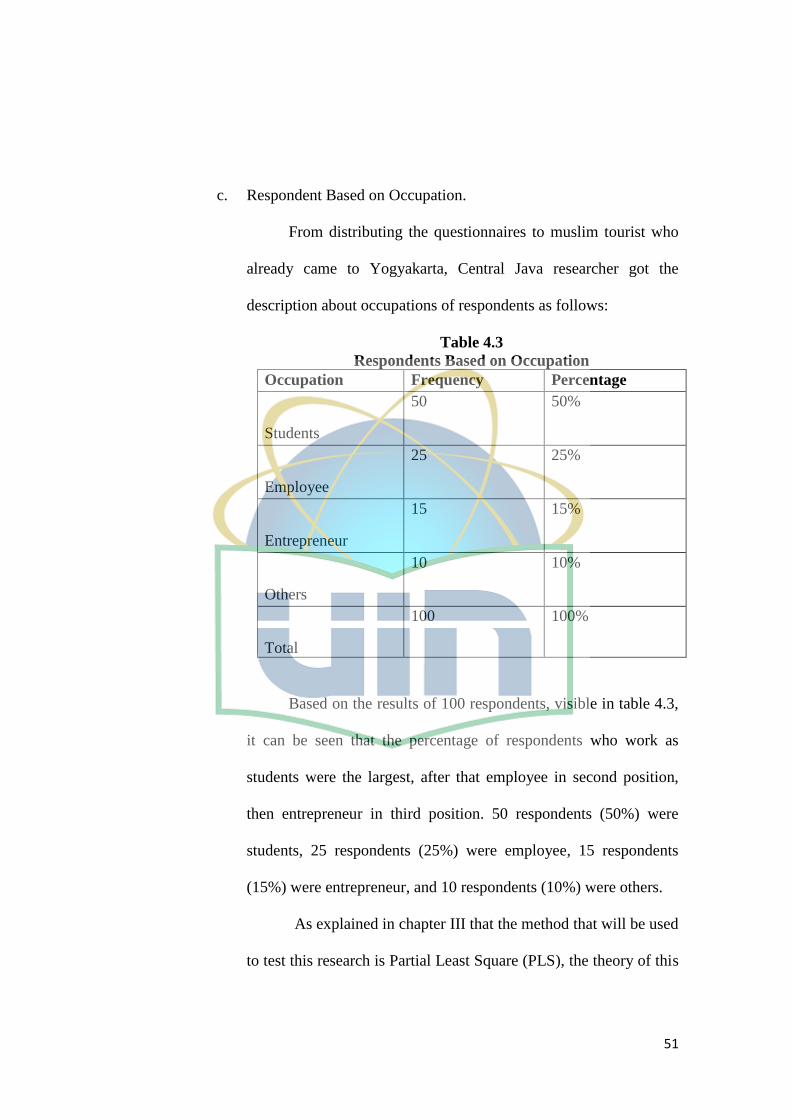
51
c. Respondent Based on Occupation.
From distributing the questionnaires to muslim tourist who
already came to Yogyakarta, Central Java researcher got the
description about occupations of respondents as follows:
Table 4.3
Respondents Based on Occupation
Occupation Frequency Percentage
Students
50 50%
Employee
25 25%
Entrepreneur
15 15%
Others
10 10%
Total
100 100%
Based on the results of 100 respondents, visible in table 4.3,
it can be seen that the percentage of respondents who work as
students were the largest, after that employee in second position,
then entrepreneur in third position. 50 respondents (50%) were
students, 25 respondents (25%) were employee, 15 respondents
(15%) were entrepreneur, and 10 respondents (10%) were others.
As explained in chapter III that the method that will be used
to test this research is Partial Least Square (PLS), the theory of this
52
method already explained in chapter III. In Partial Least Square
there some stages have to be done by the researcher which every
step has it owns purpose. The stages are:
2. Evaluation of Measurement Model (Outer Model).
Analysis of measurement model subdivides itu two: Convergent
Validity and Dicscriminant Validity. The purpose of analysis of measurement
model or outer model is to measure the correlation of latent variable and its
indicators.
a. Convergent validity.
Convergent validity evaluation process divided into three parts.
First, Evaluation of individual item reliability, it can be seen from the
result of standardized loading factor. The loading factor value must be
greater than 0.7 to be said to be ideal. It means that the indicators are
said to be valid as indicators that measure the constructs (Yamin and
Kurniawan, 2011).
(Information: LOY = Destination Loyalty, SAT = Tourist
Satisfaction, PUSH = Push Motivation, PULL = Pull Motivation.)
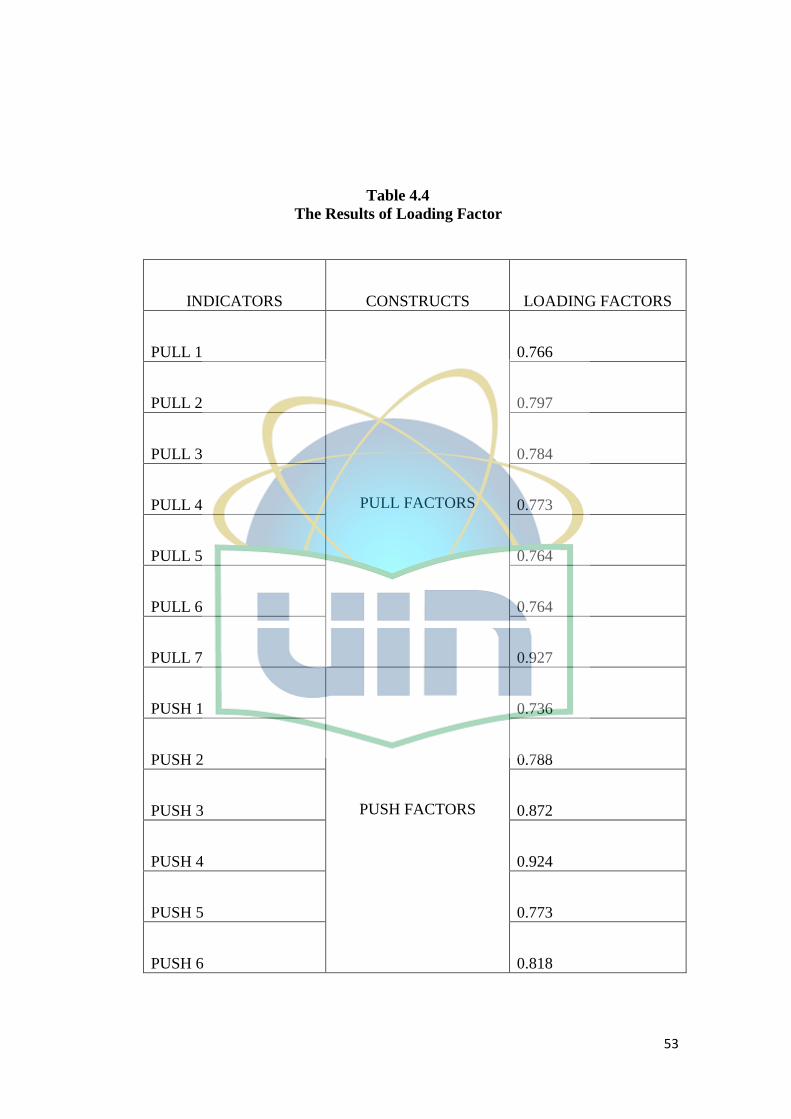
53
Table 4.4
The Results of Loading Factor
INDICATORS CONSTRUCTS LOADING FACTORS
PULL 1
PULL FACTORS
0.766
PULL 2 0.797
PULL 3 0.784
PULL 4 0.773
PULL 5 0.764
PULL 6 0.764
PULL 7 0.927
PUSH 1
PUSH FACTORS
0.736
PUSH 2 0.788
PUSH 3 0.872
PUSH 4 0.924
PUSH 5 0.773
PUSH 6 0.818
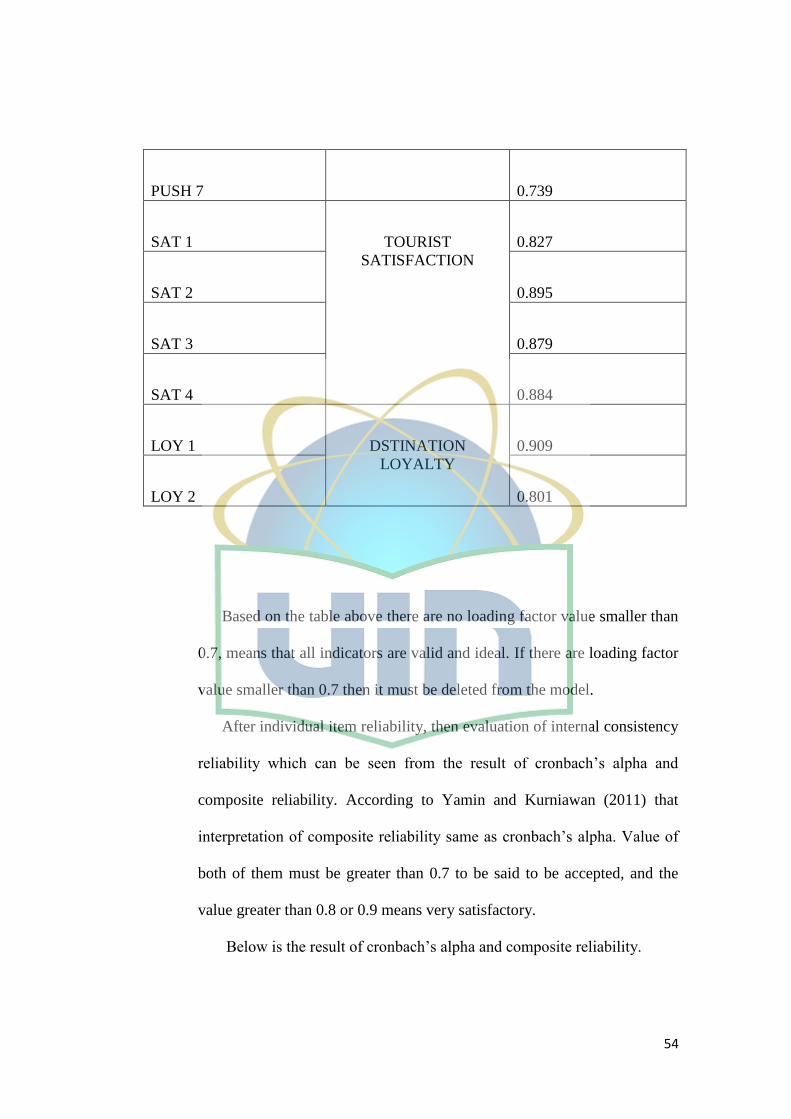
54
PUSH 7 0.739
SAT 1 TOURIST
SATISFACTION
0.827
SAT 2 0.895
SAT 3 0.879
SAT 4 0.884
LOY 1 DSTINATION
LOYALTY
0.909
LOY 2 0.801
Based on the table above there are no loading factor value smaller than
0.7, means that all indicators are valid and ideal. If there are loading factor
value smaller than 0.7 then it must be deleted from the model.
After individual item reliability, then evaluation of internal consistency
reliability which can be seen from the result of cronbach‟s alpha and
composite reliability. According to Yamin and Kurniawan (2011) that
interpretation of composite reliability same as cronbach‟s alpha. Value of
both of them must be greater than 0.7 to be said to be accepted, and the
value greater than 0.8 or 0.9 means very satisfactory.
Below is the result of cronbach‟s alpha and composite reliability.
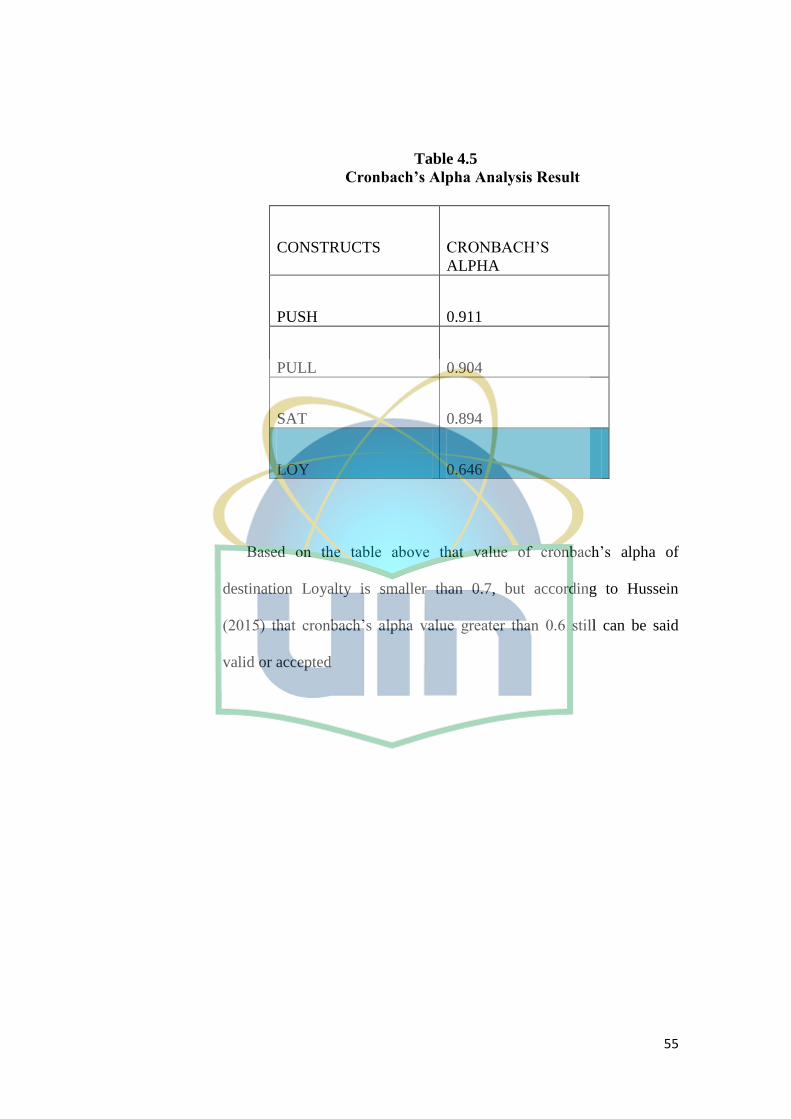
55
Table 4.5
Cronbach’s Alpha Analysis Result
Based on the table above that value of cronbach‟s alpha of
destination Loyalty is smaller than 0.7, but according to Hussein
(2015) that cronbach‟s alpha value greater than 0.6 still can be said
valid or accepted
CONSTRUCTS CRONBACH‟S
ALPHA
PUSH 0.911
PULL 0.904
SAT 0.894
LOY 0.646
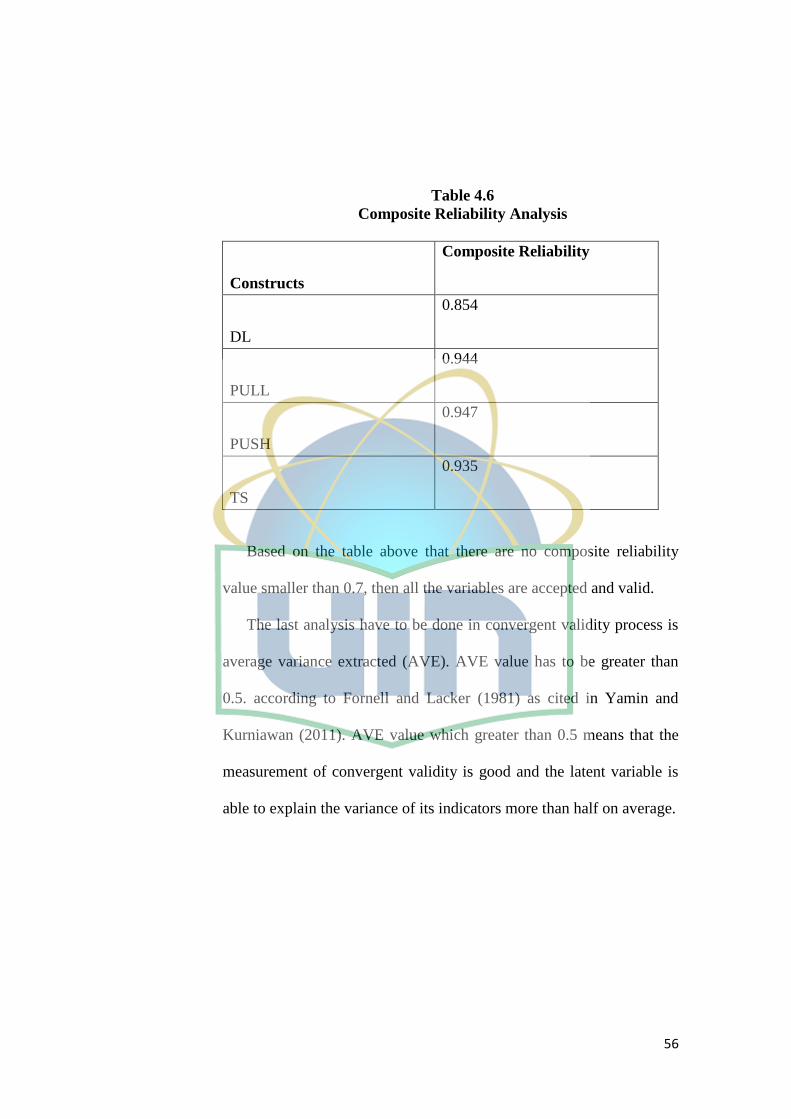
56
Table 4.6
Composite Reliability Analysis
Constructs
Composite Reliability
DL
0.854
PULL
0.944
PUSH
0.947
TS
0.935
Based on the table above that there are no composite reliability
value smaller than 0.7, then all the variables are accepted and valid.
The last analysis have to be done in convergent validity process is
average variance extracted (AVE). AVE value has to be greater than
0.5. according to Fornell and Lacker (1981) as cited in Yamin and
Kurniawan (2011). AVE value which greater than 0.5 means that the
measurement of convergent validity is good and the latent variable is
able to explain the variance of its indicators more than half on average.
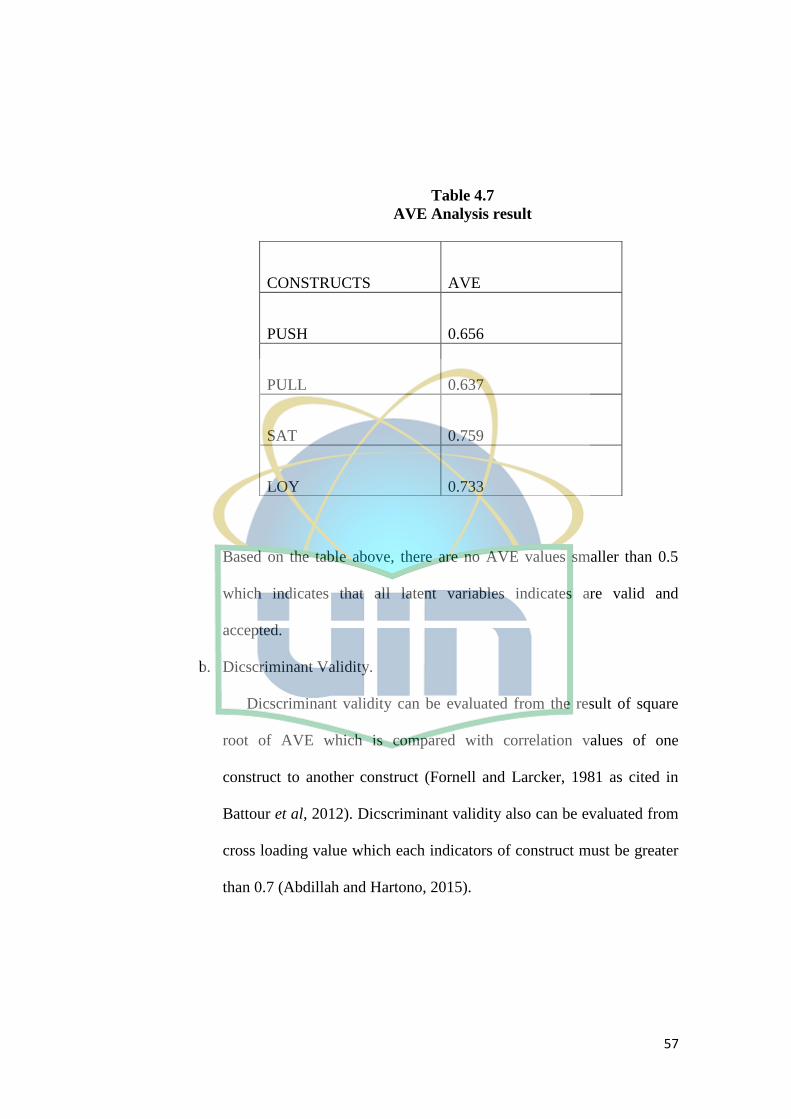
57
Table 4.7
AVE Analysis result
Based on the table above, there are no AVE values smaller than 0.5
which indicates that all latent variables indicates are valid and
accepted.
b. Dicscriminant Validity.
Dicscriminant validity can be evaluated from the result of square
root of AVE which is compared with correlation values of one
construct to another construct (Fornell and Larcker, 1981 as cited in
Battour et al, 2012). Dicscriminant validity also can be evaluated from
cross loading value which each indicators of construct must be greater
than 0.7 (Abdillah and Hartono, 2015).
CONSTRUCTS AVE
PUSH 0.656
PULL 0.637
SAT 0.759
LOY 0.733
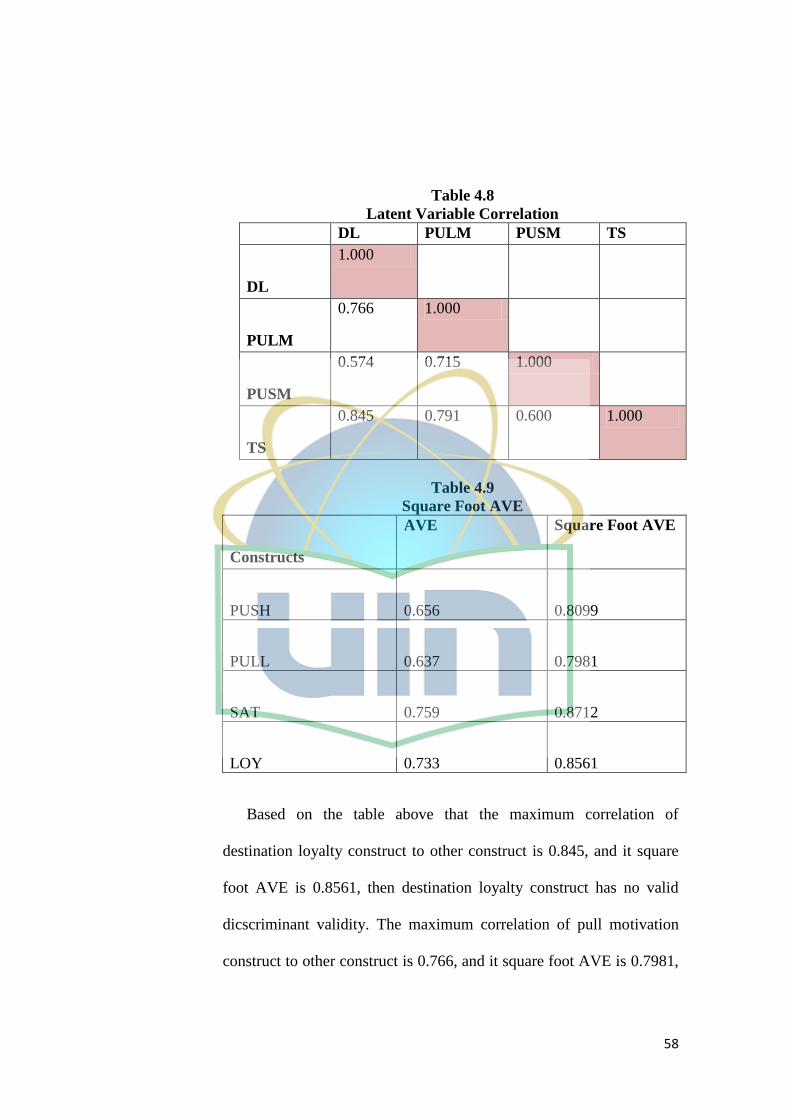
58
Table 4.8
Latent Variable Correlation
DL PULM PUSM TS
DL
1.000
PULM
0.766 1.000
PUSM
0.574 0.715 1.000
TS
0.845 0.791 0.600 1.000
Table 4.9
Square Foot AVE
Constructs
AVE Square Foot AVE
PUSH 0.656 0.8099
PULL 0.637 0.7981
SAT 0.759 0.8712
LOY 0.733 0.8561
Based on the table above that the maximum correlation of
destination loyalty construct to other construct is 0.845, and it square
foot AVE is 0.8561, then destination loyalty construct has no valid
dicscriminant validity. The maximum correlation of pull motivation
construct to other construct is 0.766, and it square foot AVE is 0.7981,
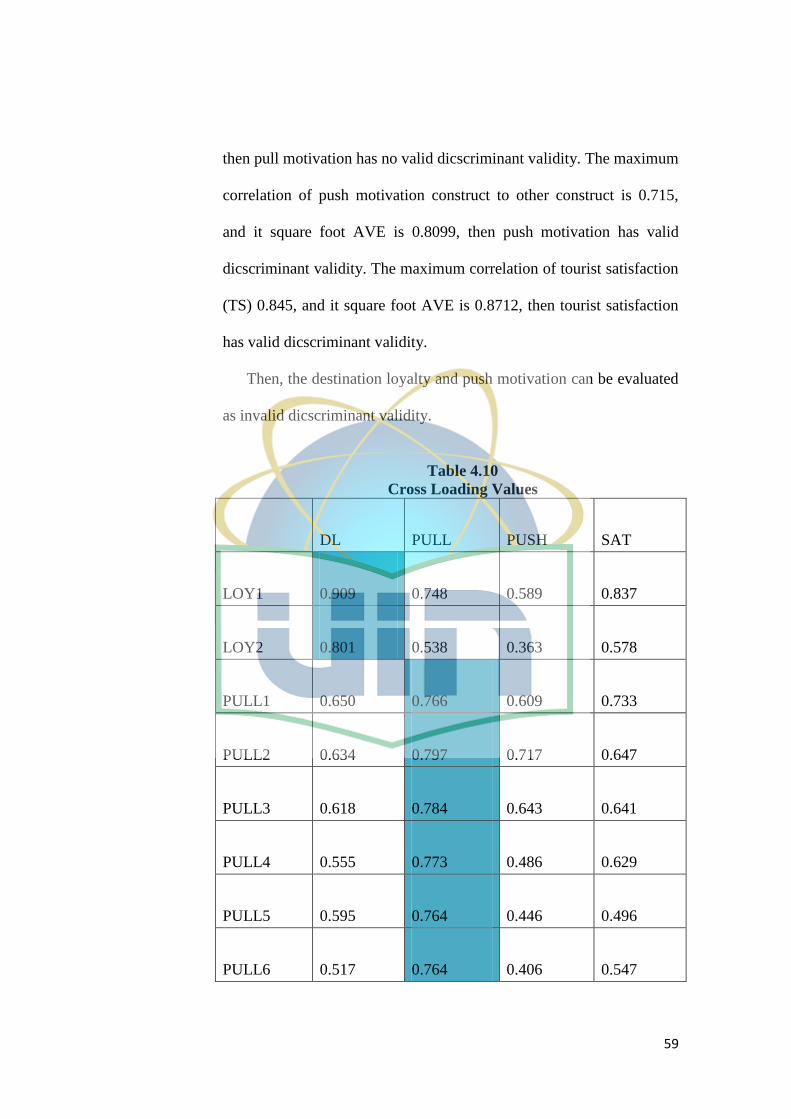
59
then pull motivation has no valid dicscriminant validity. The maximum
correlation of push motivation construct to other construct is 0.715,
and it square foot AVE is 0.8099, then push motivation has valid
dicscriminant validity. The maximum correlation of tourist satisfaction
(TS) 0.845, and it square foot AVE is 0.8712, then tourist satisfaction
has valid dicscriminant validity.
Then, the destination loyalty and push motivation can be evaluated
as invalid dicscriminant validity.
Table 4.10
Cross Loading Values
DL PULL PUSH SAT
LOY1 0.909 0.748 0.589 0.837
LOY2 0.801 0.538 0.363 0.578
PULL1 0.650 0.766 0.609 0.733
PULL2 0.634 0.797 0.717 0.647
PULL3 0.618 0.784 0.643 0.641
PULL4 0.555 0.773 0.486 0.629
PULL5 0.595 0.764 0.446 0.496
PULL6 0.517 0.764 0.406 0.547
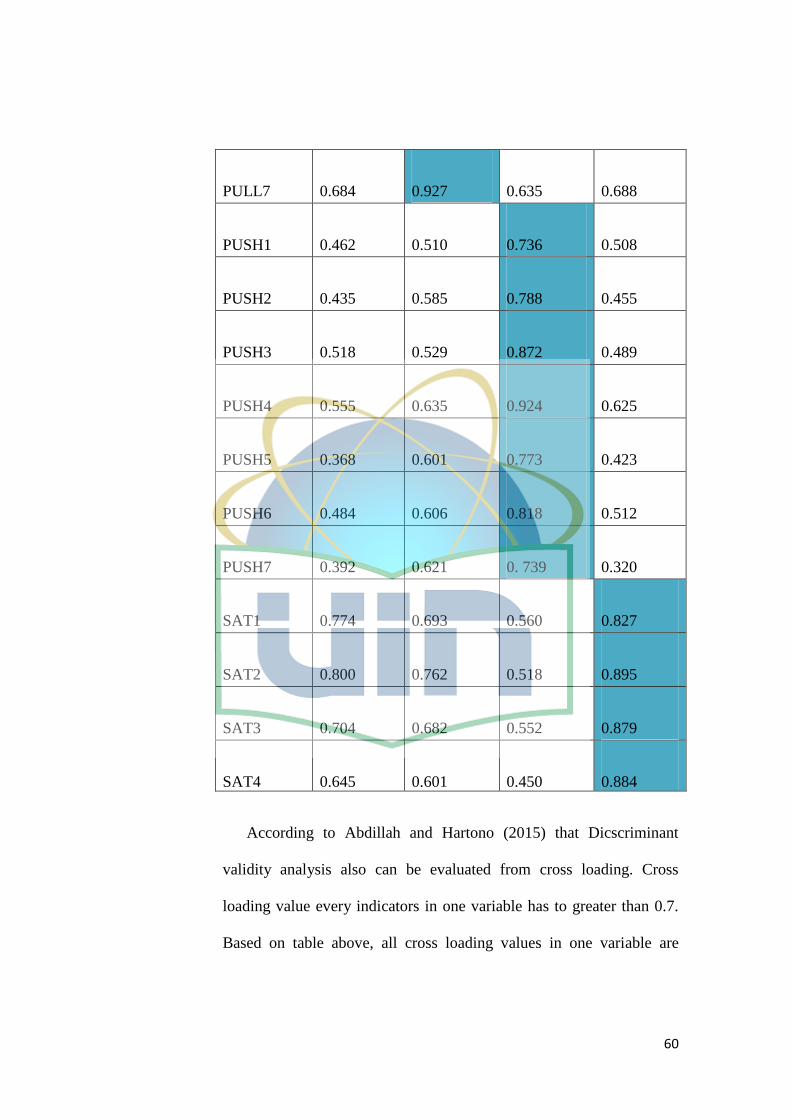
60
PULL7 0.684 0.927 0.635 0.688
PUSH1 0.462 0.510 0.736 0.508
PUSH2 0.435 0.585 0.788 0.455
PUSH3 0.518 0.529 0.872 0.489
PUSH4 0.555 0.635 0.924 0.625
PUSH5 0.368 0.601 0.773 0.423
PUSH6 0.484 0.606 0.818 0.512
PUSH7 0.392 0.621 0. 739 0.320
SAT1 0.774 0.693 0.560 0.827
SAT2 0.800 0.762 0.518 0.895
SAT3 0.704 0.682 0.552 0.879
SAT4 0.645 0.601 0.450 0.884
According to Abdillah and Hartono (2015) that Dicscriminant
validity analysis also can be evaluated from cross loading. Cross
loading value every indicators in one variable has to greater than 0.7.
Based on table above, all cross loading values in one variable are
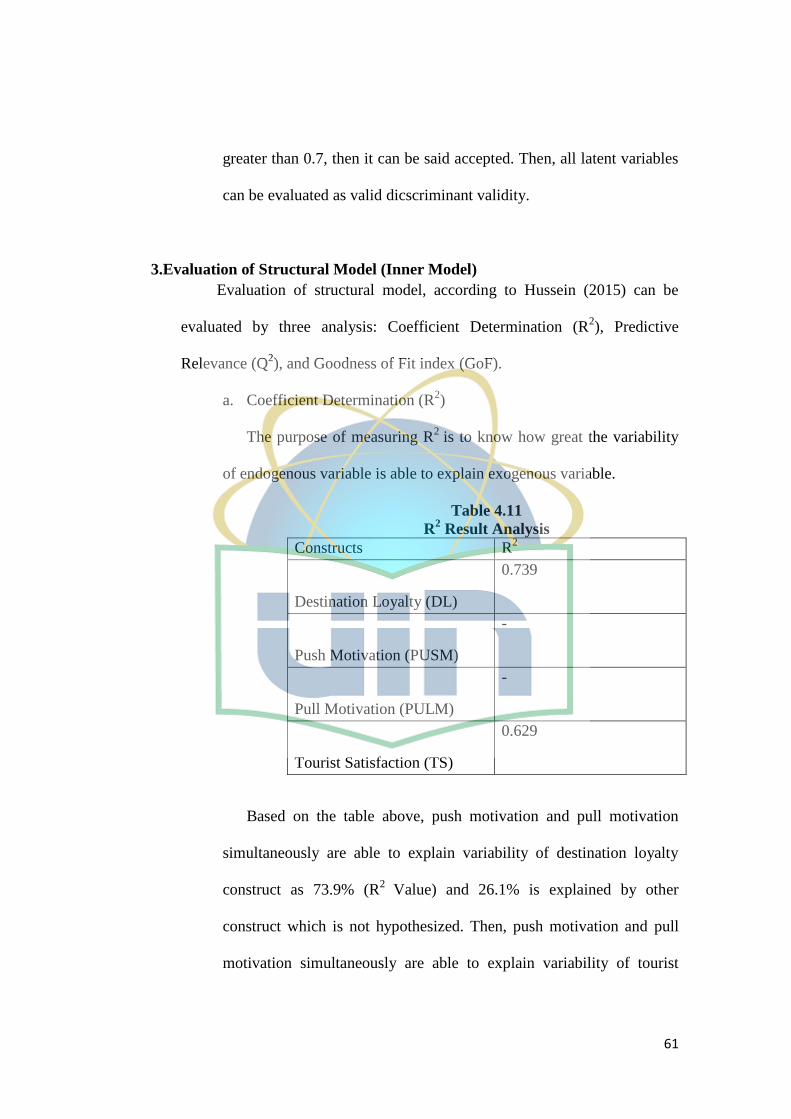
61
greater than 0.7, then it can be said accepted. Then, all latent variables
can be evaluated as valid dicscriminant validity.
3.Evaluation of Structural Model (Inner Model)
Evaluation of structural model, according to Hussein (2015) can be
evaluated by three analysis: Coefficient Determination (R2), Predictive
Relevance (Q2), and Goodness of Fit index (GoF).
a. Coefficient Determination (R2)
The purpose of measuring R2
is to know how great the variability
of endogenous variable is able to explain exogenous variable.
Table 4.11
R2 Result Analysis
Constructs R2
Destination Loyalty (DL)
0.739
Push Motivation (PUSM)
-
Pull Motivation (PULM)
-
Tourist Satisfaction (TS)
0.629
Based on the table above, push motivation and pull motivation
simultaneously are able to explain variability of destination loyalty
construct as 73.9% (R2
Value) and 26.1% is explained by other
construct which is not hypothesized. Then, push motivation and pull
motivation simultaneously are able to explain variability of tourist
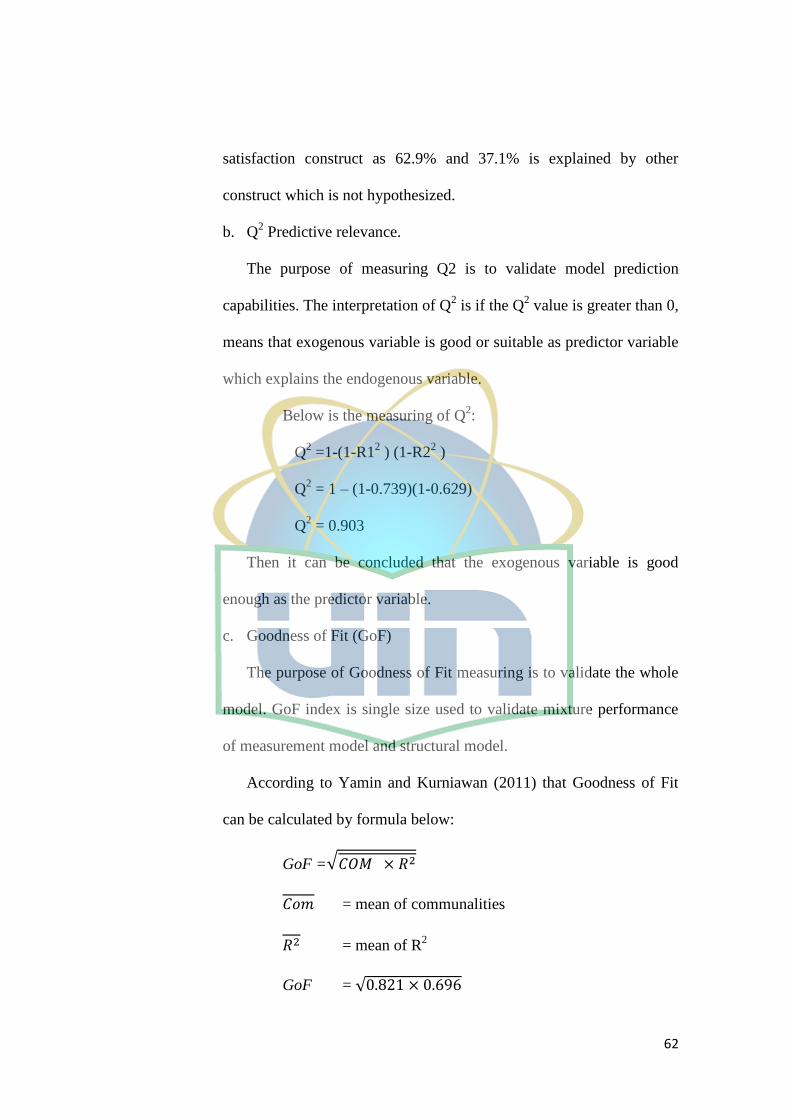
62
satisfaction construct as 62.9% and 37.1% is explained by other
construct which is not hypothesized.
b. Q2 Predictive relevance.
The purpose of measuring Q2 is to validate model prediction
capabilities. The interpretation of Q2 is if the Q
2 value is greater than 0,
means that exogenous variable is good or suitable as predictor variable
which explains the endogenous variable.
Below is the measuring of Q2:
Q2 =1-(1-R1
2 ) (1-R2
2 )
Q2 = 1 – (1-0.739)(1-0.629)
Q2 = 0.903
Then it can be concluded that the exogenous variable is good
enough as the predictor variable.
c. Goodness of Fit (GoF)
The purpose of Goodness of Fit measuring is to validate the whole
model. GoF index is single size used to validate mixture performance
of measurement model and structural model.
According to Yamin and Kurniawan (2011) that Goodness of Fit
can be calculated by formula below:
GoF =√
= mean of communalities
= mean of R
2
GoF = √
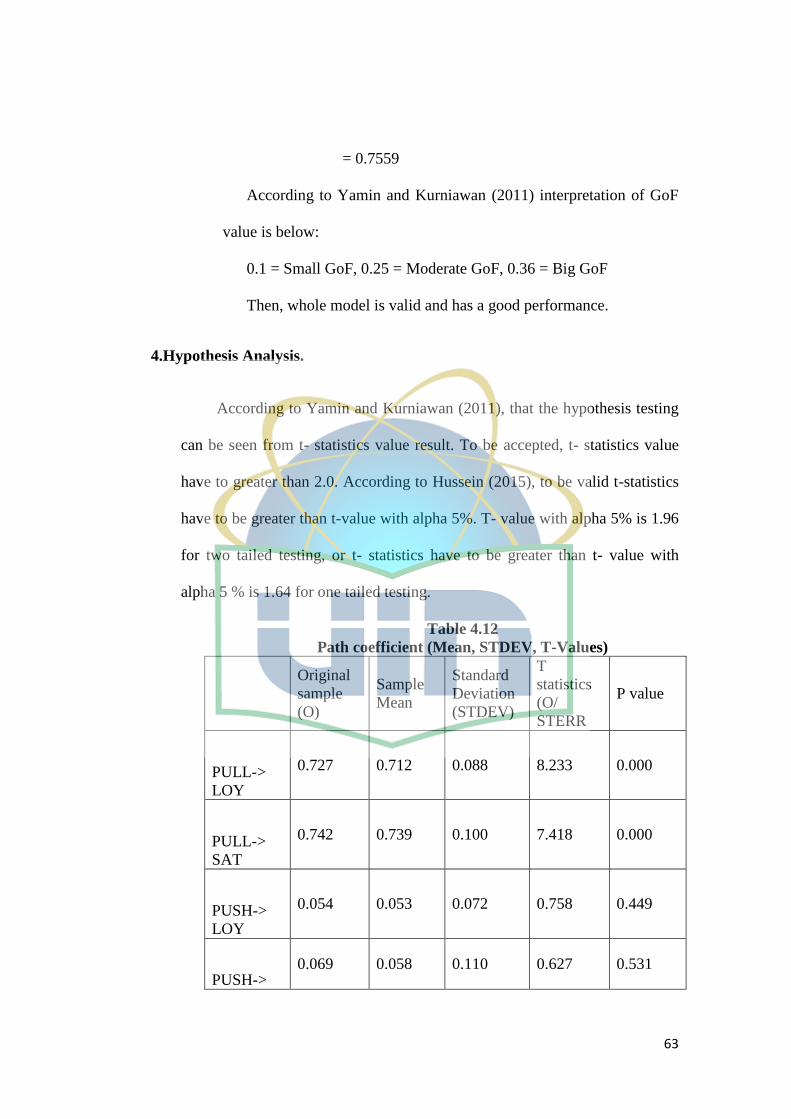
63
= 0.7559
According to Yamin and Kurniawan (2011) interpretation of GoF
value is below:
0.1 = Small GoF, 0.25 = Moderate GoF, 0.36 = Big GoF
Then, whole model is valid and has a good performance.
4.Hypothesis Analysis.
According to Yamin and Kurniawan (2011), that the hypothesis testing
can be seen from t- statistics value result. To be accepted, t- statistics value
have to greater than 2.0. According to Hussein (2015), to be valid t-statistics
have to be greater than t-value with alpha 5%. T- value with alpha 5% is 1.96
for two tailed testing, or t- statistics have to be greater than t- value with
alpha 5 % is 1.64 for one tailed testing.
Table 4.12
Path coefficient (Mean, STDEV, T-Values)
Original
sample
(O)
Sample
Mean
Standard
Deviation
(STDEV)
T
statistics
(O/
STERR
P value
PULL->
LOY
0.727 0.712 0.088 8.233 0.000
PULL->
SAT
0.742 0.739 0.100 7.418 0.000
PUSH->
LOY
0.054 0.053 0.072 0.758 0.449
PUSH-> 0.069 0.058 0.110 0.627 0.531
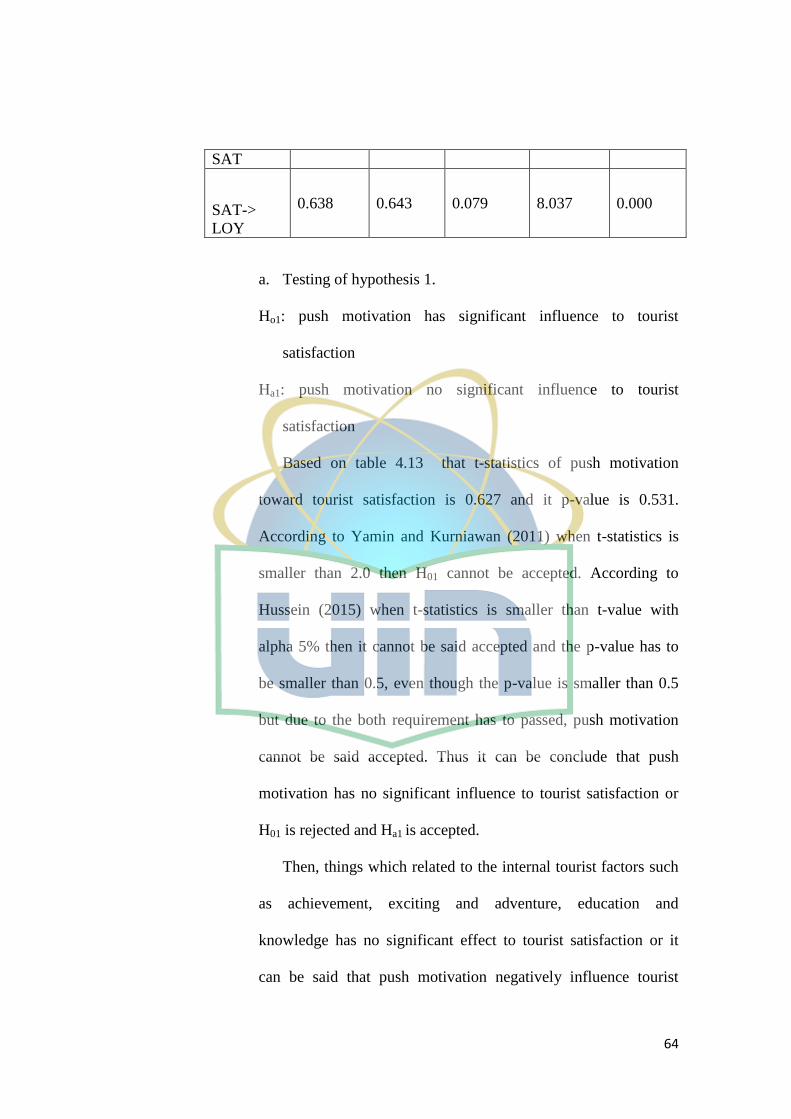
64
SAT
SAT->
LOY
0.638 0.643 0.079 8.037 0.000
a. Testing of hypothesis 1.
Ho1: push motivation has significant influence to tourist
satisfaction
Ha1: push motivation no significant influence to tourist
satisfaction
Based on table 4.13 that t-statistics of push motivation
toward tourist satisfaction is 0.627 and it p-value is 0.531.
According to Yamin and Kurniawan (2011) when t-statistics is
smaller than 2.0 then H01 cannot be accepted. According to
Hussein (2015) when t-statistics is smaller than t-value with
alpha 5% then it cannot be said accepted and the p-value has to
be smaller than 0.5, even though the p-value is smaller than 0.5
but due to the both requirement has to passed, push motivation
cannot be said accepted. Thus it can be conclude that push
motivation has no significant influence to tourist satisfaction or
H01 is rejected and Ha1 is accepted.
Then, things which related to the internal tourist factors such
as achievement, exciting and adventure, education and
knowledge has no significant effect to tourist satisfaction or it
can be said that push motivation negatively influence tourist
65
satisfaction. This result is not in accordance with the results of
previous research which conducted by Battour, et all (2012),
which in the previous research push motivation has significant
influence toward tourist satisfaction.
b. Testing of hypothesis 2
Ho2: pull motivation has significant influence to tourist
satisfaction
Ha2: pull motivation no significant influence to tourist
satisfaction
Based on table 4.12 that t-statistics of pull motivation
toward tourist satisfaction is 7.418 and it p-value is 0.000.
According to Hussein (2015) that t-statistics has to be greater
than t-values, 1.96 for two tailed testing and 1.64 for one
tailed testing and p-value has to be smaller than 0.5, then it
can be concluded that pull motivation (PULM) has
significant influence toward tourist satisfaction. Another
opinion came from Yamin and Kurniawan (2011) that t-
statistics can be positively influence when it reaches more
than 2.0, due to t-statistics of pull motivation toward tourist
satisfaction is 7.418 then it can be said that pull motivation
has significant influence toward tourist satisfaction. Then it
can be concluded that H02 is accepted. This result is in
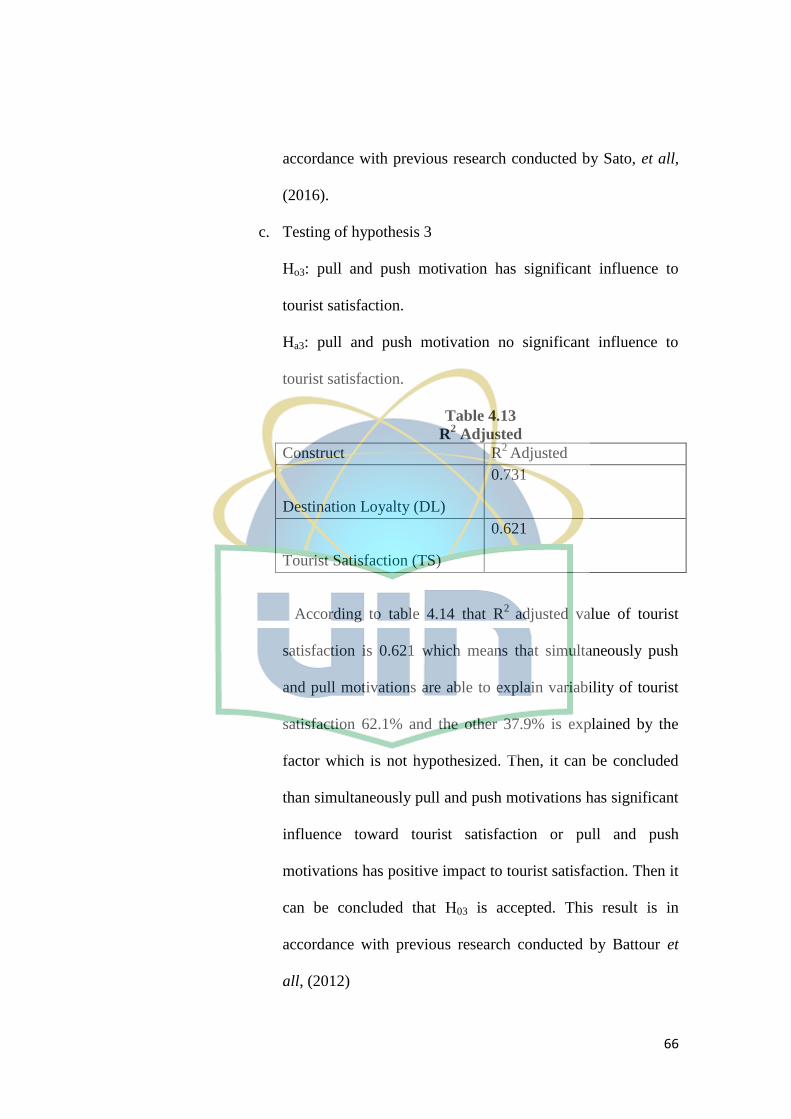
66
accordance with previous research conducted by Sato, et all,
(2016).
c. Testing of hypothesis 3
Ho3: pull and push motivation has significant influence to
tourist satisfaction.
Ha3: pull and push motivation no significant influence to
tourist satisfaction.
Table 4.13
R2 Adjusted
Construct R2
Adjusted
Destination Loyalty (DL)
0.731
Tourist Satisfaction (TS)
0.621
According to table 4.14 that R2
adjusted value of tourist
satisfaction is 0.621 which means that simultaneously push
and pull motivations are able to explain variability of tourist
satisfaction 62.1% and the other 37.9% is explained by the
factor which is not hypothesized. Then, it can be concluded
than simultaneously pull and push motivations has significant
influence toward tourist satisfaction or pull and push
motivations has positive impact to tourist satisfaction. Then it
can be concluded that H03 is accepted. This result is in
accordance with previous research conducted by Battour et
all, (2012)
67
d. Testing of hypothesis 4
Ho4: Tourist satisfaction has significant influence to
destination loyalty.
Ha4: Tourist satisfaction no significant influence to
destination loyalty.
Based on table 4.12 that t-statistics of tourist satisfaction
toward destination loyalty is 8.037 and it p-value is 0.000.
According to Abdillah and Hartono (2015) when t-statistics is
greater than t-value then it can be said significant and
accepted. T-value with alpha 5 % is 1.96 for two tailed
testing and 1.64 for one tailed testing, due to 8.037 is greater
than 1.96 and 1.64 means it accepted or significant. Then, it
p-value is 0.000 which is smaller than 0.5, thus it can be
conclude that tourist satisfaction has significant influence
toward destination loyalty. Then it can be concluded that H04
is accepted. This result is in accordance with previous
research conducted by Battour et all, (2012) and Sato et all,
(2016).
e. Testing of hypothesis 5
Ho5: pull motivation has significant influence to destination
loyalty.
68
Ha5: pull motivation no significant influence to destination
loyalty.
Based on table 4.12 , that t-statistics of pull motivation
toward destination loyalty is 8.233and it p-value is 0.000.
According to Yamin and Kurniawan (2011) when t-statistics
is smaller than 2.0 then it cannot be accepted. According to
Hussein (2015) when t-statistics is smaller than t-value with
alpha 5% then it cannot be said accepted. It p-value is also
smaller than 0.5. Thus it can be conclude that pull motivation
has significant influence to destination loyalty, or it can be
said that the pull motivation positively influence destination
loyalty. Then it can be concluded that H05 is accepted.
Thus can be said that things related to destination or pull
motivation (such as natural scenery, modern atmosphere, and
different culture) has positive influence to destination loyalty.
f. Testing of hypothesis 6
Ho6: push motivation has significant influence to destination
loyalty.
Ha6: push motivation satisfaction no significant influence to
destination loyalty.
Based on table 4.12 that t-statistics of push motivation
toward destination loyalty is 0.758 and it p-value is 0.449.
69
According to Hussein (2015) when t-statistics is smaller than
t-value with alpha 5 % then it cannot be accepted, because t-
statistics of push motivation to destination loyalty is 0.758
which is smaller than 1.96 (t-value for two tailed testing) and
1.64 (t-value for one tailed testing) then the hypothesis of
push motivation toward destination loyalty can be said not
accepted. It p-value is also greater than 0.5, so, it can be
concluded that push motivation has no significant influence
toward destination loyalty. Then it can be concluded that H06
is rejected and Ha6 is accepted. This result is in accordance
with previous research, conducted by Battour et all (2012)
and Sato, et all, (2016)
g. Testing of hypothesis 7
Ho7: pull and push motivation have significant influence to
destination loyalty.
Ha7: pull and push motivation influence have no significant to
destination loyalty.
Based on table 4.13 that R2 adjusted of destination loyalty
is 0.731 which means that simultaneously pull and push
motivation are able to explain variability of destination
loyalty 73.1% and the other 26.9% is explained by factors
that not hypothesized. Then it can be concluded that pull and
push motivation have significant influence to destination
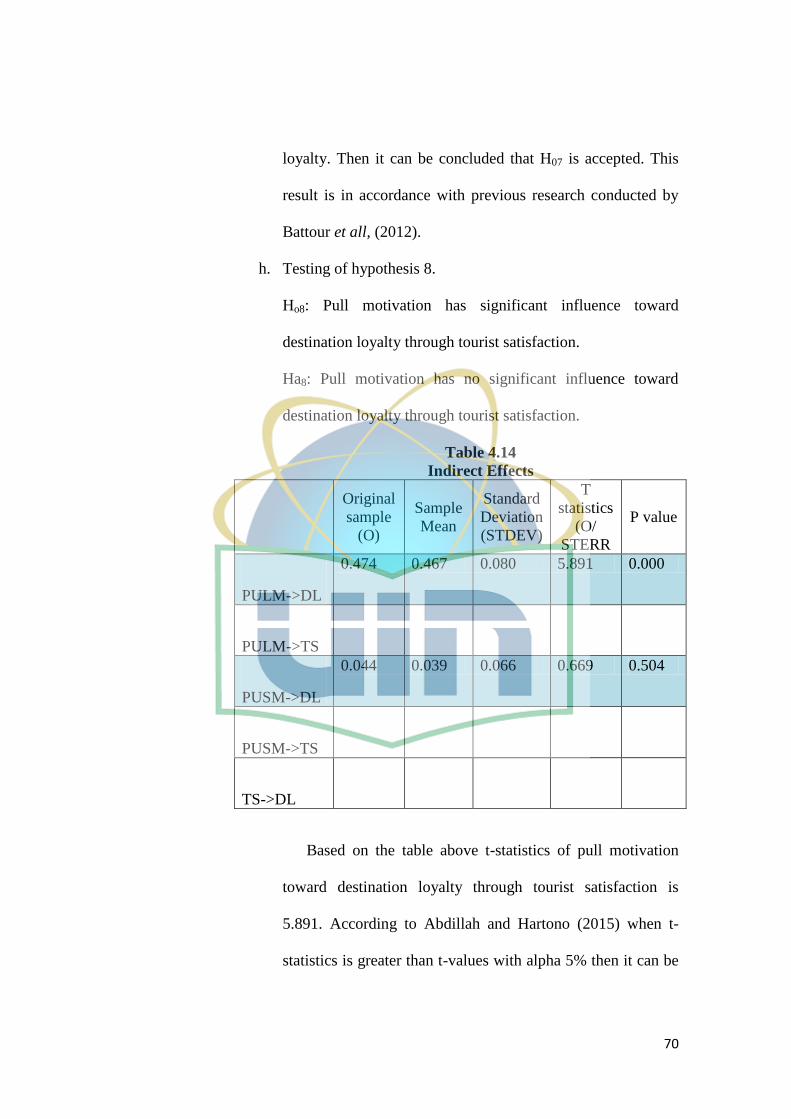
70
loyalty. Then it can be concluded that H07 is accepted. This
result is in accordance with previous research conducted by
Battour et all, (2012).
h. Testing of hypothesis 8.
Ho8: Pull motivation has significant influence toward
destination loyalty through tourist satisfaction.
Ha8: Pull motivation has no significant influence toward
destination loyalty through tourist satisfaction.
Table 4.14
Indirect Effects
Original
sample
(O)
Sample
Mean
Standard
Deviation
(STDEV)
T
statistics
(O/
STERR
P value
PULM->DL
0.474 0.467 0.080 5.891 0.000
PULM->TS
PUSM->DL
0.044 0.039 0.066 0.669 0.504
PUSM->TS
TS->DL
Based on the table above t-statistics of pull motivation
toward destination loyalty through tourist satisfaction is
5.891. According to Abdillah and Hartono (2015) when t-
statistics is greater than t-values with alpha 5% then it can be
71
concluded as significant of accepted and p-value has to be
smaller than 0.5 (Sofyani). T-values for one tailed testing is
1.64 and for two tailed testing is 1.96, then it can concluded
that pull motivation has significant influence toward
destination loyalty through tourist satisfaction. The p-value is
also smaller than 0.05 which is shown on table above, 0.000,
so it can be said significant. Then it can be concluded that H08
is accepted. This result is in accordance with previous
research conducted by Battour et all, (2012).
i. Testing of hypothesis 9.
Ho9: Push motivation has significant influence toward
destination loyalty through tourist satisfaction.
Ha9: Push motivation has no significant influence toward
destination loyalty through tourist satisfaction.
Based on the table 4.14, t-statistics of push motivation
toward destination loyalty through tourist satisfaction is
0.669. According to Abdillah and Hartono (2015) when t-
statistics is greater than t-values with alpha 5% then it can be
concluded as significant of accepted and p-value has to be
smaller than 0.5 (Sofyani). T-values for one tailed testing is
1.64 and for two tailed testing is 1.96, then it can concluded
that pull motivation has no significant influence toward
destination loyalty through tourist satisfaction, but the p-
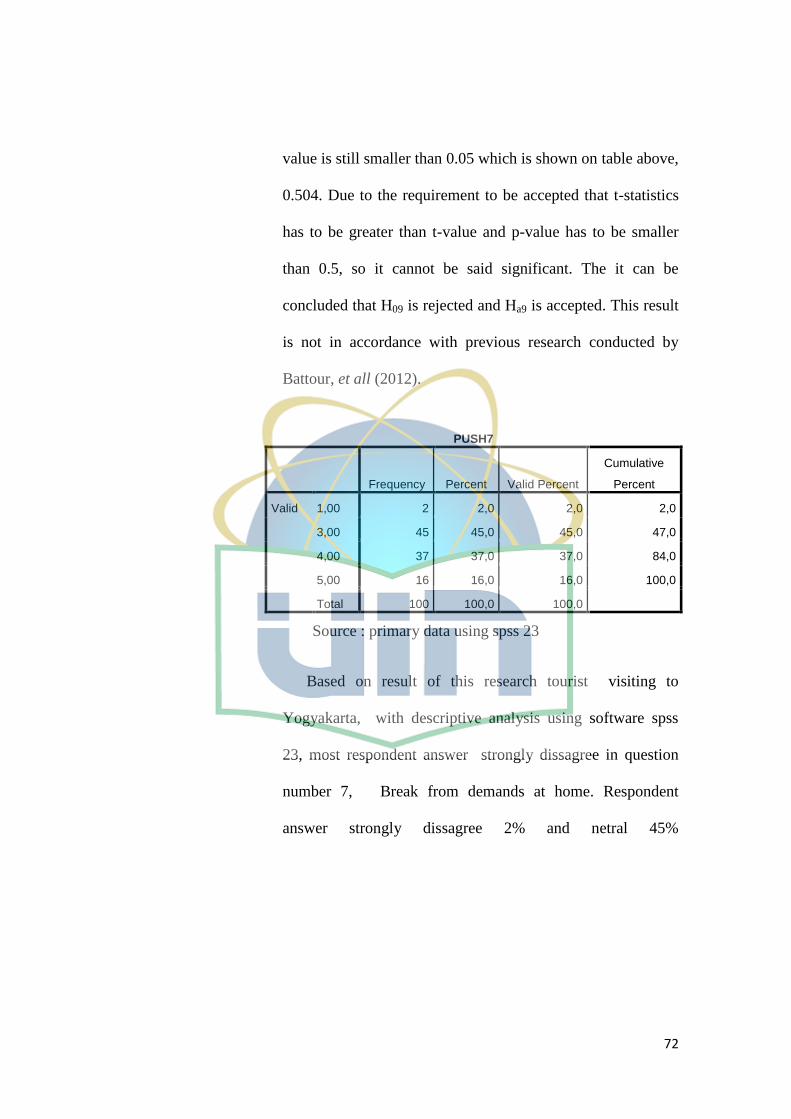
72
value is still smaller than 0.05 which is shown on table above,
0.504. Due to the requirement to be accepted that t-statistics
has to be greater than t-value and p-value has to be smaller
than 0.5, so it cannot be said significant. The it can be
concluded that H09 is rejected and Ha9 is accepted. This result
is not in accordance with previous research conducted by
Battour, et all (2012).
PUSH7
Frequency Percent Valid Percent
Cumulative
Percent
Valid 1,00 2 2,0 2,0 2,0
3,00 45 45,0 45,0 47,0
4,00 37 37,0 37,0 84,0
5,00 16 16,0 16,0 100,0
Total 100 100,0 100,0
Source : primary data using spss 23
Based on result of this research tourist visiting to
Yogyakarta, with descriptive analysis using software spss
23, most respondent answer strongly dissagree in question
number 7, Break from demands at home. Respondent
answer strongly dissagree 2% and netral 45%
73
CHAPTER V
CONCLUSION AND RECOMMENDATION
A. Conclusion
Based on the research that conducted, there are several conclusions which related
to it as follows:
1. Push motivations which are coming from internal desire of tourist such
as achievement, education, and escape has no significant influence
toward tourist satisfaction, because actually push motivations are
depending on the psychological state of tourist which can be different
and can suddenly change. Tourist condition while deciding to take
vacation or travel, then preparing the trip, and when he/ she already
arrived to the destination can be extremely different.
2. Pull motivations which are coming from external tourist or everything
about the destination which can attract tourist to come such as natural
scenery, modern atmosphere, and culture has significant influence
toward tourist satisfaction. It means that the external factors impact in
way to satisfy tourist desire.
74
3. Pull and push motivations simultaneously have significant influence
toward tourist satisfaction. It shown that both influence tourist
satisfaction as 80.5%.
4. Tourist satisfaction has significant influence toward destination loyalty.
It means when tourists are satisfied with the destination then they will
willingly return to the destination or recommend it to their relatives and
friends.
5. Pull motivation has significant influence directly to destination loyalty.
It means that everything about the destination which can attract tourist
has significant impact toward their loyalty to the destination which
makes them willingly return to the destination and recommend it to
friends and relatives.
6. Push motivation has no significant influence directly to destination
loyalty. It means that tourist internal desire has no significant impact
toward tourist‟s loyalty to the destination.
7. Pull and push motivations has significant influence toward destination
loyalty. It means that when they come both simultaneously, tourist
internal desire and everything in destination which can attract tourist to
came have significant impact to tourist willingness to return and
recommend as 80.5%.
8. Pull motivation has significant influence to destination loyalty through
tourist satisfaction. Which means that when everything that can attract
tourists to come to a destination and they satisfied with the destination,
75
they willingly will recommend it to their relatives and friends and
willingly return to destination.
9. The last one, push motivation has no significant influence to destination
loyalty through tourist satisfaction. It means everything which come
from tourist internal desire has no significant impact to tourist
satisfaction and destination loyalty.
B. Recommendation
For conducting the next research, there recommendation to conduct
the research in other place, with other criteria of tourist such as adventure
tourist or hiking community tourist, because probably there will be some
differences of result and indicators of pull and push motivation. Then,
suggested in conducting the research, to use larger sample so the
researcher could get better and clearly result as an output of the research.
In conducting the research, expectedly to conduct the research in smaller
area than this research to make the research process easier and the output
better. The next research also can combine the Islamic values towards
operational variables so the percept of Islamic tourism in tourist thought
can be drawn clearer. To achieve this goal researcher has to explore more
about the theory through books and journals.
This research hopefully can give any contribution on theory
development especially on pull and push motivation in tourism field and
76
especially travel agent of Yogyakarta ourism destination and destination
marketers of Yogyakarta, Central Java
This research also hopefully can be guided for the travel agents
and destination marketers of Yogyakarta in way to arrange the suitable
based on tourist ideal needs. Based on research result that pull motivation
or everything that come from the destination which can attract tourist has
significant influence toward tourist satisfaction and destination loyalty,
which means destination marketers have to be more creative to set the tour
package and promote the destination.
Most of tourist came toYogyakarta for the beautiful and variety of
its natural nature and interesting village which has interesting culture. In
Yogyakarta there several culture ritual, Travel agents and destination
marketers can include it to the travel package where tourist can watch
whole the process such as grebeg muharram, from the beginning of the
preparation, and the grebeg muharram process. The government of
hopefully can realizing the program which already design.
The destination marketer also can provide educational tourism
package for children, such as a tour in smart park Yogyakarta area and
participating in activity that organized in Yogyakarta It can add the
variety of activities that can be seen by the tourist. This also will be fun
event for children, because usually married with children tourist prefer to
destination that can be enjoyable for the whole family.

77
As we knew from the result of research that push motivations has
no significant impact towards satisfaction, but destination marketers and
government still can take advantage from it. Destination marketers and
government can use any marketing tools to create situation that make
people feel and think that they need vacation, learning new things, or just
to have feeling when they are far from home, or they just have to go away
from home and job demands, then contribute to their decision making
about vacation.

78
AttachmentI : Respondent Quisioner Sheet
Kepada Yth : Jakarta, December
2017
Responden
di-Tempat
Assalamualaikum Warrahmatullahi Wabarakatuh
Bersama ini saya :
Nama : Nugroho Wicaksono
NIM : 1113081100007
Status : Mahasiswa Strata 1 (S-1), Fakultas Ekonomi dan Bisnis, Jurusan
Manajemen (Internasional Program), Universitas Syarif Hidayatullah Jakarta.
Dalam rangka untuk penyelesaian studi Fakultas Ekonomi dan Bisnis, Jurusan
Manajemen (Internasional Program), Semester 10, UIN Jakarta, saya memerlukan
informasi untuk mendukung penelitian yang saya lakukan dengan judul
―Motivasi dan Kepuasan Turis serta Perannya terhadap Loyalitas kepada
Destinasi” .
Untuk itu kami mohon kesediaan Bapak/Ibu/Saudara/I berpartisipasi dalam
penelitian ini dengan mengisi kuesioner yang terlampir. Kesediaan
Bapak/Ibu/Saudara/I mengisi kuesioner ini sangat menentukan keberhasilan
penelitian yang saya lakukan.
Perlu Bapak/Ibu/Saudara/I ketahui sesuai dengan etika dalam penelitian, data
yang saya peroleh akan dijaga kerahasiaannya dan digunakan semata-mata untuk
kepentingan penelitian. Terimakasih telah bersedia me luangkan waktu mengisi
dan mengembalikan kuisioner ini.
Atas kesediaan Bapak/Ibu/Saudara/i , saya ucapkan terima kasih.
Hormat Saya,
Nugroho Wicaksono
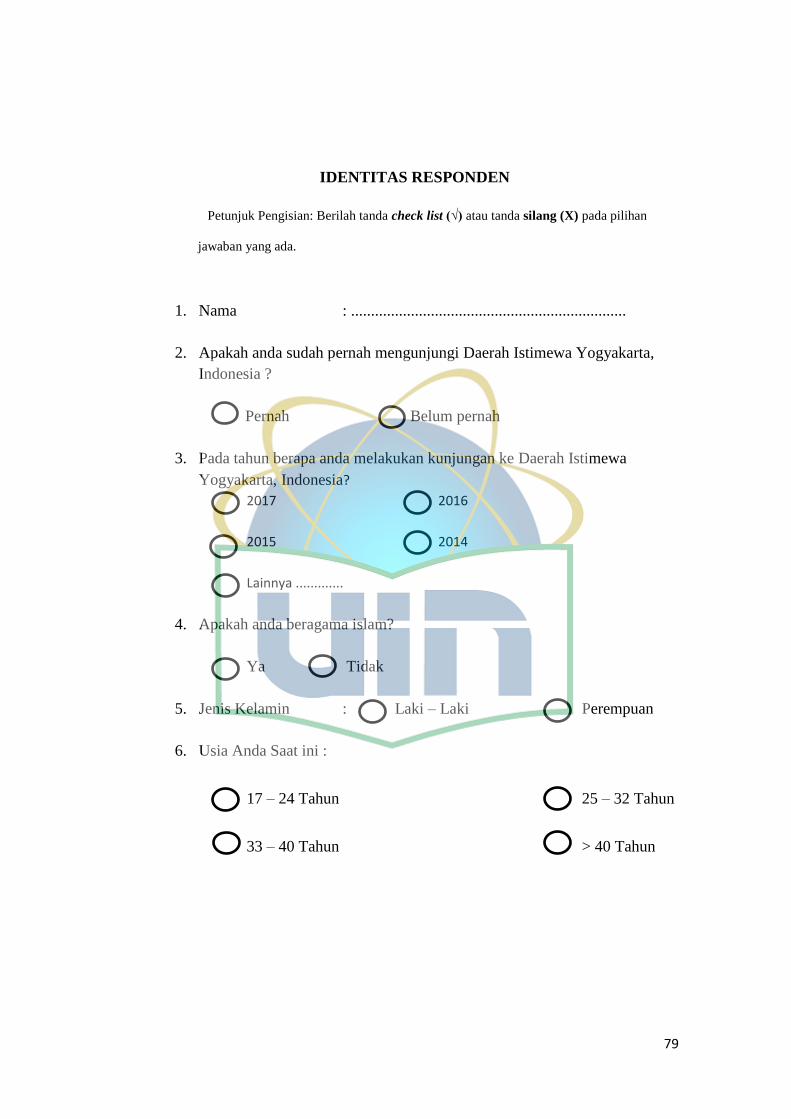
79
IDENTITAS RESPONDEN
Petunjuk Pengisian: Berilah tanda check list (√) atau tanda silang (X) pada pilihan
jawaban yang ada.
1. Nama : .....................................................................
2. Apakah anda sudah pernah mengunjungi Daerah Istimewa Yogyakarta,
Indonesia ?
Pernah Belum pernah
3. Pada tahun berapa anda melakukan kunjungan ke Daerah Istimewa
Yogyakarta, Indonesia?
2017 2016
2015 2014
Lainnya .............
4. Apakah anda beragama islam?
Ya Tidak
5. Jenis Kelamin : Laki – Laki Perempuan
6. Usia Anda Saat ini :
17 – 24 Tahun 25 – 32 Tahun
33 – 40 Tahun > 40 Tahun
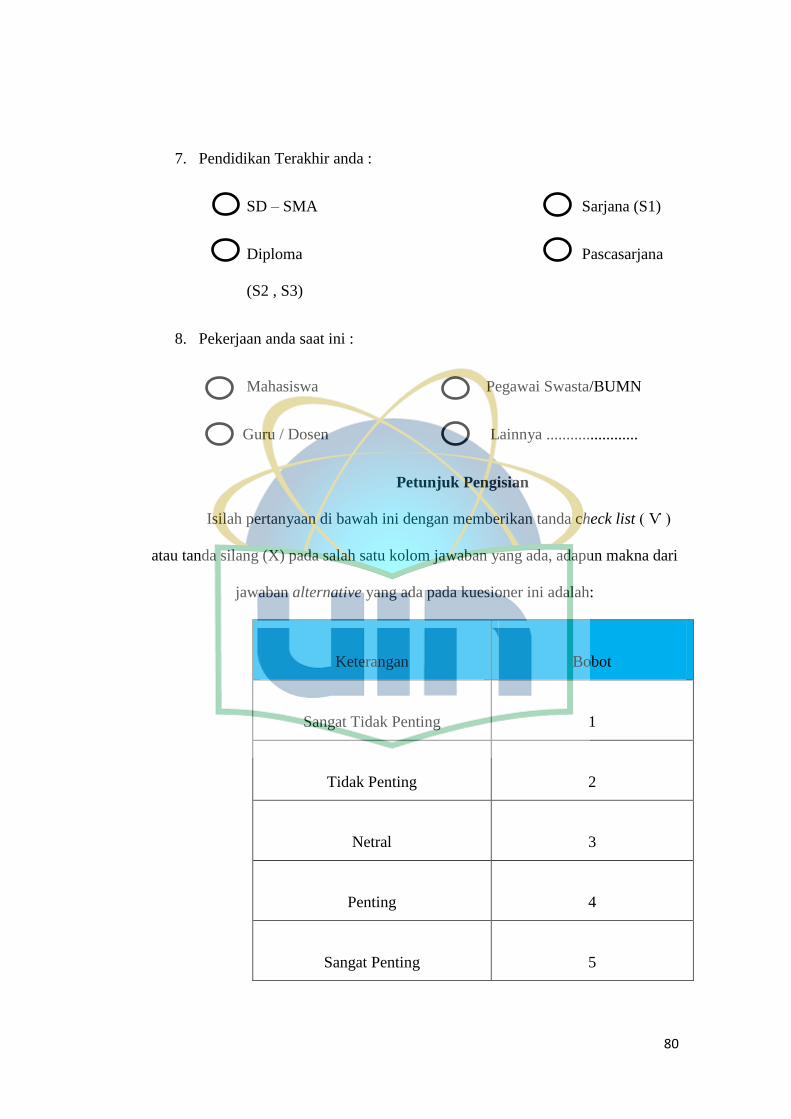
80
7. Pendidikan Terakhir anda :
SD – SMA Sarjana (S1)
Diploma Pascasarjana
(S2 , S3)
8. Pekerjaan anda saat ini :
Mahasiswa Pegawai Swasta/BUMN
Guru / Dosen Lainnya .......................
Petunjuk Pengisian
Isilah pertanyaan di bawah ini dengan memberikan tanda check list ( Ѵ )
atau tanda silang (X) pada salah satu kolom jawaban yang ada, adapun makna dari
jawaban alternative yang ada pada kuesioner ini adalah:
Keterangan Bobot
Sangat Tidak Penting 1
Tidak Penting 2
Netral 3
Penting 4
Sangat Penting 5
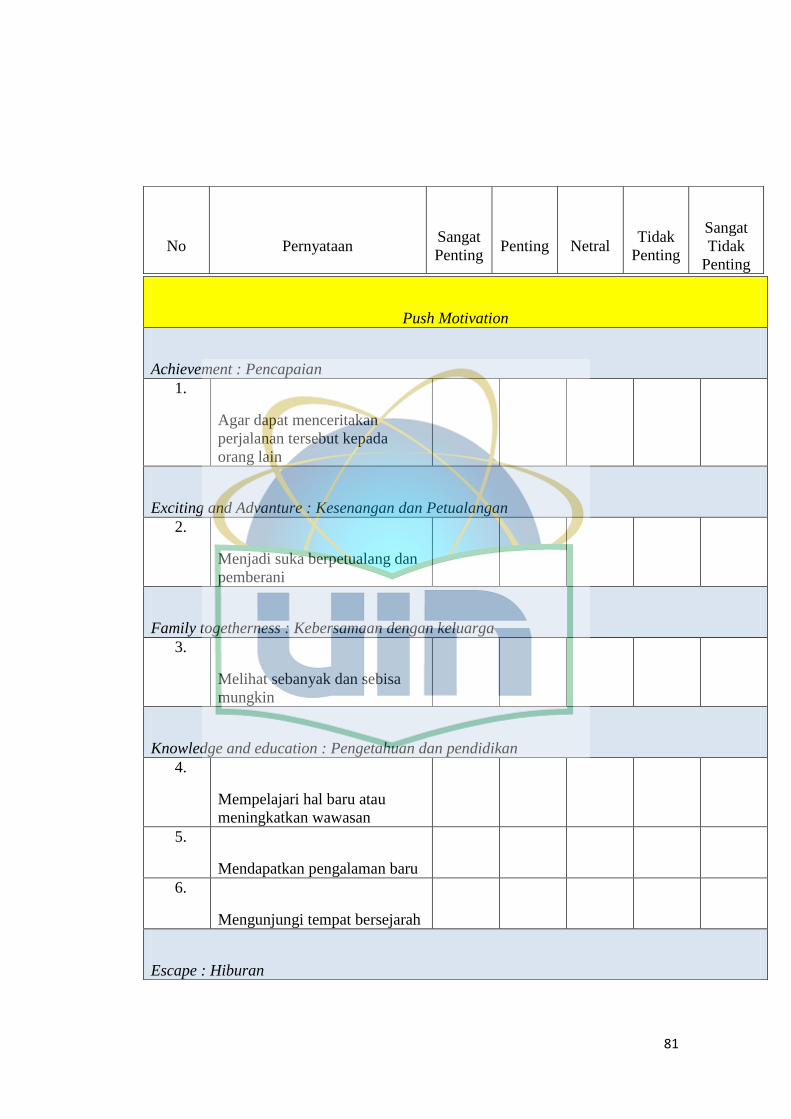
81
No Pernyataan Sangat
Penting Penting Netral
Tidak
Penting
Sangat
Tidak
Penting
Push Motivation
Achievement : Pencapaian
1.
Agar dapat menceritakan
perjalanan tersebut kepada
orang lain
Exciting and Advanture : Kesenangan dan Petualangan
2.
Menjadi suka berpetualang dan
pemberani
Family togetherness : Kebersamaan dengan keluarga
3.
Melihat sebanyak dan sebisa
mungkin
Knowledge and education : Pengetahuan dan pendidikan
4.
Mempelajari hal baru atau
meningkatkan wawasan
5.
Mendapatkan pengalaman baru
6.
Mengunjungi tempat bersejarah
Escape : Hiburan
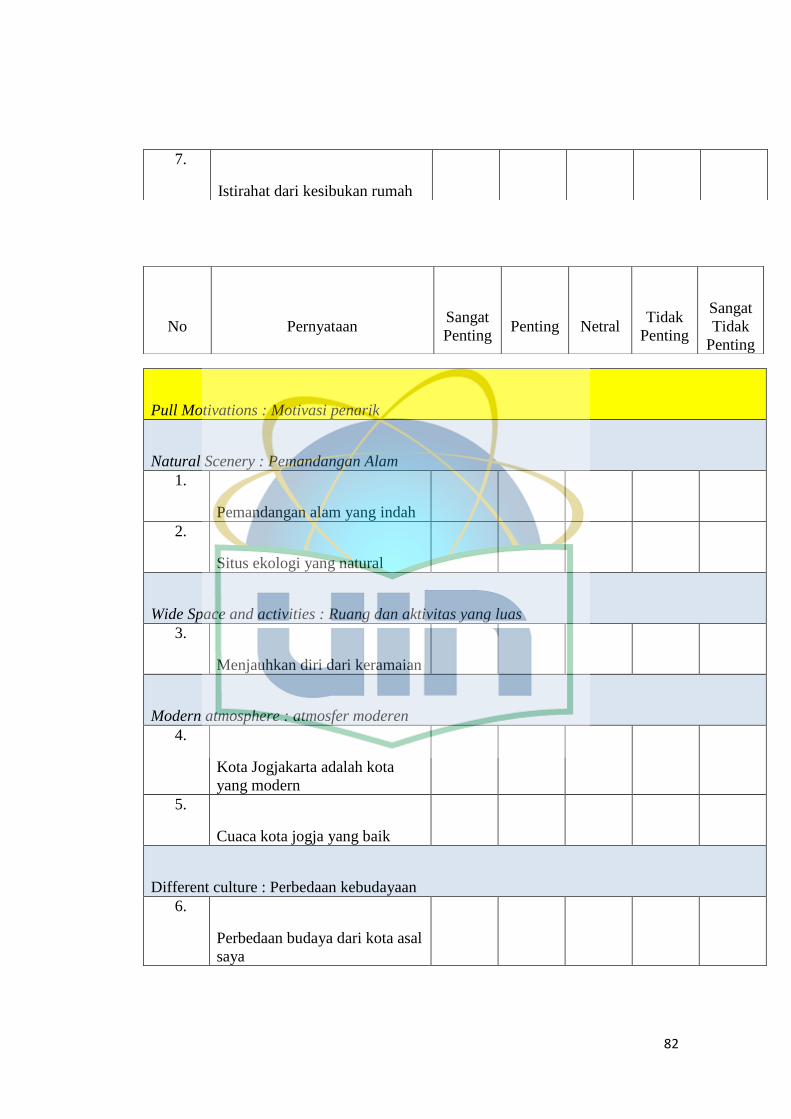
82
7.
Istirahat dari kesibukan rumah
No Pernyataan Sangat
Penting Penting Netral
Tidak
Penting
Sangat
Tidak
Penting
Pull Motivations : Motivasi penarik
Natural Scenery : Pemandangan Alam
1.
Pemandangan alam yang indah
2.
Situs ekologi yang natural
Wide Space and activities : Ruang dan aktivitas yang luas
3.
Menjauhkan diri dari keramaian
Modern atmosphere : atmosfer moderen
4.
Kota Jogjakarta adalah kota
yang modern
5.
Cuaca kota jogja yang baik
Different culture : Perbedaan kebudayaan
6.
Perbedaan budaya dari kota asal
saya
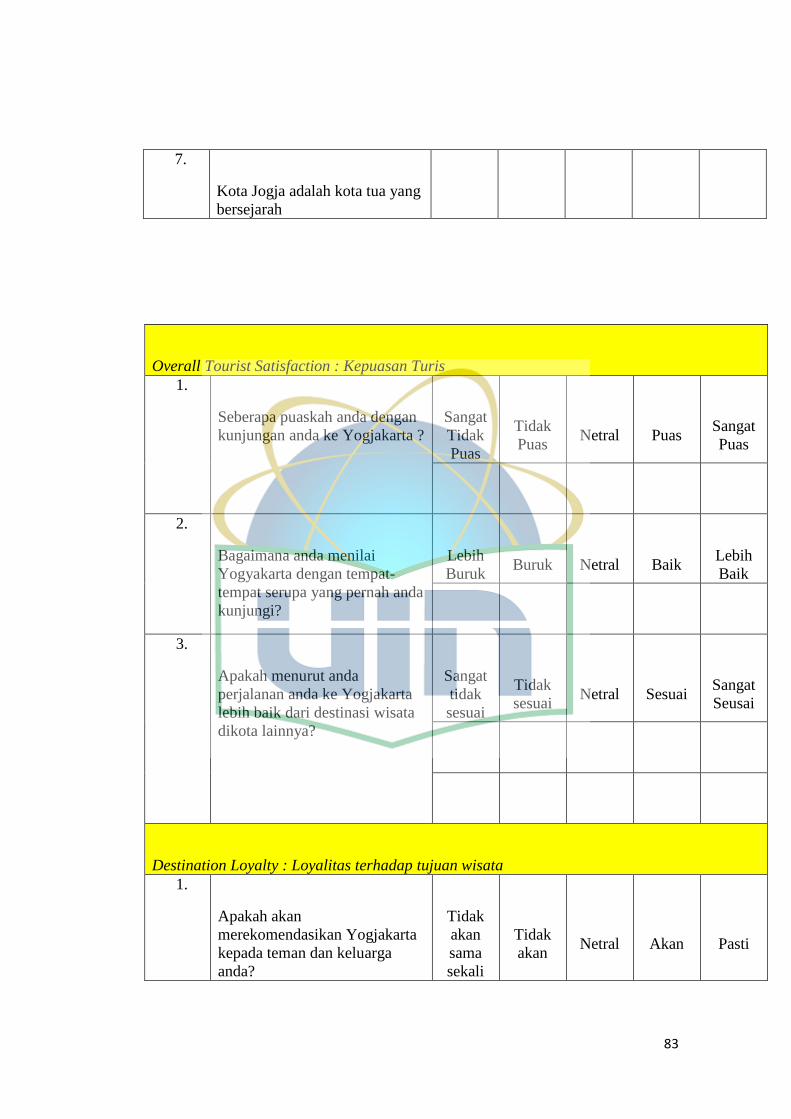
83
Overall Tourist Satisfaction : Kepuasan Turis
1.
Seberapa puaskah anda dengan
kunjungan anda ke Yogjakarta ?
Sangat
Tidak
Puas
Tidak
Puas Netral Puas
Sangat
Puas
2.
Bagaimana anda menilai
Yogyakarta dengan tempat-
tempat serupa yang pernah anda
kunjungi?
Lebih
Buruk Buruk Netral Baik
Lebih
Baik
3.
Apakah menurut anda
perjalanan anda ke Yogjakarta
lebih baik dari destinasi wisata
dikota lainnya?
Sangat
tidak
sesuai
Tidak
sesuai Netral Sesuai
Sangat
Seusai
Destination Loyalty : Loyalitas terhadap tujuan wisata
1.
Apakah akan
merekomendasikan Yogjakarta
kepada teman dan keluarga
anda?
Tidak
akan
sama
sekali
Tidak
akan Netral Akan Pasti
7.
Kota Jogja adalah kota tua yang
bersejarah

84
2.
Apakah anda berencana untuk
melakukan perjalanan ke
Yogjakarta lagi dalam dua
tahun ke depan?
Tidak
akan
sama
sekali
Tidak
akan Netral Akan Pasti
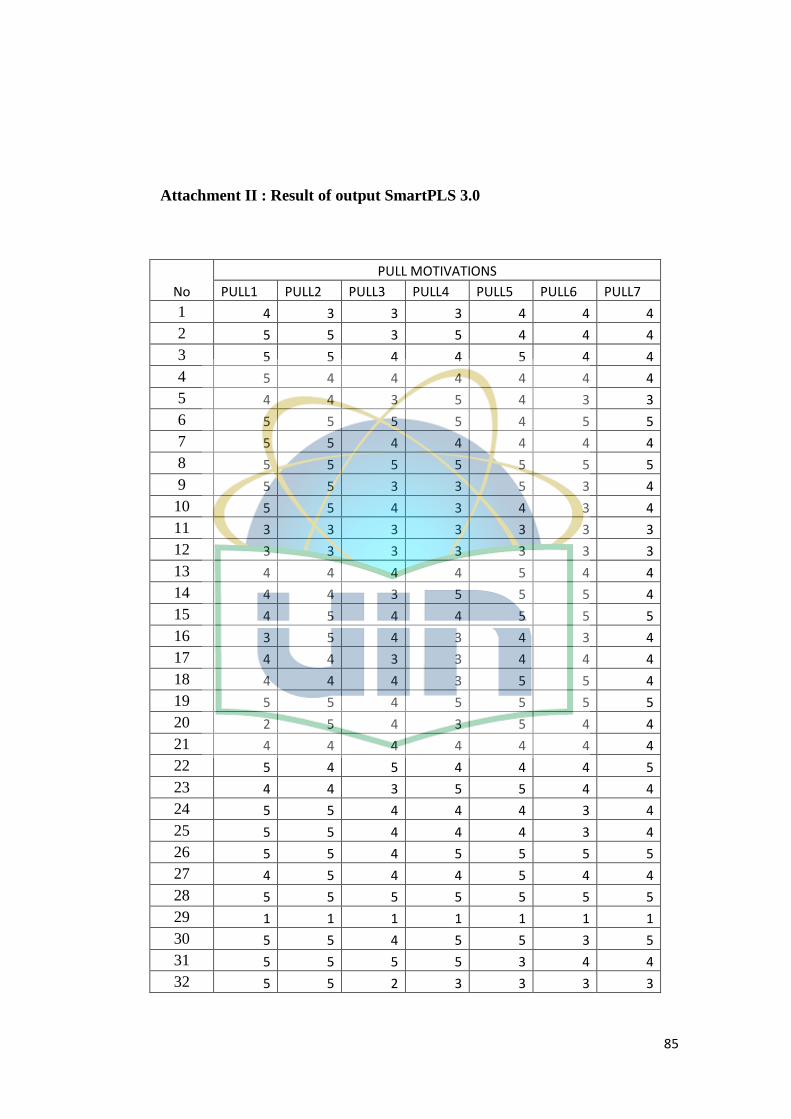
85
Attachment II : Result of output SmartPLS 3.0
No
PULL MOTIVATIONS
PULL1 PULL2 PULL3 PULL4 PULL5 PULL6 PULL7
1 4 3 3 3 4 4 4
2 5 5 3 5 4 4 4
3 5 5 4 4 5 4 4
4 5 4 4 4 4 4 4
5 4 4 3 5 4 3 3
6 5 5 5 5 4 5 5
7 5 5 4 4 4 4 4
8 5 5 5 5 5 5 5
9 5 5 3 3 5 3 4
10 5 5 4 3 4 3 4
11 3 3 3 3 3 3 3
12 3 3 3 3 3 3 3
13 4 4 4 4 5 4 4
14 4 4 3 5 5 5 4
15 4 5 4 4 5 5 5
16 3 5 4 3 4 3 4
17 4 4 3 3 4 4 4
18 4 4 4 3 5 5 4
19 5 5 4 5 5 5 5
20 2 5 4 3 5 4 4
21 4 4 4 4 4 4 4
22 5 4 5 4 4 4 5
23 4 4 3 5 5 4 4
24 5 5 4 4 4 3 4
25 5 5 4 4 4 3 4
26 5 5 4 5 5 5 5
27 4 5 4 4 5 4 4
28 5 5 5 5 5 5 5
29 1 1 1 1 1 1 1
30 5 5 4 5 5 3 5
31 5 5 5 5 3 4 4
32 5 5 2 3 3 3 3
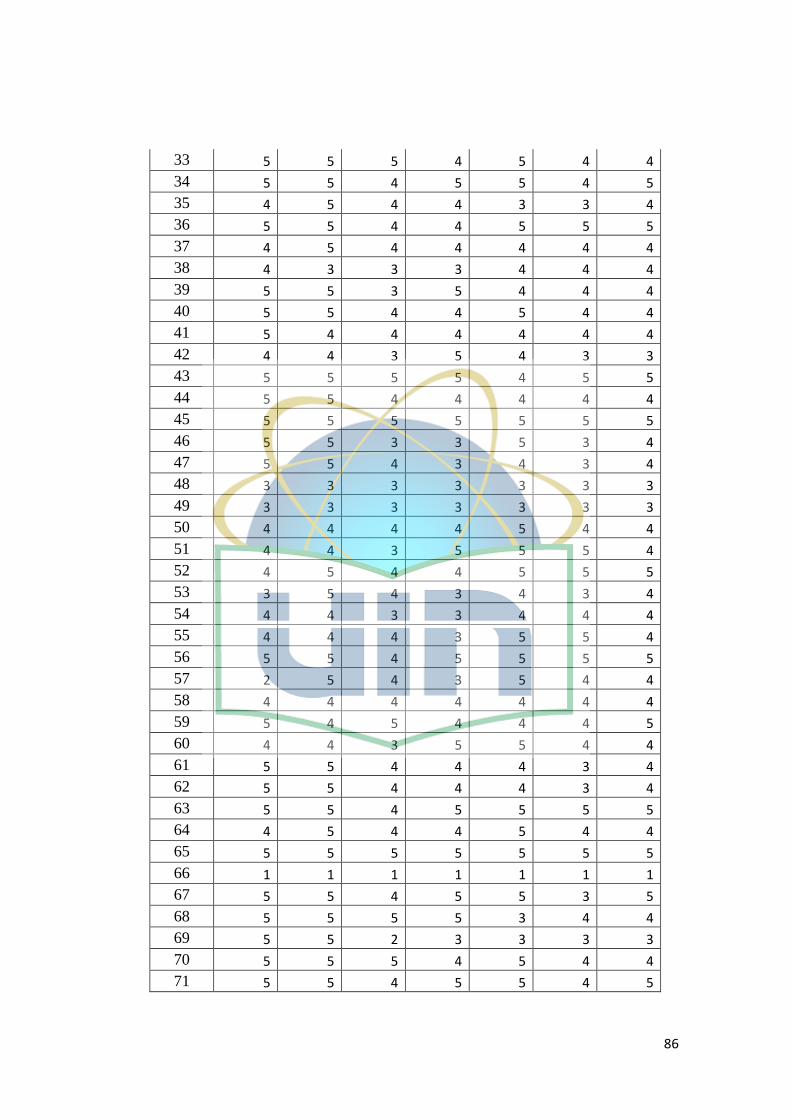
86
33 5 5 5 4 5 4 4
34 5 5 4 5 5 4 5
35 4 5 4 4 3 3 4
36 5 5 4 4 5 5 5
37 4 5 4 4 4 4 4
38 4 3 3 3 4 4 4
39 5 5 3 5 4 4 4
40 5 5 4 4 5 4 4
41 5 4 4 4 4 4 4
42 4 4 3 5 4 3 3
43 5 5 5 5 4 5 5
44 5 5 4 4 4 4 4
45 5 5 5 5 5 5 5
46 5 5 3 3 5 3 4
47 5 5 4 3 4 3 4
48 3 3 3 3 3 3 3
49 3 3 3 3 3 3 3
50 4 4 4 4 5 4 4
51 4 4 3 5 5 5 4
52 4 5 4 4 5 5 5
53 3 5 4 3 4 3 4
54 4 4 3 3 4 4 4
55 4 4 4 3 5 5 4
56 5 5 4 5 5 5 5
57 2 5 4 3 5 4 4
58 4 4 4 4 4 4 4
59 5 4 5 4 4 4 5
60 4 4 3 5 5 4 4
61 5 5 4 4 4 3 4
62 5 5 4 4 4 3 4
63 5 5 4 5 5 5 5
64 4 5 4 4 5 4 4
65 5 5 5 5 5 5 5
66 1 1 1 1 1 1 1
67 5 5 4 5 5 3 5
68 5 5 5 5 3 4 4
69 5 5 2 3 3 3 3
70 5 5 5 4 5 4 4
71 5 5 4 5 5 4 5
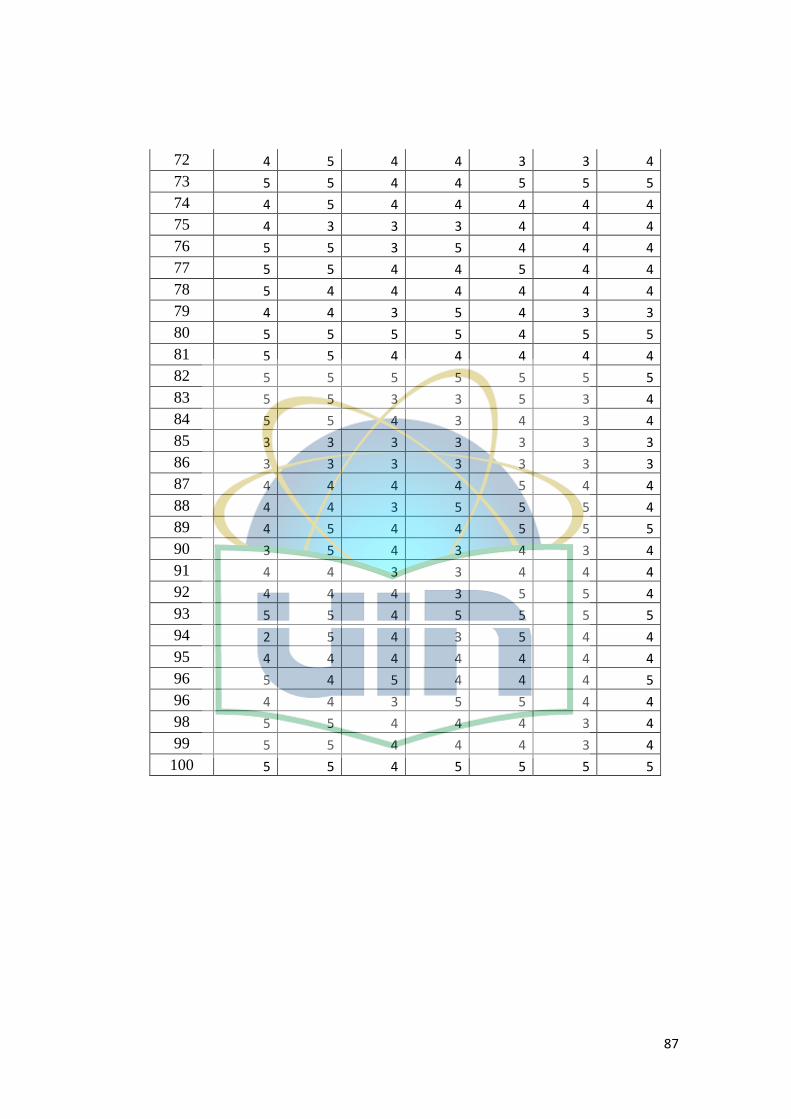
87
72 4 5 4 4 3 3 4
73 5 5 4 4 5 5 5
74 4 5 4 4 4 4 4
75 4 3 3 3 4 4 4
76 5 5 3 5 4 4 4
77 5 5 4 4 5 4 4
78 5 4 4 4 4 4 4
79 4 4 3 5 4 3 3
80 5 5 5 5 4 5 5
81 5 5 4 4 4 4 4
82 5 5 5 5 5 5 5
83 5 5 3 3 5 3 4
84 5 5 4 3 4 3 4
85 3 3 3 3 3 3 3
86 3 3 3 3 3 3 3
87 4 4 4 4 5 4 4
88 4 4 3 5 5 5 4
89 4 5 4 4 5 5 5
90 3 5 4 3 4 3 4
91 4 4 3 3 4 4 4
92 4 4 4 3 5 5 4
93 5 5 4 5 5 5 5
94 2 5 4 3 5 4 4
95 4 4 4 4 4 4 4
96 5 4 5 4 4 4 5
96 4 4 3 5 5 4 4
98 5 5 4 4 4 3 4
99 5 5 4 4 4 3 4
100 5 5 4 5 5 5 5
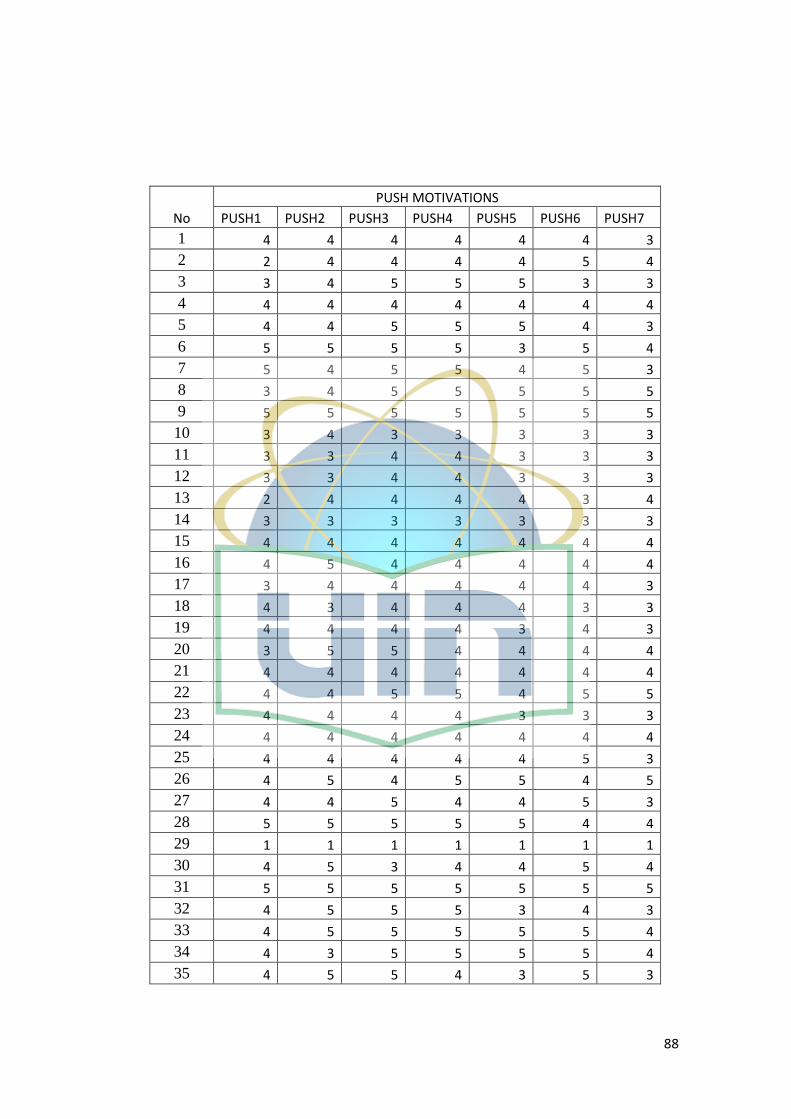
88
No
PUSH MOTIVATIONS
PUSH1 PUSH2 PUSH3 PUSH4 PUSH5 PUSH6 PUSH7
1 4 4 4 4 4 4 3
2 2 4 4 4 4 5 4
3 3 4 5 5 5 3 3
4 4 4 4 4 4 4 4
5 4 4 5 5 5 4 3
6 5 5 5 5 3 5 4
7 5 4 5 5 4 5 3
8 3 4 5 5 5 5 5
9 5 5 5 5 5 5 5
10 3 4 3 3 3 3 3
11 3 3 4 4 3 3 3
12 3 3 4 4 3 3 3
13 2 4 4 4 4 3 4
14 3 3 3 3 3 3 3
15 4 4 4 4 4 4 4
16 4 5 4 4 4 4 4
17 3 4 4 4 4 4 3
18 4 3 4 4 4 3 3
19 4 4 4 4 3 4 3
20 3 5 5 4 4 4 4
21 4 4 4 4 4 4 4
22 4 4 5 5 4 5 5
23 4 4 4 4 3 3 3
24 4 4 4 4 4 4 4
25 4 4 4 4 4 5 3
26 4 5 4 5 5 4 5
27 4 4 5 4 4 5 3
28 5 5 5 5 5 4 4
29 1 1 1 1 1 1 1
30 4 5 3 4 4 5 4
31 5 5 5 5 5 5 5
32 4 5 5 5 3 4 3
33 4 5 5 5 5 5 4
34 4 3 5 5 5 5 4
35 4 5 5 4 3 5 3
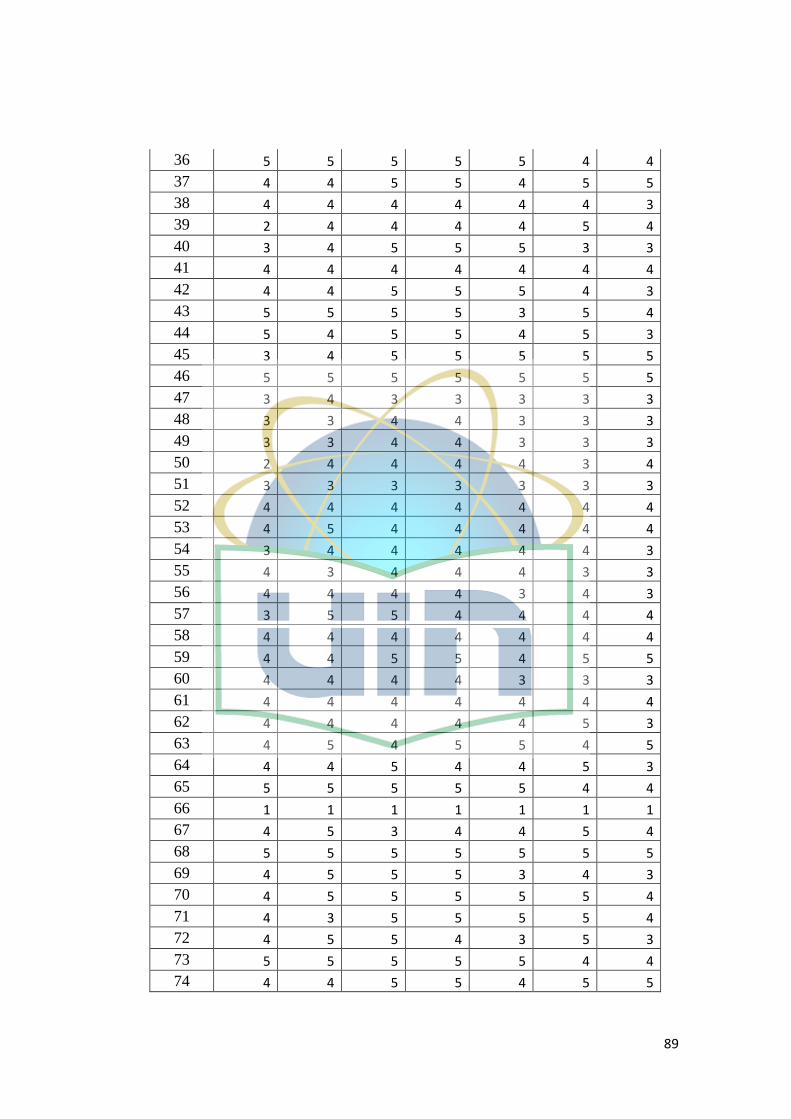
89
36 5 5 5 5 5 4 4
37 4 4 5 5 4 5 5
38 4 4 4 4 4 4 3
39 2 4 4 4 4 5 4
40 3 4 5 5 5 3 3
41 4 4 4 4 4 4 4
42 4 4 5 5 5 4 3
43 5 5 5 5 3 5 4
44 5 4 5 5 4 5 3
45 3 4 5 5 5 5 5
46 5 5 5 5 5 5 5
47 3 4 3 3 3 3 3
48 3 3 4 4 3 3 3
49 3 3 4 4 3 3 3
50 2 4 4 4 4 3 4
51 3 3 3 3 3 3 3
52 4 4 4 4 4 4 4
53 4 5 4 4 4 4 4
54 3 4 4 4 4 4 3
55 4 3 4 4 4 3 3
56 4 4 4 4 3 4 3
57 3 5 5 4 4 4 4
58 4 4 4 4 4 4 4
59 4 4 5 5 4 5 5
60 4 4 4 4 3 3 3
61 4 4 4 4 4 4 4
62 4 4 4 4 4 5 3
63 4 5 4 5 5 4 5
64 4 4 5 4 4 5 3
65 5 5 5 5 5 4 4
66 1 1 1 1 1 1 1
67 4 5 3 4 4 5 4
68 5 5 5 5 5 5 5
69 4 5 5 5 3 4 3
70 4 5 5 5 5 5 4
71 4 3 5 5 5 5 4
72 4 5 5 4 3 5 3
73 5 5 5 5 5 4 4
74 4 4 5 5 4 5 5
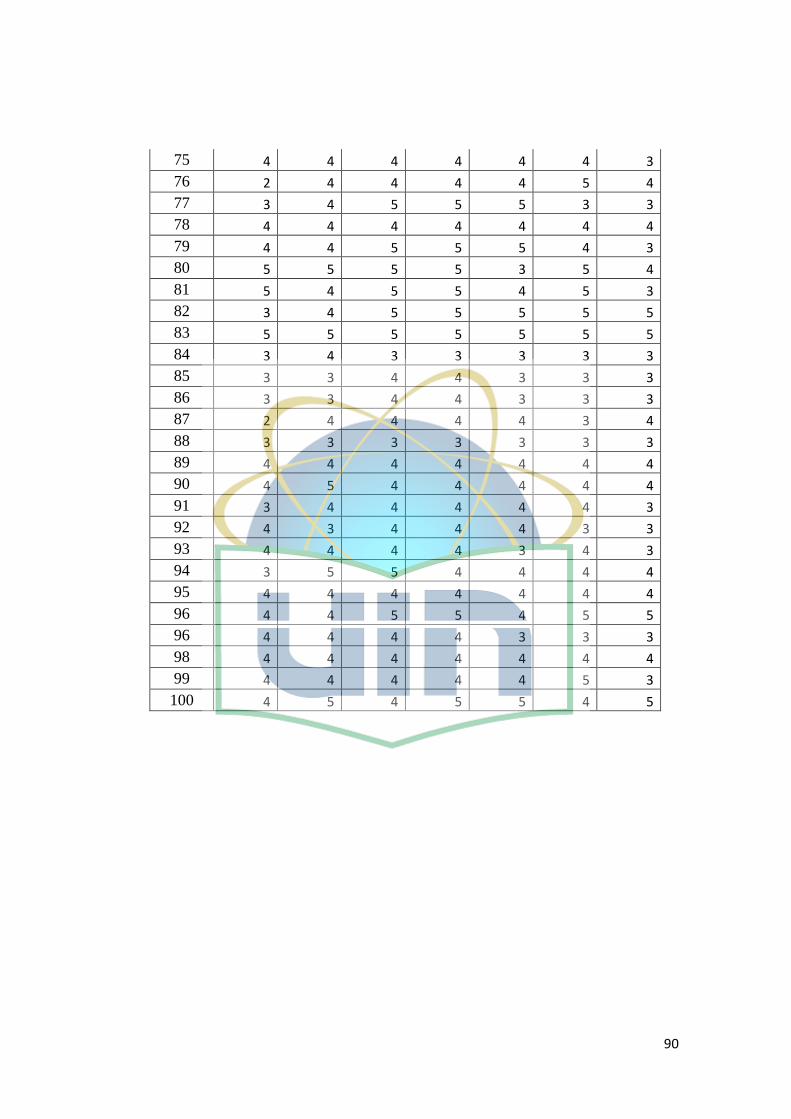
90
75 4 4 4 4 4 4 3
76 2 4 4 4 4 5 4
77 3 4 5 5 5 3 3
78 4 4 4 4 4 4 4
79 4 4 5 5 5 4 3
80 5 5 5 5 3 5 4
81 5 4 5 5 4 5 3
82 3 4 5 5 5 5 5
83 5 5 5 5 5 5 5
84 3 4 3 3 3 3 3
85 3 3 4 4 3 3 3
86 3 3 4 4 3 3 3
87 2 4 4 4 4 3 4
88 3 3 3 3 3 3 3
89 4 4 4 4 4 4 4
90 4 5 4 4 4 4 4
91 3 4 4 4 4 4 3
92 4 3 4 4 4 3 3
93 4 4 4 4 3 4 3
94 3 5 5 4 4 4 4
95 4 4 4 4 4 4 4
96 4 4 5 5 4 5 5
96 4 4 4 4 3 3 3
98 4 4 4 4 4 4 4
99 4 4 4 4 4 5 3
100 4 5 4 5 5 4 5
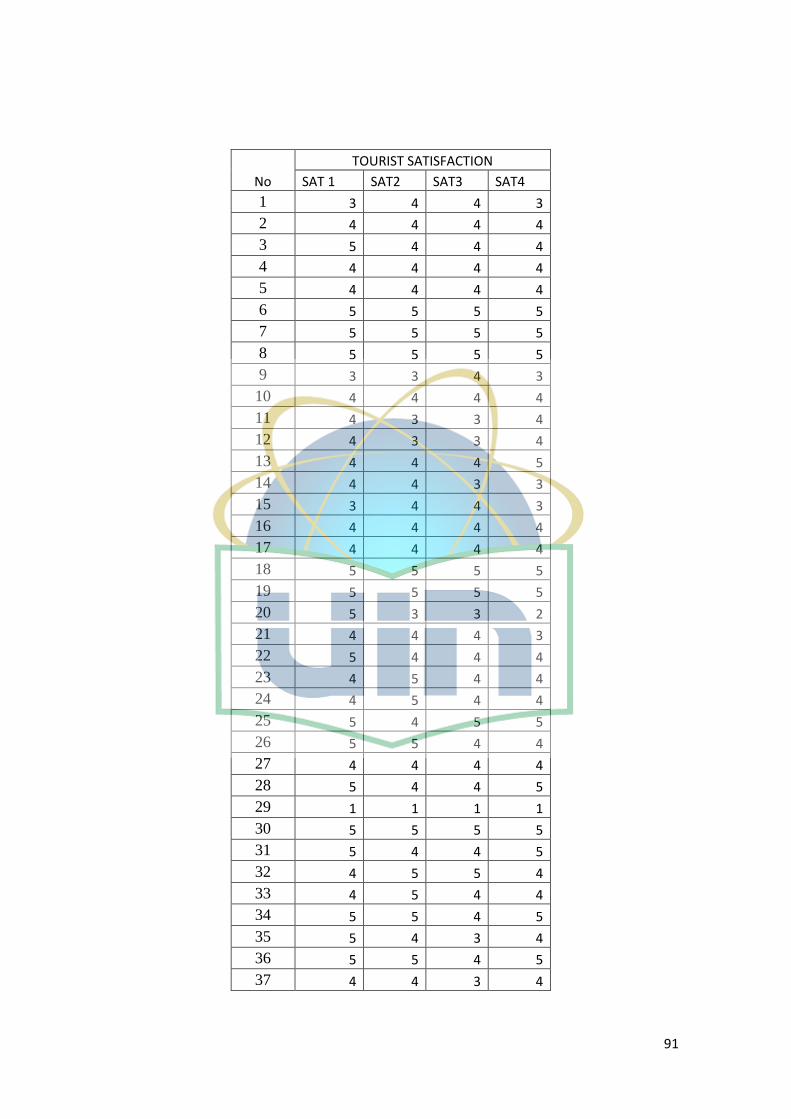
91
No
TOURIST SATISFACTION
SAT 1 SAT2 SAT3 SAT4
1 3 4 4 3
2 4 4 4 4
3 5 4 4 4
4 4 4 4 4
5 4 4 4 4
6 5 5 5 5
7 5 5 5 5
8 5 5 5 5
9 3 3 4 3
10 4 4 4 4
11 4 3 3 4
12 4 3 3 4
13 4 4 4 5
14 4 4 3 3
15 3 4 4 3
16 4 4 4 4
17 4 4 4 4
18 5 5 5 5
19 5 5 5 5
20 5 3 3 2
21 4 4 4 3
22 5 4 4 4
23 4 5 4 4
24 4 5 4 4
25 5 4 5 5
26 5 5 4 4
27 4 4 4 4
28 5 4 4 5
29 1 1 1 1
30 5 5 5 5
31 5 4 4 5
32 4 5 5 4
33 4 5 4 4
34 5 5 4 5
35 5 4 3 4
36 5 5 4 5
37 4 4 3 4
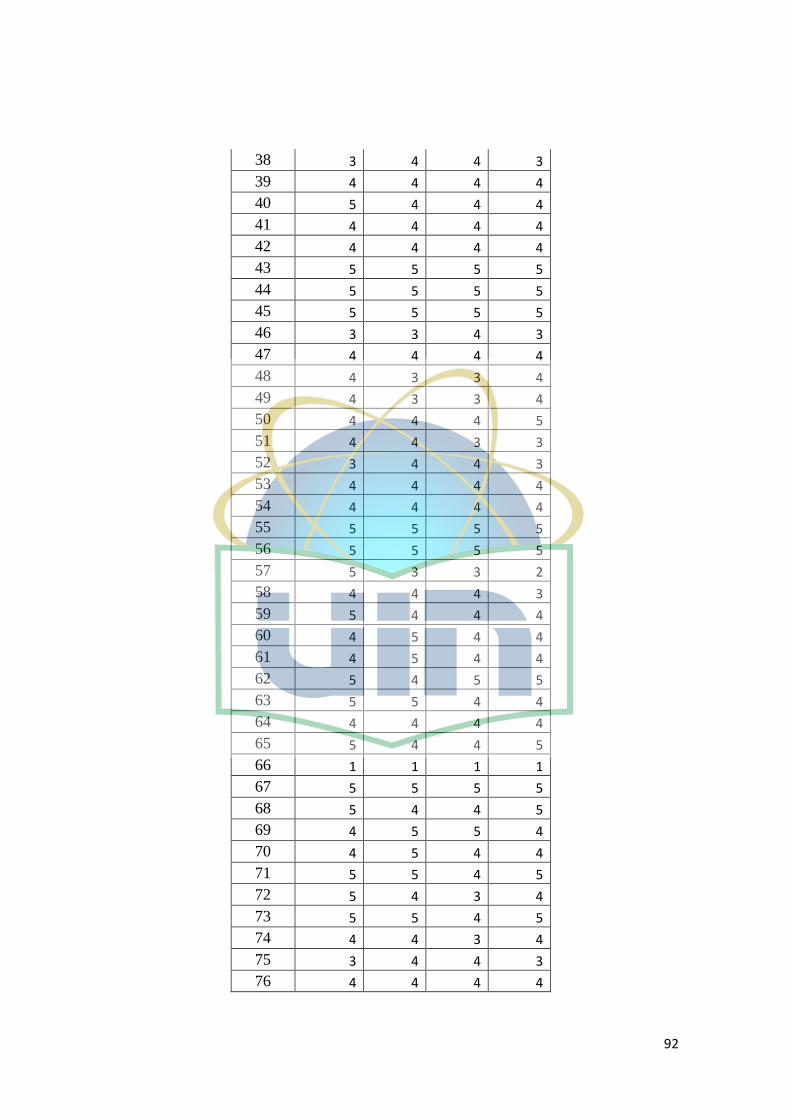
92
38 3 4 4 3
39 4 4 4 4
40 5 4 4 4
41 4 4 4 4
42 4 4 4 4
43 5 5 5 5
44 5 5 5 5
45 5 5 5 5
46 3 3 4 3
47 4 4 4 4
48 4 3 3 4
49 4 3 3 4
50 4 4 4 5
51 4 4 3 3
52 3 4 4 3
53 4 4 4 4
54 4 4 4 4
55 5 5 5 5
56 5 5 5 5
57 5 3 3 2
58 4 4 4 3
59 5 4 4 4
60 4 5 4 4
61 4 5 4 4
62 5 4 5 5
63 5 5 4 4
64 4 4 4 4
65 5 4 4 5
66 1 1 1 1
67 5 5 5 5
68 5 4 4 5
69 4 5 5 4
70 4 5 4 4
71 5 5 4 5
72 5 4 3 4
73 5 5 4 5
74 4 4 3 4
75 3 4 4 3
76 4 4 4 4
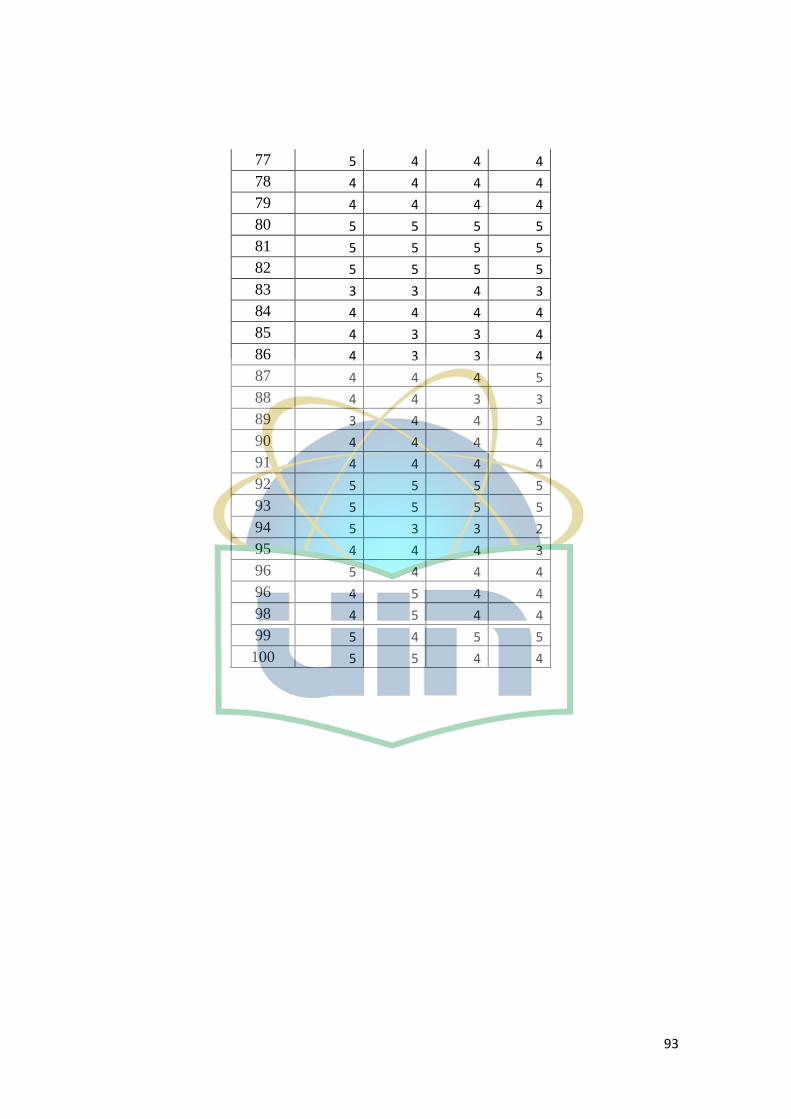
93
77 5 4 4 4
78 4 4 4 4
79 4 4 4 4
80 5 5 5 5
81 5 5 5 5
82 5 5 5 5
83 3 3 4 3
84 4 4 4 4
85 4 3 3 4
86 4 3 3 4
87 4 4 4 5
88 4 4 3 3
89 3 4 4 3
90 4 4 4 4
91 4 4 4 4
92 5 5 5 5
93 5 5 5 5
94 5 3 3 2
95 4 4 4 3
96 5 4 4 4
96 4 5 4 4
98 4 5 4 4
99 5 4 5 5
100 5 5 4 4
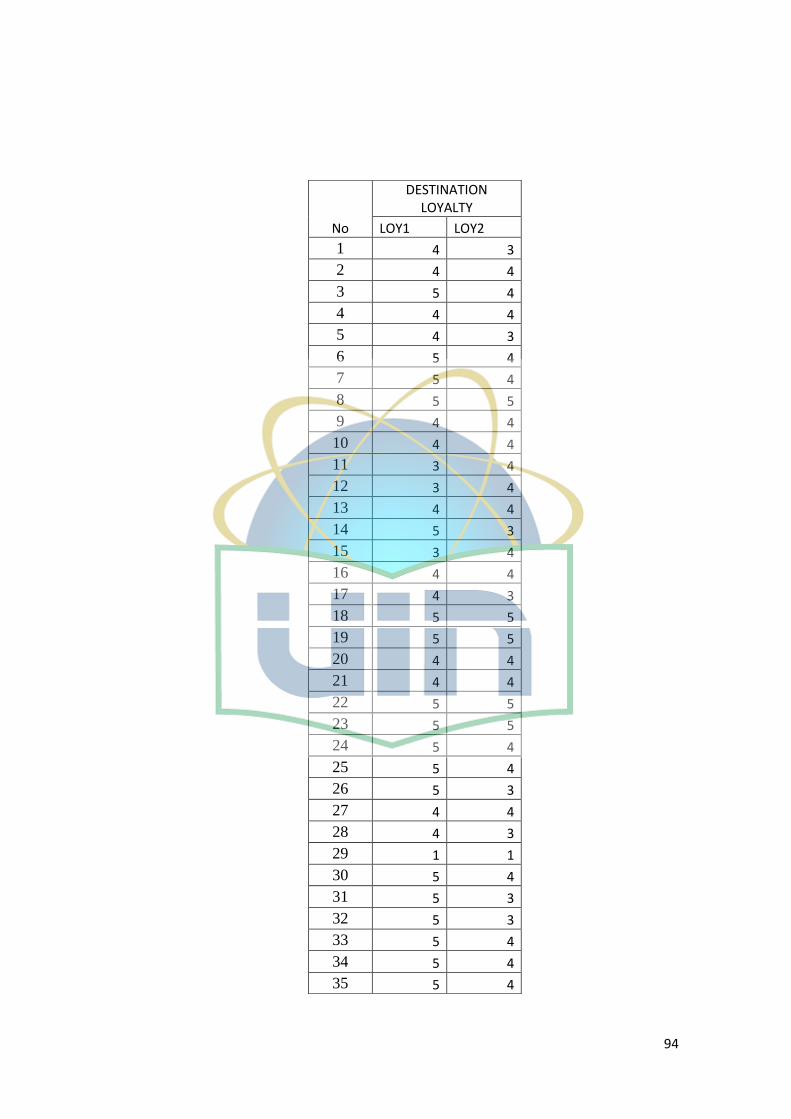
94
No
DESTINATION LOYALTY
LOY1 LOY2
1 4 3
2 4 4
3 5 4
4 4 4
5 4 3
6 5 4
7 5 4
8 5 5
9 4 4
10 4 4
11 3 4
12 3 4
13 4 4
14 5 3
15 3 4
16 4 4
17 4 3
18 5 5
19 5 5
20 4 4
21 4 4
22 5 5
23 5 5
24 5 4
25 5 4
26 5 3
27 4 4
28 4 3
29 1 1
30 5 4
31 5 3
32 5 3
33 5 4
34 5 4
35 5 4
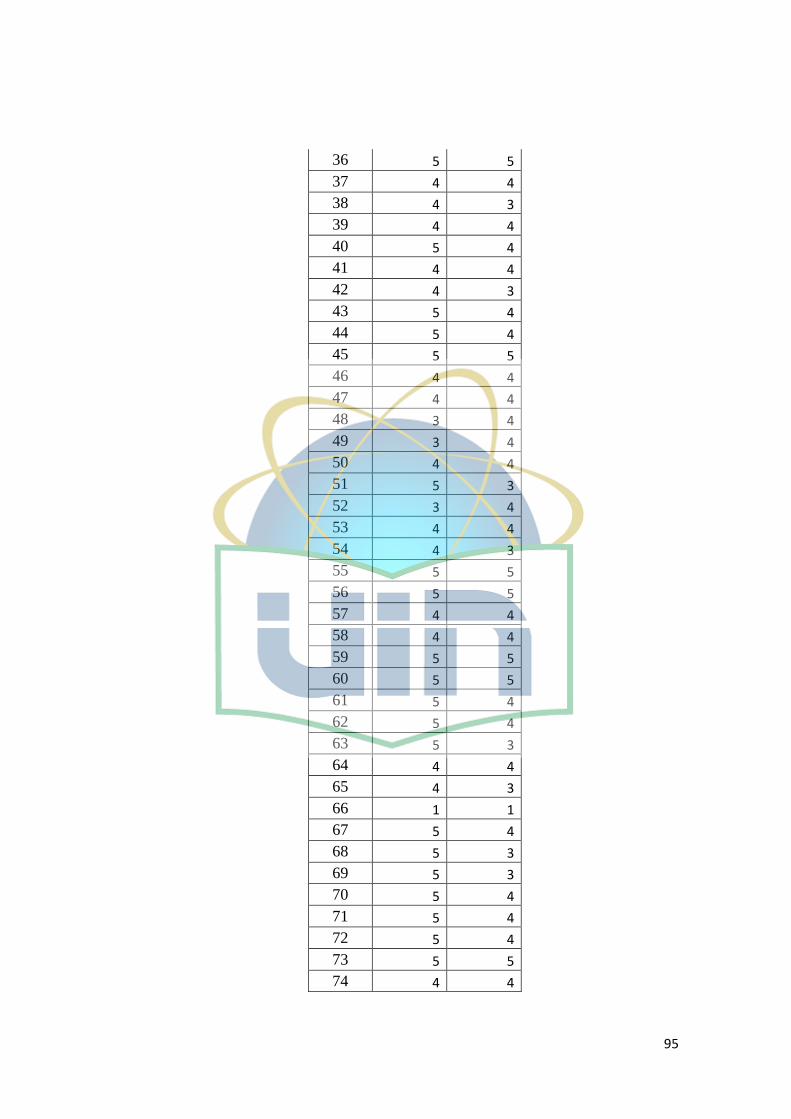
95
36 5 5
37 4 4
38 4 3
39 4 4
40 5 4
41 4 4
42 4 3
43 5 4
44 5 4
45 5 5
46 4 4
47 4 4
48 3 4
49 3 4
50 4 4
51 5 3
52 3 4
53 4 4
54 4 3
55 5 5
56 5 5
57 4 4
58 4 4
59 5 5
60 5 5
61 5 4
62 5 4
63 5 3
64 4 4
65 4 3
66 1 1
67 5 4
68 5 3
69 5 3
70 5 4
71 5 4
72 5 4
73 5 5
74 4 4

96
75 4 3
76 4 4
77 5 4
78 4 4
79 4 3
80 5 4
81 5 4
82 5 5
83 4 4
84 4 4
85 3 4
86 3 4
87 4 4
88 5 3
89 3 4
90 4 4
91 4 3
92 5 5
93 5 5
94 4 4
95 4 4
96 5 5
96 5 5
98 5 4
99 5 4
100 5 3
97
BIBLIOGRAPHY
Abdillah, W and HM, Jogiyanto. “Partial Least Square (PLS)”, Andi Publisher,
Yogyakarta, 2015.
Al-hamarneh, Ala and Steiner, Christian. “Islamic Tourism: Rethinking The
Strategies of Tourism Development in Arab after September 11, 2001”,
Comparative Studies of South Asia, Africa, and, Middle East, 2001.
Battour, Mohamed and Ismail, Mohd Nazari. “The Role of Destination Attibutes
in Islamic Tourism”, EDP Science, 2014.
Battour, Mohamed, et.all. “The impact of destination attributes on muslims
tourist's choice”, International Journal of Tourism Research, 2010.
Battour, Mohamed, et.all. “The mediating role of tourist satisfaction: a study of
muslim tourists in Malaysia”, Jurnal of Travel and Tourism Marketing,
2012.
Batta, R.N, “Tourism and The Environment: A Quest For Sustainability”, Indus
Publishing Company, New Delhi, 2000.
Carl McDaniel, J and Gates, R. “Marketing Research Essential”, Wiley Publisher,
2004.
Chen, Li-Ju and Chen, Wei-Peng. “Push-Pull Factors in international birders'
travel”. Tourism Management, 2015.
Crompton, John L, ”Motivations for Pleasure Vacation”, Annals Tourism
Research, 1979.
Donald R.Cooper and Pamela S.Schindler,“Marketing Research”, McGraw-Hill
Publisher. 2006.
Dann, Graham M.S. “Tourist Motivation : An Appraisal”, Annals of Tourism
Research, 1981.
98
Handerson, Joan C. “Islamic Tourism Reviewed”, Tourism Recration Research,
2009.
Heeley, John. “The Definition of Tourism in Great Britain: Does Terminological
Confusion Have to Rule?”, Revue de tourisme, 1980.
Huang, Songshan and Hsu, Cathy H.C. “Effects of Travel Motivation, Past
Experience, Perceived Constraint, and Attitude on Revisit Intention”,
Jounal of Travel Research, 2009.
Husein, Ananda Sabil. “Penelitian Bisnis dan Manajemen Menggunakan Partial
Least Squares (PLS) dengan smartPLS 3.0”, Universitas Brawijaya,
Malang, 2015.
Ismayanti, “Pengantar Pariwisata”, Grasindo, Jakarta, 2011.
Jafari, Jafari and Scott, Neol. “Muslim World and Its Tourism”, 2013.
Jang, SooCheong and Wu, Chi-Mei Emily. “Seniors' travel motivation and the
influential factors: An examination of Taiwaness seniors”, Tourism
Management, 2006.
Joseph F, et.all. “Marketing Research”, McGraw-Hill Publisher. 2003
Kemenpar, “Indonesia Bidik Wisatawan Muslim Mellaui Pengembangan Wisata
Syariah”, accessed Februari, 5, 2017, From:
http://kemenpar.go.id/asp/detil.asp?c=16&id=2447
Kim, Kakyom. “Analysis of Structural Equation Model for student pleasure
Travel Market: Motivation, Involvement, Satisfaction and Destination
Loyalty”. Journal of Travel and Tourism Marketing , 2008.
Kim, Seong-Seop and Lee, Choong-Ki. “Push and Pull Relationship”. Annals of
Tourism Research , 2002.
Kotler, Philip and Armstrong, G. “Principles of Marketing”,Pearson, New Jersey,
2010.
99
Kotler, Philip and Keller, Kevin Lane. “Marketing Management 14th
edition”,
Pearson, England, 2012.
Mehmetoglu, Mehmet. “Examining the relationship between puh and pull factors
through partial least square path modeling”, Advances in Hospitality and
Leisure, 2011.
Miles et al, “Qualitative Data Analysis”, 3rd
edition, SAGE Publishing, USA,
2014.
Meleddu, Marta et.all. “Repeted Behavior and destnation loyalty”, Tourism
Management, 2015.
Oliver, Richard L, “Satisfaction: A behavioral Perspective on The Consumer”, 2nd
Edition, Routledge, USA, 2014.
Ozgen, O and Kurt, S D.“Purchasing behavior of islamic brands : An
experimental Research”, European Marketing Academy, Istanbul, 2013.
Paul Peter, J and Olson, Jerry C. “Consumer Behavior and Marketing
Strategy”,The McGraw-Hill Companies, 2010.
Pew Research Center. “Religious Projection Table”. Retrieved 18 January 2017,
from: http://www.pewforum.org/2015/04/02/religious-projection-table/
Rahman, Muhammad Khalilur. “Motivating factors of Islamic Tourist’s
Destination Loyalty: An Empirical Investigation in Malaysia”, Journal of
Tourism and Hospitality Management, 2014.
Richard L. Oliver, and John E. Swan, “Consumer Perceptions of Interpersonal
Equity and Satisfaction in Transactions: A Field Survey Approach”,
Journal of Marketing, American Marketing Association, 1989.
Robinson, et.all, “Tourism”, CAB International, London, 2013.
100
Sato, Shintaro et.all. “Adventure tourism motivation and Destination Loyalty: A
comparison of decision and non decision makers”. Journal of Destination
Marketing & Management, 2016.
Scoot, et.all,”Tourism and Climate Change: Impacts, Adaptation and Mitigation”
Routledge, USA and Canada, 2012
Sharon M. Ravitch and Mattew Riggan, “Reason and Rigor: how conceptual
framworks guide research”, 2nd
edition, SAGE Publications, USA, 2016.
Shanks, N. H. “Management and Motivation”, Jones and Bartlett Publishers.
Smith, R. “Japan Opens Up to Halal Tourism”, The National, Retrieved 18
January 2017, from: http://m.thenational.ae/business/travel-tourism/japan-
opens-up-to-halal-tourism
Sofyani, Hafiez. “Modul Praktik Partial Least Square (PLS)”, Universitas
Muhammadiyah Yogyakarta, Accessed May 10 2017, From:
http://docplayer.info/44073699-modul-praktik-partial-least-pls.html
Sriprasert P, et.all. “Understanding Behavior and Needs of Halal Tourism in
Andaman Gulf of Thailand: A Case of Asian Muslim”, Journal of
Advanced Management Science, 2014.
Staphen. P Robbins and T. A Judge. “Organizational Behavior”, Pearson, 2013.
Um, Seoho et.all. “Antecedents of Revisit Intention”, Annals of Tourism Research,
2006.
UNWTO, “Tourism Highlight”, 2016.
Uysal, Muzaffer, et.all. “Measuring tourist satisfaction by attribute and
motivation: The case of a nature-based resort”, Journal of Vacation
Marketing , 2006.
World Travel and Tourism Council, “Travel and Tourism Economic impact 2015:
Indonesia”, 2015.
101
Tugberk Ugurlu. “Definition of Tourism according to UNWTO”, Retrieved 12
March 2017, from: http://www.tugberkugurlu.com/archive/definition-of-
tourism-unwto-definition-of-tourism-what-is-tourism
Uysal, Muzzafer and Jurowski, Claudia,“Testing the Push and Pull factors”.
Annals of Tourism Research, 1994.
Yamin, Sofyan and Kurniawan, Heri. “Partial Least Square Path Modeling”,
Salemba Infotek Publisher, Jakarta, 2011.
Yoon, Yooshik and Uysal, Muzaffer, “An Examination of The Effects of
Motivation and satisfaction on destination loyalty : a structural model”.
Tourism Management, 2005.
Yuksel, Atila and Yuksel, Fisun. “Tourist satisfaction and complaining behavior:
measurement, and management issues in the tourism and hospitality
industry”, Nova Science Publishers, New York, 2008.
Zaithaml, V, et.all. “Services Marketing”, Mc Graw Hill, 2009.