The MOL Story A Journey with IIOT, Advanced Analytics ... · Title: Best Practices for the OSIsoft...
36
© Copyright 2016 OSIsoft, LLC HRS 2016 - IIOT, Advanced Analytics, & “Big Data” Forum The MOL Story A Journey with IIOT, Advanced Analytics, & Big Data $1B EBITDA enabled by Strategic use of the PI System and PI AF as an OT Data Model Craig Harclerode – Global O&G Industry Principal, OSIsoft
Transcript of The MOL Story A Journey with IIOT, Advanced Analytics ... · Title: Best Practices for the OSIsoft...

© Copyright 2016 OSIsoft, LLCUSERS CONFERENCE 2016HRS 2016 - IIOT, Advanced Analytics, & “Big Data” Forum
The MOL Story
A Journey with IIOT, Advanced
Analytics, & Big Data
$1B EBITDA enabled by
Strategic use of the PI System
and PI AF as an OT Data Model
Craig Harclerode – Global O&G Industry Principal, OSIsoft

© Copyright 2016 OSIsoft, LLCUSERS CONFERENCE 2016
Contact Information
Tibor Komróczki
Process Information & Automation leader
MOL Plc.
22
Team of 16 Process Information & Automation Engineers (APC/RTO & PI Systems)
Reports to the Technology & Development Manager
Distributed in the 6 plant locations
IT in a supportive role…minimally involved – Operating Systems and SQL Servers
© Copyright 2016 OSIsoft, LLCUSERS CONFERENCE 2016
Outline
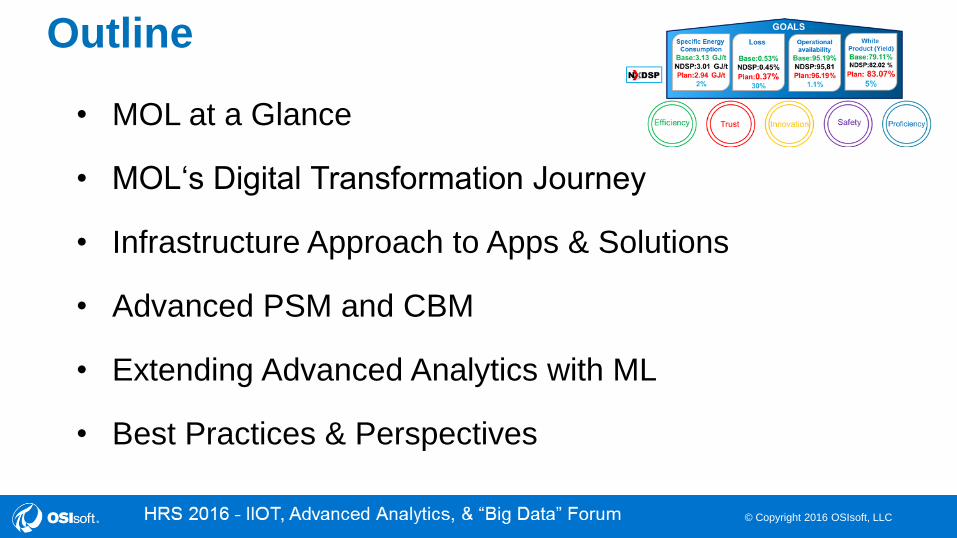
• MOL at a Glance
• MOL‘s Digital Transformation Journey
• Infrastructure Approach to Apps & Solutions
• Advanced PSM and CBM
• Extending Advanced Analytics with ML
• Best Practices & Perspectives
© Copyright 2016 OSIsoft, LLCUSERS CONFERENCE 2016
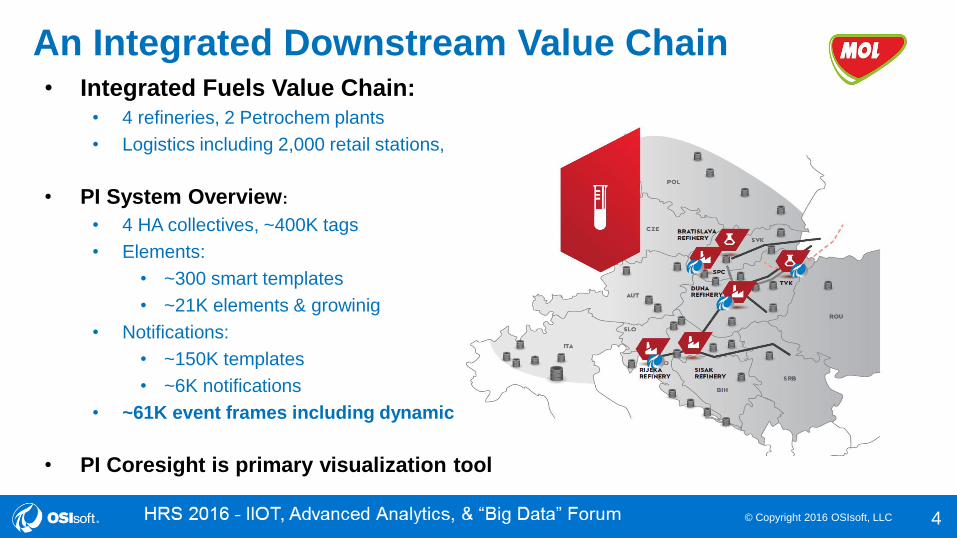
An Integrated Downstream Value Chain• Integrated Fuels Value Chain:
• 4 refineries, 2 Petrochem plants
• Logistics including 2,000 retail stations,
• PI System Overview:
• 4 HA collectives, ~400K tags
• Elements:
• ~300 smart templates
• ~21K elements & growinig
• Notifications:
• ~150K templates
• ~6K notifications
• ~61K event frames including dynamic
• PI Coresight is primary visualization tool
4
© Copyright 2016 OSIsoft, LLCUSERS CONFERENCE 2016 5
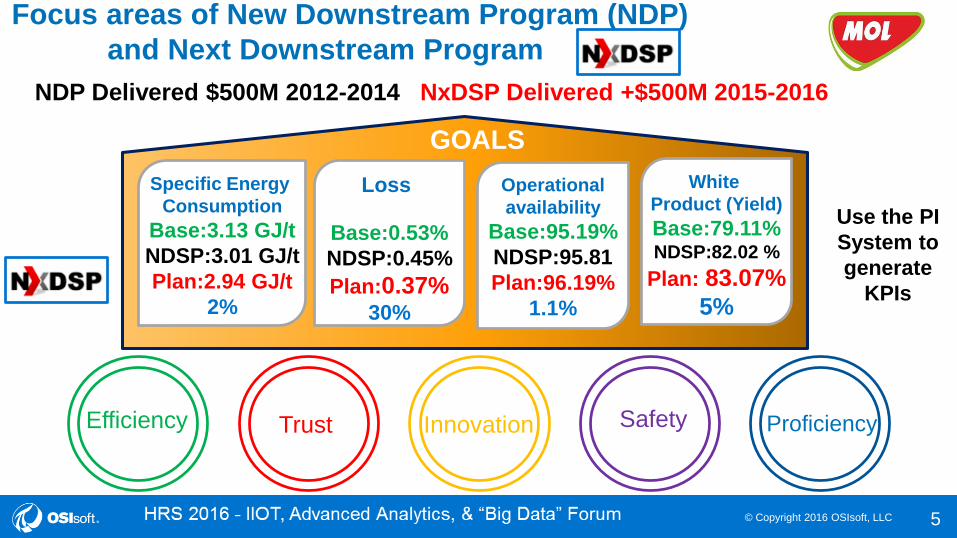
Focus areas of New Downstream Program (NDP)
and Next Downstream Program
Specific Energy
Consumption
Base:3.13 GJ/t
NDSP:3.01 GJ/t
Plan:2.94 GJ/t
2%
Operational
availability
Base:95.19%
NDSP:95.81
Plan:96.19%
1.1%
Loss
Base:0.53%
NDSP:0.45%
Plan:0.37%30%
White
Product (Yield)
Base:79.11%NDSP:82.02 %
Plan: 83.07%
5%
GOALS
Efficiency Trust Innovation Safety Proficiency
NDP Delivered $500M 2012-2014 NxDSP Delivered +$500M 2015-2016
Use the PI
System to
generate
KPIs
© Copyright 2016 OSIsoft, LLCUSERS CONFERENCE 2016
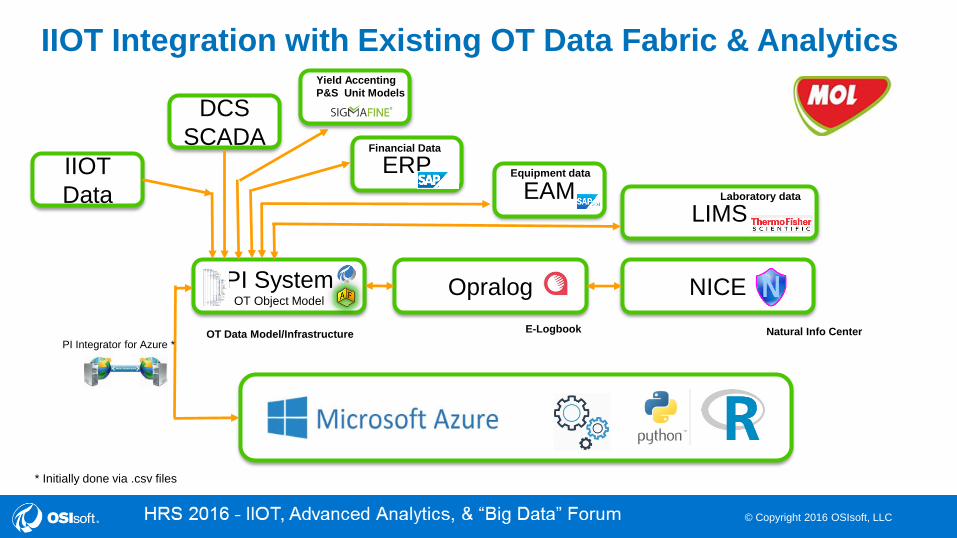
IIOT Integration with Existing OT Data Fabric & Analytics
PI SystemOT Object Model
Opralog NICE
LIMSLaboratory data
Natural Info CenterE-LogbookOT Data Model/Infrastructure
PI Integrator for Azure *
ERPIIOT
Data
DCS
SCADA
Yield Accenting
P&S Unit Models
Financial Data
EAMEquipment data
* Initially done via .csv files

© Copyright 2016 OSIsoft, LLCUSERS CONFERENCE 2016
Picture / Image
RESULTSCHALLENGE SOLUTION
7
COMPANY and GOAL
Company
Logo
7
Delivered $1B Business Value from
Digital Transformation in last 5 years
Delivered $1B in EBITDA by a business transformation
enabled by a digital transformation leveraging the
PI System as a strategic OT data infrastructure for
advanced predictive and proactive analytics
• Increasing competitive environment in Eastern Europe
• Variable cracked spread
• Diverse culture across 8 countries
• Low use of data and analytics
• Increased use of opportunity crudes
• Evolved from Tag to PI AF based infrastructure across the MOL fuels value chain
• Normalized tag, asset, UOM, and time using PI AF as an abstraction layer
• Used data and information to support business transformation
• Leading Process Safety Management
• 1st Quartile in energy, yields, loss, and
utilization
• OT infrastructure enabling time to value
and value momentum with advanced
analytics including machine learning
Operational availability
Deliver strategic business value to respond to increasing competitive threats; Change a diverse culture to “act as one” with Operational Excellence & continuous improvement enablement
Evolved the use of the PI System as a tag based historian to an asset based infrastructure to support cultural change and data based decision making and support with advanced predictive and proactive analytics.
Delivered on the MOL Downstream business
transformation goal of $1B and more
importantly, a sustainable cultural change based
on data and information to drive operational
excellence going forward into he 21st century.

© Copyright 2016 OSIsoft, LLCUSERS CONFERENCE 2016
Digital Transformation Journey
8
© Copyright 2016 OSIsoft, LLCUSERS CONFERENCE 2016
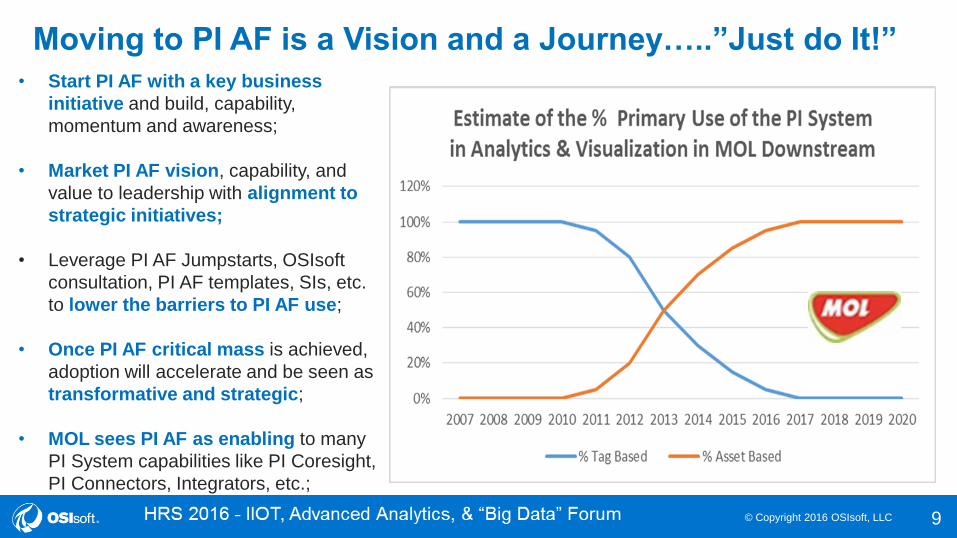
Moving to PI AF is a Vision and a Journey…..”Just do It!”
9
• Start PI AF with a key business
initiative and build, capability,
momentum and awareness;
• Market PI AF vision, capability, and
value to leadership with alignment to
strategic initiatives;
• Leverage PI AF Jumpstarts, OSIsoft
consultation, PI AF templates, SIs, etc.
to lower the barriers to PI AF use;
• Once PI AF critical mass is achieved,
adoption will accelerate and be seen as
transformative and strategic;
• MOL sees PI AF as enabling to many
PI System capabilities like PI Coresight,
PI Connectors, Integrators, etc.;

© Copyright 2016 OSIsoft, LLCUSERS CONFERENCE 2016
MOL Downstream Integrated OT Data Model
10
LogisticsValue Chain
Normalized & Standard OT Data Models
Danube Bratislava Rijeka Sisak Danube Slovnaft
Refineries Petrochemicals

© Copyright 2016 OSIsoft, LLCUSERS CONFERENCE 2016 11
Digital Transformation of New & Next Downstream Program
Operational Availability
Maintenance Efficiency
Energy Efficiency
Yield improvement
• Energy monitoring and management
• Energy KPI breakdown
• Column energy efficiency
dashboard
• Hydrogen, utilities - energy balances
• Flaring
Energy
• Operating envelopes
• NG (natural gas) and fuel
gas demand forecasting
• Normal mode of control loops
• APC control monitoring
• Diesel sulphur optimization
• Coker yield optimization
Operational
Optimization
• Interlock statuses
• Integrity Operating Windows
• Corrosion control (HTHA)
• Alarm management
• Preventing coke steam
eruption
Safety & Asset
integrity (PSM) • Product quality
• Analyser reliability (Argus)
• Yield Accounting via
Sigmafine (PI AF based)
Yields
Asset Reliability from
Proactive & Predictive
Advanced Analytics
• SAP PM Integration
• Health Score in PI AF
• CBM on all rotating equipment
• PSA – Pressure Swing Adsorbers
• Chillers
• Heat Exchangers
• Electrical Infrastructure

© Copyright 2016 OSIsoft, LLCUSERS CONFERENCE 2016
An Infrastructure Investment Approach - “OT Data Utility”
Advanced CBM
Advanced PSM
Yields & HCL
Machine Learning
© Copyright 2016 OSIsoft, LLCUSERS CONFERENCE 2016 13
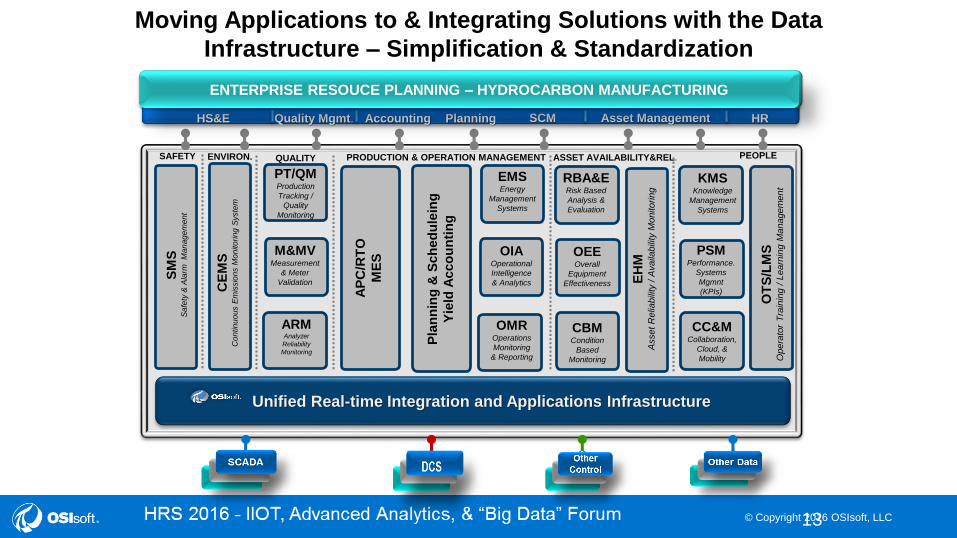
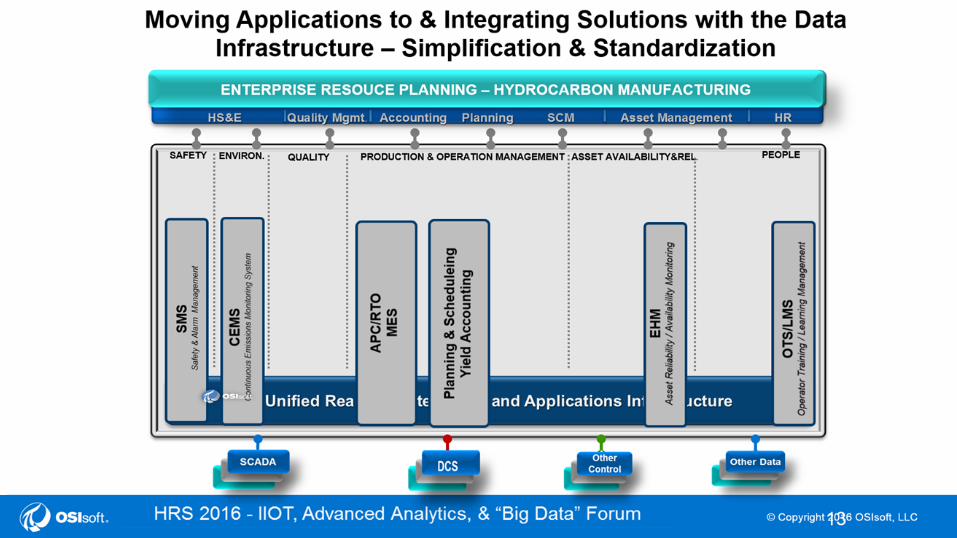
Accounting HRAsset ManagementQuality Mgmt. SCMPlanningHS&E
ENTERPRISE RESOURCE PLANNING- Exploration and Production
Unified Real-time Integration and Applications Infrastructure
SM
SS
afe
ty &
Ala
rm M
an
ag
em
en
t
SAFETY
OT
S/L
MS
Opera
tor
Tra
inin
g /
Learn
ing M
anagem
en
t
PEOPLEENVIRON.
CE
MS
Con
tin
uo
us E
mis
sio
ns M
on
ito
rin
g S
yste
m
PT/QMProduction
Tracking /
Quality
Monitoring
M&MVMeasurement
& Meter
Validation
ARMAnalyzer
Reliability
Monitoring
QUALITY
EMSEnergy
Management
Systems
OIAOperational
Intelligence
& Analytics
OMROperations
Monitoring
& Reporting
PRODUCTION & OPERATION MANAGEMENT
RBA&ERisk Based
Analysis &
Evaluation
OEEOverall
Equipment
Effectiveness
CBMCondition
Based
Monitoring
EH
MA
sset
Relia
bili
ty / A
vaila
bili
ty M
onitoring
ASSET AVAILABILITY&REL.
Moving Applications to & Integrating Solutions with the Data
Infrastructure – Simplification & Standardization
KMSKnowledge
Management
Systems
CC&MCollaboration,
Cloud, &
Mobility
PSMPerformance.
Systems
Mgmnt
(KPIs)
Pla
nn
ing
& S
ch
ed
ule
ing
Yie
ld A
cco
un
tin
g
ENTERPRISE RESOUCE PLANNING – HYDROCARBON MANUFACTURING
AP
C/R
TO
ME
S
© Copyright 2016 OSIsoft, LLCUSERS CONFERENCE 2016

© Copyright 2016 OSIsoft, LLCUSERS CONFERENCE 2016
Production (Refinery & Petchem ) & Logistic standardization
15
Leverage of the PI System as an Integration & Applications Infrastructure
to Simplify & Standardize the Applications & Solutions Portfolio
Past State <2014 Current State 2015+
© Copyright 2016 OSIsoft, LLCUSERS CONFERENCE 2016
© Copyright 2016 OSIsoft, LLCUSERS CONFERENCE 2016
ng ng
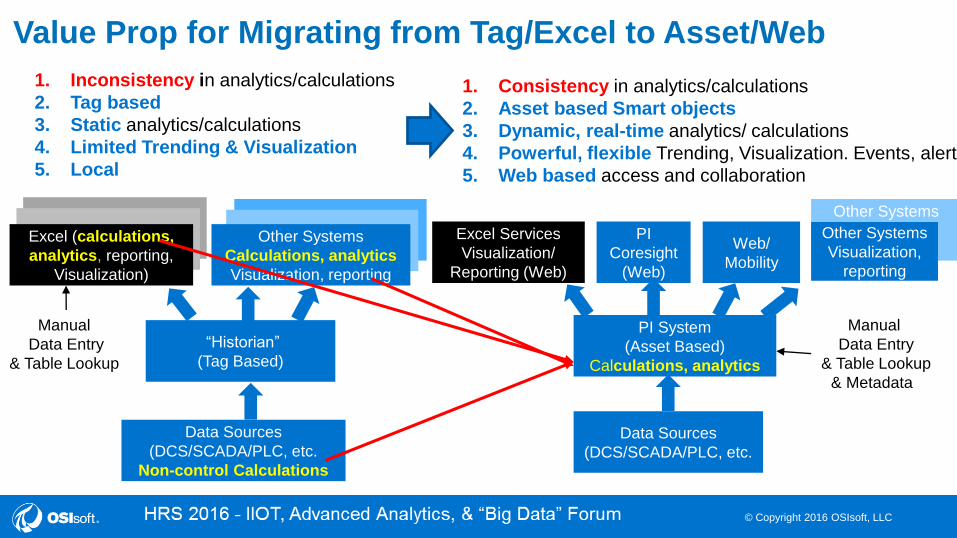
Value Prop for Migrating from Tag/Excel to Asset/Web
Data Sources
(DCS/SCADA/PLC, etc.
Non-control Calculations
“Historian”
(Tag Based)
Excel (calculations,
analytics, reporting,
Visualization)
Other Systems
Calculations, analytics
Visualization, reporting
1. Inconsistency in analytics/calculations
2. Tag based
3. Static analytics/calculations
4. Limited Trending & Visualization
5. Local
Manual
Data Entry
& Table Lookup
Other Systems
Visualization,
reporting
Data Sources
(DCS/SCADA/PLC, etc.
PI System
(Asset Based)
Calculations, analytics
Excel Services
Visualization/
Reporting (Web)
PI
Coresight
(Web)
Web/
Mobility
Manual
Data Entry
& Table Lookup
& Metadata
Other Systems
Visualization,
reporting
1. Consistency in analytics/calculations
2. Asset based Smart objects
3. Dynamic, real-time analytics/ calculations
4. Powerful, flexible Trending, Visualization. Events, alerts
5. Web based access and collaboration
© Copyright 2016 OSIsoft, LLCUSERS CONFERENCE 2016
Examples
18
© Copyright 2016 OSIsoft, LLCUSERS CONFERENCE 2016 19
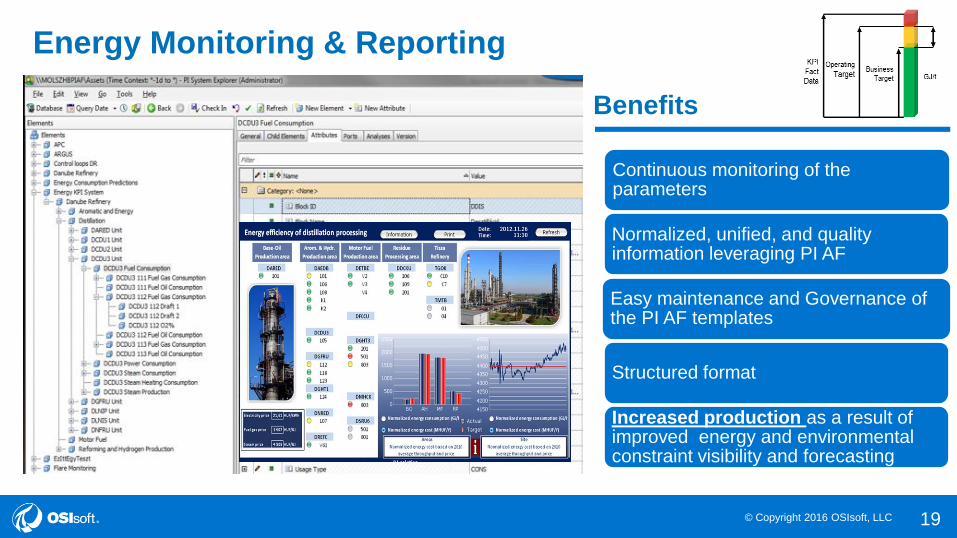
Energy Monitoring & Reporting
Benefits
Continuous monitoring of the parameters
Normalized, unified, and quality information leveraging PI AF
Easy maintenance and Governance of the PI AF templates
Structured format
Increased production as a result of improved energy and environmental constraint visibility and forecasting

© Copyright 2016 OSIsoft, LLCUSERS CONFERENCE 2016
PI Event Frames – Energy Over consumption events
20
© Copyright 2016 OSIsoft, LLCUSERS CONFERENCE 2016 21
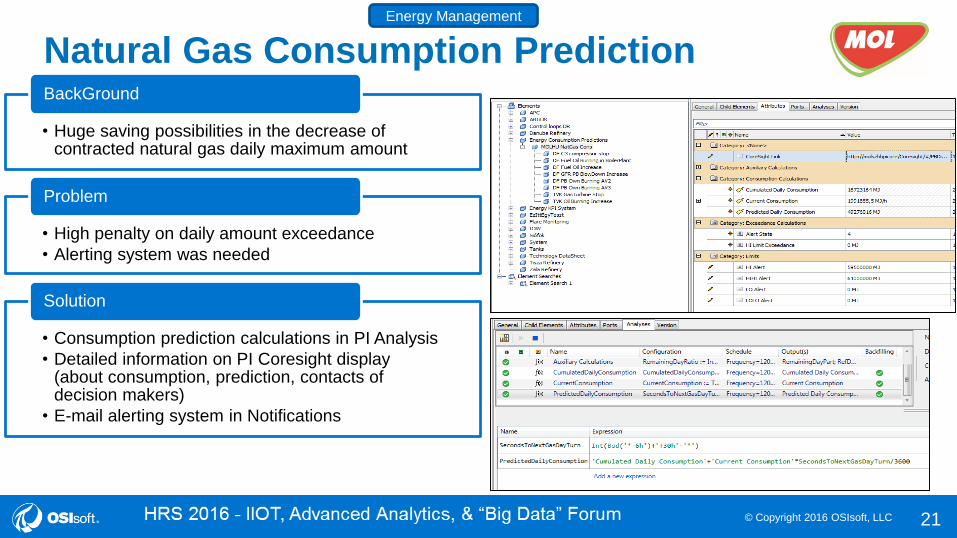
Natural Gas Consumption Prediction
• Huge saving possibilities in the decrease of contracted natural gas daily maximum amount
BackGround
• High penalty on daily amount exceedance
• Alerting system was needed
Problem
• Consumption prediction calculations in PI Analysis
• Detailed information on PI Coresight display (about consumption, prediction, contacts of decision makers)
• E-mail alerting system in Notifications
Solution
Energy Management

© Copyright 2016 OSIsoft, LLCUSERS CONFERENCE 2016
Advanced PSM & CBM
22
© Copyright 2016 OSIsoft, LLCUSERS CONFERENCE 2016
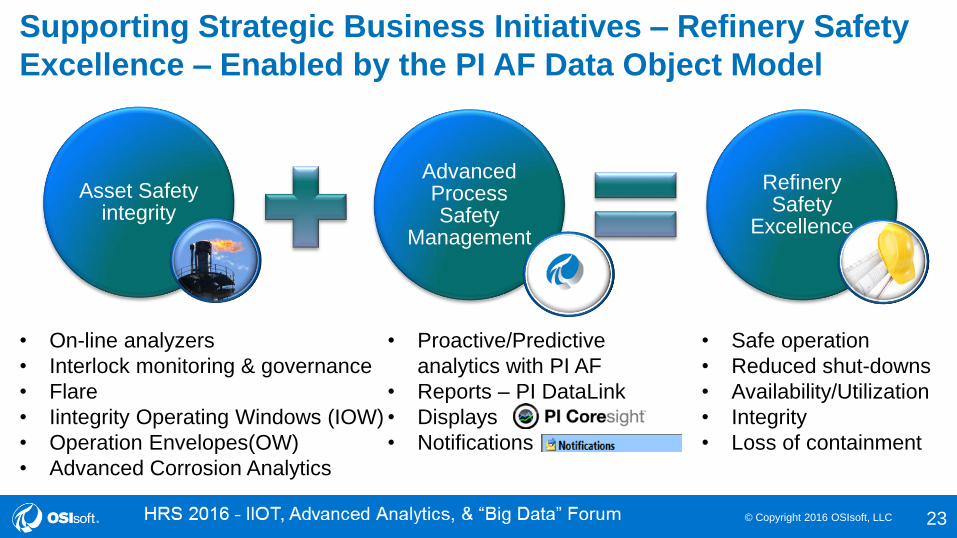
Supporting Strategic Business Initiatives – Refinery Safety
Excellence – Enabled by the PI AF Data Object Model
23
Asset Safety integrity
Advanced Process Safety
Management
Refinery Safety
Excellence
• On-line analyzers
• Interlock monitoring & governance
• Flare
• Iintegrity Operating Windows (IOW)
• Operation Envelopes(OW)
• Advanced Corrosion Analytics
• Proactive/Predictive
analytics with PI AF
• Reports – PI DataLink
• Displays
• Notifications
• Safe operation
• Reduced shut-downs
• Availability/Utilization
• Integrity
• Loss of containment
© Copyright 2016 OSIsoft, LLCUSERS CONFERENCE 2016
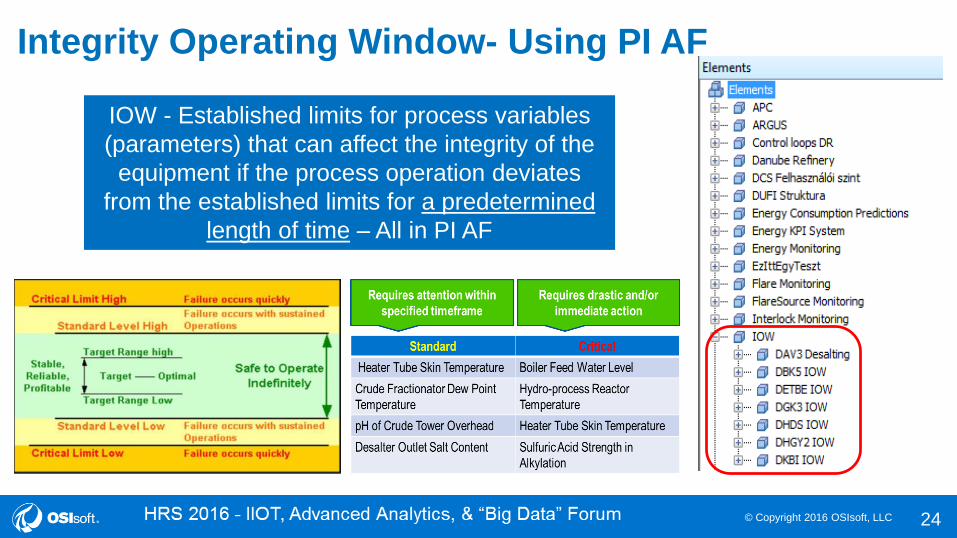
Integrity Operating Window- Using PI AF
IOW - Established limits for process variables
(parameters) that can affect the integrity of the
equipment if the process operation deviates
from the established limits for a predetermined
length of time – All in PI AF
24
© Copyright 2016 OSIsoft, LLCUSERS CONFERENCE 2016
Advanced PSM
– High Temperature Hydrogen Attack
(HTHA) – Hydrogen Embrittlement
25

© Copyright 2016 OSIsoft, LLCUSERS CONFERENCE 2016 26
• High Temperature Hydrogen Attack (HTHA)
• fx (metallurgy, temperature, hydrogen partial pressure(PP), length of exposure
Developed PI AF template that:
• Determine partial pressure
• Attribute of pipe class
• Temperature and length of exposure limits
• Total time above Temp and PP
• Alerts/notification/event frame
• Tested and rolled out in 6 units < 1 week
• All plants in 2015 < 2 months – 50+ nodes
Improving Asset Integrity with Advanced Corrosion Analytics
© Copyright 2016 OSIsoft, LLCUSERS CONFERENCE 2016
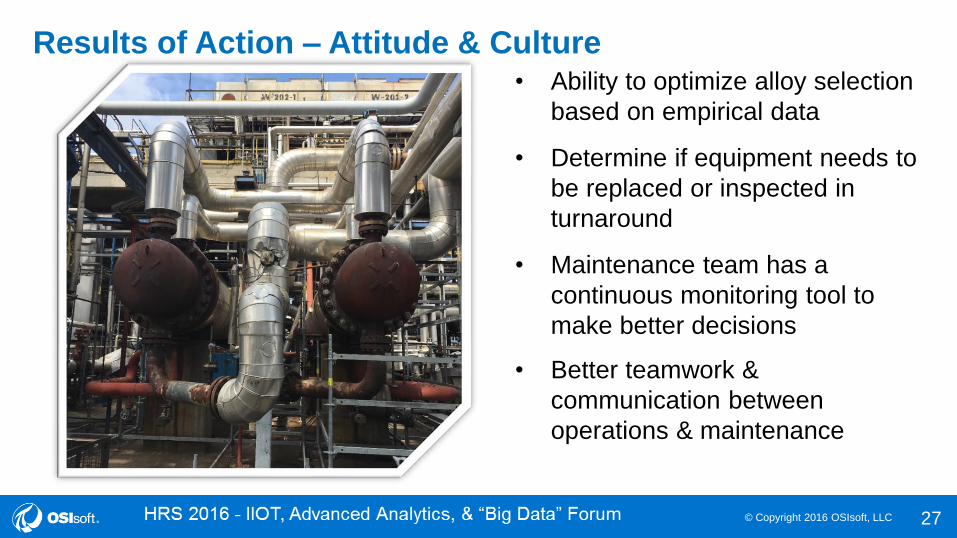
Results of Action – Attitude & Culture
27
• Ability to optimize alloy selection
based on empirical data
• Determine if equipment needs to
be replaced or inspected in
turnaround
• Maintenance team has a
continuous monitoring tool to
make better decisions
• Better teamwork &
communication between
operations & maintenance

© Copyright 2016 OSIsoft, LLCUSERS CONFERENCE 2016
Challenge – Critical Availability Problems
28
• Hydrogen Production Plants (HPP) are critical units in the refinery
• Pressure Swing Adsorbers (PSA) are critical equipments in unit operation
• Cyclic operation – Heavy load on valves (9-10 open-close hourly)
• $1.2M loss in three years due to PSA valve failures
• UPTIME program: 97 % Operational availability

© Copyright 2016 OSIsoft, LLCUSERS CONFERENCE 2016
Architecture – Roles of components
29
PI Server
• Process database
• Online analysis of process information
• Calculation of asset health– Asset condition– Running hours– Performance
• User Interface– PI Coresight– PI DataLink
SAP PM
• Technical database
• Management of
maintenance processes
• Creation of work orders or
notifications
• Trigger maintenance
strategies based on asset
health
Connection
(WebLogic)
Calculated asset
health
Maintenance
related information

© Copyright 2016 OSIsoft, LLCUSERS CONFERENCE 2016
PI AF Structure
30
• Structure for calculation:
– Adsorber
– Valve positions
– Valves
• Structure for moving data into SAP:
– Adsorber
– Measuring Points
Adsorber
Valve
Position
Valve
Measuring
Point

© Copyright 2016 OSIsoft, LLCUSERS CONFERENCE 2016
Extending Advanced Analytics with ML
31

© Copyright 2016 OSIsoft, LLCUSERS CONFERENCE 2016
Picture / Image
RESULTSCHALLENGE SOLUTION
32
COMPANY and GOAL
Company
Logo
32
Improving Sulfur in Diesel Prediction
from Azure Machine Learning
Replace RTO and offline modeling with Azure based Machine Learning to improve the prediction and optimization of sulfur in diesel in a diesel hydrotreating unit
• RTO systems were expensive and difficult to maintain
• Off line models were to slow
• Lost benefits of ~$600K/yr in 4 units
• Growing potential loss from decreased specifications of sulfur in diesel
• Analysis of data to determine the control variables which has the highest effect on sulfur content
• Determine the desired intervals for each variable to control the output sulfur content
• Advanced model to (time window based) to predict the changes of the sulfur based on the changes in the control variables
• Enhanced the maintenance of existing
empirical inferential calculations
(Other Hydrotreater Sulfur content, Cloud
point, Pensky Martens FP, Gasoline EBP)
• Enabled the determination of new
empirical inferential calculations (E.g. NHT,
Amine systems….)
Off line and rigorous on line RTO models
were slow, difficult to maintain, and
produced inconsistent results in predicting
the sulfur in the diesel resulting in lost
benefits in excess of $600K/yr & growing.
Leverage existing OT data
infrastructure to enable Azure machine
learning to predict sulfur in diesel by:
Ability to identify and control (open loop)
the key variables in predicting sulfur in
diesel. Expanding to other hydro treating
units. Initial savings ~600K and growing.

© Copyright 2016 OSIsoft, LLCUSERS CONFERENCE 2016
Picture / Image
RESULTSCHALLENGE SOLUTION
33
COMPANY and GOAL
Company
Logo
33
Improving DCU Yield and Safety with
Azure Machine Learning
Improve Delayed Coking Unit yield and Reduce the risk of coke hot spot steam explosions from feed and operational variability by using Azure machine learning.
• Economic incentive to run opportunity crudes $6M for each 1% increase in DCU yield
• Increase feed variability to the DCU
• Increased risk of hot spots and steam explosion events during decoking – 4X increase in Q1 2016
• PI AF infrastructure in place from prior
digital transformation from tags to assets
• Use Microsoft Azure Machine Learning
to do massive high fidelity data
correlation of DCU feed properties to
yields and explosions
• Enabled the sustainability of increased
DCU yields of over 2% by processing
opportunity crudes
• Reduced steam explosions by 75%
• Calculated savings for 1 DCU unit =
$6M/yr for each 1% yield = $12M/yr
• Rapid rollout to other DCUs
Opportunity crudes provided incentive
to raise DCU yields but resulted in an
increase likelihood hot spots resulting in
steam eruption events while decoking.
Leverage existing OT data infrastructure to enable the use of advanced analytics and machine learning to improve yields and reduce the risk of steam eruption.
Reduced DCU steam explosion events
while improving DCU yields from the
processing of more opportunity crudes

© Copyright 2016 OSIsoft, LLCUSERS CONFERENCE 2016
Best Practices & Perspectives
34
© Copyright 2016 OSIsoft, LLCUSERS CONFERENCE 2016
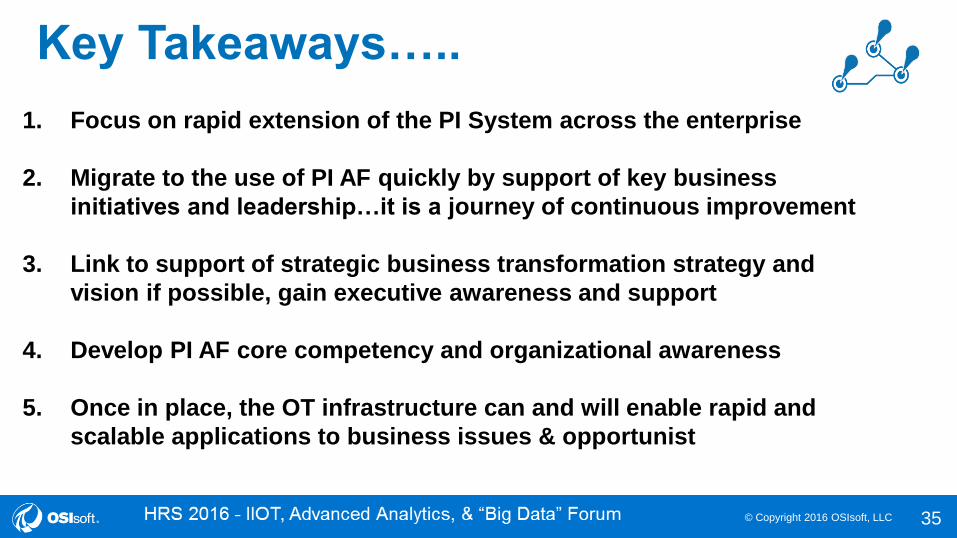
Key Takeaways…..
35
1. Focus on rapid extension of the PI System across the enterprise
2. Migrate to the use of PI AF quickly by support of key business
initiatives and leadership…it is a journey of continuous improvement
3. Link to support of strategic business transformation strategy and
vision if possible, gain executive awareness and support
4. Develop PI AF core competency and organizational awareness
5. Once in place, the OT infrastructure can and will enable rapid and
scalable applications to business issues & opportunist

© Copyright 2016 OSIsoft, LLCUSERS CONFERENCE 2016 36