THE MOBILE WEB INTELLIGENCE REPORT - valuewalk.com · the mobile web intelligence report may 2018...
16
THE MOBILE WEB INTELLIGENCE REPORT MAY 201 8 OPERATING SYSTEMS, FEATURE PHONES, RAM, BOTS, SCREEN SIZES and more.
Transcript of THE MOBILE WEB INTELLIGENCE REPORT - valuewalk.com · the mobile web intelligence report may 2018...

THE MOBILE WEB INTELLIGENCE REPORT MAY 2018
OPERATING SYSTEMS, FEATURE PHONES, RAM, BOTS, SCREEN SIZES and more.

DeviceAtlas Mobile Web Intelligence Report May 2018
INTRODUCTION
DeviceAtlas tracks web traffic from hundreds of thousands of partner websites using our device detection
platform for web optimization, segmentation, and analytics. This allows us to analyze the current state of
the mobile web by sharing some exciting statistics about the most popular smartphones used today.
In the Q1 2018 edition of the Mobile Web Intelligence Report we focused on:
• Mobile Operating Systems - who's winning (Android v iOS)
• Feature Phones - are they making a comeback?
• RAM - are 4GB devices increasing in popularity?
• Bots - the most active & the most helpful.
• Screen Sizes - what dimensions are most people using to view your content.
Highlights include:
• Android devices gained 13% market share in Malaysia, with iOS losing similar amount.
• 88% of all Feature Phone traffic in our 2017 data came from India.
• 4GB devices increased their share in every country except Malaysia.
• BingPreview is more active than Googlebot.
• 750x1334 is still the most popular resolution in many countries.
Notes on methodology
All statistics in this report are based on device usage data pulled from DeviceAtlas, a device detection
solution. DeviceAtlas works by parsing User-Agent strings which are looked up in the device description
repository that includes over 49,700 unique entries. The report offers just a glimpse into what’s possible
with DeviceAtlas. See the mobile analytics demo to get a better idea.

DeviceAtlas Mobile Web Intelligence Report May 2018
OPERATING SYSTEMS - iOS v ANDROID
Having recently examined the perennial iOS v Android battle for market share in 2017, our data from Q1
2018 tells a similar tale.
iOS dominates in predominantly English-speaking countries, as well as Japan. In Sweden, it has a
slender 2% lead over its Android equivalent. Android enjoys a clear gap in the majority of other
countries in our data, caused in part by the abundance and diversity of reasonably priced Android
powered devices.
0%
10%
20%
30%
40%
50%
60%
70%
80%
ItalyArgentina Australia Brazil
iOS
Canada Colombia Egypt France Germany India
USAUKSwedenPoland Russia South Africa SpainJapan Malaysia Nigeria
iOS v Android Q1 2018 (pt. 1)
iOS v Android Q1 2018 (pt. 2)
Android
iOS Android
0%
10%
20%
30%
40%
50%
60%
70%
80%

DeviceAtlas Mobile Web Intelligence Report May 2018
Our look into 2017 v 2016 OS data gave us some insight into the shifting marketplace, and how
Android/iOS devices were increasing in popularity in some countries, but declining elsewhere.
Comparing that data to Q1 2018 also provides some interesting insights:
• Both iOS and Android lost market share in India.
• iOS made strong gains in Colombia, Egypt and Ireland.
Country iOS Share Q1 2018 vs 2017
Canada 56.9% +3.9%
Colombia 24.4% +8.4%
Egypt 28.6% +10.6%
France 40.8% -1.2%
India 9.6% -1.4%
Ireland 53.8% +4.8%
Malaysia 15.2% -13.8%
Country Android Share Q1 2018 vs 2017
Colombia 74.4% -7.6%
Egypt 70.2% -8.8%
India 71.6% -11.4%
Ireland 45.7% -4.3%
Malaysia 84.6% +13.6%
Spain 73.8% -4.2%
USA 39.3% -3.7%

DeviceAtlas Mobile Web Intelligence Report May 2018
Country iOS Android
Argentina 2.24 1.00
FEATURE PHONES
As we see in the above charts, both iOS and Android lost market share in India. In a country of over 1.3
billion people, a few percentage points can make a huge difference to a manufacturers bottom line.
The natural conclusion is another OS eating into their market dominance, and our data reflects this.
The new entrant - KaiOS - has already overtaken iOS as the second most used OS in India. With 15% of
total traffic, it beats Apple devices into third (with 9.6%).
Elsewhere, feature phones are still an active part of most countries mobile ecosystem, but have yet to
make as impressive an impact as in India.
Year of Release
When we dug into the Q1 numbers, we paid particular attention to "Year of Release", one of 168
properties available through DeviceAtlas.
Feature phones released in 2011 accounted for 13% of all such devices registered in our data. As
the chart below shows, there is a sweet spot from 2008-2012 - could this period have been the zenith
of the feature phone?

DeviceAtlas Mobile Web Intelligence Report May 2018
Overall Feature Phone Traffic
When we look at raw visits from feature phones based on year of release, we see a slightly different
scene - phones released in 2005 (including the Nokia 6230i and N70) drove 6.6% of total traffic.
Phones released in 2017 accounted for almost 90% of our data, so the performance of their 2005
counterparts is more impressive than the percentage alone implies.
The volume of traffic for 2017 can be attributed to India, and the success of recent feature phone
launches. Top in our list was the Lyf/Jio range of KaiOS-powered handsets. Reliance Jio, India's third
largest operator with over 160 million subscribers, have in recent months taken the tariff war to the
next level, and as a result their branded devices dominate the feature phone landscape. They
account for over 88% of this data set.
Operating Systems
Given a feature phone's hardware restrictions, it's no surprise to see them running different
operating systems. A modern version of iOS of Android require functionality and power beyond the
reach of feature phones as we know them. Finding a balance, and offering as much as is reasonably
possible, is key.
We looked at some of the more common feature phone OS's in use today.
KaiOS is a Linux based OS that seeks to bring "smartphone-like functionalities to affordable
phones". Offering a range of apps through the KaiStore, the most notable devices to run Kai are the
revamped Nokia banana phone (8110) and the range of Jio/Lyf handsets mentioned above. Recently
announced partnerships with the likes of Facebook, Twitter, Google, AT&T and T-Mobile ensure a
healthy future for the FirefoxOS fork.

DeviceAtlas Mobile Web Intelligence Report May 2018
Nokia are synonymous with feature phones. They're responsible for the first camera phone sold in
the US, and also made headway in the areas of mobile TV and gaming. Their latest OS version,
dubbed Asha, is one of many variations they've used over the last two decades. "Nokia OS" can be
considered an unbrella term for many variations, encompassing the entire family of Nokia mobile
operating systems. Their more recent releases (they're now owned by Microsoft) have featured
Windows or Android software.
Originally conceived as an OS for the PDA variety of devices in the late 90's, Symbian accounted for
37.6% of all smart mobile devices sold in 2010. Apple were at a mere 15.7% that year.
However, the Android/iOS explosion hit the OS hard. As a result, Nokia, who were its primary
supporters, stopped supporting Symbian development in 2014.
Brew is an ancronym for Binary Runtime Environment for Wireless - an application dev platform,
created by Qualcomm. It's still used in some form by manufacturers such as Huawei, LG, Samsung
and HTC.
Another acronym, REX is a Real-Time Executive Operating System.

DeviceAtlas Mobile Web Intelligence Report May 2018
Model Year Released Screen Size OS
Jio F90M 2017 2.4 KaiOS
Lyf LF-2403N 2017 2.4 KaiOS
Jio F61F 2017 2.4 KaiOS
Jio F81E 2017 2.4 KaiOS
Jio F30C 2017 2.4 KaiOS
Jio F50F 2017 2.4 KaiOS
Jio F41T 2017 2.4 KaiOS
Nokia 6230i 2005 1.5 Nokia OS
Nokia N70 2005 2.1 Symbian
Nokia 6280 2005 2.2 Nokia OS
Nokia E52 2009 2.42 Symbian
Alcatel A207BG 2015 1.8 Proprietary
ZTE Z233VL 2016 2.8 Android based
Samsung Gusto 3 2014 2.0 Brew
Nokia E51 2008 2.0 Symbian
Nokia 6120c 2007 2.0 Symbian
Nokia C2-01 2010 2.0 Nokia OS
Sanyo PM-8200 2004 1.8 Rex
Nokia C3-00 2010 2.4 Nokia OS
Alcatal A205G 2015 1.8 Nucleus
DIAGONAL SCREEN SIZEWhile the majority of our data shows the Jio/Lyf phones, with a screen size of 2.4 inches, the average
is slightly below that at 2.35 inches.
With just under 3% of total device traffic visible, the Nokia 6230i is at the lower end with a screen-size
of 1.5 inches, At 2 inches, we see the Samsung Gusto 3 and Nokia's E51 and 6120c, with the N70 and
6280 pushing the envelope to 2.1 and 2.2 inches respectively.
Compared to smartphones, the difference is stark - 12.5% of all devices in our database feature a 5
inch screen, with 6% sporting a relatively-massive 7 inches.
The below chart shows the top 20 feature phones as seen in our data, along with their Year of Release,
Diagonal Screen Size (inches) and Operating System.

DeviceAtlas Mobile Web Intelligence Report May 2018
RAMWhen comparing mobile RAM statistics for Q1 2018, we also had a look at the data for Q1 2017 to gauge the
overall trend. What we saw was a clear move away from devices with 1024MB RAM in favour of 2048MB.
This happened in all but three countries in our data - Brazil, Argentina and Colombia.
In some countries the shift was quite dramatic. In Japan, for example, the most popular RAM for Q1 2018
was 2048, with 48% of overall hits. Last year, 1024 accounted for almost 60% of total traffic, now down to
16%.
In the UK, 2048 more than doubled its presence (18% in 2017, now 40%) while 1024 was reduced from 51%
to 17.5% as people upgraded their devices. An even bigger shift was seen in the US, where 1024 enjoyed
51% of 2017's traffic, but now accounts for a mere 14%.
The charts below show the share for the most popular RAM specs.
0%
5%
10%
15%
20%
25%
30%
35%
40%
ItalyGermany IndiaFranceCanada Colombia EgyptArgentina Australia Brazil
2GB1GB 3GB 4GB
RAM Q1 2018 (pt. 1)
1GB 2GB 3GB 4GB
0%
5%
10%
15%
20%
25%
30%
35%
40%
USASweden UKPoland Russia South Africa SpainJapan Malaysia Nigeria
RAM Q1 2018 (pt. 2)
DeviceAtlas Mobile Web Intelligence Report May 2018
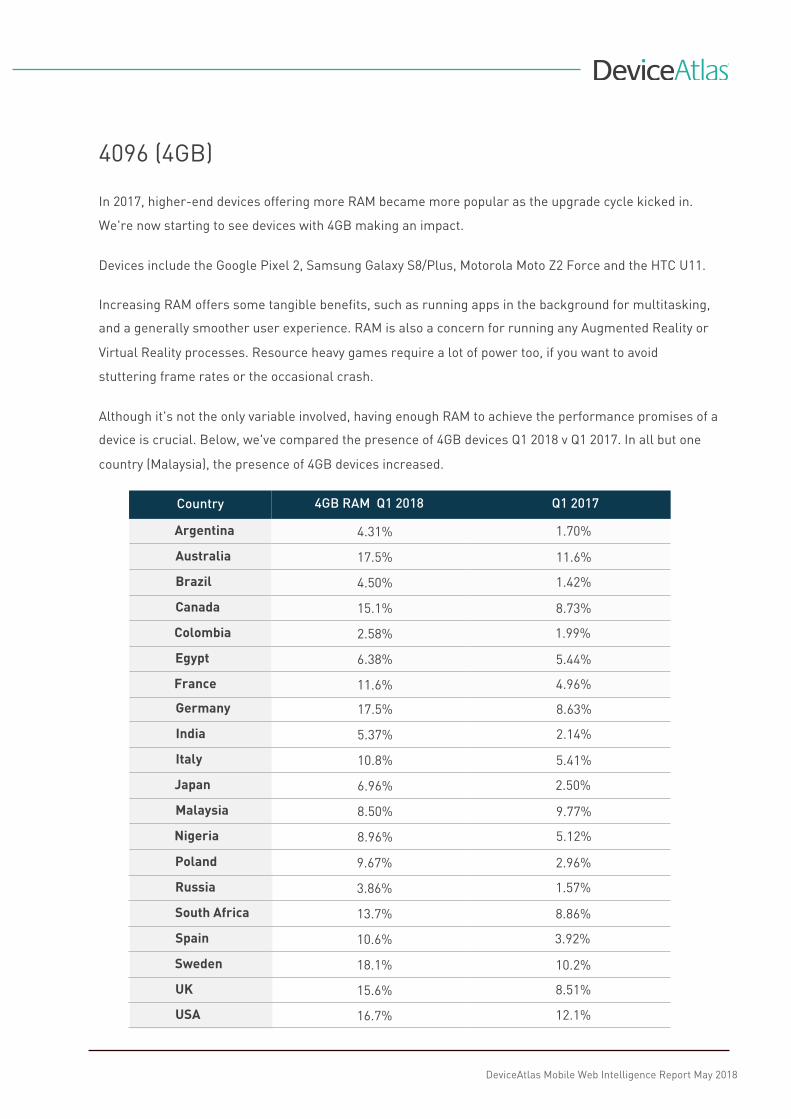
4096 (4GB)
In 2017, higher-end devices offering more RAM became more popular as the upgrade cycle kicked in.
We're now starting to see devices with 4GB making an impact.
Devices include the Google Pixel 2, Samsung Galaxy S8/Plus, Motorola Moto Z2 Force and the HTC U11.
Increasing RAM offers some tangible benefits, such as running apps in the background for multitasking,
and a generally smoother user experience. RAM is also a concern for running any Augmented Reality or
Virtual Reality processes. Resource heavy games require a lot of power too, if you want to avoid
stuttering frame rates or the occasional crash.
Although it's not the only variable involved, having enough RAM to achieve the performance promises of a
device is crucial. Below, we've compared the presence of 4GB devices Q1 2018 v Q1 2017. In all but one
country (Malaysia), the presence of 4GB devices increased.
Country 4GB RAM Q1 2018 Q1 2017
Argentina 4.31% 1.70%
Australia 17.5% 11.6%
Brazil 4.50% 1.42%
Canada 15.1% 8.73%
Colombia 2.58% 1.99%
Egypt 6.38% 5.44%
France 11.6% 4.96%
Germany 17.5% 8.63%
India 5.37% 2.14%
Italy 10.8% 5.41%
Japan 6.96% 2.50%
Malaysia 8.50% 9.77%
Nigeria 8.96% 5.12%
Poland 9.67% 2.96%
Russia 3.86% 1.57%
South Africa 13.7% 8.86%
Spain 10.6% 3.92%
Sweden 18.1% 10.2%
UK 15.6% 8.51%
USA 16.7% 12.1%

DeviceAtlas Mobile Web Intelligence Report May 2018
BOTS
The most active crawler is not GoogleWhen we analysed Q1 2018 data with a focus on non-human traffic and visits, we were a little
surprised to see BingPreview at the top of the list.
With just under 10% of total hits, Bing's page snapshot tool acts in a similar fashion to the
second placed bot, Facebookexternalhit, by crawling pages for preview elsewhere.
With 8.5% of total traffic, Facebook's page preview crawler has also been busy, scraping*
meta-data and images to enable seamless and visually appealing sharing on the platform.
When a Facebook user pastes a link, they quickly crawl the target page and pull information
such as title, description and preview/featured images:
*Given Facebook's ongoing PR fire, and the never-ending dance between their elusive T&Cs and privacy activists,
perhaps "scraping" isn't the most sensitive term to use.

DeviceAtlas Mobile Web Intelligence Report May 2018
What about Google?Given its dominance in all things search, it may be surprising to see Google so far down the list
for Q1 2018 - Googlebot (mobile) was 5th, with 5.5% of total hits. The desktop equivalent was way
down in 13th with 1.6%.
However, if you've developed the most intelligent, efficient web-crawling and indexing system
the planet has ever seen, as well as the most popular free analytics package, you might not need
to crawl every site quite as often as your competitors.
That said, we did spot 102 variations of Google crawlers and bots in our data. Given Google's
integration with the wider web - think AMP, Structured Data etc - there are numerous reasons
why a Googlebot would visit your site.
Yahoo!What we see in our data for Yahoo is similar, but on a lesser scale to Google. There is one main
crawler - Yahoo! Slurp - and 8 variations, all with different jobs to perform as they navigate the
Internet.
Unlike Google, Yahoo doesn't appear to have a dedicated mobile web crawler, certainly not one
operating at the same scale. Given Google's recent push to the mobile-first index, it's not
surprising.
Yahoo's crawlers account for 2.6% of the total bot traffic included.
OthersWith 5% of the overall traffic, Sogou Spider is the 6th busiest bot on the list. It's the web crawler
for Beijing-based search technology provider, Sogou.com.
ScoutJet, the web crawler for IBM's Watson, clocks in with 1.7% of the total, while another
Chinese search engine, so.com, is visible at 2.2% with its 360Spider bot.

ROBOTS USER-AGENTS
Below is a list of the most common bots and web-crawlers we saw on our network in Q1 2018.
BingP /1.0b
Faceb
Bingb
Bingb
Goog
Sogo
Face
AdsB
Goog
Yaho
360S
Scou
Goog
Bot Name Type User Agent
review Preview/Fetch Mozilla/5.0 (Windows NT 6.1; WOW64) AppleWebKit/534+ (KHTML, like Gecko) BingPreview
ookexternalhit Preview/Fetch facebookexternalhit/1.1 (+http://www.facebook.com/externalhit_uatext.php)
Dev
ot Search/De zilla/5.0 (compatible; bingbot/2.0; +http://
ot Search/Mozilla/5.0 (iPhone; CPU iPhone OS 7_0 like (KHTML, like Gecko)
sion/7.0 Mobile/11A465 Safari/9537.53 (co
lebot Search/Mo illa/5.0 (Linux; Android 6.0.1; Nexus 5X B 36 (KHTML, like Gecko) ome/41.0.2272.96 Mobile Safari/537.36
u Spider Search/De ou web spider/4.0(+http://www.sogou.com
bookexternalhit Preview/Fetch facebookexternalhit/1.1
ot Google Advertising AdsBot-Google (+http://www.google.com/ad
lebot Search/Image Googlebot-Image/1.0
o! Slurp Search/Desktop Mozilla/5.0 (compatible; Yahoo! Slurp; http://
pider Search/Desktop Mozilla/5.0 (Windows NT 6.1; WOW64) AppleWChrome/50.0.2661.102 Safari/537.36; 360Spi
tJet Search/Desktop Mozilla/5.0 (compatible; ScoutJet; +http://ww
lebot Search/Desktop Mozilla/5.0 AppleWebKit/537.36 (KHTML, likeChrome/41.0.2272.118 Safari/537.36
www.bing.com/bingbot.htm)
Mac OS X) AppleWebKit/537.51.1
mpatible; bingbot/2.0
uild/MMB29P) AppleWebKit/537.
/docs/help/webmasters.htm#07)
sktop Mo
bileMo
Ver
bile MozChr
sktop Sog
iceAtlas Mobile Web Intelligence Report May 2018
sbot.html)
help.yahoo.com/help/us/ysearch/slurp)
ebKit/537.36 (KHTML, like Gecko) der
w.scoutjet.com/)
Gecko; Google Web Preview Analytics)

DeviceAtlas Mobile Web Intelligence Report May 2018
MOST USED SCREEN RESOLUTIONS IN Q1 2018
The most popular screen sizes never change too dramatically from one period to the next, and Q1 2018 is
another example of this evolution.
Comparing the numbers to the most used screen resolutions in 2017 offers little controversy. The
appearance of some relatively new dimensions, such as 1440x2560, can be backed up with product launches
by some large players in the mobile space, and a subsequent time lag between release and price
normalisation.
In this case, phones with Quad HD (1440x25650) were not released in 2018, nor 2017. The LG G4, for example,
was released in 2014, while the Google Nexus 6P and Motorola DROID Turbo 2 were both released in 2015.
0%
5%
10%
15%
20%
25%
30%
35%
40%
ItalyIndiaGermanyFranceEgyptColombiaCanadaBrazilAustraliaArgentina
750x1334720x1280 1440x2560 1080x1920
Most used smartphone screen resolutions in Q1 2018 (pt. 1)
750x1334720x1280 1440x2560 1080x1920
0%
5%
10%
15%
20%
25%
30%
35%
40%
USAUKSwedenSpainSouth AfricaRussiaPolandNigeriaMalaysiaJapan
Most used smartphone screen resolutions in Q1 2018 (pt. 2)

DeviceAtlas Mobile Web Intelligence Report May 2018
Country 1st 2nd 3rd 4th
Argentina 720x1280 1080x1920 540x960 480x800
Australia 750x1334 1080x1920 1440x2560 640x1136
Brazil 720x1280 1080x1920 750x1334 540x960
Canada 750x1334 1080x1920 1440x2560 640x1136
Colombia 720x1280 1080x1920 750x1334 480x854
Egypt 1080x1920 720x1280 750x1334 1440x2560
France 750x1334 1080x1920 720x1280 1440x2560
Germany 1080x1920 750x1334 720x1280 1440x2560
India 720x1280 1080x1920 240x320 540x960
Italy 1080x1920 720x1280 750x1334 1440x2560
Japan 750x1334 1080x1920 640x1136 720x1280
Malaysia 720x1280 1080x1920 540x960 480x800
Nigeria 720x1280 1080x1920 750x1334 1440x2560
Poland 720x1280 1080x1920 1440x2560 750x1334
Russia 720x1280 1080x1920 750x1334 640x1136
South Africa 1080x1920 750x1334 720x1280 1440x2560
Spain 1080x1920 720x1280 750x1334 1440x2560
Sweden 750x1334 1080x1920 1440x2560 720x1280
UK 750x1334 1080x1920 1440x2560 640x1136
USA 750x1334 1080x1920 1440x2560 720x1280
As we learned in our post The Most Popular Smartphones of 2017, the iPhone 6 was the most popular phone
last year. With a screen size of 750x1334, we can see below that it still remains the most popular phone in 7
countries.
720x1280 covers a wide range of Android powered-devices, including the HTC Desire, some Microsoft
Lumias, early Samsung Galaxy handsets and Xiaomi and ZTE offerings.
1080x1920 can be considered the updates to those mentioned above, while Quad HD, at 1440x2560, includes
Samsung's S6/S7 and the HTC One M9+.
The below chart shows the most used screen sizes in all 20 countries included in the study.

DeviceAtlas Mobile Web Intelligence Report May 2018
START DETECTING ALL DEVICES ACCESSING
YOUR CONTENT ACROSS ALL ENVIRONMENTS
DeviceAtlas is a high-speed, high-performance, low-server footprint device detection solution used
by some of the largest companies in the online space. The most common use cases include:
• Optimizing UX and conversion rates for all connecteddevices
• Improving web performance
• Targeting ads
• Analyzing web and app traffic
DeviceAtlas allows you to target any of the 165+ device properties to build fine-grained content
optimization and detailed reports on web traffic. Get started with a free trial to test DeviceAtlas in
your environment.
GET STARTED GET STARTED
SHARE THE REPORT’S FINDINGS WITH YOUR AUDIENCE
We know that your audience loves statistics just as much as we do. Why not share some of our findings in
your future articles and marketing collateral, or just post on social media (please attribute the report’s
findings to DeviceAtlas).
Be sure to let us know if you have any comments or suggestions related to the DeviceAtlas mobile web
reports by writing to [email protected].