The mix of international banks' foreign claims ... · The mix of international banks’ foreign...
30
The mix of international banks’ foreign claims: Determinants and implications Alicia García Herrero and Maria Soledad Martínez Pería * Bank for International Settlements and World Bank Abstract: We analyze the cross-country determinants and financial stability implications of the mix of international banks’ foreign claims. We distinguish between local claims -extended by host country affiliates- and cross-border claims -booked outside the receiving country. Using data on Italian, Spanish, and U.S. banks’ foreign claims, we find that the share of local claims is driven by restrictions on banking sector openness and by local scale economies/business opportunities. The impact of limits on property rights, entry requirements, start-up and informational costs is less robust. Finally, foreign claim volatility is lower in countries with a larger share of local claims. Keywords: foreign bank financing, financial FDI, cross-border claims JEL: F36, F37, G21 * We thank Cristina Luna for her help in obtaining our data. We also thank the Central Banks of Italy and Spain for providing us data. We are grateful to Maria del Pilar Casal and Sarojini Hirshleifer for excellent research assistance and to Harald Anderson for providing us data. We received useful comments from Gerard Caprio, Ralph de Haas, Asli Demirgüc-Kunt, Enrica Detragiache, Patrick Honohan, Ross Levine, Andrew Powell, Jesus Saurina, Adrian Tschoegl, an anonymous referee and participants at the Stanford Center for International Development conference on Latin American Financial Systems and the Challenges of Economic Growth, at the World Bank and Journal of Banking and Finance conference on Globalization and Financial Services in Emerging Economies, and at the 2005 LACEA meetings. The views expressed in this paper are exclusively those of the authors. Contact author : Maria Soledad Martínez Pería, World Bank, 1818 H St. N.W., Washington, DC 20433. [email protected].
Transcript of The mix of international banks' foreign claims ... · The mix of international banks’ foreign...

The mix of international banks’ foreign claims:
Determinants and implications
Alicia García Herrero and Maria Soledad Martínez Pería*
Bank for International Settlements and World Bank
Abstract:
We analyze the cross-country determinants and financial stability implications of the mix of
international banks’ foreign claims. We distinguish between local claims -extended by host
country affiliates- and cross-border claims -booked outside the receiving country. Using data on
Italian, Spanish, and U.S. banks’ foreign claims, we find that the share of local claims is driven
by restrictions on banking sector openness and by local scale economies/business opportunities.
The impact of limits on property rights, entry requirements, start-up and informational costs is
less robust. Finally, foreign claim volatility is lower in countries with a larger share of local
claims.
Keywords: foreign bank financing, financial FDI, cross-border claims JEL: F36, F37, G21
* We thank Cristina Luna for her help in obtaining our data. We also thank the Central Banks of Italy and Spain for
providing us data. We are grateful to Maria del Pilar Casal and Sarojini Hirshleifer for excellent research assistance
and to Harald Anderson for providing us data. We received useful comments from Gerard Caprio, Ralph de Haas,
Asli Demirgüc-Kunt, Enrica Detragiache, Patrick Honohan, Ross Levine, Andrew Powell, Jesus Saurina, Adrian
Tschoegl, an anonymous referee and participants at the Stanford Center for International Development conference
on Latin American Financial Systems and the Challenges of Economic Growth, at the World Bank and Journal of
Banking and Finance conference on Globalization and Financial Services in Emerging Economies, and at the 2005
LACEA meetings. The views expressed in this paper are exclusively those of the authors. Contact author: Maria
Soledad Martínez Pería, World Bank, 1818 H St. N.W., Washington, DC 20433. [email protected].

1
1- Introduction
After a decade of financial repression and stagnant international financial flows, the
1990s saw a resurgence in financial globalization. As part of this process, multinational banking
gained momentum once again and international banks’ foreign claims—those extended on
residents outside the country in which these banks are headquartered—took off. These claims
consist of financial assets such as loans, debt securities, and equities, including equity
participations in subsidiaries. According to statistics from the Bank for International Settlements
(BIS), which monitor foreign claims held by banks from OECD countries vis-à-vis the rest of the
world, these claims rose from 1.3 trillion dollars in 1990 to close to 3 trillion dollars in 2002.1
International banks may grow their foreign claims portfolio in two ways. First, they may
establish affiliates in different countries and extend claims locally through their branches and
subsidiaries in these countries. Second, international banks may also extend cross-border claims
by financing and booking the claims from outside the recipient or host countries. In particular,
cross-border claims are typically extended from the banks’ headquarters. While local claims
involve some form of foreign direct investment in the host country’s financial sector, cross-
border claims do not. In practice, we observe significant disparities in how international banks
conduct their business across countries. In some instance, like in the case of Albania, Burundi,
Bhutan, Cambodia, and Moldova, foreign banks only extend cross-border claims. While in other
instances, such as in Brazil and Hong Kong, foreign banks’ exposure is largely local.
1 BIS-reporting countries over this period include: Australia, Austria, Belgium, Canada, Denmark, Finland, France,
Germany, Ireland, Italy, Japan, Luxembourg, Netherlands, Norway, Portugal, Spain, Sweden, Switzerland, United
Kingdom, and U.S.

2
This paper empirically investigates the determinants of the mix of foreign bank claims
and studies its implications for financial stability. Our analysis is based on a new dataset of
foreign bank claims, both cross-border and local, extended by Italian, Spanish, and U.S. banks to
over 100 countries around the world during the period 1997-2002. Banks from these three
countries are dominant players in the international banking market and they jointly account for
approximately 30 percent of all outstanding foreign claims vis-à-vis the countries in our sample.
To study the mix of claims extended by international banks across countries, we rely on
the conceptual/theoretical framework applied in the trade/multinational firm literature to the
choice between exporting goods (the equivalent to cross-border lending) and producing them
abroad for foreign markets (the equivalent to FDI or local claims). In particular, studies such as
Brainard (1997) and Helpman et al. (2003) discuss the tradeoff faced by multinational firms
between paying the higher sunk costs of establishing affiliates overseas vis-à-vis confronting the
transportation costs and trade barriers that arise from exporting their goods instead. We use new
survey data on the minimum capital requirements for opening banks across countries, as well as
recently available information on the general costs (fees, costs of procedures and forms, fiscal
stamps, legal and notary charges, etc.) of starting up a business to study their importance in
driving the share of local to total foreign claims. Furthermore, since banking is an
informationally intensive industry, we reinterpret the role of transportation costs in the
manufacturing trade/multinational firm literature as information costs that arise in the
international banking context. We proxy for information costs by including measures of
‘proximity’ (i.e., legal and economic) between the host or recipient country and the country of
origin of the foreign bank. Finally, we also examine the impact of banking policies (in particular

3
the extent of banking sector openness), measures of economies of scale/business opportunities,
as well as, default, price and expropriation risks.
Our results on the determinants of the mix of foreign bank claims reveal that the share of
local claims is driven primarily by the degree of openness in the host banking sector and by local
scale economies/business opportunities. Other factors such as bank entry requirements, start-up
and informational costs, and limits on property rights are also significant, but their impact is less
consistent across international banks and also varies depending on the specification.
With respect to the implications of the mix of foreign bank claims, we focus exclusively
on the impact of the composition of these claims on the overall volatility of foreign bank
financing, while controlling for other factors that might affect the variability of foreign claims.2
Because FDI or local claims require paying higher fixed and irreversible costs, it seems
reasonable to expect these flows to be more stable and less responsive to bad news than cross-
border claims. Also, economic fixed costs aside, banks trying to shrink the size or close down
their overseas operations will have to pay the reputational costs of doing so and, therefore, may
be less likely “to run” when conditions deteriorate. At the same time, while in the face of good
economic conditions foreign banks can relatively quickly and, perhaps cheaply, extend cross-
border financing, augmenting their local claims might require lumpy investments that are often
decided on the basis of long-term rather than short-term profit opportunities.
Our results on the stability of foreign financing indicate that countries with a higher share
of local foreign claims experience lower total foreign claims volatility. This result, which is
robust to controlling for a number of other factors that might affect foreign claims volatility,
2 There may be other implications from the mix of foreign bank claims, such as the impact on the balance of
payments, which we ignore here and leave for future research.

4
helps us confirm in a systematic manner some of the descriptive evidence offered by other
studies favoring local foreign claims to cross-border bank financing (see de Haas and Lelyveld,
2002; Palmer, 2000; Peek and Rosengren, 2000).
Even though the literature on international banking is quite vast, our study is to our
knowledge the first to formally analyze the determinants of the mix of foreign bank financing
and its consequences on the stability of such flows. Existing studies on the factors driving
financial FDI (or local claims) and cross-border claims have explored the determinants of these
flows in isolation. An early strand of the literature on FDI by international banks focused on the
experience of developed countries (especially the U.S.) with foreign bank entry and bank
internationalization during the 1970s and 1980s (see Clarke et al., 2003 for a review). More
recently, several authors have examined the decision of international banks to establish
operations overseas during the 1990s, especially in developing countries (e.g., Buch, 2000;
Claessens et al., 2000; Guillen and Tschoegl, 2000; Focarelli and Pozzolo, 2001, 2006; Buch and
DeLong, 2001; Moshirian, 2001; Buch, 2003; Galindo, Micco and Serra, 2003; Buch and
Lipponer, 2004; Wezel, 2004).3 A smaller number of papers have examined the determinants and
behavior of cross-border claims (e.g., Dahl and Shrieves, 1999; Buch, 2000; Jeanneau and Micu,
2002; Kawai and Liu, 2002; and Buch and Lipponer, 2004).
3 A growing literature has examined the implications of foreign bank presence in developing countries. See Clarke et
al. (2003) for a review of this literature. Among others, Claessens et al. (2000), Barajas et al. (2000), Denizer (2000),
and Martínez Pería and Mody (2004) discuss the implications on competition and efficiency in the banking sector.
Dages et al. (2000), Peek and Rosengren (2000), de Haas and Levyveld (2002, 2004), Detragiache and Gupta (2004)
compare the lending behavior of foreign and domestic banks during crises. Berger et al. (2001), Mian (2006), and
Clarke et al. (2005) address the consequences on access to financing by small and opaque borrowers.

5
The rest of the paper is organized as follows. Section 2 discusses the data on Italian,
Spanish, and U.S. foreign claims. Section 3 presents the empirical methodology pursued. Section
4 discusses the empirical results. Section 5 concludes.
2- Data on foreign bank claims
Perhaps one of the reasons why there has not been much research on the cross-country
mix of international banks’ foreign claims has to do with the fact that data are not readily
available. The main source of international banking data available today is the Bank for
International Settlements. The BIS’ Consolidated Banking Statistics contain country-level
information on the foreign claims extended by international banks from more than 20, primarily
OECD, countries (referred to as BIS-reporting countries). However, BIS data do not adequately
discriminate between cross-border and local foreign claims. BIS statistics on local claims only
capture those denominated in local currency. Foreign currency denominated local claims are
combined with cross-border claims and reported under what the BIS calls “international claims”.
Thus, BIS data are largely ill-suited for an analysis of the determinants and the implications of
the mix of cross-border versus local international bank claims.
Due to the limitations of the existing BIS information, the data used in our analysis had to
be specially requested from the Italian and Spanish central banks. The exception was the U.S.,
which is the only country that since 1997 reports separate information on cross-border and local
claims (both in local and foreign currency) to the BIS. For all three countries, the data available
to us aggregates claims held by all banks vis-à-vis each host country. Thus, like in the case of the
BIS data, the information we have is not bank, but rather country level data. For the U.S., we
have information for the period 1997-2002. In the case of Italy, the data cover the period 1998-
2002, while for Spain the sample spans 1999-2002. None of these countries collected separate

6
information on local and cross-border claims prior to this period. For all three countries, the
information we have nets intra-bank positions.4
Table 1 presents information on Italian, Spanish, and U.S. banks’ foreign claims in 105
countries. In the case of Italian banks, the share of local claims cannot be calculated for 9
countries (Bhutan, Botswana, Burkina Faso, Burundi, Cambodia, Honduras, Niger, Papua New
Guinea and Rwanda), where both local and cross-border claims are zero. For the remaining
countries, the average share of local claims is 16.01 percent. The share of local claims is zero
(meaning claims are exclusively cross-border) in 59 countries or approximately 60 percent of the
sample. Countries where the share of Italian banks local claims is zero include both developed
and developing economies across all regions. Italian banks hold local claims in 35 percent of the
countries in our sample. These include primarily developed economies or countries in Eastern
Europe and Latin America. However, among these countries, the share of local claims is never
100 percent (the largest share of local claims, hovering around 90 percent, is observed for
countries such as Croatia, Poland, and Peru). This indicates that Italian banks do not substitute
entirely local claims for cross-border lending. Even in countries where most of the banking
business is conducted through the local affiliates, there is still some cross-border financing taking
place.
Spanish banks are not active in anyway in 14 countries in the sample —Armenia,
Bangladesh, Bhutan, Botswana, Burkina Faso, Burundi, Cambodia, Jamaica, Lesotho, Nepal,
Niger, Rwanda, Sri Lanka, and Zambia—, half of which are in Africa. Obviously, for these
4 This is an important advantage of this dataset since it allows us to measure net exposure to a country. On the other
hand, bank level data from sources such as Bankscope do not disclose information on intragroup positions nor do
they provide data on cross-border lending to specific hosts.

7
countries, the share of local claims cannot be calculated. For the remaining countries, the average
local share is 17.73 percent. The share of local claims is zero in 48 countries or 47 percent of the
sample. Like in the case of Italian banks, the list includes developed (mostly Nordic) and
developing countries across all regions. Spanish banks tend to have local operations in developed
countries and in emerging economies. The extent of local presence is particularly high in Latin
America, where in many countries the share of local presence exceeds 75 percent, but never
reaches 100.
U.S. banks are active in one way or the other in all but 5 countries in our sample (i.e.,
Armenia, Burkina Faso, Burundi, Madagascar, and Rwanda). Furthermore, contrary to the case
of Spanish and Italian banks, U.S. banks have some form of local presence in more than three-
quarters of the sample and those countries where the share of U.S. local claims is zero are mainly
small developing economies (with the exception of Saudi Arabia). Finally, relative to Spain and
Italy, it is harder to detect any regional pattern in the share of U.S. bank local foreign claims,
since countries with high shares include both developed and developing countries in almost
every region. The average share of local claims for U.S. banks is 34.75 percent.
3 - Empirical Methodology
The empirical analysis conducted in this paper has two objectives: (1) to study the
determinants of the mix of foreign claims and (2) to examine the implications of this mix for the
stability of foreign bank financing. Below, we discuss the empirical strategies pursued to
accomplish these objectives. Because the time span covered by the data is relatively short and
since many of the variables of interest do not vary over time, we focus on explaining differences
across countries. Therefore, we consider only the average share of local foreign claims across

8
countries and, for each country, the volatility of total foreign claims over the entire sample
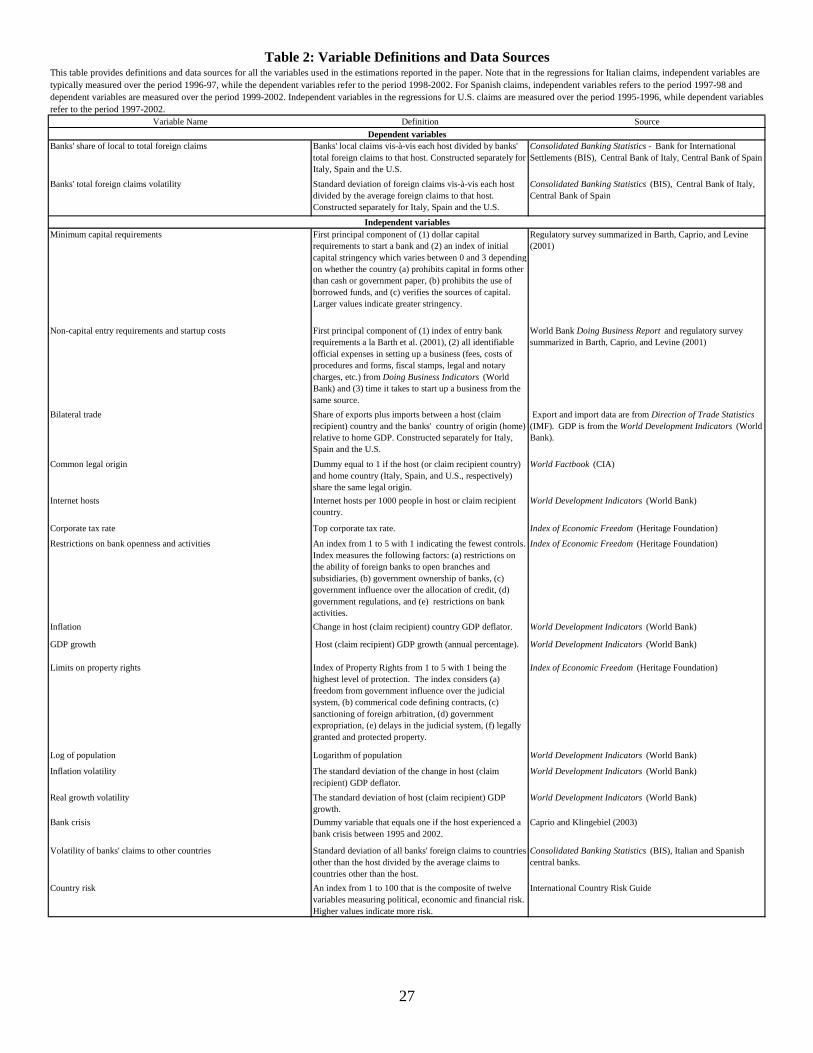
period. Table 2 provides a detailed description of the data and sources used in our study.
Taking into account the existing empirical international banking literature and borrowing
from the theoretical framework used in related trade and multinational firm studies, we model
the average share of local to total foreign claims held by Italian, Spanish, and U.S. banks
overseas as a function of the following factors5:
Share of local foreign claimsi,j= f( Minimum capital requirementsj, Non-capital bank
entry requirements & start-up costsj, Informational costsi,j, Restrictions to Bank
Opennessj, Taxesj, Scale & business opportunitiesj, Risksj ) (1)
Equation (1) is a reduced form model that tries to capture the underlying preferences of
foreign banks and of governments and private agents in the host countries, where i indicates the
international banks’ country of origin (Italy, Spain, or U.S.) and j refers to the host or claim
recipient country.6 We estimate separate cross-country equations for Italian, Spanish, and U.S.
banks’ foreign claims. The share of local foreign claims refers to the ratio of local foreign claims
extended, respectively, by Italian, Spanish, and U.S. banks to each host, expressed as a
percentage of the total foreign claims extended by these banks to each host.
According to the trade/multinational firm literature, one of the main differences between
exports and FDI, is that the latter involves paying sunk costs, typically associated with entry
requirements and start-up costs. Similarly, in banking, sunk costs can be an important
5 Note that the number of factors mentioned in equation (1) is smaller than the number of regressors in Tables 4-6
because as explained below in equation (1), to keep things simple, we include many variables under one name. For
example, informational costs are proxied by bilateral trade, common legal origin and internet hosts.
6 Because we only have aggregate data for foreign banks from three countries, we cannot examine the role of home
country factors and the importance of certain bank specific characteristics.

9
consideration for banks in deciding the type of presence to have in a country. If significant, we
expect to find that sunk costs have an adverse effect on the share of local claims held by foreign
banks. We collected and combined a number of measures of the sunk costs associated with
entering the market and starting up a business. First, we collected data on the minimum capital
requirements (expressed in dollars) banks need to comply with to begin operations in the
countries in our sample. Second, we also take into account the regulations in each country as to
what may constitute bank capital. In particular, we build an index of initial capital stringency that
can take values from 0 to 3, with higher number indicating greater stringency.7 Both this index
and the dollar measure come from a worldwide survey of bank regulators summarized in Barth,
Caprio, and Levine (2001). In the estimations, we combine the dollar measure with the index of
initial capital stringency by obtaining the first principal component of the two series. We refer to
the first principal component of the two series as Minimum capital requirements.8 Third, we
assembled data on the procedures required to open banks across countries from Barth, Caprio,
and Levine (2001). This variable, labeled Non-capital bank entry requirements, is an index that
takes values from 0 to 8, with higher numbers indicating a larger number of procedures.9 In the
7 This index comes from summing up responses to the questions below in the following way: (1) Can initial and
subsequent infusions of regulatory capital include assets other than cash or government securities? 1 if no. (2) Can
the initial infusion of capital be based on borrowed funds? 1 if no. (3) Are the sources of funds that count as
regulatory capital verified by the regulatory or supervisory authorities? 1 if yes.
8 It should be noted that cross-border lending also requires capital for the head office and that it will generally be
higher for more vulnerable host countries, for the same loan size. While the two needs (the minimum capital
requirement to operate locally and the capital needed for cross-border lending) are not easily comparable, minimum
capital requirements should generally involve larger costs when a bank starts to operate locally.
9 The index varies from 0 to 8 depending on whether banks are required to submit none, some, or all of the
following to issue a bank license: (1) draft by-laws, (2) intended organizational chart, (3) first 3-year financial

10
estimations, we combined this index using the method of principal components with two other
measures of the costs of starting a business that come from the World Bank Doing Business
Indicators. In particular, we include survey estimates of the actual monetary costs (in dollars)
and, separately, the time (in number of days) involved in opening a business across countries.
The first measures all identifiable official expenses in setting up any business (not necessarily
banking), namely fees, costs of procedures and forms, fiscal stamps, legal and notary charges,
etc.10 The second, the time variable, captures the number of days to satisfy all procedures that
need to be completed before a business license is issued. We refer to the first principal
component of the bank entry requirement index, the costs, and time to start a business as Non-
capital bank entry requirements and start-up costs.
In the export vs. FDI literature, the higher sunk costs involved in the latter are traded off
against the higher transport costs involved in the former. In banking, physical transportation
projections, (4) financial information on main potential shareholders, (5) background/experience of future directors,
(6) background/experience of future managers, (7) sources of funds to be used to capitalize the new bank, (8)
intended differentiation of new bank from other banks.
10 As stated in the Doing Business Report “the text of the Company Law, the Commercial Code, and specific
regulations and fee schedules are used to calculate the costs [of starting a business]. If there are conflicting sources
and the laws are not clear, the most authoritative source is used. The constitution supersedes the company law, and
the law prevails over regulations and decrees. If conflicting sources are of the same rank, the source indicating the
most costly procedure is used, since an entrepreneur never second-guesses a government official. In the absence of
fee schedules, a governmental officer’s estimate is taken as an official source. In the absence of a government
officer's estimates, estimates of incorporation lawyers are used. If several incorporation lawyers provide different
estimates, the median reported value is applied. In all cases, the cost excludes bribes.” A list of all procedures
considered in estimating the costs of starting a business can be found in:
http://rru.worldbank.org/Documents/DoingBusiness/Methodology/StartingBusiness/StartingBusiness.pdf

11
costs are not likely to be as important. Instead, the literature has discussed the role of
informational costs (see for example Buch, 2003 and Galindo et al., 2003). There are two main
types of informational costs in the international banking business. On the one hand, there are the
costs of screening and monitoring borrowers. These costs will tend to increase the larger the
distance between the bank and its customers. On the other hand, there are the costs to banks’
CEO and shareholders of monitoring the affiliates’ managers and loan officers on the ground.
These costs will also increase the larger the distance between the CEO and the manager/loan
officer. In extending bank claims overseas, the informational costs of monitoring borrowers
decline when banks decide to extend claims locally to foreign countries via their affiliates in
these countries. But, at the same time, by growing the share of foreign claims they extend
locally, international banks increase the costs of monitoring loan officers and affiliate managers.
Thus, the net impact of informational costs on the share of local lending is an empirical question.
Testing the importance of informational costs in international banking decisions is
complicated further by the fact that these cannot be measured directly. Instead, they are often
captured by indicators of geographic, cultural, legal and economic “distance” between countries
that are expected to affect information costs. As distance between an international bank and a
country increases, both, the costs of monitoring foreign clients and bank managers or loan
officers in bank affiliates rise. The discussion above suggests that the distance between the bank
and its customers increases the comparative advantage to international banks of extending claims
locally, since local presence helps to overcome some of these informational costs. Therefore, on
the basis of the costs of monitoring borrowers, distance measures should have a positive impact
on the share of local claims. On the other hand, as distance measures increase, the rising costs of
monitoring loan officers and affiliate managers suggest that distance might have a negative

12
impact on the share of local claims. Thus, a priori the sign of distance measures on the share of
local claims is unclear.
We measure “economic” proximity between the home and the host country by including
a measure of bilateral trade between these economies. We label this variable bilateral trade. This
information comes from the IMF Direction of Trade Statistics.11 We measure home-host country
“institutional” distance by including a dummy that equals one if countries share a common legal
origin (which will then result in similar institutions). We label this dummy common legal origin.
Data on legal origin come from Glick and Rose (2002) and the CIA World Factbook. Finally, we
also take into account that, nowadays, instant methods of communications like phones and
internet connections can help bridge physical distances, making project and management
oversight and access to information possible from far away places. In our regressions, we use the
number of internet hosts per 1000 people (labeled internet hosts) in each recipient country as
measures of access to communications, which are likely to affect monitoring and informational
costs.12 These data come from the World Bank World Development Indicators. We expect that
lending cross-border is easier to countries with better communications, allowing project
monitoring and information gathering to be done “offsite”. Thus, we foresee that this variable
will have a negative impact on the share of local to total foreign claims.
Restrictions on bank activities and regulations that affect foreign entry and foreign
ownership of banks are expected to have a negative impact on the share of local claims. To
11 Ideally, we would have liked to control as well for the share of non-financial FDI from the home to the host
country, however, this information was missing for many of the countries in our sample.
12 In estimations that we do not report here, we also included measures of the number of phone lines in each claim
recipient country. The results are not significantly different. Therefore, to save space we only report results using the
number of internet hosts.

13
control for these factors we include the index of banking and finance produced by the Heritage
Foundation. This index measures the relative openness of a country’s banking system by taking
into account whether foreign banks and financial services firms are able to operate freely, how
difficult is it to open banks and other financial services, how heavily regulated the financial
system is, the presence of state-owned banks, whether the government influences the allocation
of credit, and whether banks are free to offer all types of financial services. This index takes
values from 1 to 5, where higher values represent less openness and greater restrictions in the
banking sector. For the sake of clarity, in the estimations, we label this variable Restrictions on
bank openness and activities.13
Bank profits arising from cross-border activities are taxed at the rate prevalent in the
banks’ country of origin, while taxes on their FDI activities or local claims depend on the hosts’
tax rates. Other things equal, we expect to find relatively lower levels of FDI activity or a smaller
share of local claims in countries with higher corporate taxes. In our study, taxes refer to the top
corporate income taxes in each country as reported by the Heritage Foundation.
Studies on both, cross-border claims and financial FDI, document that economies of
scale, business opportunities, and risks might also affect banks’ decisions to expand
internationally. Thus, the degree to which each of these factors might affect the share of local
claims is an empirical question. However, a priori we could speculate that since the returns from
cross-border lending are limited to the initial claims extended plus an interest rate, while
extending local claims often implies an equity participation in a local affiliate (bringing the
13 We also conducted estimations replacing this variable with a general index on restrictions on foreign capital (also
developed by the Heritage Foundation) and using data on the share of foreign bank applications denied as reported
by Barth, Caprio and Levine (2001). Results are very similar when we use these alternative measures of restrictions
and, hence, we do not report them in the interest of space.
14
potential for unbounded gains and losses), scale economies, business opportunities, and risks
might be more important in driving FDI or local claims relative to cross-border loans.
Following existing international banking studies, we capture the potential for scale
economies and business opportunities in two ways. First, we include the log of population.
Second, we include GDP growth. Economic growth may also be interpreted as a measure of
default risk, since in countries that do not grow, borrowers might have a harder time repaying
their obligations to banks. Data on both of these variables come from the World Bank World
Development Indicators or the IMF International Financial Statistics, depending on the country.
In international banking, pricing risks materialize when the value of the claims or return
on the claims held by foreign banks decline as a result of exchange rate or other price changes.
We measure price risk by controlling for inflation in our estimations.14 Data on inflation comes
from the World Development Indicators.
While both cross-border and local foreign claims are exposed to price and default risks,
local claims are also subject to expropriation risks. We capture the extent of expropriation risks
by including a measure of limits on property rights in the host countries. This measure is an
index compiled by the Heritage Foundation and reported as part of the Index of Economic
Freedom. The index scores the degree to which a country’s laws protect private property and the
extent to which its government enforces those laws. It also assesses the likelihood that private
property will be expropriated and analyzes the independence of the judiciary and the ability of
individuals and businesses to enforce contracts. This index takes values from 1 to 5, with higher
numbers indicating worse property rights protection. In our estimations, we label this variable
limits on property rights.
14 Results remain unchanged if we used the change in the exchange rate instead.

15
We estimate equation (2) below to investigate the implications of the mix of foreign bank
financing for the volatility of foreign claims:
Foreign claims volatilityi,j=g(Share of local claimsi,j, Additional controlsj) (2)
As before, i indicates the lender country and j refers to the borrowing country. Once
again, we estimate separate cross-country equations for Italian, Spanish and U.S. bank claims. In
each of these equations, Foreign claims volatility refers to the standard deviation of respectively,
Italian, Spanish and U.S. banks total foreign claims vis-à-vis each host over the sample period
divided by the average level of foreign claims for each bank to that country. In other words, we
measure volatility with the coefficient of variation of total foreign claims.
The purpose of estimating model (2) is to uncover whether, as some have argued but not
proven empirically (see de Haas and Levyled 2002, Peek and Rosengren 2000, and Palmer
2000), the volatility of foreign claims is lower for countries where foreign claims are
predominantly local (i.e., extended through the overseas affiliates of international banks). Thus,
we are primarily interested in the coefficient on the share of local claims. However, in order to
obtain consistent estimates of this coefficient, it is important to adequately control for other
factors that might influence the volatility of foreign claims. We estimate a number of different
specifications. Specifically, we control for the volatility of growth and inflation in the host
economy, banking crisis episodes over the period of study, the volatility of foreign claims to
countries other than the hosts, the size of the host country, the extent of property rights
protection, and the perceived country risk in the host.
Growth and inflation volatilities (labeled respectively, growth volatility and inflation
volatility) are captured by the standard deviation of GDP growth and inflation. The banking
crisis variable is a dummy that equals one for those host countries that experienced a banking
16
crisis over the period of study. These episodes are identified based on Caprio and Klingebiel
(2003). The variable labeled volatility of claims to other countries is the standard deviation of
claims from banks from country i to countries other than host j divided by the average level of
foreign claims to countries other than j. The idea behind this variable is that the volatility of
claims to a specific host might be influenced by what foreign banks do and experience in other
host countries or even in their home countries (which affect all hosts simultaneously). Country
size is measured by the log of population. The limits on property rights protection are captured
by the index from the Heritage Foundation described above. Country risk is an index compiled
by the International Country Risk Guide (ICRG).15
4- Empirical Results
We first discuss the results on the determinants of the mix of foreign bank claims.
Because in many cases the share of local claims is zero, we report Tobit estimations to take this
censoring into account.16 To avoid endogeneity concerns, regressors are lagged relative to the
start of the sample for the share of local claims.17 Finally, given that regressors are measured in
15 This index is defined by ICRG so that higher values mean less risk, but in our estimations we reverse the sign on
this variable to give it the more intuitive interpretation that higher values mean more risk.
16 We also tried to estimate a Heckman model to take into account the possibility of selection bias, but estimations
did not converge because there are too few cases when total claims are 0 (i.e., when the share of local claims is not
observed).
17 In the regressions using Italian bank claims, regressors are averages for the period 1996-97, while the share of
local claims is measured as the average over 1998-2002. In the regressions using Spanish bank claims, regressors
correspond to the period 1997-98 and the share of local claims is the average between 1999 and 2002. In the U.S.
regressions, the share of local claims is averaged over the period 1997-2002, while regressors are expressed as

17
different units, to allow for an easy comparison of coefficient magnitudes across variables, we
report x-standardized coefficients. These are coefficients obtained from regressing the share of
local claims on normalized regressors with zero mean and unit standard deviation.18 They
measure the change in the share of local claims (expressed in percentage points) for a one
standard deviation change in the regressor.
Table 3 presents the results for the share of local foreign bank claims held by Italian,
Spanish, and U.S. banks. In the case of Italy, we find that scale economies/business opportunities
(as proxied by the log of population), restrictions on bank openness, taxes, and a measure of
informational costs (i.e., the degree of bilateral trade) are all important determinants of the share
of local claims for Italian banks. As expected, restrictions on bank openness and activities and
taxation have a negative impact on the share of local claims. Among these two variables,
restrictions on bank openness has the largest effect. A one standard deviation change in this
variable produces between a 17.5 and an 18.1 percentage point drop in the share of local claims.
On the other hand, a similar increase in taxes leads to at most a 15 percentage points decline in
the share of local claims. The log of population and the share of bilateral trade are positively
associated with the share of Italian local claims, but the effect of population size far outweighs
that of bilateral trade. A one standard deviation change in population size increases the share of
local claims by between 18.2 and 22.3 percentage points, while a similar change in the ratio of
bilateral trade to GDP increases the share of local claims by up to 7.6 percentages points.
averages for 1995-1996. The only variables that cannot be lagged are the minimum capital requirements and start-up
costs since these data are only available at one point in time.
18 These are obtained by subtracting from each regressor the mean and by dividing each de-meaned variable by its
standard deviation.

18
The share of Spanish local claims is driven by the extent of scale economies/business
opportunities in the host market, restrictions on bank openness, limits on property rights
protection and the minimum capital requirements for bank entry. Also, two proxies for
informational costs – a dummy indicating whether the host country shares the same legal origin
as Spain and the number of internet hosts in the claim recipient country- are also significant,
albeit with opposite signs. As expected, restrictions on bank openness, limits on property rights
protection, and the minimum capital requirements for bank entry have a negative impact on the
share of local claims. The impact of the first two is very similar, while the effect of bank capital
requirements is almost half that of the other two variables. A one standard deviation change in
the measure of restrictions on bank openness and on the variable capturing limits on property
rights protection results in approximately a 20 percentage points decline in the share of Spanish
local claims, while a similar change in the measure of minimum capital requirements leads to an
almost 9 percentage points drop in the share of local claims. The extent of scale
economies/business opportunities in the host country – as measured by the log of population –
has by far the largest economic impact on the share of local Spanish claims. A one standard
deviation change in this variable results in a 36 to 46 percentage points increase in the share of
local claims, depending on the specification. The common legal origin variable also has a
positive and significant impact on the share of local claims. However, in this case a one standard
deviation change in this variable leads to an increase in the share of local claims between 17.3
and 18.1 percentage points, depending on the specification. We interpret the common legal
origin variable as a measure of proximity with the host and, hence as a proxy for lower
informational costs. Finally, better communications in the claim recipient country, as proxied by
the number of internet hosts, facilitates cross border lending and is expected to have a negative

19
impact on the share of local claims. This is the case in column first specification shown for
Spanish claims, where a one standard deviation increase in this variable leads to a 14 percentage
point drop in the share of local claims.
Non-capital bank entry requirements and start-up costs, restrictions on bank openness and
scale economies/business opportunities have a significant and consistent impact on the share of
U.S. banks’ local claims. Among these variables, the measure of scale economies/business
opportunities has the largest economic impact. A one standard deviation change in the log of
population, results in a 25 percentage points increase in the share of local claims. Restrictions on
bank openness follow in economic importance, but as expected their impact is negative. A one
standard deviation change in this variable leads to between 10 to 13 percentage points decline in
the share of local claims. The combined measure of non-capital bank entry requirements and
start-up costs also has a negative impact on the share of local claims, but this variable’s
economic impact is half that of the measure of restrictions on bank openness.
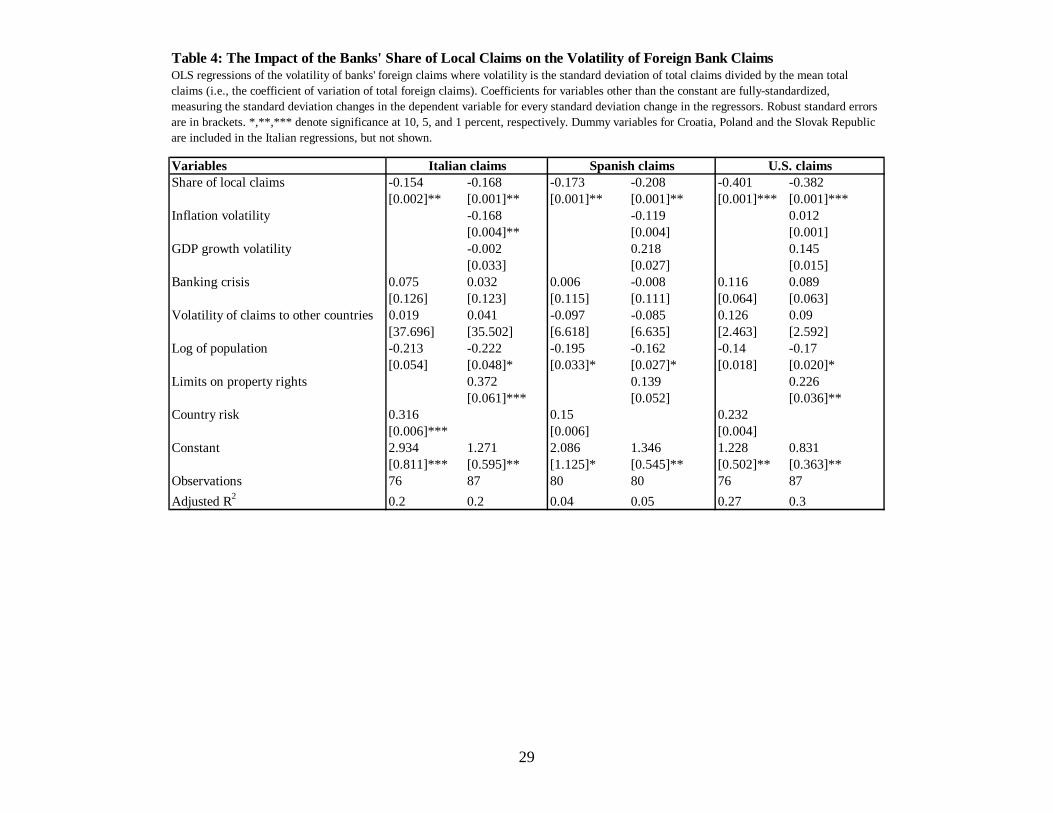
Table 4 presents the OLS results for the volatility of Italian, Spanish and U.S. claims,
respectively, measured by the coefficient of variation (the ratio of the standard deviation to the
mean). As in the share of local claims regressions, we lagged regressors to minimize endogeneity
concerns. Furthermore, we report fully-standardized coefficients that measure standard deviation
changes in the dependent variable for every one standard deviation change in the regressors.19
Depending on the specification, we control for price and growth volatility, banking crisis
episodes, the volatility of foreign claims vis-à-vis countries other than the host, the size of the
19 We include separate dummies for countries that exhibited extreme volatility due to some unusual event or
transaction. This meant adding dummies for Croatia, Poland, and the Slovak Republic in the estimates for Italian
banks, since these countries experienced an abrupt change in the share of local Italian claims due to mergers and
acquisitions. In the interest of space, coefficients on the dummies are not shown.

20
country (as measured by the log of population), a measure of limits on property rights protection,
and an index of country risk in the host.20
The results for the volatility of Italian bank claims indicate that the share of local claims
has a consistently significant and negative impact on total claims volatility. Independently of
what controls are included, countries with a higher share of Italian bank local claims exhibit
lower total claims volatility. The economic impact of this variable ranges from 0.15 – meaning a
one standard deviation change in the share results in a 0.15 standard deviation drop in volatility –
to 0.17, depending on the controls we include.
The share of Spanish local claims also has a negative impact on total Spanish claim
volatility. In this case, a one standard deviation change in the share leads to at most a 0.21
standard deviation drop in the volatility of total claims.
Consistent with what we have found for Italy and Spain, the share of local U.S. claims
has a negative and significant impact on the volatility of U.S. total claims. In this case, a one
standard deviation change in the share of local claims can result in anywhere from a 0.38 to a
0.40 standard deviation change in total claims’ volatility, depending on the specification.
5- Conclusions
While a vast literature exists analyzing the cross-border and local activities of
multinational banks across countries, the determinants and implications of the mix of
international bank claims had not, to our knowledge, been explored before. Using a new dataset
on the Italian, Spanish, and U.S. bank claims vis-à-vis more than 100 countries, this paper
20 Because the country risk index captures many of the economic and institutional features of the economy we
exclude inflation volatility, growth volatility, and property rights when we include the country risk measure.

21
offered a first attempt at examining these issues. First, we estimated a reduced form empirical
model of the share of local to total foreign claims across host countries. We found that regulatory
barriers to banking and measures of business opportunities and scale economies have the most
consistently significant impact on the share of local bank claims. Bank entry requirements, start-
up and informational costs, as well as limits on property rights also seem to be important
determinants of the share of local claims, but their impact is smaller and less robust. Second, we
presented evidence that the mix or composition of foreign bank financing affects the stability of
foreign bank claims to host countries. Countries where a larger share of foreign claims is
extended through the local affiliates of foreign banks rather than through cross-border loans tend
to enjoy more stable foreign financing.
While this study is, to our knowledge, the first to examine the determinants and
implications of the mix of foreign bank claims, the analysis conducted is not without limitations.
In particular, the time series analyzed is short and the number of home countries considered is
small. Thus, it would be important that as more data become available, further research is
conducted to verify the robustness of our results over more comprehensive datasets. Also, the
mix of foreign financing may have effects other than its impact on financial stability that host
countries may consider important. For example, host countries may be concerned about the type
of financing received, because of their balance of payments needs. Exploring these alternative
implications from the mix of foreign bank claims is also left for future research.

22
References
Bank for International Settlements Consolidated Banking Statistics
http://www.bis.org/statistics/consstats.htm
Barajas, A., Steiner, R., Salazar, N., 2000. The impact of liberalization and foreign investment in
Colombia’s financial sector. Journal of Development Economics 63 (1), 157--96.
Barth, J., Caprio, G., Levine, R., 2001. The regulation and supervision of banks around the
world: A new database. Policy Research Working Paper No. 2588. World Bank:
Washington, D.C.
Berger, A., Klapper, L., Udell. U., 2001. The ability of banks to lend to informationally opaque
small businesses. Journal of Banking and Finance 25 (12), 2127--2167.
Brainard, S.L., 1997. An empirical assessment of the proximity-concentration trade-off between
multinational sales and trade. American Economic Review 87 (4), 520--544.
Buch, C.M., 2000. Why do banks go abroad? Evidence from German data. Financial Markets,
Institutions and Instruments 9 (1), 34--67.
Buch, C.M., 2003. Information or regulation: What drives the international activities of
commercial banks? Journal of Money, Credit and Banking 35(6), 851--869.
Buch, C.M., DeLong, G.L., 2001. Cross-border bank mergers: what lures the rare animal?
Kiel Institute of World Economics Working Paper No. 1070.
Buch, C.M., Lipponer, A., 2004. FDI versus cross-border financial services: The globalization of
German banks. Deutsche Bundesbank Discussion Paper - Series 1 05/2004.

23
Caprio, G., Klingebiel, D., 2003. Episodes of systemic and borderline banking crises. Mimeo.
The World Bank.
Central Intelligence Agency World Factbook , 2004. www.cia.gov/cia/publications/factbook/
Claessens, S., Demirgüç-Kunt, A., Huizinga, H., 2000. The role of foreign banks in domestic
banking systems, in Claessens, S., Jansen, M. (Eds), The Internationalization of Financial
Services: Issues and Lessons for Developing Countries. Kluwer Academic, Boston.
Clarke, G., Cull, R., Martínez Peria, M.S., Sánchez, S., 2003. Foreign bank entry: experience,
implications for developing countries, and agenda for further research. World Bank
Research Observer 18 (1), 25--40.
Clarke, G., Cull, R., Martínez Peria, M.S., Sánchez, S., 2005. Bank lending to small businesses
in Latin America: Does bank origin matter? Journal of Money, Credit, and Banking
37(1), 83--118.
Dages, G., Goldberg, L., Kinney, D., 2000. Foreign and domestic bank participation in emerging
markets: Lessons from Mexico and Argentina. Federal Reserve Bank of New York
Economic Policy Review, 17--36.
Dahl, D., Shrieves, R.E., 1999. The extensions of international credit by U.S. banks: A
disaggregated analysis, 1988-1994. Journal of International Money and Finance 18, 153--
167.
De Haas, R., van Lelyveld, I., 2002. Foreign bank penetration and private sector credit in Central
and Eastern Europe. De Nederlandsche Bank Staff Reports No. 91.
De Haas, R., van Lelyveld, I., 2004. Foreign banks and credit stability in Central and Eastern
Europe: A panel data analysis. De Nederlandsche Bank Staff Reports No. 109.

24
Denizer, C., 2000. Foreign entry in Turkey's banking sector, 1980-1997, in Claessens, S., Jansen,
M. (Eds.), The Internationalization of Financial Services: Issues and Lessons for
Developing Countries pp. 389-406. Kluwer Academic Press, Boston.
Detragiache, E., Gupta, P., 2004. Foreign banks in emerging market crises: evidence from
Malaysia. IMF working paper No. 04/129.
Focarelli, D., Pozzolo, A., 2001. The patterns of cross-border bank mergers and shareholdings in
OECD Countries. Journal of Banking and Finance 25 (12), 2305--2337.
Focarelli, D., Pozzolo, A., 2006. Where do banks expand abroad? An empirical analysis. Journal
of Business 79 (1).
Galindo, A., Micco, A., Serra, C., 2003. Better the devil that you know: evidence on entry costs
faced by foreign banks. Inter-American Development Bank Working Paper No. 477.
Glick, R., Rose, A.K., 2002. Does a currency union affect trade? The time series evidence.
European Economic Review 46 (6), 1125--1151.
Guillen, M., Tschoegl, A., 2000. The internationalization of retail banking: the case of the
Spanish banks in Latin America. Transnational Corporations 9 (3), 63--98.
Helpman, E., Melitz, M.J., Yeaple, S.R., 2003. Exports versus FDI. National Bureau of
Economic Research Working Paper No. 9439.
Heritage Foundation. Index of Economic Freedom. Heritage Foundation Press, Washington, D.C.
Jeannau, S., Micu, M., 2002. Determinants of international bank lending to emerging market
countries. Bank of International Settlements Working Papers No. 112.
Kawai, M., Liu, L.G., 2002. Determinants of international commercial bank loans to developing
countries. Mimeo.

25
Martínez Pería, M.S., Mody, A., 2004. How foreign participation and market concentration
impact bank spreads: evidence from Latin America, Journal of Money, Credit, and
Banking 36 (3), 511--539.
Mian, A., 2006. Distance constraints: the limits of foreign lending in poor economies. Journal of
Finance. Forthcoming.
Moshirian, F., 2001. International investment in financial services. Journal of Banking and
Finance 25, 317--337.
Palmer, D., 2000. U.S. bank exposure to emerging-market countries during recent financial
crises. Federal Reserve Bulletin, (February), 81--96.
Peek, J., Rosengren, E., 2000. Implications of the globalization of the banking sector: the Latin
American experience. Federal Reserve Bank of Boston New England Economic Review
(September–October), 45--62.
Wezel, T., 2004. Foreign bank entry into emerging economies: an empirical assessment of
the determinants and risks predicated on German FDI data. Deutsche Bundesbank
Discussion Paper - Series 1 01/2004.
World Bank Doing Business Indicators. http://rru.worldbank.org/DoingBusiness/.

26
Country Share of local claims held by Italian banks
Share of local claims held by Spanish banks
Share of local claims held by US banks
Country Share of local claims held by Italian banks
Share of local claims held by Spanish banks
Share of local claims held by US banks
Albania 0.00 0.00 0.00 Lesotho 0.00 NC .Algeria 0.00 0.00 40.53 Lithuania 0.00 0.00 0.00Argentina 66.14 82.13 55.31 Madagascar 0.00 0.00 NCArmenia 0.00 NC NC Malawi 0.00 0.00 2.22Australia 0.00 0.09 73.45 Malaysia 0.00 0.00 82.79Austria 2.24 1.14 0.64 Mali 0.00 0.00 0.00Bangladesh 0.00 NC 61.47 Mexico 0.00 90.51 50.03Belarus 0.00 0.00 0.00 Moldova 0.00 0.00 0.00Belgium 9.74 13.40 24.67 Morocco 0.00 26.12 27.98Bhutan NC NC 0.00 Namibia 0.00 0.00 0.00Bolivia 0.00 92.86 36.70 Nepal 0.00 NC 0.00Botswana NC NC 0.00 Netherlands 2.81 0.57 1.93Brazil 76.34 85.19 50.90 New Zealand 0.00 0.00 56.47Bulgaria 42.41 0.00 13.93 Nicaragua 0.00 0.00 0.00Burkina Faso NC NC NC Niger NC NC 0.00Burundi NC NC NC Nigeria 0.00 0.00 52.82Cambodia NC NC 0.00 Norway 0.00 0.00 5.47Canada 58.89 2.66 61.49 Oman 0.00 0.00 29.84Chile 28.19 85.68 57.05 Pakistan 0.00 0.00 80.60China 26.81 0.19 28.65 Panama 15.75 71.84 53.04Colombia 65.29 75.86 33.40 Papua NC 0.00 64.91Congo 0.00 0.00 0.00 Paraguay 91.12 88.11 88.41Costa Rica 0.00 2.14 25.98 Peru 94.19 87.86 33.13Cote d'Ivoire 0.00 0.00 79.34 Philippines 0.00 63.63 55.42Croatia 87.41 0.00 0.00 Poland 89.84 0.04 69.65Czech Republic 7.91 55.33 73.99 Portugal 0.00 82.89 20.63Ecuador 0.00 1.07 12.26 Romania 21.22 0.00 51.63Egypt 0.00 0.00 58.59 Russia 0.00 0.72 18.17El Salvador 0.00 20.40 22.16 Rwanda NC NC NCEstonia 0.00 0.00 0.00 Saudi Arabia 0.00 0.00 0.00Finland 0.00 0.00 1.59 Senegal 0.00 0.00 80.79France 35.66 27.53 13.34 Singapore 52.90 3.99 76.77Germany 16.90 22.02 27.55 Slovak Republic 81.09 0.00 56.02Ghana 0.00 0.00 0.16 Slovenia 1.01 0.00 0.12Greece 8.83 3.78 54.06 South Africa 0.00 1.55 35.54Guatemala 0.00 0.00 14.08 Spain 45.68 . 47.50Honduras NC 4.46 14.03 Sri Lanka 0.00 NC 64.46Hong Kong 72.31 82.48 74.41 Sweden 0.00 0.00 7.24Hungary 79.92 9.45 53.91 Switzerland 14.39 25.91 15.50India 0.00 68.32 72.97 Taiwan 0.00 0.00 80.00Indonesia 0.00 0.00 32.28 Thailand 0.00 0.00 70.64Ireland 10.99 4.82 19.82 Togo 0.00 0.00 0.00Israel 7.95 0.00 11.67 Tunisia 0.00 0.00 71.89Italy . 45.17 18.15 Turkey 3.43 0.32 19.89Jamaica 0.00 NC 42.52 Ukraine 6.06 0.00 22.52Japan 76.14 12.33 57.47 United Arab Emirates 42.19 0.00 71.50Jordan 0.00 0.00 59.61 United Kingdom 30.13 24.19 49.43Kazakhstan 0.00 0.00 49.31 United States 47.31 62.46 .Kenya 0.00 0.00 62.94 Uruguay 83.05 76.61 54.58Korea 0.00 0.34 54.38 Venezuela 0.00 89.60 17.47Kuwait 0.00 0.00 0.02 Vietnam 0.00 0.00 66.95Latvia 0.00 . 0.00 Zambia 0.00 NC 89.74Lebanon 34.29 0.00 50.29 Zimbabwe 0.00 0.00 1.29
Table 1: Italian, Spanish, and U.S. Banks' Share of Local to Total Foreign ClaimsThis table shows the share of local claims to total foreign claims held by Italian, Spanish and U.S. banks vis-à-vis over 100 countries. For Italy, the shares are averages for the period 1998-2002. In the case of Spanish banks, the data are averages for 1999-2002, while for the U.S. we report average shares for the period 1997-2002. "N.C." stands for "no claims" and "." means missing data.
27
Variable Name Definition Source
Banks' share of local to total foreign claims Banks' local claims vis-à-vis each host divided by banks' total foreign claims to that host. Constructed separately for Italy, Spain and the U.S.
Consolidated Banking Statistics - Bank for International Settlements (BIS), Central Bank of Italy, Central Bank of Spain
Banks' total foreign claims volatility Standard deviation of foreign claims vis-à-vis each host divided by the average foreign claims to that host. Constructed separately for Italy, Spain and the U.S.
Consolidated Banking Statistics (BIS), Central Bank of Italy, Central Bank of Spain
Minimum capital requirements First principal component of (1) dollar capital requirements to start a bank and (2) an index of initial capital stringency which varies between 0 and 3 depending on whether the country (a) prohibits capital in forms other than cash or government paper, (b) prohibits the use of borrowed funds, and (c) verifies the sources of capital. Larger values indicate greater stringency.
Regulatory survey summarized in Barth, Caprio, and Levine (2001)
Non-capital entry requirements and startup costs First principal component of (1) index of entry bank requirements a la Barth et al. (2001), (2) all identifiable official expenses in setting up a business (fees, costs of procedures and forms, fiscal stamps, legal and notary charges, etc.) from Doing Business Indicators (World Bank) and (3) time it takes to start up a business from the same source.
World Bank Doing Business Report and regulatory survey summarized in Barth, Caprio, and Levine (2001)
Bilateral trade Share of exports plus imports between a host (claim recipient) country and the banks' country of origin (home) relative to home GDP. Constructed separately for Italy, Spain and the U.S.
Export and import data are from Direction of Trade Statistics (IMF). GDP is from the World Development Indicators (World Bank).
Common legal origin Dummy equal to 1 if the host (or claim recipient country) and home country (Italy, Spain, and U.S., respectively) share the same legal origin.
World Factbook (CIA)
Internet hosts Internet hosts per 1000 people in host or claim recipient country.
World Development Indicators (World Bank)
Corporate tax rate Top corporate tax rate. Index of Economic Freedom (Heritage Foundation)
Restrictions on bank openness and activities An index from 1 to 5 with 1 indicating the fewest controls. Index measures the following factors: (a) restrictions on the ability of foreign banks to open branches and subsidiaries, (b) government ownership of banks, (c) government influence over the allocation of credit, (d) government regulations, and (e) restrictions on bank activities.
Index of Economic Freedom (Heritage Foundation)
Inflation Change in host (claim recipient) country GDP deflator. World Development Indicators (World Bank)
GDP growth Host (claim recipient) GDP growth (annual percentage). World Development Indicators (World Bank)
Limits on property rights Index of Property Rights from 1 to 5 with 1 being the highest level of protection. The index considers (a) freedom from government influence over the judicial system, (b) commerical code defining contracts, (c) sanctioning of foreign arbitration, (d) government expropriation, (e) delays in the judicial system, (f) legally granted and protected property.
Index of Economic Freedom (Heritage Foundation)
Log of population Logarithm of population World Development Indicators (World Bank)
Inflation volatility The standard deviation of the change in host (claim recipient) GDP deflator.
World Development Indicators (World Bank)
Real growth volatility The standard deviation of host (claim recipient) GDP growth.
World Development Indicators (World Bank)
Bank crisis Dummy variable that equals one if the host experienced a bank crisis between 1995 and 2002.
Caprio and Klingebiel (2003)
Volatility of banks' claims to other countries Standard deviation of all banks' foreign claims to countries other than the host divided by the average claims to countries other than the host.
Consolidated Banking Statistics (BIS), Italian and Spanish central banks.
Country risk An index from 1 to 100 that is the composite of twelve variables measuring political, economic and financial risk. Higher values indicate more risk.
International Country Risk Guide
Table 2: Variable Definitions and Data Sources
Dependent variables
Independent variables
This table provides definitions and data sources for all the variables used in the estimations reported in the paper. Note that in the regressions for Italian claims, independent variables are typically measured over the period 1996-97, while the dependent variables refer to the period 1998-2002. For Spanish claims, independent variables refers to the period 1997-98 and dependent variables are measured over the period 1999-2002. Independent variables in the regressions for U.S. claims are measured over the period 1995-1996, while dependent variables refer to the period 1997-2002.

28
VariablesMinimum capital requirements 12.247 -8.664 -0.998
[9.101] [5.008]* [3.559]Non-capital bank entry req. & start-up costs 6.406 8.22 11.196 8.702 -5.391 -6.697
[5.554] [5.671] [7.352] [5.922] [3.210]* [3.012]**Bilateral trade 6.061 7.595 0.302 0.45 0.092 0.485
[3.494]* [4.014]* [2.007] [2.012] [1.608] [1.350]Common legal origin -1.088 -1.349 17.252 18.122 2.893 3.345
[5.783] [5.978] [4.801]*** [4.660]*** [2.845] [2.882]Internet hosts -6.081 -2.747 -14.385 -4.969 -4.814 -5.581
[5.887] [5.413] [7.568]* [3.939] [1.889]** [1.831]***Taxes -13.189 -15.629 -2.922 -8.071 -5.281 -5.398
[6.052]** [6.517]** [6.112] [5.272] [4.507] [4.603]Restrictions on bank openness & activities -17.527 -18.106 -20.041 -18.004 -10.164 -13.131
[7.927]** [8.216]** [8.467]** [8.548]** [5.080]** [4.823]***Inflation 2.707 3.623 -80.031 -84.139 -29.966 -39.873
[77.527] [81.666] [62.524] [57.618] [23.791] [22.108]*GDP growth 19.214 9.861 21.798 37.233 6.102 1.716
[19.885] [20.288] [14.840] [15.145]** [7.715] [6.447]Limits on property rights -11.125 -8.448 -19.704 -18.062 -2.866 -1.691
[10.528] [10.260] [8.388]** [8.007]** [5.817] [5.643]Log of population 22.265 18.157 36.672 46.018 25.264 24.775
[11.074]** [10.731]* [9.283]*** [8.492]*** [4.534]*** [4.255]***Constant -31.494 -39.992 -57.161 -59.367 9.391 7.572
[14.337]** [14.886]*** [11.064]*** [10.419]*** [5.794] [5.429]Observations 77 87 74 80 79 88
Pseudo R2 0.047 0.047 0.127 0.117 0.067 0.061
Table 3: Determinants of Banks' Share of Local ClaimsTobit regressions for the share of local to total foreign claims. X-standardized coefficients are reported for all variables other than the constant. X-standardized cofficients measure the change in the share of local claims expressed in percentage points for every one standard deviation change in the regressors. Robust standard errors are in brackets. *,**,*** denote significance at 10, 5, and 1 percent, respectively.
Italian claims U.S. claimsSpanish claims
29
VariablesShare of local claims -0.154 -0.168 -0.173 -0.208 -0.401 -0.382
[0.002]** [0.001]** [0.001]** [0.001]** [0.001]*** [0.001]***Inflation volatility -0.168 -0.119 0.012
[0.004]** [0.004] [0.001]GDP growth volatility -0.002 0.218 0.145
[0.033] [0.027] [0.015]Banking crisis 0.075 0.032 0.006 -0.008 0.116 0.089
[0.126] [0.123] [0.115] [0.111] [0.064] [0.063]Volatility of claims to other countries 0.019 0.041 -0.097 -0.085 0.126 0.09
[37.696] [35.502] [6.618] [6.635] [2.463] [2.592]Log of population -0.213 -0.222 -0.195 -0.162 -0.14 -0.17
[0.054] [0.048]* [0.033]* [0.027]* [0.018] [0.020]*Limits on property rights 0.372 0.139 0.226
[0.061]*** [0.052] [0.036]**Country risk 0.316 0.15 0.232
[0.006]*** [0.006] [0.004]Constant 2.934 1.271 2.086 1.346 1.228 0.831
[0.811]*** [0.595]** [1.125]* [0.545]** [0.502]** [0.363]**Observations 76 87 80 80 76 87
Adjusted R2 0.2 0.2 0.04 0.05 0.27 0.3
Table 4: The Impact of the Banks' Share of Local Claims on the Volatility of Foreign Bank ClaimsOLS regressions of the volatility of banks' foreign claims where volatility is the standard deviation of total claims divided by the mean total claims (i.e., the coefficient of variation of total foreign claims). Coefficients for variables other than the constant are fully-standardized, measuring the standard deviation changes in the dependent variable for every standard deviation change in the regressors. Robust standard errors are in brackets. *,**,*** denote significance at 10, 5, and 1 percent, respectively. Dummy variables for Croatia, Poland and the Slovak Republic are included in the Italian regressions, but not shown.
Italian claims Spanish claims U.S. claims