The minimum wage in Ireland - Ibec · PDF fileThe minimum wage in Ireland An Ibec submission...
20
The minimum wage in Ireland An Ibec submission to the Low Pay Commission February 2017
Transcript of The minimum wage in Ireland - Ibec · PDF fileThe minimum wage in Ireland An Ibec submission...

1
The minimum wage in
Ireland
An Ibec submission to the Low Pay
Commission
February 2017

2
Table of Contents Executive Summary
1. Introduction
2. Economic Context
3. Recent changes in the minimum wage
4. Competitiveness and Business Costs
5. Sectoral Analysis
6. Cost of Living
7. Low Pay and Income Inequality

3
Key messages for the Low Pay Commission:
1. Economic uncertainty means there should be no increase in the minimum wage Ireland will face a challenging year in 2017 as both Brexit and global uncertainty threaten our growth prospects. A weak sterling is already impacting certain sectors in the economy and many leading indicators already show signs of a slowdown. Retail sales, industrial production and exports all showed signs of weakness in recent months. Ibec forecasts for 2017 are lower than previous years as we are now expecting GDP growth of only 2.8% this year. As a result, Ibec believes that there is very little justification for increasing the minimum wage.
2. Sectoral Affordability
Brexit uncertainty will impact certain sectors more than others. It will have a disproportionate impact on the indigenous sectors that are more likely to pay the minimum wage i.e. retail, hospitality and food. A weak sterling is already impacting retail, as sales slowed significantly in the latter half of 2016. This was accompanied by a sharp rise in both cross-border and online shopping. The food sector is also exposed as almost 41% of its exports go to the UK and there has been a significant decline in these exports since the referendum. The tourism sector will also suffer setbacks with 41% of tourists coming from Britain.
3. International Competitiveness
Our overall competitiveness deteriorated last year due to a weak sterling. It is now vital that other costs are kept in line to avoid a further decline. Ireland’s minimum wage is now 7% higher than 2015. This pushed our minimum wage from the 5
th to the 2
nd highest in the EU.
Over the same period, there was no inflation in the economy. Since its introduction, the minimum wage has consistently grown at a faster rate than inflation. As a result, the minimum wage is now 28% higher than it would have been if it were pegged to inflation. 4. Cost of living Prices are currently still at 2008 levels as there was no major change in the overall price level in the past three years. On this basis, there is no reason for the minimum wage to increase because of rises in the cost of living. While the price of certain items increased, there is no evidence that minimum wage workers are disproportionately affected. Rent is one area where prices increased most, however, in 2013 only a third of minimum wage workers were living in private rented accommodation.
5. Minimum wage is a poor instrument to tackle household poverty and Income
inequality The OECD noted (2015) that the minimum wage is a “blunt instrument” for reducing poverty. This is because many low income households do not have any member who is working. Evidence from the ESRI has found that while minimum wage workers are the lowest earners, they typically do not live in low income households. Minimum wage workers are typically found in average or high income households as they usually are not the primary earner. If the increase in the minimum wage is passed on to consumers through higher prices, it would hurt low income households. Increasing the minimum wage is therefore very unlikely to have any meaningful impact on reducing poverty in Ireland.

4
1. Introduction
Ibec supports the minimum wage as a principle and recognises that the wage floor should increase as economic circumstances improve. It is vital; however, that the minimum wage is appropriate, competitive and affordable whilst also taking into account the cost of living. This year will bring great challenges for Ireland as both Brexit and a slowdown in global trade pose a major threat to the economy. Some leading indicators (i.e. retail sales, industrial production, exports and tax receipts) already suggest that the economy is entering into a slowdown. Furthermore, our overall competitiveness has deteriorated on the back of exchange rate movements. The sectors that will be most affected in 2017 will be those that are sensitive to fluctuations in the exchange rate. In last year’s report, the Low Pay Commission established that almost half of minimum wage workers are employed in retail and hospitality. Both these sectors suffered serious losses in 2008 when sterling depreciated. Therefore it is likely that 2017 will also be extremely challenging. In terms of the cost of living, overall prices are still at 2008 levels. Price competition in the retail sector has caused the price of goods to fall (along with margins). While the cost of certain items is rising, there is no evidence that minimum wage workers are disproportionately affected. Ibec strongly encourages that these factors will be taken into account when the Low Pay Commission makes its decision. Given the difficulties that certain firms will face this year, Ibec holds that there is little justification for increasing the minimum wage. Ibec’s position is that any changes to the minimum wage should be strongly evidence-based and linked to the following factors:
Considerations for changes in the minimum
wage
International Competitiveness Economic Context The Cost of
Living Sectoral
Affordability

5
2. Economic Context The economy grew by 4.7% in the first three quarters of 2016. This is very strong growth, but it is not expected to continue into 2017. The confluence of strong growth in the US and UK, a benign global environment, low interest rates and falling oil prices, played a significant role in Ireland’s economic recovery. However, these factors are now under threat and will not have the same positive impact on our economy in the future. Furthermore, the combination of Brexit, political uncertainty in Europe and threats to globalisation will pose a significant threat to Ireland’s economic prospects in 2017. As a result, Ibec’s forecasts for GDP growth for 2017 are substantially lower than previous years at 2.8%. A number of leading indicators are already showing signs that a slowdown is happening in the Irish economy. Retail sales, tax receipts, industrial production and exports showed signs of weakness in recent months. 2.1 Labour Market Employment has made a substantial recovery in recent years and is now only 6% below its pre-crisis peak. In 2016 average employment growth in the first three quarters was 2.7%, slightly higher than growth in 2015. Unemployment is now down to 7.9% with preliminary CSO estimates suggesting it could be as low as 7.1%. This is half that of 2012, when it reached over 15%. Despite these improvements, some sectors and regions have not achieved the same gains and are still in a very fragile position. Regional Employment During the initial stages of our recovery, employment growth was heavily concentrated in Dublin. This is now no longer the case, as employment grew in all regions last year. However, as shown in figure 1 below, there is still a lot of variation between the regions. Employment in Dublin is now only 3% below peak levels. On the other hand, the Border and West still have a long way to go as employment is more than 10% below peak levels. These are the regions that will also face the most challenges from Brexit, and are therefore less likely to see a significant improvement in the near future.
Source:CSO
80% 85% 90% 95% 100%
Dublin
South-East
South-West
State
Midland
Mid-East
Mid-West
West
Border
Figure 1: Employment as % of peak
Peak Employment
6
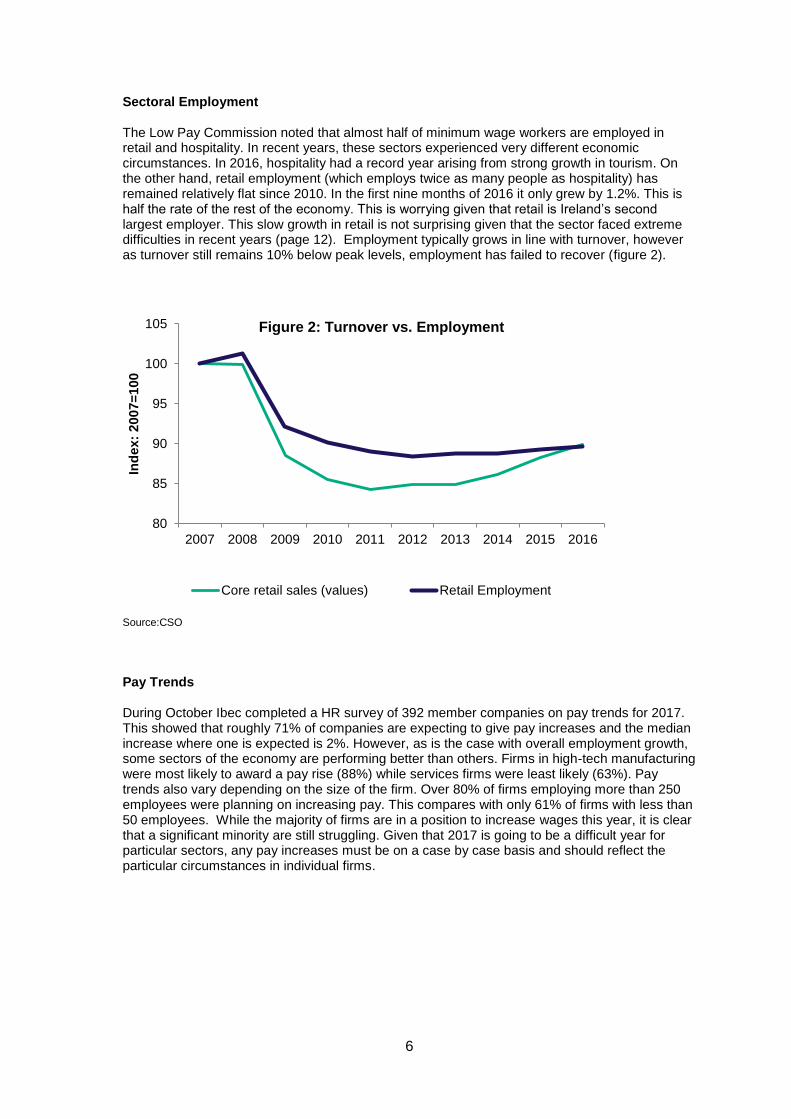
Sectoral Employment The Low Pay Commission noted that almost half of minimum wage workers are employed in retail and hospitality. In recent years, these sectors experienced very different economic circumstances. In 2016, hospitality had a record year arising from strong growth in tourism. On the other hand, retail employment (which employs twice as many people as hospitality) has remained relatively flat since 2010. In the first nine months of 2016 it only grew by 1.2%. This is half the rate of the rest of the economy. This is worrying given that retail is Ireland’s second largest employer. This slow growth in retail is not surprising given that the sector faced extreme difficulties in recent years (page 12). Employment typically grows in line with turnover, however as turnover still remains 10% below peak levels, employment has failed to recover (figure 2).
Source:CSO
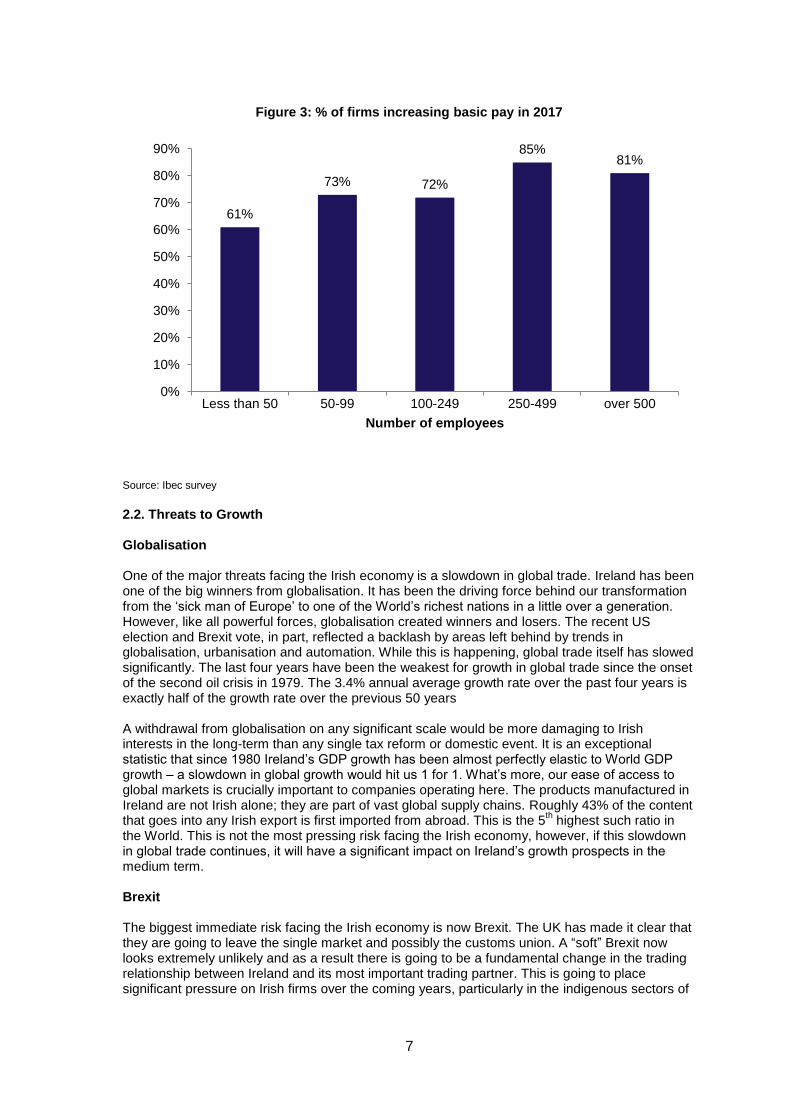
Pay Trends During October Ibec completed a HR survey of 392 member companies on pay trends for 2017. This showed that roughly 71% of companies are expecting to give pay increases and the median increase where one is expected is 2%. However, as is the case with overall employment growth, some sectors of the economy are performing better than others. Firms in high-tech manufacturing were most likely to award a pay rise (88%) while services firms were least likely (63%). Pay trends also vary depending on the size of the firm. Over 80% of firms employing more than 250 employees were planning on increasing pay. This compares with only 61% of firms with less than 50 employees. While the majority of firms are in a position to increase wages this year, it is clear that a significant minority are still struggling. Given that 2017 is going to be a difficult year for particular sectors, any pay increases must be on a case by case basis and should reflect the particular circumstances in individual firms.
80
85
90
95
100
105
2007 2008 2009 2010 2011 2012 2013 2014 2015 2016
Ind
ex:
2007=
100
Figure 2: Turnover vs. Employment
Core retail sales (values) Retail Employment
7
Source: Ibec survey
2.2. Threats to Growth Globalisation One of the major threats facing the Irish economy is a slowdown in global trade. Ireland has been one of the big winners from globalisation. It has been the driving force behind our transformation from the ‘sick man of Europe’ to one of the World’s richest nations in a little over a generation. However, like all powerful forces, globalisation created winners and losers. The recent US election and Brexit vote, in part, reflected a backlash by areas left behind by trends in globalisation, urbanisation and automation. While this is happening, global trade itself has slowed significantly. The last four years have been the weakest for growth in global trade since the onset of the second oil crisis in 1979. The 3.4% annual average growth rate over the past four years is exactly half of the growth rate over the previous 50 years A withdrawal from globalisation on any significant scale would be more damaging to Irish interests in the long-term than any single tax reform or domestic event. It is an exceptional statistic that since 1980 Ireland’s GDP growth has been almost perfectly elastic to World GDP growth – a slowdown in global growth would hit us 1 for 1. What’s more, our ease of access to global markets is crucially important to companies operating here. The products manufactured in Ireland are not Irish alone; they are part of vast global supply chains. Roughly 43% of the content that goes into any Irish export is first imported from abroad. This is the 5
th highest such ratio in
the World. This is not the most pressing risk facing the Irish economy, however, if this slowdown in global trade continues, it will have a significant impact on Ireland’s growth prospects in the medium term. Brexit The biggest immediate risk facing the Irish economy is now Brexit. The UK has made it clear that they are going to leave the single market and possibly the customs union. A “soft” Brexit now looks extremely unlikely and as a result there is going to be a fundamental change in the trading relationship between Ireland and its most important trading partner. This is going to place significant pressure on Irish firms over the coming years, particularly in the indigenous sectors of
61%
73% 72%
85% 81%
0%
10%
20%
30%
40%
50%
60%
70%
80%
90%
Less than 50 50-99 100-249 250-499 over 500
Number of employees
Figure 3: % of firms increasing basic pay in 2017

8
the economy. While there has been no change yet to the trading relationship, Ireland is already facing major difficulties, namely the rapid and volatile weakening of sterling. Since the referendum, movements in the euro/sterling exchange rate were volatile. In October, it peaked at £0.90. Fortunately this rate didn’t persist and is currently ranging in the mid-80s. However, this is still 15% weaker than the beginning of 2016. What makes this depreciation most worrying is that it is structural as opposed to cyclical (as was the case in 2008). This means that sterling is likely to remain at its new weaker rate. It is also likely that over the coming months, once Article 50 is triggered, sterling will depreciate further.
Many leading indicators already show that a slowdown is happening in the economy, particularly for the indigenous sectors. Exports played a huge role in our economic recovery but last year saw a slight slowdown in this growth. Total goods exports increased by 4.6% annually. However, when pharma and electrical equipment are excluded, exports fell by 2.6% annually. Sterling played a significant role in this as exports to the UK were down 6.3% annually. This is extremely worrying as although overall exports grew, exports to the UK are central to the indigenous sectors. Over 40% of their output goes to the UK, compared with only 10% of that from non-Irish companies. Indigenous exporters spend as much in the domestic economy through purchases and wages as the multinational exporters. They also employ as many people, with even greater regional spread. The impact of Brexit on the producers of 11% of our overall exports will be as important for the domestic economy as the fortunes of the producers of the other 89%. One indigenous sector that is already facing these difficulties is food. Approximately 41% of food and 50% of beef exports go to the UK. Since the referendum, these exports to the UK fell significantly. Like exports, industrial production also started slowing in recent months. Output in traditional manufacturing fell by 1% in the first 9 months of last year and a key driver of this was a fall in food production. Food output fell by 2% annually in the first three quarters of 2016 and turnover was down 2.8%. Much of this was driven by a slowdown after Brexit as output in traditional manufacturing fell by 2.8% in Q3, while food output fell by 5.5% in Q3. This slowdown was also reflected in food exports to the UK as these fell significantly after the Brexit vote. If this continues it will have severe impacts on the overall economy as these sectors spend a higher proportion of turnover on wages and intermediate purchases than other sectors of the economy.
0.65
0.7
0.75
0.8
0.85
0.9
0.95
Figure 4: EUR/GBP

9
3. Minimum Wage- Impact of previous increases The minimum wage is now 7% higher than it was in 2015.The biggest increase (€0.50) happened in 2016 with an additional €0.10 increase was introduced in 2017. The past two increases in the minimum wage have pushed Ireland’s minimum wage from the 5
th to the 2
nd highest in the EU.
This is at a time when there is no inflation in the economy, as prices are currently the same as they were in 2015. The minimum wage has in fact continually outstripped inflation for the past 12 years (figure 5) and would be 28% lower if it were pegged to the HICP.
In last year’s report, the Low Pay Commission stated that 5% of employees were on the applicable minimum wage in 2014 (€8.65).Unfortunately, the number of people on the minimum wage in 2016 (€9.15) is still unknown, as new data has not been released. Increasing the minimum wage has two effects. Firstly, it increases labour costs for firms who pay workers the minimum wage. It also has wider knock on effects as it also impacts the wages of those who are paid a premium above the minimum wage e.g. paid an hourly rate of €1 above the minimum wage. The higher the number of people who are on the minimum wage or who are paid a premium above it, the bigger the impact an increase in the minimum wage will have on business costs.
Looking solely at the impact on those who are paid the minimum wage, in 2013, 5.6% of employees were on the minimum wage of €8.65.A further 3% were earning between €8.65 and €9.25 (the new minimum wage). This means that if everyone’s wages stayed the same (apart from those earning less than the new minimum wage), 8.6% of employees would now be on the minimum wage. This suggests that it is very likely that a higher proportion of workers are now paid the minimum wage and affecting more businesses today than it did two years ago. Any rise in the minimum wage not only affects employers through its direct impact on wages but also through employers’ PRSI. When the minimum wage increased in 2016, a PRSI tax credit was introduced for employees to avoid the “step effect”. This happened when an employee earned more than €351 a week, as once this threshold was reached they went from paying no PRSI, to paying it on all their income, reducing their net-take home pay. To counteract this, the entry point to the higher rate of employers’ PRSI increased from €356 to €376. Currently, a full
€5.00
€5.50
€6.00
€6.50
€7.00
€7.50
€8.00
€8.50
€9.00
€9.50
Apr
20
00
De
c 2
000
Aug 2
001
Apr
20
02
De
c 2
002
Aug 2
003
Apr
20
04
De
c 2
004
Aug 2
005
Apr
20
06
De
c 2
006
Aug 2
007
Apr
20
08
De
c 2
008
Aug 2
009
Apr
20
10
De
c 2
010
Aug 2
011
Apr
20
12
De
c 2
012
Aug 2
013
Apr
20
14
De
c 2
014
Aug 2
015
Apr
20
16
De
c 2
016
Figure 5: Minimum Wage vs. HICP
Minimum wage (actual) Minimum wage if following HICP
10
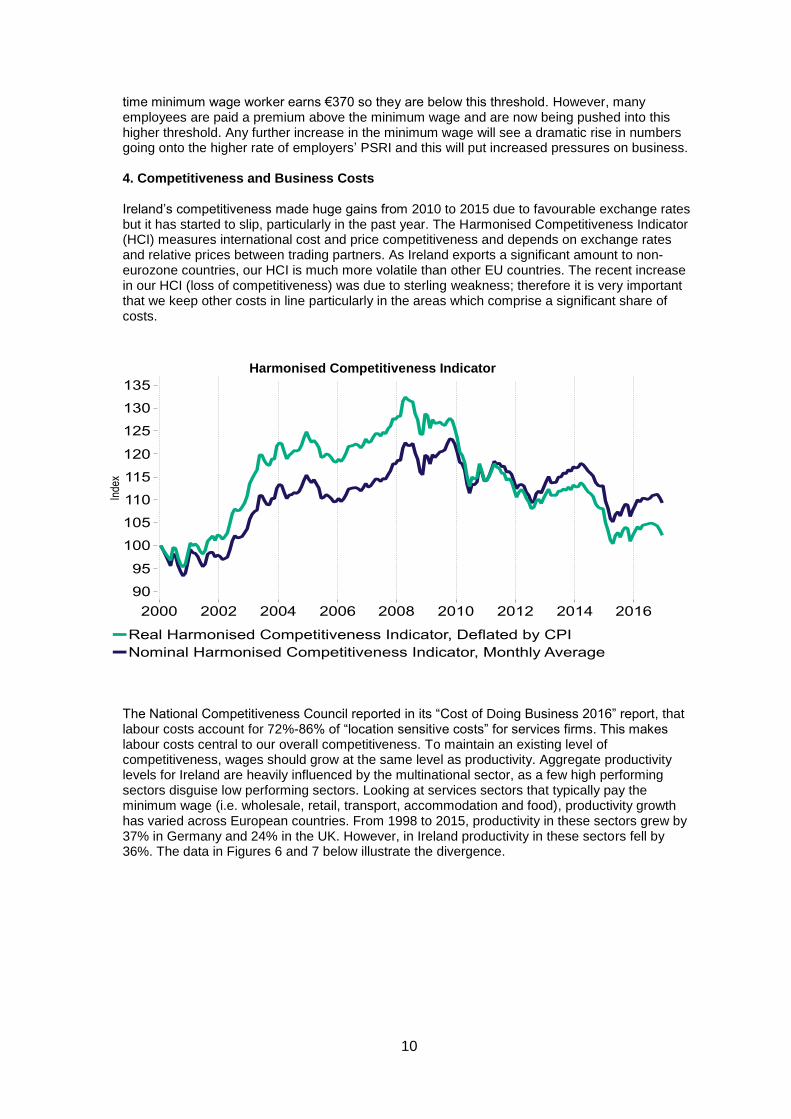
time minimum wage worker earns €370 so they are below this threshold. However, many employees are paid a premium above the minimum wage and are now being pushed into this higher threshold. Any further increase in the minimum wage will see a dramatic rise in numbers going onto the higher rate of employers’ PSRI and this will put increased pressures on business. 4. Competitiveness and Business Costs Ireland’s competitiveness made huge gains from 2010 to 2015 due to favourable exchange rates but it has started to slip, particularly in the past year. The Harmonised Competitiveness Indicator (HCI) measures international cost and price competitiveness and depends on exchange rates and relative prices between trading partners. As Ireland exports a significant amount to non-eurozone countries, our HCI is much more volatile than other EU countries. The recent increase in our HCI (loss of competitiveness) was due to sterling weakness; therefore it is very important that we keep other costs in line particularly in the areas which comprise a significant share of costs. Labour Costs The National Competitiveness Council reported in its “Cost of Doing Business 2016” report, that labour costs account for 72%-86% of “location sensitive costs” for services firms. This makes labour costs central to our overall competitiveness. To maintain an existing level of competitiveness, wages should grow at the same level as productivity. Aggregate productivity levels for Ireland are heavily influenced by the multinational sector, as a few high performing sectors disguise low performing sectors. Looking at services sectors that typically pay the minimum wage (i.e. wholesale, retail, transport, accommodation and food), productivity growth has varied across European countries. From 1998 to 2015, productivity in these sectors grew by 37% in Germany and 24% in the UK. However, in Ireland productivity in these sectors fell by 36%. The data in Figures 6 and 7 below illustrate the divergence.
Harmonised Competitiveness Indicator

11
Source: OECD
As productivity fell in these sectors, unit labour costs grew faster in Ireland than in other European countries. In Ireland unit labour costs for these sectors (i.e. wholesale, retail, transport, accommodation and food) tripled from 1998 to 2015. In Germany, where productivity growth for these sectors was highest, unit labour costs only increased by 1% over the 17 year period.
Source: OECD
40
60
80
100
120
140
160
Ind
ex:
19
98
=10
0
Figure 6: GVA per hour worked - Wholesale, retail, transport and hospitality
France Germany Ireland Italy UK EU
0
50
100
150
200
250
300
199819992000200120022003200420052006200720082009201020112012201320142015
Figure 7: Unit Labour Costs - Wholesale, retail, transport and hospitality
France GermanyIreland ItalyUnited Kingdom European Union (28 countries)

12
Other costs Recently, Irish business saw operating costs increase in a number of other areas which will impact on our overall competitiveness. These costs will have a particular impact on those who are currently struggling and operating under low margins. The NCC found that some SME’s have faced increases of over 80% on vehicle insurance. On foot of members’ complaints Ibec undertook a survey of members. Overall, it found that total Employer Liability premiums increased by 7% in 2015 while for service firms the increase was 14%. Public liability on the other hand increased by 6%. These increases have coincided with a significant rise in claims in recent years. As this is showing no signs of stopping, this is likely to increase premiums in 2017 which will drive up business costs further. Rates There is a national re-evaluation in ten areas of the country by the Rates of Valuation Office on a phased basis. This is likely to result in higher rates being announced in the next few weeks. In some cases this is expected to result in significant increases e.g. forecourts rates are expected to double or treble. This will see firms in the affected areas face a substantial increase in costs in 2017. Credit Access and the cost of credit is also becoming an increasing problem. Despite significant improvements in recent years, access to credit is still a problem for many firms and this is affecting the capacity of retailers to reinvest in their stores. Irish firms currently face higher interest rates than their European counterparts. Also, in 2017, the interest rate on loans of up to €250,000 was 2.6% higher than in other European countries. The rate on loans of up to €1 billion was more than 80% more expensive. 4. Sectoral analysis - Impact of Brexit on minimum wage sectors The Low Pay Commission outlined in its report last year that almost half of minimum wage workers are concentrated in retail and hospitality. These are two sectors that are likely to face the biggest challenges from Brexit. Retail Looking at retail, this is a sector that has struggled significantly in recent years while the rest of the economy raced ahead. Since 2008 there has been a structural change in this market (figure 8). The quantity of goods sold is currently 20% higher than it was in 2011, but turnover is only up 7%. This divergence has come about due to increased competition in the retail sector which is keeping prices low. Goods prices are currently at the same level they were at in 2000. Overall this has meant that margins are now much lower than they were and this is having a significant impact on employment numbers in the sector.

13
Source: CSO
While some sectors may not feel the real impact of Brexit until the UK officially leaves the EU, for retail it is already having a significant impact. Retail sales growth was strong in the first six months of 2016. Values were up 3% and volumes were up 5.5%. This slowed significantly in the second half of the year as volumes were only up 3.4% and values were up 1%. Turnover was actually 0.1% lower last December compared to December 2015. Part of this was due to stronger growth in November, however, across the two months retail sales were only up 0.5% on the same period last year. This is extremely worrying given that these are the key months of trading for this sector.
80
85
90
95
100
105
110
115
120
125
130
20
07M
01
20
07M
05
20
07M
09
20
08M
01
20
08M
05
20
08M
09
20
09M
01
20
09M
05
20
09M
09
20
10M
01
20
10M
05
20
10M
09
20
11M
01
20
11M
05
20
11M
09
20
12M
01
20
12M
05
20
12M
09
20
13M
01
20
13M
05
20
13M
09
20
14M
01
20
14M
05
20
14M
09
20
15M
01
20
15M
05
20
15M
09
20
16M
01
20
16M
05
20
16M
09
Ind
ex
Figure 8: Core Retail Sales
Values Volumes
-1.0%
0.0%
1.0%
2.0%
3.0%
4.0%
5.0%
6.0%
7.0%
8.0%
jan feb mar apr may jun jul aug sep oct nov dec
Figure 9: Core Retail sales (y-o-y % growth)
Values Volumes

14
This slowdown in retail sales has been accompanied by a significant rise in cross border shopping. While we have no official measure, proxies are already showing that this is taking place. In Q2 of last year the number of cars with an ROI registration in Northern Ireland shopping centres was 30%, in Q3 it increased to 58% (figure 10). This is now just short of the peak of 65.5% seen in Q4 of 2008. Other indicators are also showing similar trends. New figures from the Central Bank showed e-commerce transactions on Irish debit and credit cards increased by 20% between July and September. This surge in activity is linked with a sterling devaluation as 70% of Irish e-commerce spending goes mainly to UK based online retailers. As sterling is very likely to suffer a further depreciation in the coming months, these losses will get worse, which will have a serious impact on the sector.
Source: Intertrade Ireland
Hospitality Sector The hospitality sector on the other hand, which is another significant minimum wage employer has not struggled to the same extent as retail in recent years due to tourism numbers reaching record highs. Since 2012, the number of overseas visitors to Ireland increased by 47%. Tourists from Britain play a significant role in this as 41% of total visitors come from Britain and spend almost €1 billion in the Irish economy. As the hospitality sector is so reliant on British tourists, the sector is likely to experience difficulties in the near future. Firstly, the weakening of sterling makes Ireland a more expensive holiday destination. This will make British tourists less inclined to come and visit Ireland or, if they do, they will spend less. This was seen the last time sterling depreciated as the number of visitors from Britain fell by 29% from 2008-2012 (figure 11). Over the same period, the amount each visitor from Britain spent in Ireland fell by 16%. Tourism to Ireland could also fall from non-British tourists as the UK will become a more attractive place now that it has become cheaper to visit.
25303540455055606570
Q3 2
008
Q4 2
008
Q1 2
009
Q2 2
009
Q3 2
009
Q4 2
009
Q1 2
010
Q2 2
010
Q3 2
010
Q4 2
010
Q1 2
011
Q2 2
011
Q3 2
011
Q4 2
011
Q1 2
012
Q2 2
012
Q3 2
012
Q4 2
012
Q1 2
013
Q2 2
013
Q3 2
013
Q4 2
013
Q1 2
014
Q2 2
014
Q3 2
014
Q4 2
014
Q1 2
015
Q2 2
015
Q3 2
015
Q4 2
015
Q1 2
016
Q2 2
016
Q3 2
016
Figure 10: Share of car parks in Border areas with Irish registered cars
% occupancy

15
Source: CSO
Tourism Ireland commissioned a Red-C poll to look at what impact Brexit would have on travel plans for British consumers. Of those who responded, 17% said they would postpone a trip outside of the UK and 50% said they would spend less while they are outside .In the past, visitors from the UK were strongly correlated with exchange rate movements (figure 11). Therefore, it is very likely that if sterling continues to weaken, tourist numbers from the UK will fall just as they did when this happened in the past. 5. Cost of Living There is little evidence that rises in the cost of living justify increasing the minimum wage. Prices have remained flat for the past three years. Last year saw no inflation and as a result prices are still lower than they were in 2008. There are however, two differing trends underlying this. Services caused inflation to rise by 1.1% last year but as the price of goods fell by the same amount, the two netted each other out (figure 12). Ibec forecasts that this will continue next year and only forecasts inflation of just 0.6% for 2017. While oil prices may rise due to the OPEC agreement to cut output, the weak sterling will make imports cheaper. As 26% of our imports come from the UK this should put further downward pressure on prices in 2017.
2000
2500
3000
3500
4000
4500
0.50
0.55
0.60
0.65
0.70
0.75
0.80
0.85
0.90
0.95
Vis
ito
rs f
rom
GB
(h
un
dre
d
tho
usan
ds)
EU
R/G
BP
Figure 11: Tourists from GB
EUR/GBP Visitors to Ireland from GB

16
However, as some prices are rising while others are falling, the cost of living for some people may have increased more than others if they consume more of the items that are experiencing inflation. One item that has experienced significant increases is rents. Rents grew substantially over the past two years and are now above pre-crisis levels. Given that housing costs make up a large proportion of a person’s budget, those who are renting their accommodation saw their cost of living rise substantially over the past few years. Many arguments have been made that while there has been no change in the overall cost of living, these rental increases have had a disproportionate impact on minimum wage workers and therefore their wages should rise accordingly. Using data from SILC 2013, we found that only 33.7% (figure 13) of minimum wage workers in 2013 were living in private rented accommodation. The data has limitations as it is unknown how many people from this cohort were in the main cities (where rents have increased the most) but it is likely to be an even smaller proportion. Almost 47% of minimum wage workers were living in a property that was owned outright. The proportion renting is higher than for the overall workforce, as 18% of total employees were living in a rented property, but not high enough to justify pay increases for the entire cohort. As minimum wage workers are not alone in rental challenges, it is better to target the cost at source through public policy intervention. Given that these costs are driven by a limited supply, it is likely that raising incomes to increase affordability would just drive up prices further.
-1.5 -1 -0.5 0 0.5 1 1.5
Goods
Food and Non-Alcoholic Beverages
Clothing and Footwear
Recreation and Culture
Mortgage Interest
Communications
All Items
Health
Education
Transport
Energy Products
Alcoholic Beverages and Tobacco
Housing +utilities
Miscellaneous Goods and Services
Restaurants and Hotels
Services
% contribution to CPI in last 12 months
Figure 12: % contribution to CPI in last 12 months

17
Source: SILC 2013
It may be surprising that so few minimum wage workers are in rented accommodation, but the ESRI has found that while minimum wage workers are the lowest earners, they typically don’t live in low income households. Minimum wage workers are more likely to be found in middle or upper income deciles as they usually aren’t the primary earner in the household. They typically tend to be the second and third earners- including adult children in high income households. The ESRI also found in another study that overall while some consumers may experience sharper inflation than others, it is not correlated with household income. They found that inflation is fairly uniform across the income distribution and the deciles where minimum wage workers typically reside have seen average or below average inflation. 6. Low Pay and Income inequality Many commentators have suggested that the minimum wage should increase as Ireland is an outlier in terms of its low pay, working conditions and in-work poverty. Ibec, in its submission to the Low Pay Commission last year, outlined that this is not, in fact, the case. The main points from our previous submission are summarised as follows. The suggestion that Ireland has a ‘low pay problem’ is based on data which purportedly shows that Ireland has the second highest incidence of low pay in the OECD. Commentary quoting this figure often leaves out the crucial adjective when it comes to this data – ‘relative’. The OECD and Eurostat regard a person as being relatively low paid if they earn less than 60% of the median wage in a country. By this measure Ireland does indeed have high levels of ‘relative low pay’. This statistic, however, is used in a wholly misleading way in public commentary and is not a useful guide for assessing Ireland’s true standing when it comes to the economic or social outcomes of employees at the bottom of the income distribution.
When it comes to ‘relative low pay’ Ireland is a victim of its own success in creating many high quality jobs in its exporting MNE sector, wages are also above the European average (despite low productivity) in its domestic sectors. Ireland has the second highest median hourly pay in the EU. Compared to this high median wage, a large proportion of lower paid workers in the relatively lower paid and low productivity domestic facing sectors fall below the arbitrary ‘low pay’ threshold. Bringing many of these workers above this threshold, which is €3.78 (52%) above the EU average, would be economically unviable in Ireland’s low productivity domestic facing sectors. This is particularly true given that workers in these sectors are already amongst the highest paid in Europe in both nominal, purchasing power and productivity adjusted terms.
46.8%
33.7%
19.5%
0%
5%
10%
15%
20%
25%
30%
35%
40%
45%
50%
Owned Rented Rented Below Marketrates
Figure 13: % of minimum wage workers- type of accommodation

18
Overall, the lowest paid workers in Ireland are paid much more than their counterparts elsewhere in Europe. Ireland’s minimum wage is currently the second highest in the EU. In terms of purchasing power, it is the sixth highest. Even in the main minimum wage sectors, Irish workers are better paid. Retail workers are the 6th highest paid while hospitality workers are the 4th highest.
Source: Eurostat
Income inequality in Ireland
The most commonly used measure of income inequality is the GINI coefficient. It measures the
degree of inequality in the distribution of family income in a country. Before social transfers are
taken into account Ireland has the highest GINI coefficient in the EU i.e. most unequal. The GINI
coefficient focuses on annual earnings- therefore it does not capture whether earnings are lower
due to low work intensity (hours worked) or low rates of pay. Taking the GINI for hourly earnings,
Ireland is appreciably more equal as it only has the 11th highest GINI in the EU. This means that
if everyone worked the same number of hours, inequality would be similar to the European
average. As the minimum wage is based on hourly pay, it is unlikely that it will have a significant
impact in reducing the overall GINI as this is high because the number of hours worked is low.
Furthermore these measures take earnings before any tax is deducted or transfers have taken
place. Due to the extremely progressive nature of our tax system, Ireland’s GINI for annual
earnings goes from the highest in the EU before transfers, to below the European average after
transfers.
0
500
1,000
1,500
2,000
2,500
Luxe
mb
ou
rg
Ire
lan
d
Net
her
lan
ds
Be
lgiu
m
Ger
man
y
Fran
ce UK
Spai
n
Slo
ven
ia
Mal
ta
Gre
ece
Po
rtu
gal
Esto
nia
Po
lan
d
Slo
vaki
a
Cro
atia
Hu
nga
ry
Cze
ch R
epu
blic
Latv
ia
Lith
uan
ia
Ro
man
ia
Bu
lgar
ia
Mo
nth
ly m
inim
um
wag
e €
Figure 14: Minimum wage 2017
Euro Purchasing Power Standard

19
Source: Eurostat
Minimum wage and poverty
Advocates in favour of increasing the minimum wage argue that it should increase as these
workers cannot afford to live sufficiently well on their wages. This ignores the fact that in work
poverty in Ireland is amongst the lowest in the EU. The at risk of poverty rate (% of people with
an income below 60% of the median income) is the fourth lowest in the EU (when low work
intensity houses are excluded). In Ireland, this is only 6.7% whereas in Sweden this is 10.1%.As
such the notion that any changes to regulated wages could influence poverty are tenuous to say
the least.
0
0.05
0.1
0.15
0.2
0.25
0.3
0.35
0.4
0.45
0.5
SE
UK
PT
LV
AT
CY
LT
LU
PL IE EE
DE
HU
FR
BG
NL IT SI
BE
ES
EL
MT
CZ
HR
RO
DK FI
SK
Figure 15: GINI Coefficient
GINI Hourly Incomes GINI Annual Incomes
0.0
5.0
10.0
15.0
20.0
25.0
30.0
Ro
man
ia
Gre
ece
Spain
Lu
xe
mbo
urg
Ita
ly
Bulg
aria
Pola
nd
Port
ug
al
Esto
nia
La
tvia
Lithu
ania
Euro
pe
an…
Un
ite
d K
ing
dom
Hu
nga
ry
Cro
atia
Fra
nce
Germ
any
Ma
lta
Sw
ede
n
Austr
ia
Sw
itzerl
and
Slo
ven
ia
Slo
vakia
Cypru
s
Ne
therl
and
s
Belg
ium
Irela
nd
Fin
land
Czech R
epu
blic
De
nm
arkFigure 16: At risk poverty rate- Excluding low work intensity
households

20
Source: Eurostat
The OECD noted (2015) that the minimum wage is a “blunt instrument” for reducing poverty. This is because many low income families do not have a member that is working, and also because many minimum wage workers are not the primary earner and live in a household with earnings that are above average. The ESRI’s post-budget distributional analysis found that the main beneficiaries of the minimum wage were in deciles 4-8 in proportional terms. This means that households in the middle or upper half of the income deciles received more from the increase than those in lower income deciles.


![Peeters, Marga and Den Reijer [Mpra] 2011_paper, On Wage Formation, Wage Flexibility and Wage Coordination a Focus on the Wage Impact of Productivity in Germany, Ireland, Portugal,](https://static.fdocuments.net/doc/165x107/577ce6db1a28abf10393c4a3/peeters-marga-and-den-reijer-mpra-2011paper-on-wage-formation-wage-flexibility.jpg)