The Millionaire Blueprint - Amazon S3...The Individual Investor’s Portfolio Strategy Today, it's...
46
2012 The Millionaire Blueprint Portfolio Strategies For Tomorrow's Millionaire
Transcript of The Millionaire Blueprint - Amazon S3...The Individual Investor’s Portfolio Strategy Today, it's...

2012
The Millionaire Blueprint
Portfolio Strategies For Tomorrow's Millionaire

Table of Contents The Individual Investor’s Portfolio Strategy ................................................................................................ 3
What Sideways Cycles Do To Your Money ................................................................................................. 4
The Time Diversification Strategy ................................................................................................................ 7
Building Your New Portfolio ........................................................................................................................ 9
Sample Portfolio Using The Time Diversification Strategy: ...................................................................... 11
Managing the Time Diversification Strategy .............................................................................................. 11
The $1,000,000 Portfolio ............................................................................................................................ 15
Asset Classes For Time Diversification Portfolio ....................................................................................... 17
Notes on asset classes: ................................................................................................................................ 17
The Millionaire Blueprint ........................................................................................................................... 19
Section 1: Overview of Goals and Objectives ............................................................................................ 20
The Goal ................................................................................................................................................. 20
Plan Objectives ....................................................................................................................................... 21
Section 2: Understanding Risk and Money Management ........................................................................... 21
Dressing Your Upside to the “8s” ........................................................................................................... 23
The Fab "5" Protection Plan .................................................................................................................... 26
Section 3: The 8:5 Rules—A Step by Step Analysis .................................................................................. 27
Step 1: Divide your trading capital ......................................................................................................... 27
Step 2: Calculate your profit target ......................................................................................................... 31
Step 3: Calculate your stop loss price .................................................................................................... 34
Step 4: Enter Your Orders ....................................................................................................................... 36
Small, Consistent Wins the Race ................................................................................................................ 37
Managing Your New Portfolio ................................................................................................................... 38
Large Account Management ....................................................................................................................... 39
Measuring Your Progress ........................................................................................................................... 40
Notes On Taxes ........................................................................................................................................... 40
Thoughts on Probability and Stock Selection ............................................................................................. 41
The Millionaire Blueprint Program............................................................................................................. 42
Final Thoughts ............................................................................................................................................ 44
About Rick Pendergraft .............................................................................................................................. 45
About John Hutchinson ............................................................................................................................... 45

The Individual Investor’s Portfolio Strategy
Today, it's no secret that many investors are frustrated and struggling. The 2008 stock market
crash destroyed wealth in middle class America to the tune of over $2 Trillion.
Despite the stock market's recovery, the money that was lost has failed to return to Main Street
Portfolios in the ensuing years. It’s time to evolve and “find” that lost money once again.
What we're about to reveal is a new strategy for your portfolio that will change the way you look
at investing.
This new model changes what Wall Street "tells" you to do. It changes the way you think about
investing. And it changes the way you approach growing your portfolio.
We’re talking every major aspect, from the way you invest, to what you invest in, and how you
can expect to generate returns to enjoy the financial security you need.
To lay the groundwork for these changes, we need to examine some history and some
economic data so you can better understand why you need to make these changes; and why
you need to make them NOW.
Historically, every great bull market has been followed by what can best be characterized as a
Super Sideways Cycle.
A Super Sideways Cycle is a series of bear markets and short-term bullish rallies which yield
little to no growth in the major indices. On the chart below, you can see there have been three
Super Sideways Cycles in the last 80 years: from 1930-52; 1965-82; and the current cycle,
which began in 2000 and continues here in 2012.
As you can see, the great bull run of the 1920s was followed by 25 years of sideways patterns,
including of course, the Great Depression. It wasn’t until 1954 that the market returned to its
1929 highs.
The 1955 bull market, which lasted 11 years, was followed by 17 years of sideways malaise,
including the economic turmoil in the 1970s. The 1982 bull market, which lasted until 1999, has
been followed by a decade long sideways pattern and two serious market collapses.
Each of those super sideways cycles has included precipitous drops in the stock market, along
with bear market rallies, and ultimately, range bound markets like the one we’ve seen since the
first half of 2011 – a range bound market that continues here in 2012.
Note that each of these sideways cycles lasted anywhere from 10 years to 25 years. It’s also
important to note that it’s impossible to predict when the current sideways cycle, already a
decade in the making, is going to end.
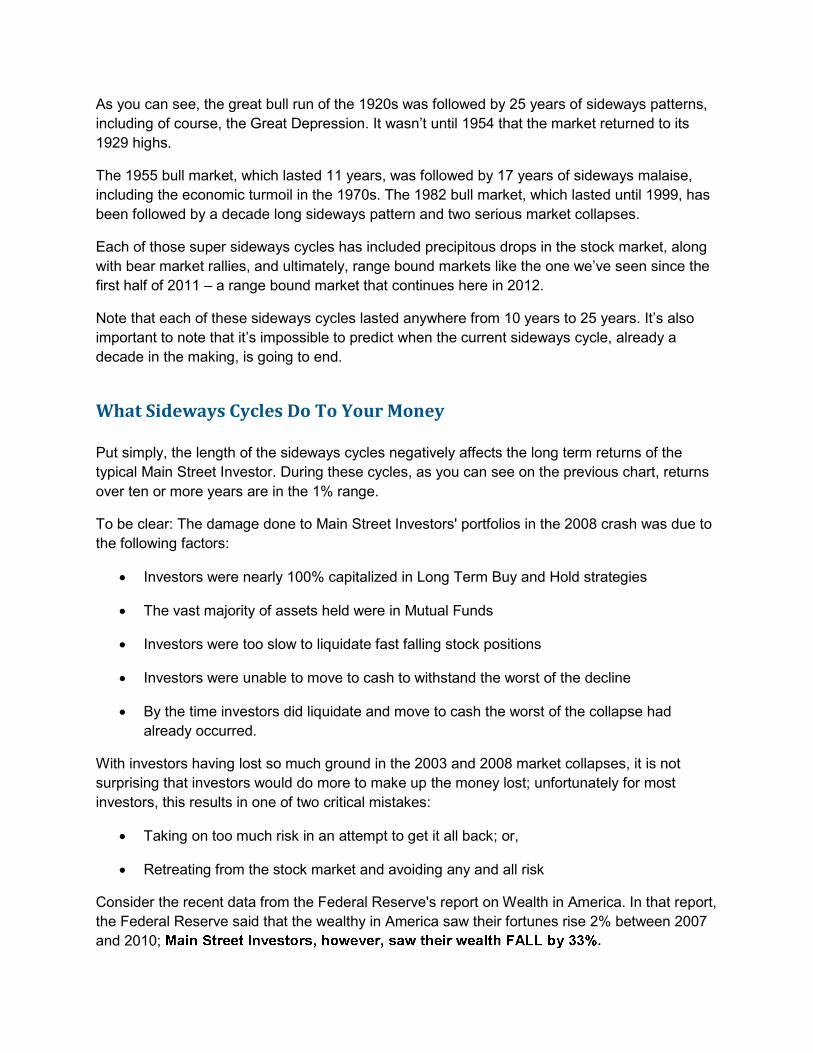
What Sideways Cycles Do To Your Money
Put simply, the length of the sideways cycles negatively affects the long term returns of the
typical Main Street Investor. During these cycles, as you can see on the previous chart, returns
over ten or more years are in the 1% range.
To be clear: The damage done to Main Street Investors' portfolios in the 2008 crash was due to
the following factors:
Investors were nearly 100% capitalized in Long Term Buy and Hold strategies
The vast majority of assets held were in Mutual Funds
Investors were too slow to liquidate fast falling stock positions
Investors were unable to move to cash to withstand the worst of the decline
By the time investors did liquidate and move to cash the worst of the collapse had
already occurred.
With investors having lost so much ground in the 2003 and 2008 market collapses, it is not
surprising that investors would do more to make up the money lost; unfortunately for most
investors, this results in one of two critical mistakes:
Taking on too much risk in an attempt to get it all back; or,
Retreating from the stock market and avoiding any and all risk
Consider the recent data from the Federal Reserve's report on Wealth in America. In that report,
the Federal Reserve said that the wealthy in America saw their fortunes rise 2% between 2007
and 2010;

This data is shocking.
You may wonder why it is that the "rich" always seem to remain "rich" while the investor class
consistently loses ground.
In two words:
The Federal Reserve's data should open your eyes to the path to building wealth; and,
maintaining that wealth throughout your lifetime.
First: The wealthy in America derive only 10% of their wealth from their homes. Contrast that
with Middle Class America, which, prior to 2008 derived an astounding 50% of their wealth in
their homes.
When the housing market collapsed, it should be easy to see why Main Street was nearly
destroyed. The value of their homes declined anywhere from 20% to 80%, depending upon
which real estate market one resided in.
Furthermore, the previous ease with which homeowners could access lines of equity credit from
their homes disappeared; and what equity they previously held in their homes evaporated. Yet,
homeowners were still stuck with unsustainable levels of debt both in their homes and in home
equity loans.
Add to that the 50% drop in the stock market in 2008-09, and the picture, while bleak, becomes
clearer for the average investor.
With home values cut in half, unsustainable debt, portfolios decimated – it's little wonder the
main street investor is scared, frustrated and struggling.
While little can be done to correct the value of your home, you
We'll show you what you can
do in just a moment – but first, we need to understand one more key data point from the Federal
Reserve's report.
The wealthy in America own more than 60% of individually held stocks. Not mutual funds; not
ETFs. Stocks. And overall, the wealthy maintain more of their wealth in financial investments
(and less of it in their homes) than do the middle class.
In fact, the typical main street investor holds a scant 1.9% of their assets in stocks. To be sure,
the market collapse of 2008 was beyond frightening to any investor. But the wealthy were able
to recover faster than the middle class for two reasons:
They didn't sell out – they held on
They put their capital to work as the market recovered
Contrast that with what Main Street did:
Pulled billions of dollars out of stocks and mutual funds

Put their money into bonds or bank accounts for little to no return
Decreased cash investments into retirement accounts
Retreated from buying individual stocks
Unquestionably, the wealthy were hurt in the initial crash. You can't hold 60% of the stocks in
the market without taking a hit. But because their wealth wasn't tied up in their homes they were
able to take advantage of the market rebound using a new portfolio strategy; a strategy that has
not, until today, been disclosed to Main Street Investors.
And It All Relates to "Time”, but not in the way you may think...
No doubt we've all heard the truism that the longer your time horizon for investing until
retirement the greater the likelihood you'll be able to build a powerful financial future.
That truism came crashing back to reality for many investors in 2008. As a larger percentage of
the population speeds toward retirement today, "time" is no longer on their side and the need to
rebuild their portfolios to sustain themselves in retirement is greater than ever.
Another truism we've all heard is diversification – that is, the more diverse your investments the
less risk you are subjected to if one asset class should fall. Except, of course, when they nearly
ALL fall.
What you're about to read, however, is a new strategy for your portfolio; a model that allows you
better control over risk, better control over your returns and smarter control over your own
financial future.
It's called .
To attain wealth or mirror what the wealthy investors do, we need to change the way we look at
our investing.
The most important and immediate change investors need to make to their portfolios is take
advantage of the three main "time" factors to protect and grow their investments. Luckily, this is
not something that will require hours upon hours to do, either.
You’re now able to build, manage and maintain a portfolio in this way with about 10 minutes a
day; a few minutes on the weekend with the

The Time Diversification Strategy
You'll discover there are three pieces to the Time Diversification Strategy:
Short Term Investments: stocks or ETFs and other assets that you hold for a few days to
a few months.
Medium Term Investments: stocks or ETFs and other assets that you hold for 6 months
to 2 years.
Long Term Investments: stocks or ETFs and other assets that you would hold for 2
years to 10 years.
Don't worry about writing all of that down right now – we'll go into each segment for you in a
moment. What is important is to understand that this portfolio strategy will fuel your ability over
the next 5, 10 or 20 years to reach your financial goals.
The Time Diversification Strategy has three critical components that will work in YOUR favor (for
once), if you follow it:
At any given time, you can move to CASH with up to 35% of your portfolio and keep your
money SAFE.
The strategy works from the bottom up: Short Term Investments provide the cash growth
for building your Medium and Long Term Investments.
When combined, your portfolio will take on LESS RISK and provide HIGHER Average
Annual Returns.
That first bullet cannot be stressed enough; it is precisely why Main Street Investors took a
beating in 2008-09. They did not have the portfolio flexibility to move to cash without SELLING
OFF all of their assets at the market lows. Proof of this comes in the form of record breaking
outflows from Mutual Funds in late 2008 all the way through early 2012.
Investors cashed out with substantial losses because they had no other option. Instead, the
Time Diversification Strategy will give you cash flexibility – meaning you will be less likely to
have to sell all of your holdings should we experience another significant bear market.
That's because your long term holdings won't be the "only" assets you'll have. You'll already
have segmented your portfolio to allow you to move your Short Term Investments and Medium
Term Investments into cash (or Gold, US Dollar, etc.) if a major market implosion occurs.
Then, when the markets begin to recover, you'll have that cash at the ready to take advantage
of stocks reaching new lows, or those companies best poised to weather the storm.
This last statement cannot be stressed enough and it is a key reason Main Street Investors
have NOT recovered from the 2008 debacle.
Wealthy investors had cash on hand when the market began to recover in 2009; and they put
that cash to use, allowing them to offset their losses and record significant gains. Main Street
Investors CASHED OUT of the stock market at or near the lows in '08 and '09 – meaning they
had LESS CASH on hand to move back into the market; and because most investors sold all of
the holdings, they took massive losses from which they have yet to recover.
This, in and of itself, is why the wealthy were able to recover faster from the market downturn:
they were able to move to cash faster and without having to sell off all of their stock holdings;
they were then able to use that cash to buy the "bottom" and, as stocks recovered, take
advantage of lower prices and the rally that began in 2009.
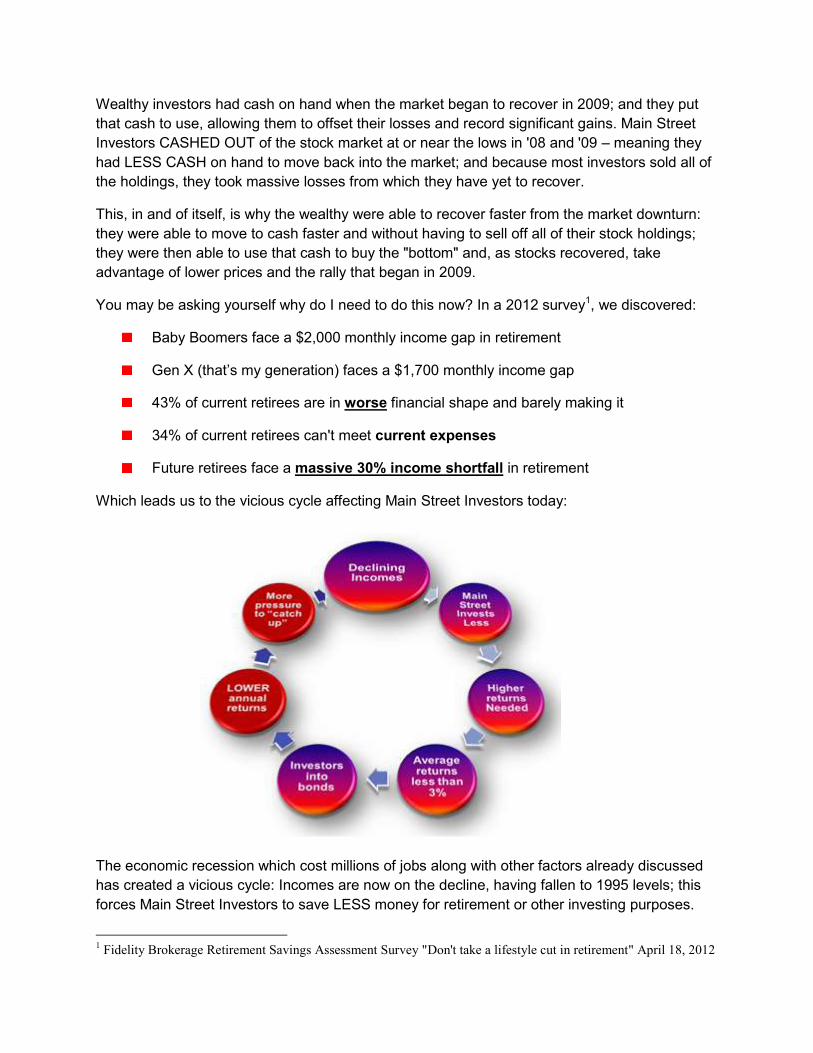
You may be asking yourself why do I need to do this now? In a 2012 survey1, we discovered:
Baby Boomers face a $2,000 monthly income gap in retirement
Gen X (that’s my generation) faces a $1,700 monthly income gap
43% of current retirees are in worse financial shape and barely making it
34% of current retirees can't meet current expenses
Future retirees face a massive 30% income shortfall in retirement
Which leads us to the vicious cycle affecting Main Street Investors today:
The economic recession which cost millions of jobs along with other factors already discussed
has created a vicious cycle: Incomes are now on the decline, having fallen to 1995 levels; this
forces Main Street Investors to save LESS money for retirement or other investing purposes.
1 Fidelity Brokerage Retirement Savings Assessment Survey "Don't take a lifestyle cut in retirement" April 18, 2012

In turn, this means investors must get HIGHER returns to keep pace with their investing goals –
but over the last ten years annual returns are less than 3%!
Add to that the "flight" to safety by most investors by moving away from stocks and into bonds
and bond funds, even though those so-called safe assets actually LOWER annual returns even
further.
Combined, this cycle puts even greater pressure on investors to "catch up" – usually in their
retirement years when they can least afford it.
Now is the time to make small changes in the way you approach your investing. Using Time
Diversification, you'll be able to restore growth and generate income from your portfolio because
your money will be working for you – not against you. And, you'll be able to control your money
and the risks to your money more efficiently.
Building Your New Portfolio
Let’s Dig Deeper Into This Strategy While Working Backwards:
are those companies with sustainable growth models for years to
come. Amazon and Apple are two good examples: both companies dominate their respective
business space; their stock prices appreciate consistently; their earnings and growth rates
appreciate year over year.
You should maintain a basket of 8-10 long term holdings (more if you have a larger portfolio) but
those holdings should represent 60-65% of your total portfolio. These stocks are ones you do
not plan to sell for many years. As an added bonus, you can use long term holdings to buy
companies that consistently pay dividends but have slower price appreciation whereby you can
reinvest the dividends each quarter to allow your holdings to grow.
Your objective with the Long Term Investments is to build a core group of holdings whose price
appreciation may equal or surpass 100% to 1,000% returns over a 10-year period.
are those companies with shorter term growth prospects: typically
between six months and two years. Value stocks which recently have been beaten down but are
recovering in earnings, profits and growth are an excellent example of medium term holdings.
Medium term investments, such as Gold or Silver ETFs (GDX and SLV), are not considered
core holdings to your portfolio; you are in them to achieve a specific gain, and once that gain is
achieved, you sell and move on.
You can also employ a dividend yield strategy with Medium Term Investments, whereby your
goal is to hold the stock for a period to capture dividends, then exit the stock once the dividends
have been paid. High yield stocks like Annaly Capital are a good example of this, as the stock
price tends to rise prior to ex-dividend dates and fall afterwards.

You should allocate 25% of your total portfolio to Medium Term Investments, with the ability to
move to CASH at any time when market conditions dictate.
Your objective is to take profits by setting in advance a specific profit target. Typical profit
targets for medium term investments are 25%-75% returns.
For example, if you buy a stock at $10.00 per share, your goal is to exit at no less than $12.50
within the 2 year time period.
are those companies that offer "opportunity" for gains in a time frame
between a few days to a few months (for simplicity, stocks or ETFs one would hold for no more
than 90 days), and are typically based on technical analysis, rather than strict fundamental
analysis.
By technical analysis we mean a particular set of rules applied to the stocks which yields a small
collection of stocks or ETFs that have the potential for brief break-outs in price, but are still too
volatile or do not have longer term growth prospects to be considered Medium Term or Long
Term investments.
You should allocate 10-15% of your total portfolio to Short Term Investments, with the ability to
move to CASH at any time when market conditions dictate. This part of your portfolio will turn
over faster than your Medium or Long Term Investments. The purpose behind that turnover is
to increase the rate of return on part of your portfolio without putting your entire portfolio at risk.
THIS IS NOT DAYTRADING. Short term investing is NOT intended to encompass day trading.
It is intended to take advantage of brief changes in momentum in a stock or other asset allowing
you to capture and compound returns on those changes consistently.

Sample Portfolio Using The Time Diversification Strategy:
We'll use a $100,000 Portfolio as the model here:
$65,000 would be tied to Long Term Investments
$25,000 would be tied to Medium Term Investments
$10,000 would be tied to Short Term Investments
As the portfolio grows, this is what you should expect:
Short Term Investments will grow fastest, as you'll be compounding your returns month after
month. Your Annual Average Rate of Return should be between 40% and 152% each year.
We'll share the exact strategy in the pages to come.
Medium Term Investments will grow second fastest as you'll compound returns roughly every
six to twelve months. Your Average Annual Rate of Return should be between 20% and 50% for
this part of your portfolio.
Long Term Investments will grow the slowest, typically, as these are investments where you are
in it for the long haul. As well, this portion of your portfolio will be used to establish long term
positions in stocks, bonds, or other assets that will appreciate over time, whereby, in five to ten
years, you'll close the position with anticipated gains of 100%-1,000% depending upon how fast
your portfolio grows.
Long Term Investments can also be used to decrease the overall Risk in your portfolio through
the use of Annuities, Treasuries, and even CDs. Despite the lower returns from these classes,
they are still important to hold as a part of your portfolio because of their relative safety and
guaranteed returns on investment.
Managing the Time Diversification Strategy
The next step in understanding this portfolio strategy is to learn the bottom up approach to
building your portfolio. That is, your short term investments provide the capital to build medium
term investment positions, which in turn create the capital to build long term investments.
By following this model you'll discover your portfolio will be at less risk because you'll be able to
diversify your investments in each category. You won't have to hold only stocks, or only bonds.
You'll be able to capitalize on multiple asset classes within each Time Segment of your portfolio.

Capital (Gains) Flow Model
As you execute this portfolio strategy your gains from short term investments roll-up into
medium term and long term investments. Taking this step will help you avoid being over-
weighted in short term assets and when you shift capital into long term assets you eliminate
short term risk to that capital as you have a longer time horizon with which to withstand any
market falls.
Advantages:
By using short term investments (typically using stocks, ETFs or options), you can
create monster returns because you'll be compounding your money every month.
As you grow that short term investment base, you can re-allocate your capital every 12 months
to maintain the percentage basis in the portfolio model.
Here's a quick example, using the sample portfolio:
Starting Values of a $100,000 Portfolio:
Portfolio Value
Time Strategy
$ 65,000
Long Term Investments
$ 25,000
Medium Term Investments
$ 10,000
Short Term Investments
Long Term Investments
Medium Term Investments
Short Term Investments

After 12 months, you generate the following annualized returns:
12% in Long Term Investments
20% in Medium Term Investments
60% in Short Term Investments
Your Portfolio now would hold this:
Portfolio Value
Time Strategy
$ 70,200
Long Term Investments
$ 30,000
Medium Term Investments
$ 16,200
Short Term Investments
Your Total Portfolio Value has risen to: $ 116,400
You can choose to reallocate your portfolio to the 65/25/10 model with new values of:
$75,530 in Long Term Investments
$29,050 in Medium Term Investments
$11,620 in Short Term Investments
Or, you can continue on with the existing portfolio values for even faster growth of short
and medium term investments, in which case, after a second year, your portfolio could hold:
Portfolio Value
Time Strategy
$ 75,816
Long Term Investments
$ 36,000
Medium Term Investments
$ 25,600
Short Term Investments

$75,816 in Long Term Investments < this portion of your portfolio will likely grow the slowest
because you'll be invested across multiple asset classes, whether stocks, bonds, or other
classes as previously discussed.
$36,000 in Medium Term Investments < this portion of your portfolio should have moderate
growth and be limited to stocks or ETFs, options, currencies and bonds.
$25,600 in Short Term Investments < This portion of your portfolio will grow the fastest as you
take gains and compound those gains every month; you should specifically target using stocks,
ETFs, Options and Currencies to generate growth and income from your portfolio.
NOTE: The more capital you maintain in your long term investments, the lower your
COMBINED annual return will be. This is NOT a bad thing. Remember that you are protecting
capital by having more than 60% of your assets in long term holdings.
In the example above, you would have had a combined Annualized Return of 16% after the first
year – but the short term investments clearly grew the fastest.
If you need to grow capital quickly in order to be able to build long term holdings, however, you
need to accept slightly higher risk by using Short Term Investments to yield higher returns; then
rebalance your portfolio using the 65/25/10 model.
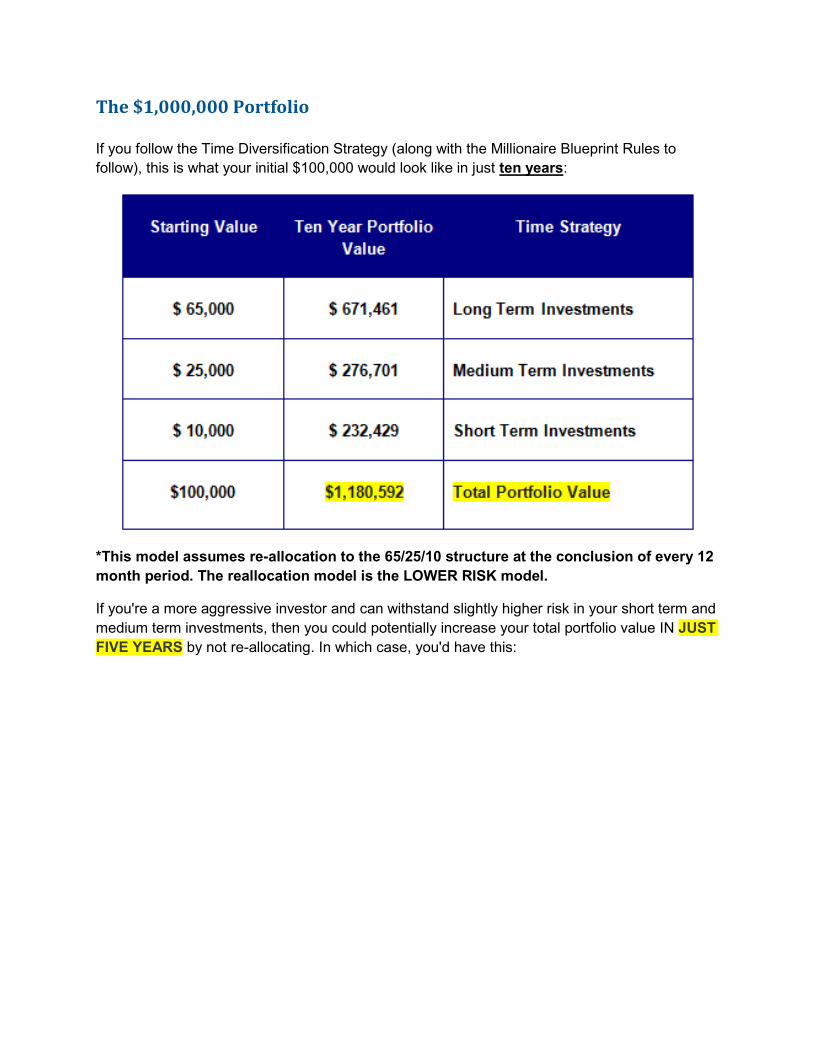
The $1,000,000 Portfolio
If you follow the Time Diversification Strategy (along with the Millionaire Blueprint Rules to
follow), this is what your initial $100,000 would look like in just ten years:
*This model assumes re-allocation to the 65/25/10 structure at the conclusion of every 12
month period. The reallocation model is the LOWER RISK model.
If you're a more aggressive investor and can withstand slightly higher risk in your short term and
medium term investments, then you could potentially increase your total portfolio value IN JUST
FIVE YEARS by not re-allocating. In which case, you'd have this:
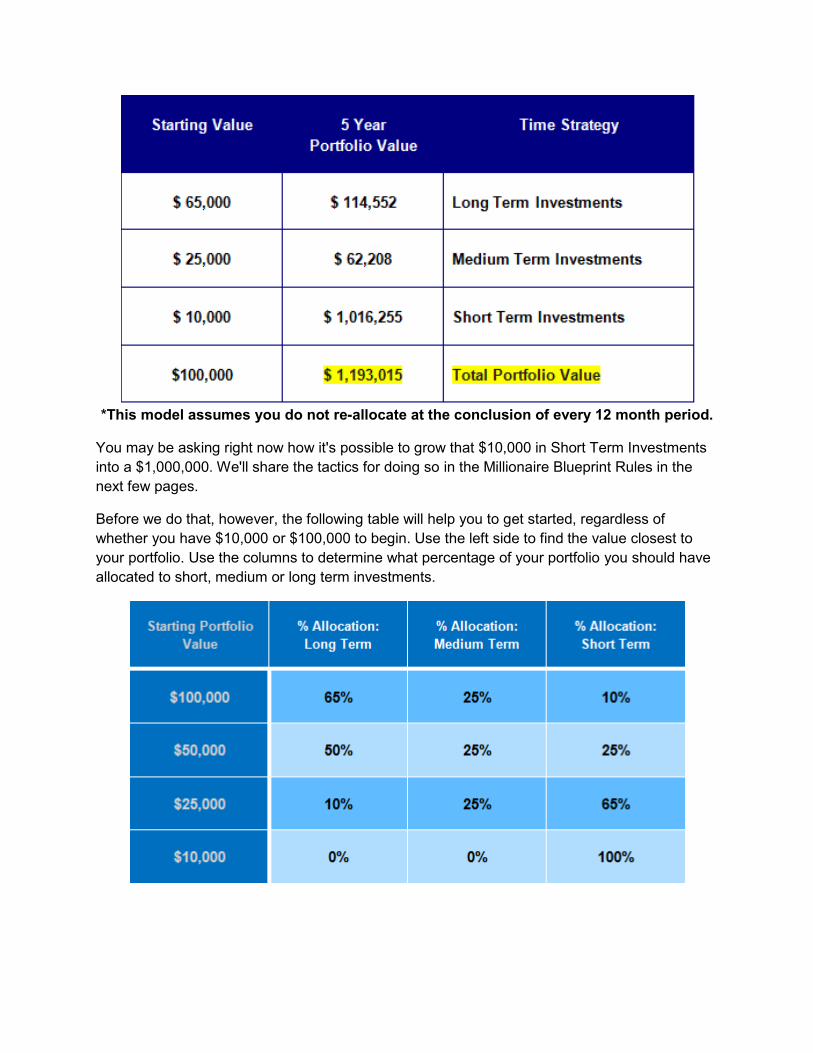
*This model assumes you do not re-allocate at the conclusion of every 12 month period.
You may be asking right now how it's possible to grow that $10,000 in Short Term Investments
into a $1,000,000. We'll share the tactics for doing so in the Millionaire Blueprint Rules in the
next few pages.
Before we do that, however, the following table will help you to get started, regardless of
whether you have $10,000 or $100,000 to begin. Use the left side to find the value closest to
your portfolio. Use the columns to determine what percentage of your portfolio you should have
allocated to short, medium or long term investments.

Asset Classes For Time Diversification Portfolio The following table will help you to quickly review which asset classes you should consider
using for generating returns in any of the three primary time frames in the Time Diversification
Portfolio.
Short Term
Investments
Stocks/ETFs
Options
Futures/Currencies
Bonds
Medium Term
Investments
Stocks/ETFs
Options
Bonds
Currencies
Long Term
Investments
Stocks
Treasuries
Bonds
Annuities/CDs
Notes on asset classes:
Regardless of the 2008 stock market collapse, stocks and by extension ETFs continue to
represent the best investment choice for most investors. While stock prices and the indexes will
fluctuate and will go through periods of bullish and bearish rallies, stocks should still be
considered a safer investment with a better annual return. I'll stress here "most investors" – not
all, will benefit from having their money in the stock market over the long term. Stocks can be
used both to generate returns and to create income (typically through dividends); their best use,
however, is for increasing your annual rate of return.
Options should be used by those who have LEARNED how to trade them and they are best
used in short term and medium term investing strategies. Options can be used both to generate
returns and to create income.
Currencies are high risk – there's no getting around it. But for those who are able to handle risk
the availability of currency trading adds another potential avenue for creating strong returns in
your portfolio. It should be stated that currency trading – in our opinion – is best used for short
term to medium TRENDS in the currency markets and NOT for day trading or scalping. You can
choose to either use direct currency trading in the Forex markets, or use currency ETFs or
ETNs.
Futures are, like Currency Trading – high risk. They can be high reward, too. Again, we would
suggest using futures for TRENDS in the market and not for day trading or scalping.
Bonds require more knowledge for selecting the right yield to the investment term – something
we will not be investigating here. You should accept that bonds will typically lower your annual

return but in exchange provide a safe haven for your money. US Treasuries consistently are
favored even though yields are at historic lows because they are still considered the safest
investment.
For the remainder of this report, we will focus strictly on the Short Term Investment part of
your portfolio and ONLY using stocks and ETFs to create sustainable growth while still
providing you PROTECTION from risk.

The Millionaire Blueprint
It is this part of the Time Diversification Strategy which we call the Millionaire Blueprint and as
you read on, you'll discover how you could potentially turn your portfolio into a Million Dollar
Asset.
What we will do is show you how you can realistically use the Millionaire Blueprint to better
position and invest your money to achieve smart, consistent, compounded gains that can, over
time, increase your wealth.
Our plan and system isn’t based on some unknown secret to investing – it is based on proven
models of stock selection, investing and statistics, all boiled down to the most important and
easiest steps any investor can follow. We don’t bog you down in technical jargon or stock-
speak so esoteric that only an economic wonk or a mathematician could understand it.
Rather, this plan will share a simple, step-by-step strategy that any intelligent investor can
comprehend and implement RIGHT NOW to:
Manage and grow your money
Protect your money
Capture consistent and realistic gains
Diversify and reduce your overall financial risk
Each section of the Millionaire Blueprint covers a critical element of our smart approach to
investing.
Section 1: “An Overview of Goals and Objectives,” We lay out the rules of our plan and
strategize how you’ll build your portfolio based on goals and to be properly positioned to attain
them.
Section 2: “Understanding Risk and Money Management,” Capturing small, consistent gains in
a variety of trades can add up to big annual returns. When managed properly you’ll place the
odds in your favor using the 8:5 rules to maximize gains while minimizing trading loses.
Section 3: “8:5 Rules – Step by Step Analysis,” The nuts and bolts of how to implement the
Millionaire Blueprint, including specifics on how to divide your trading capital, how to calculate
price targets (Profit Trigger), how to calculate stop losses (Loss Trigger) and how to enter
orders.
Section 1: Overview of Goals and Objectives
The Millionaire Blueprint is based on setting realistic goals with clearly defined objectives that
allow you to build wealth over time.
There’s a famous line from Lewis Carroll’s masterpiece, Alice in Wonderland, which sums up
most investors’ approach to managing their money. The line is delivered by the inimitable
Cheshire Cat, who tells Alice, “If you don’t know where you are going, any road will take you
there.”
Well, the fact is that you must know where you’re going when it comes to your investment plan,
and that’s the first critical component addressed by the Millionaire Blueprint.
The second critical component is to provide you with the knowledge and the tools necessary to
carry out that plan. You see, it’s not enough to simply know where you’re going. You also have
to have a reliable vehicle that gets you there.
If we were forced to boil the Blueprint down to one sentence, it may read something like this:
This plan is designed to help you take small, consistent profits that build up to big numbers over
time.
If given the luxury of a corollary sentence, it might read like this:
The plan also helps reduce risk by never allowing a big loss.
Sounds easy, doesn’t it? Yet as we all know, sometimes the easiest things are arrived at
through a whole lot of painstaking effort.
The Goal
The primary goal of the Millionaire Blueprint is to turn $10,000 of invested capital into
$1,000,000 using our unique Short Term Investment strategy as part of the Time Diversification
Strategy.
The timeline to accomplish this lofty yet achievable goal is between five and 10 years,
depending upon how aggressive you want to be with your investments.
We think it’s even possible to turn a one-time investment of just $1,000 into $1,000,000
following this plan. Obviously it will take you longer to reach that million dollar goal, but it’s not
out of reach.
By following the Time Diversification Strategy and the Millionaire Blueprint Rules you place
yourself in a stronger position to capitalize on the stock market with each trade you make and,
you'll have a simple to understand and easy to follow plan to profit from the stock market.

Important Note: This plan is best followed by using a segment of your total portfolio, if
possible, as discussed earlier.
For example, if you have a total portfolio value of $100,000, break off a segment of that portfolio
(10-20% of it) to use with the strategy in the Millionaire Blueprint. Continue to allocate the
remainder of your portfolio to longer term equities, mutual funds, bonds, or other investment
vehicles.
If not, we strongly recommend a base portfolio allocation of $10,000 to execute with this plan.
Three primary reasons for this:
First, you want to get used to trading differently and keep your 'learning' exposure low while you
execute the rules we're about to teach you. Walk before you run.
Second, you'll be making short term gains and losses, and that means "taxes" – naturally you'll
want to keep your tax exposure as low as possible and you'll accomplish that by having only a
portion of your assets at tax risk.
Third, you always want to have your portfolio structured so that you are not at-risk to any single
investment vehicle. In other words, you wouldn't want a $100,000 portfolio completely vested in
stocks – you'd want to be invested in other assets so that if the market goes south, you're not at
100% exposure.
If you're beginning with a smaller portfolio size understand that in order to grow that portfolio
you will have to take on some risk. The goal of the Millionaire Blueprint is to MINIMIZE risk at
every turn. You'll learn how as you read on.
Plan Objectives
Your objectives are to learn the basic structure of the rules and to teach yourself how to follow
them. You will learn to master the following concepts:
Compounded Returns
Risk to Reward Ratios
Profit Strategies
Account Management Strategies
Section 2: Understanding Risk and Money Management
The essence of the Millionaire Blueprint comes down to two simple numbers.
The numbers are 8, and 5.
What’s so special about the number 8 and the number 5?

That’s a great question, and one that might be best served with an analogy to of all things, the
sport of kings, horse racing.
Let’s take a look at what typically happens when people bet on a horse race.
First of all, most people bet one horse to “win.”
Why is this? Well, it’s because the payout is larger on the “win” bet. But did you know that there
are two other bets that are significantly under-utilized?
These are the “place” and the “show” bets. Here’s how it works. The “place” bet means if your
horse comes in second or first, you win. The “show” bet means if the horse comes in third,
second or first, you win.
Now, the payouts on these bets are much lower than the outright “win” bet, and that’s why many
bettors don’t use them. Apparently, not many people like the “little” wins.
Yet, doesn’t a number of smaller winning bets on multiple horses make a lot more sense than
losing a big bet on just one horse?
If you make just one “win” bet and you lose, you still have lost money. Even if that “win” bet
originally had the potential to make you big returns, if it fails to deliver you could be sitting on a
sizable loss.
In fact, the notion that you have to hit a big winner every time you invest in a stock is one of the
most common mistakes investors make.
A better strategy would be to buy a number of stocks with a “show” mindset.
Think of it this way; if you bet four horses to “show,” you are much more likely to hit one or more
winners. And even though the overall gain in betting on more than one horse would be less than
putting all of your money on the one big winner, the total number of smaller “show” bet wins will
likely more than offset the occasional gain you make when you do get the one “win” bet right.
As you invest in stocks, your goal should be to bank small, consistent gains without sustaining a
single big loss. By essentially “covering” the field with a select group of high-caliber stocks, the
odds of walking away with a profitable trade will be significantly higher than if you “bet it all” on
just one horse to “win.”
When it comes to both horse racing and investing—small and consistent “show” bets usually
make participants the most money over the long term.
Let’s take a closer look at the math involved in horse racing—math that also pertains directly to
investing.
If you bet three horses to “show”, you’re covering (on average) 30% of a typical race field.
Those three bets have nine possible winning outcomes. So essentially, you’re leveraging the
field.

Add in a fourth horse, and you’re covering 40% of a typical field (10 horses per race), with 12
possible winning outcomes. As with any betting strategy, stock trading is about positioning
yourself to come out ahead of the game when the race is over.
Horse 1 can Win / Place / Show / Miss Horse 2 can Win / Place / Show / Miss Horse 3 can Win / Place / Show / Miss Horse 4 can Win / Place / Show / Miss
In stock trading, there are three possible outcomes:
A trade can be profitable
A trade can break even
A trade can be a loss
Of those three, you obviously want the first, or at the very least, the second outcome. Let’s
assume you’re trading four different stocks simultaneously. Using the example above, your
possible outcomes are:
Stock 1 can be Profit / Break Even / Loss
Stock 2 can be Profit / Break Even / Loss
Stock 3 can be Profit / Break Even / Loss
Stock 4 can be Profit / Break Even / Loss
Among the four trades, you have eight possible winning outcomes (for our purposes, a break
even trade is considered a winning outcome because you have not decreased your capital
base), and four losing outcomes.
That means your odds of a winning outcome are 2:1. In other words, you have more ways to
come out ahead at the end of the race—and that's what you’re always after.
This is where the number 8, and the number 5 come in. We succinctly call this the "8:5 Rules."
The 8:5 rules will position you to effectively cover the field of a select group of stocks with better
odds in your favor for walking away with a profitable trade, or at worst, a break even trade. And
if you do have a losing trade, (they will happen) you’ll be better positioned to recover from a loss
because of this strategy.
Dressing Your Upside to the “8s”
After decades of experience observing investor behavior, we’ve learned that most people try to
get gains of 20%, 50%, and sometimes even 100% on a single position. This often leads to
investors being “stuck” in trades if they feel they aren’t hitting these targets.
Even worse, they’ll let a healthy gain of 10% or more slip away and turn into a loss.

We all like to bank big winners, but at what cost? Usually the really big gains take up something
that none of us can afford to squander, and that’s Time.
Think about this for a moment —How long does it take to get that 20%, 50% or 100% gain?
Once you have that gain, what was the average return per month for the time you were invested
in it? The longer you hold a position, the lower your average return per month may turn out to
be.
For example, let’s say you buy ABC Company stock for $20 a share and hold it for five years, at
which time the price has climbed to $30 a share. Here you’ve pocketed $10 per share over five
years. That looks great, it's a 50% gain and it’s certainly the stuff of portfolio dreams. Yet do the
math and you’ll discover that what you actually have is an annualized rate of return of just 8%.
Now, there’s certainly nothing wrong with that rate of return, and it is just about in-line with the
long-term annual rate of return in stocks that comprise the S&P 500 Index.
However, the reality is annual returns of 8% will simply not grow your money quickly enough to
turn that $10,000 into a million dollars in five years. Buying and holding a stock for that long also
puts you at the mercy of another major downturn in the market, so not only are you getting less
in terms of an annual rate of return, you’re also exposing your capital to a potential 2008-2009
scenario.
In fact, if you earn 8% annually on your money and start with $10,000, after 25 YEARS, you'd
have a little over $60,000.
In this day and age, that's too slow and leaves you seriously exposed to even just one more
bear market, like we all suffered in 2008-09.
The key to building real wealth is capitalizing on consistent returns that compound your money
over time. So, instead of having an annualized rate of return of 8%, you’ll be able to achieve
annualized returns of 60% to 152% each year.
At first glance those numbers sound unrealistic, but bear in mind they are average annual rates
of return and you're going to learn how to compound your money every MONTH, instead of
every year – and that's what makes the Millionaire Blueprint so unique.
In the current market environment, it has become ever more difficult to achieve sustained
annual returns due to many of the factors we’ve already discussed.
To combat this successfully, you'll learn to take profits faster and roll those profits into new
positions which further accelerate your ability to achieve the sustainable, long-term growth your
portfolio requires.
That's compounding your money – you use the money you 'gained' in the previous month to
earn a larger 'dollar' gain in the next month.
The following truism is something we want you to commit to memory, as the entirety of our
philosophy rests on it:
The key to successfully growing your portfolio is determined by increasing the
annualized rate of return on your money.
Your objective with the 8:5 rules will be to achieve a consistent rate of return each month,
typically between 4% and 8% (hence, where the “8” in 8:5 comes from). Now at first glance, that
may seem like a ridiculously small number. But remember, we are talking about that return per
month, not per year. Moreover, what most people fail to understand is that through the power of
compounding, that money can grow quickly when managed properly.
To achieve this goal, you need to invest in stocks (and in some cases exchange-traded funds,
or ETFs) with the intent of achieving a 4% to 8% return per month.
At just 4% per month, which is certainly an achievable number, your annualized rate of return is
60%. That’s because when you compound those gains, that 4% you earn in your first month
gets tacked on to the next month, and so on, adding up to that 60% annualized rate.
The more ambitious goal of 8% per month, also an achievable number, puts your annualized
rate of return at 152%.
Now as you work through this plan, you'll discover you will target BOTH percentages as you
protect your capital – so some months you may walk away with a smaller gain, but you'll
average out by having larger gains in other months.
Remember, the goal of the Millionaire Blueprint is to grow $10,000 into $1,000,000, but you can
only do that by compounding consistent (and realistic) returns month after month.
What you'll discover when you actually implement the plan is that you’ll have the flexibility and
the protection you need to make sure that no matter what the stock market does, you’ll be able
to reach those returns each month.
Now, at 4% per month and starting with $10,000, it will take you up to ten years to grow your
portfolio to that once elusive million dollar status.
At 8%, you'll be able to do it in about five years. The reality is that your personal performance
will likely be somewhere in between five and ten years, provided you stick to the plan and the
rules.
Some months you should expect to only be able to net 4% and other months you'll discover you
can do better than 8%. On average, however, you want to strive for small, consistent gains.
Think of it like this—if you’re playing baseball and you want to hit for a higher batting average,
then concentrate on hitting singles and doubles and don’t swing for the fences every time.

The Fab "5" Protection Plan
The second part of the 8:5 rules equation is, of course, the 5. This represents the 5% maximum
risk you will take in any single invested position.
What this means is that whenever you place a trade, you should only be willing to lose up to 5%
in that one position. Now, 5% may seem like a very tight rein on any stock you buy, but think
about it this way. When you bought that stock, did you buy it because you thought it would go
down? Of course not, you bought it in the hopes of it going higher.
So, if the stock doesn’t go higher, and if it starts to fall more than 5%, then admitting you were
wrong about it and cutting your losses immediately is the best way to manage your portfolio's
capital.
REALITY CHECK: Read this again, because most investors completely miss this
critical point:
If the stock doesn’t go higher, and if it starts to fall more than 5%, then admitting
you were wrong about it and cutting your losses immediately is the best way to manage your
portfolio's capital.
This management of risk can be achieved by a very simple trading tool known as a stop-loss
order. Placing a corresponding stop-loss order in along with your buy orders at a level of 5%
below your entry price will ensure that if the stock turns against you, you won’t suffer any
serious portfolio damage.
And, even if you suffer multiple losses in a row – you won't wipeout your portfolio balance.
How many times have we heard about investors who watched $250,000 portfolios collapse to
less than $50,000 portfolios in the last couple of years?
How many times have we heard the "joke" about "401(k)s turning into 201(k)s"?
Aren't you tired of hearing about that?
Then learn this lesson (and we'll show you the math to prove this shortly): The faster you cut a
losing position the more capital you PRESERVE for the next (potentially) winning
position.
It makes no sense to sit on a losing position month after month, hoping it will recover, when
there are hundreds of other stocks you could use to make up the small loss quickly and then,
turn it into a large profit.
Most investors will never learn that lesson. Never. They refuse to evolve like us.
But why is the stop-loss set at 5%?
As you'll see in the next section, the fact that you’re spreading your risk out over multiple stock
selections—or covering the field, per our horse racing analogy—puts you in a much better
statistical position to make winning trades.
But the fact that you have more positions means that you need to cut the losers quickly, as
failure to do so could result in that position dragging your money down into the darkness.
Once again, with the 8:5 rules – you'll be targeting 8% gains with 5% risk.
Let’s cover how you actually do that right now...
Section 3: The 8:5 Rules—A Step by Step Analysis
Knowing the key to investing success is one thing, but effectively putting it into practice so that
you can actually turn theory into reality is a completely different proposition. That’s why it’s
helpful to look at the 8:5 rules using an easy to follow step by step process.
Here are the four main steps in the 8:5 rules:
Step 1: Divide your trading capital
Step 2: Calculate your profit target
Step 3: Calculate your stop loss price
Step 4: Enter your order
How Simple Is That?
By following these simple guidelines on each and every stock trade you make, you will
automatically be ahead of the game in terms of knowing where you are going to exit the position
for a gain, and where you’re going to limit your losses. You're now trading a system that works.
And because you started out by dividing your trading capital so that you “cover the field,” you’ll
never have all of your eggs in one basket.
This is simple, we agree, but you may be surprised to find out that only a very small percentage
of traders actually take these basic steps before putting their capital at risk.
Now let’s take a closer look at each of the four steps.
Step 1: Divide your trading capital
Although there’s more than one way to divide your trading capital, the way we like to do it is to
simply divide our capital into four equal parts. For illustrative purposes, we’ll use $10,000 as a
trading account balance.

When you divide your trading capital, you should treat each capital segment as its own trading
account. For example, if you divide your $10,000 into four equal segments of $2,500, you now
have four mini trading accounts.
Each account should be operated as its own business (more on this later), and as your
segments generate both gains and losses, you will recalculate your account, divide your capital
again, and then reallocate your capital to continue covering the field.
By dividing your capital into four parts, you accomplish the following:
1. You increase your winning capacity on each individual trade.
2. You decrease your risk on each individual trade.
3. You put less pressure for gains on each trade
Because making winning trades is largely a numbers game—meaning the more chances you
have to win, the more likely you are to win—you have to make sure you divide your trading
capital to spread out the risk.
Remember the horse racing Analogy?
Don’t go for the “win” bet. Rather, bet on several horses to “show” and you’ll leave the track with
a lot more cash in your pocket.
Trading stocks is no different. You don't want to put a massive bet on a single stock where a
move against you can wipe out a significant portion of your trading capital.
As your trading capital grows, or if you have more money to initially invest, you can further
diversify your portfolio by dividing your trading capital into even more mini trading accounts.
Let’s look at an example illustrating why it’s so important to divide your capital when trading.
Imagine you were to buy XYZ Corp stock with your entire trading capital of $10,000.
You’d be very nervous, if not downright panicked, if that trade begins to move against you.
However, you’ve segmented your capital into four parts using your Millionaire Blueprint, and
instead have a $2,500 position in XYZ, a minor pullback will have only a small effect on you
because the impact to your capital base will be far less.
Put numerically:
If XYZ declines 5% on a $10,000 position, you’ll be down $500
If XYZ declines 5% on a $2,500 position, you’ll be down just $125
That difference also illustrates how you are changing the impact of risk on each trade.
The actual risk to your entire portfolio on a segmented trade using the 8:5 rules is 1.25%,
whereas on the full position trade, it is a straight 5%. In essence, you’re risking 75% less capital
in any one trading position.
We can’t over emphasize the importance of dividing up your capital according to these rules.
The common mistake made by so many traders, thinking that they have to max out their
holdings in any one position, leaves them exposed to far too much risk as you’ve seen.
Let's look at another example of the power of dividing your capital.
Remember the horse race analogy?
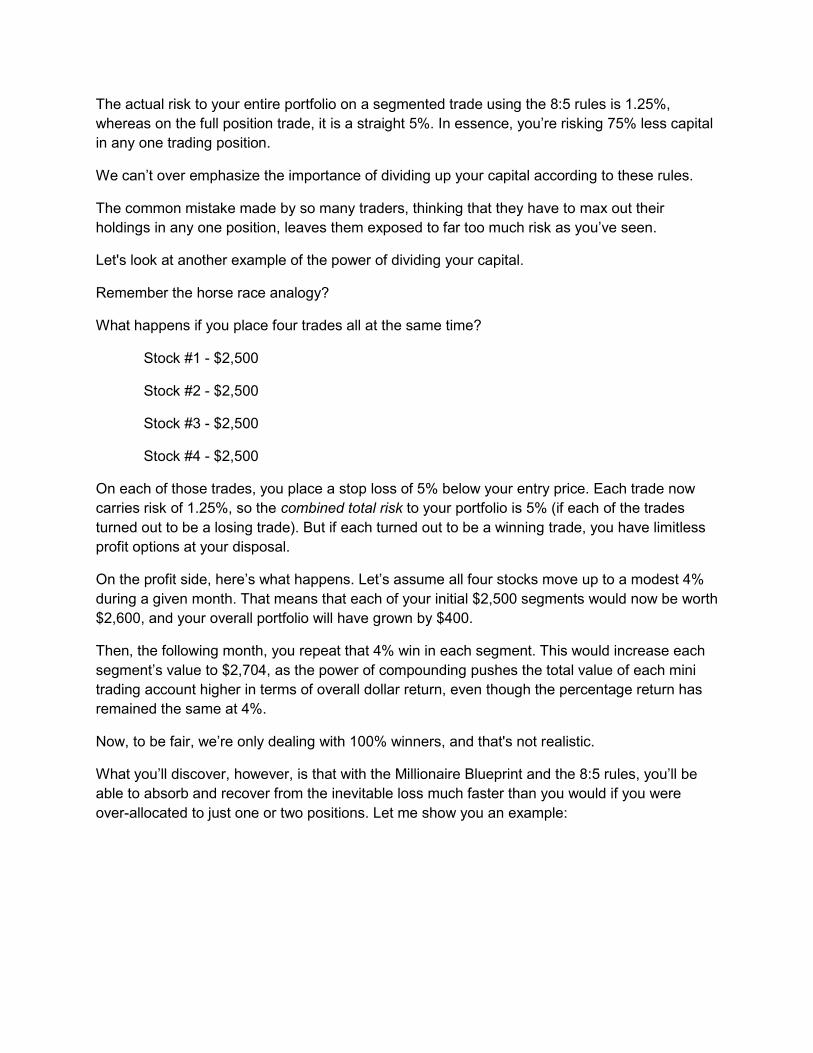
What happens if you place four trades all at the same time?
Stock #1 - $2,500
Stock #2 - $2,500
Stock #3 - $2,500
Stock #4 - $2,500
On each of those trades, you place a stop loss of 5% below your entry price. Each trade now
carries risk of 1.25%, so the combined total risk to your portfolio is 5% (if each of the trades
turned out to be a losing trade). But if each turned out to be a winning trade, you have limitless
profit options at your disposal.
On the profit side, here’s what happens. Let’s assume all four stocks move up to a modest 4%
during a given month. That means that each of your initial $2,500 segments would now be worth
$2,600, and your overall portfolio will have grown by $400.
Then, the following month, you repeat that 4% win in each segment. This would increase each
segment’s value to $2,704, as the power of compounding pushes the total value of each mini
trading account higher in terms of overall dollar return, even though the percentage return has
remained the same at 4%.
Now, to be fair, we’re only dealing with 100% winners, and that's not realistic.
What you’ll discover, however, is that with the Millionaire Blueprint and the 8:5 rules, you’ll be
able to absorb and recover from the inevitable loss much faster than you would if you were
over-allocated to just one or two positions. Let me show you an example:

Let's assume that 2 of your positions reach their 8% profit targets and 2 of your positions hit the
5% stop loss.
Stock #1 (8% winner)
Starting capital: $2,500
Ending Capital: $2,700
Net Gain: $200
Stock #2 (5% loser)
Starting Capital: $2,500
Ending Capital: $2,375
Net Loss: $125
Stock #3 (8% winner)
Starting capital: $2,500
Ending Capital: $2,700
Net Gain: $200
Stock #4 (5% loser)
Starting Capital: $2,500
Ending Capital: $2,375
Net Loss: $125
Total Net Gains: $400
Total Net Losses: $250
Net Portfolio Gain: $150
In this example, you've had 50% winners, and at the end of the month, you've come out ahead
(for illustrative purposes, we're assuming the time horizon for each stock was exactly 30
calendar days; you'll generally find this isn't the case).
Bear in mind as you move through the Millionaire Blueprint, the goal is to increase your portfolio
EVERY month. You can absorb losing trades because of the value of the winning trades
outpacing the losing trades (as we've just shown you).
Plus, as we'll share with you later, you'll want to manage around 4-8 positions each month (or
more). As you increase the number of positions you hold, you'll discover you don't have to win
every single trade – in fact, you can win on 'only' 50% of your trades and reach that 4-8% per
month target.
Even if you have a lower month, for example, the scenario we showed you above would have
added 1.5% to your portfolio (which is short of the 4% target), you've still achieved the important
objective of growing your portfolio.
In months where the market is dicey at best, you'll discover you'll still outperform the major
averages with this plan – then, when the markets are hot, you'll quickly make up the difference
from that lower profit percentage month.
That's because the 8:5 Rules allow you to maximize gains when you hit a winning streak and
protect as much of your capital as reasonably possible when the market is against you.
Don't be afraid to cut a loser – you'll be that much closer to recovering and profiting with a
winner.
Special Tip: Remember that you are after PERCENTAGE gains on every trade and
consequently during each trading month. A Common mistake traders and investors make is
trying to make "dollar" gains. An 8% gain is an 8% gain no matter whether you have $500 on
the trade or $5,000.
Stay completely focused on your percentage gains. Our minimum desired gain on any trade is
4% (and we'll show you how you can target that). Our target gain on every trade is 8%, but we'll
also share a little trick you can use to get more than 8% when you hit a stock where the price
keeps going up.
Step 2: Calculate your profit target
The next step in the 8:5 equation is to determine your profit target (or, Profit Trigger). Here the
goal is to achieve a profit of 8% on every position you enter. We also want to have plans in
place to capture a much bigger profit when a stock gets really hot.
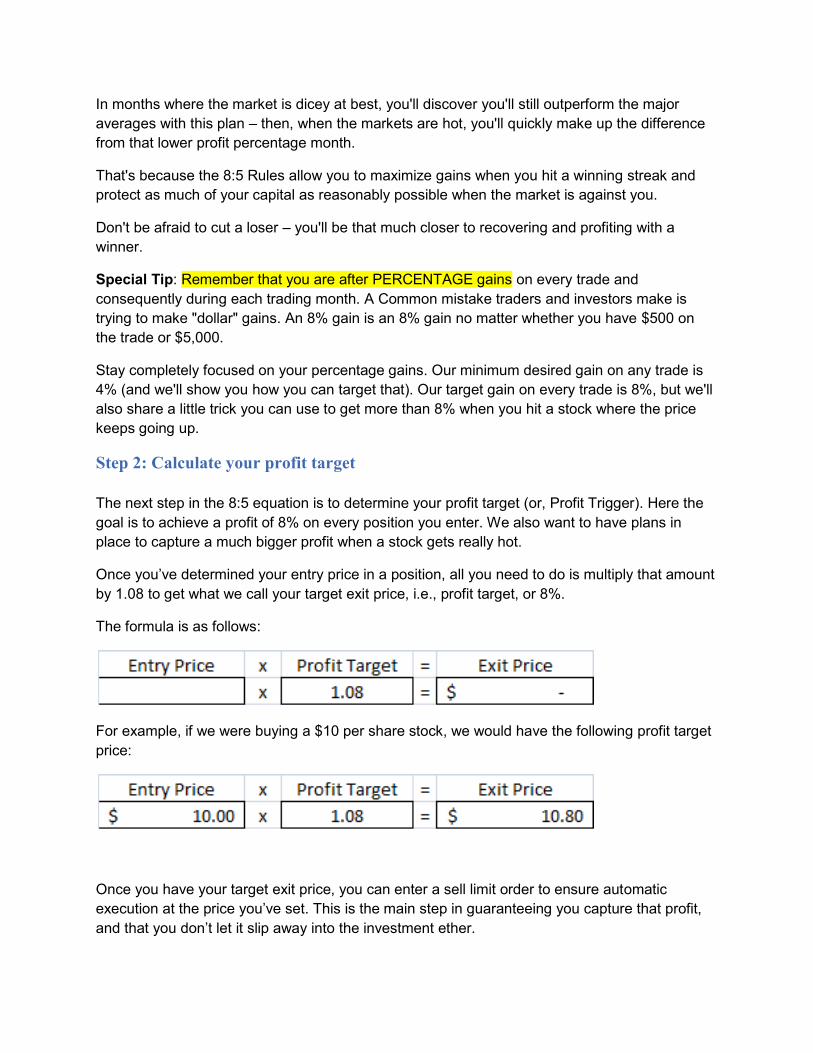
Once you’ve determined your entry price in a position, all you need to do is multiply that amount
by 1.08 to get what we call your target exit price, i.e., profit target, or 8%.
The formula is as follows:
For example, if we were buying a $10 per share stock, we would have the following profit target
price:
Once you have your target exit price, you can enter a sell limit order to ensure automatic
execution at the price you’ve set. This is the main step in guaranteeing you capture that profit,
and that you don’t let it slip away into the investment ether.

Here's a real trading example from a trade we recommended to Millionaire Blueprint Program
Members in June, 2012:
US Airways (LCC): This recommendation was to enter with a Buy Limit
order on Monday, June 11th 2012. We'd been following US Air since a
strong trade in May which successfully gained 26%.
But, we wanted to wait for a pullback in the price. That pullback came and allowed us a better
entry price for a second move in this stock.
You would have entered at a price of $11.75; next you would have set your stop loss at $11.16
(the lower white horizontal line on the chart above), which is 5% below your entry price. There's
your Loss Trigger – your protective stop is already set.
Under the 8:5 rules, you also would have set an automatic exit price of $12.69 - your 8% profit
target, or Profit Trigger. As you can see, US Air performed very well, moving up and reaching
our Profit Target on June 21, 2012.
With the basic rules you had an automatic exit price set, and you would have exited the stock at
the price of $12.69 on June 21.
And you would have automatically cashed in on an 8% gain.

Let's look at one more example, Xilinx (XLNX):
Xilinx (XLNX): This recommendation was to enter at the market
open on Monday, July 23, 2012. You would have entered at a price
of $30.70, and set your stop loss at $29.16 (5% below your entry
price).
As you can see, XLNX moved up very quickly and hit its 8% profit target on July 30 at $33.16.
Another 8% gain. Of more importance, you should see the impact of the Profit Trigger – there's
no decision to be made, no fretting over whether to sell or what to do – the rules automatically
take care of it for you: Either you hit your Profit Trigger or you hit your Loss Trigger.
Now, not all stocks are going to move that fast and not every trade will be an 8% winner.
What you want to master is the concept of discipline AND removing EMOTION from the trade:
by having a strategy and sticking to it the rules do all the work that your emotions typically
prevent you from being able to do.
This profit strategy represents ONE HALF of your personal trading plan (that's the profit half).
Even though you can see on the chart above that the stock price continued to climb, don't think
about 'missed profits' -- you 'walked away' with an 8% gain.
Anytime you walk away from Wall Street with a gain, you're beating the market.

Step 3: Calculate your stop loss price
We’ve already covered the importance of setting a stop loss (or, Loss Trigger) on every position
you enter into to help reduce your downside risk, but here this principle deserves a bit more
illumination.
Perhaps the biggest reason to place a stop-loss order is that if a stock you buy declines by 5%
within a short time of placing that trade, either the technical or fundamental validity of the
trade no longer exists.
In other words, the reason the stock was selected in the first place is no longer valid, and that
means you’ll want to cut your losses and move on to more profitable positions.
All too often we've heard about investors in 2008 who simply watched their portfolios
disintegrate.
When we asked them what kind of protection they had in place for curtailing losses, their
answer was simply, “I didn’t have any.”
Sadly, this is the case for most investors. But not us, because together we’re armed with a
simple to follow strategy preventing us from falling victim to large, portfolio killing losses.
Now, to further illustrate the importance of having a stop loss, let’s take a look at one example of
a former widely held blue chip stock whose value vanished…completely.
Imagine you held General Motors stock in 2001.
Times were great, and the stock had delivered nice gains. In fact, it was trading near $100 a
share.
Then disaster struck, and a series of mishaps, along with a bear market, put the brakes on GM
shares and caused them to slow to around $60.
Most investors held on to their GM position, and many others actually bought more shares with
the idea that an eventual rebound in a stalwart company like this was just around the corner.
Fast forward eight years, and those once-mighty GM shares had become essentially worthless.
The moral of this story is never, ever, chase a losing position. The sooner you can cut a loss,
the sooner you can make up that loss in a more profitable position. We’ve said it before, but we
can’t emphasize this enough.
Trading is the art of playing the percentages.
If you put yourself at a disadvantage by letting one loser take down your entire portfolio, it could
nullify the odds you have of winning with multiple trades. And, by placing a tight stop loss of 5%
on every trade you make, you are limiting the risk in your mini accounts to just 1.25%.

Now, to calculate your stop loss, all you need to do is multiply your entry price by 0.95, which is
your 5% stop loss.
The formula is:
For example, if we are entering a stop loss for the $10 stock, we would set the following stop
loss target:
The calculation is the easy part. The harder part is to make sure you honor that stop-loss and
not let a losing position get out of hand. Fortunately, doing this is a simple matter of placing your
order properly.
Special Tip: Never, ever MOVE a stop loss LOWER. Don't do it.
Using the example above, a critical mistake investors and traders make is to see the stock price
closing in on their stop loss price and becoming emotionally attached to their stock because
they love the name, or are convinced it will turn around and subsequently 'change' their stop
loss price to give the market more 'room to breathe'. Big mistake.
So if a trader suddenly sees the price at $9.75 and decides to move his stop loss lower to $9.00,
he's just DOUBLED his risk in the trade.
Furthermore, if the price moves down and takes the trader out at $9.00, he now needs TWO
winning trades to overcome that one loser.
With the 8:5 Rules, if you suffer one losing trade it takes only ONE winning trade to remain in a
state of PROFIT. The rules are put in place to keep you safe and protect your capital and
minimize risk.
Let's review the math for that, so you'll believe it:
Position 1
Entry Price: $10.00
Stop Loss: $ 9.50 (For this example, we'll use the straight 5% Stop Loss)

Let's assume you have a $2,500 mini account (from your Capital Division). Thus, you hold 250
shares.
When the stop loss is hit, the value of your mini account would become $2,375. (250 * 9.50 =
$2,375.00)
Position 2 (Following the loss above, you move on to a new position)
Entry Price: $10.00
Profit Target: $10.80
With the new capital base following the loss in Position 1, we have $2,375 to put on this trade.
So, you'd purchase 237 shares at $10.00 per share. When the profit target is reached, the value
of your mini account would be $2,559.60 – or, across the two trades, you've still increased the
value of this mini account by $ 59.60, despite having suffered a 5% loss on Position 1.
If, however, you had made the mistake of lowering the stop loss to $9.00, as we described in
our example above, you would have had $2,250 to utilize on Position 2 (250 * 9 = $2,250), and
would have purchased 225 shares at $10.00 per share.
Then, when Position 2 closed out with its 8% gain the net account balance would become
$2,430, (225 * 10.80) -- leaving you with a net $70 loss across the two trades. All because you
lowered that stop loss.
That's why it is so important to stick to the rules. They are designed with TIME in mind – by
TIME we mean across a series of trades (over weeks or months) the percentages will be in
YOUR favor. Let them work for you.
Step 4: Enter Your Orders
Entering orders with your brokerage firm is relatively simple, but you have to make sure you do
so in a particular fashion if you want to be aligned with the Millionaire Blueprint.
Typically, you’ll use market orders for your entry price. A market order tells your brokerage to
buy or sell an investment immediately at the best available current price. Once that order is filled
(and once you know precisely your buy price), then you can place the following orders:
Sell Limit (In Dollars). This is your profit target price.
Stop Limit (In Dollars). This is your stop-loss price.
A Sell Limit order is one that tells your brokerage firm to sell a set number of shares at a
specified price or better. Limit orders also allow an investor to limit the length of time an order
can be outstanding before being canceled.
A Stop Limit Order (also called Sell Stop) is an instruction to your broker to sell a security
when its price falls to a particular point. Once the price hits that predefined exit point, the Stop
Limit Order becomes a market order, and the trade is executed at a MARKET price.
So, in our $10 stock example, we would set our Sell Limit Order at $10.80, and our Stop Limit
Order at $9.50.
Here’s a quick recap of the step by step action plan in the 8:5 rules.
1. Divide your trading capital into four equal parts.
2. Multiply your entry price by 1.08. This is your profit target price.
3. Multiply your entry price by .95. This is your stop-loss price.
4. Enter all three orders
a. Market Order establishing the position
b. Sell Limit (profit target)
c. Stop Limit (stop loss)
At this point, only one of two outcomes will be possible:
1. Your stop loss is hit (Loss Trigger), and the trade is over.
2. Your profit target is hit (Profit Trigger), and the trade is over.
Small, Consistent Wins the Race
The real key to successfully growing your money is to achieve small, consistent profits over
time. Now, ask yourself this question: how much does a $10 stock have to rise in price to grab
an 8% profit?
If you’ve done your Sell Limit calculation, you already know the answer is a mere 80 cents.
Yet what do most people hope to achieve when buying a $10 stock? They think about the stock
jumping to $15, $20, $30 or even $50 per share. Of course, these kinds of moves certainly do
happen, but they represent totally unrealistic expectations. Moreover, failure to achieve these
kinds of results in one or two stocks often leads to frustration and disappointment with more
modest gains.
Our advice? Don't be afraid to hit singles and doubles.
Winning in the markets is like playing baseball. You’ll score more often and win more games by
consistently hitting singles and doubles than swinging for the fences at every at bat.
If you seek consistent realistic profits with your trading capital, you’ll find the market will give you
those 4-8% returns far more frequently than it will give you those 50%, 100% or 1,000% returns.
That, in essence, is the foundation of the Millionaire Blueprint and the 8:5 rules. That's yet
another reason why we recommend using a percentage of your total portfolio with this plan – so
you can be excited to know that you are regularly growing your portfolio on a monthly basis.
Just like a building you must start with a solid foundation before you begin construction, and
that’s exactly what you possess now; a foundation to build your portfolio over the next decade
and beyond.
Managing Your New Portfolio
A few words here on what to do when your portfolio reaches six figure territory: We need to be
realistic about a few things – namely, based on the strategy we've just shared with you, as you
experience growth in your portfolio you will eventually reach a point where capital division would
require you to expose too much money to risk. This section provides alternatives for your capital
to ensure you continue to experience positive growth without high risk.
Obviously, if you're creating consistent returns of 4% to 8% per month, your portfolio will grow at
a rate that would ultimately require you to put on tens of thousands of dollars in a single trade.
While the risk factor of 1.25% of your total portfolio would NOT change, the overall dollar factor
does change.
To combat this issue, once your short term investments have grown to $100,000 or more (and
assuming you have been using just stocks or ETFs to get there), you should consider branching
out into the other asset classes we discussed previously: specifically, you should consider
adding options trading, short term bonds, and possibly currencies to your short term investment
mix.
And, as your medium term and long term portfolios grow, follow the same branching process for
those segments of your portfolio.
By splitting your investment across more asset classes you can reduce your risk to any single
asset class and, especially for short and medium term investment account balances, you will
find you can move to cash quickly (liquid assets) or protect yourself from risk if the markets
should suffer another bear market.
While you may experience slightly lower returns, you'll more likely discover that you can
maintain the 4% to 8% per month returns for short term investments without having to add
significant time or market exposure.
A brief example:
If you learn to sell options (instead of buying them), you can create average returns per month
of 1.5% to 3% -- this is largely due to creating cash upfront (when you sell an option, you get the
cash first) and managing the profit in the trade second. This also decreases the pressure on
your stock or ETF holdings to outperform on a monthly basis; meaning you can hold fewer
positions and turn your portfolio over less frequently.
You can also use options to hedge against your stock positions or against the market.
Large Account Management
Once you've amassed more than $100,000 in trading capital in your short term investment
account, you'll need to use advanced tactics for putting that capital to work.
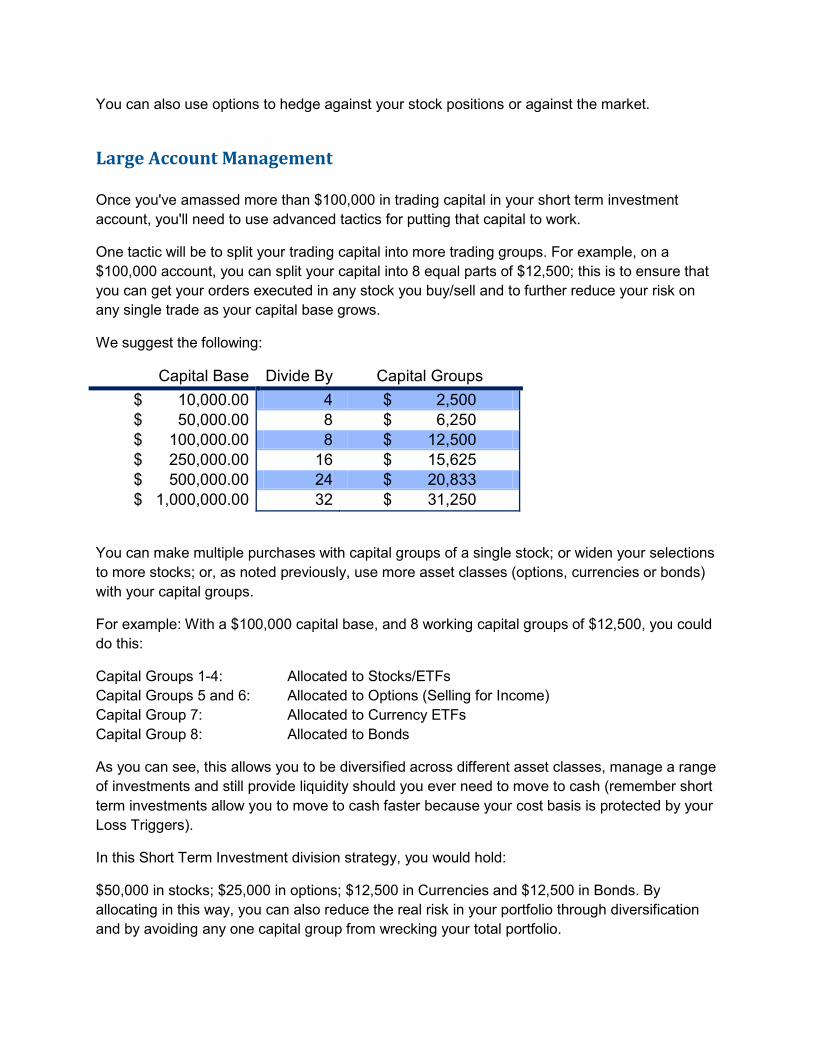
One tactic will be to split your trading capital into more trading groups. For example, on a
$100,000 account, you can split your capital into 8 equal parts of $12,500; this is to ensure that
you can get your orders executed in any stock you buy/sell and to further reduce your risk on
any single trade as your capital base grows.
We suggest the following:
Capital Base Divide By Capital Groups
$ 10,000.00 4 $ 2,500
$ 50,000.00 8 $ 6,250
$ 100,000.00 8 $ 12,500
$ 250,000.00 16 $ 15,625
$ 500,000.00 24 $ 20,833
$ 1,000,000.00 32 $ 31,250
You can make multiple purchases with capital groups of a single stock; or widen your selections
to more stocks; or, as noted previously, use more asset classes (options, currencies or bonds)
with your capital groups.
For example: With a $100,000 capital base, and 8 working capital groups of $12,500, you could
do this:
Capital Groups 1-4: Allocated to Stocks/ETFs
Capital Groups 5 and 6: Allocated to Options (Selling for Income)
Capital Group 7: Allocated to Currency ETFs
Capital Group 8: Allocated to Bonds
As you can see, this allows you to be diversified across different asset classes, manage a range
of investments and still provide liquidity should you ever need to move to cash (remember short
term investments allow you to move to cash faster because your cost basis is protected by your
Loss Triggers).
In this Short Term Investment division strategy, you would hold:
$50,000 in stocks; $25,000 in options; $12,500 in Currencies and $12,500 in Bonds. By
allocating in this way, you can also reduce the real risk in your portfolio through diversification
and by avoiding any one capital group from wrecking your total portfolio.
Measuring Your Progress
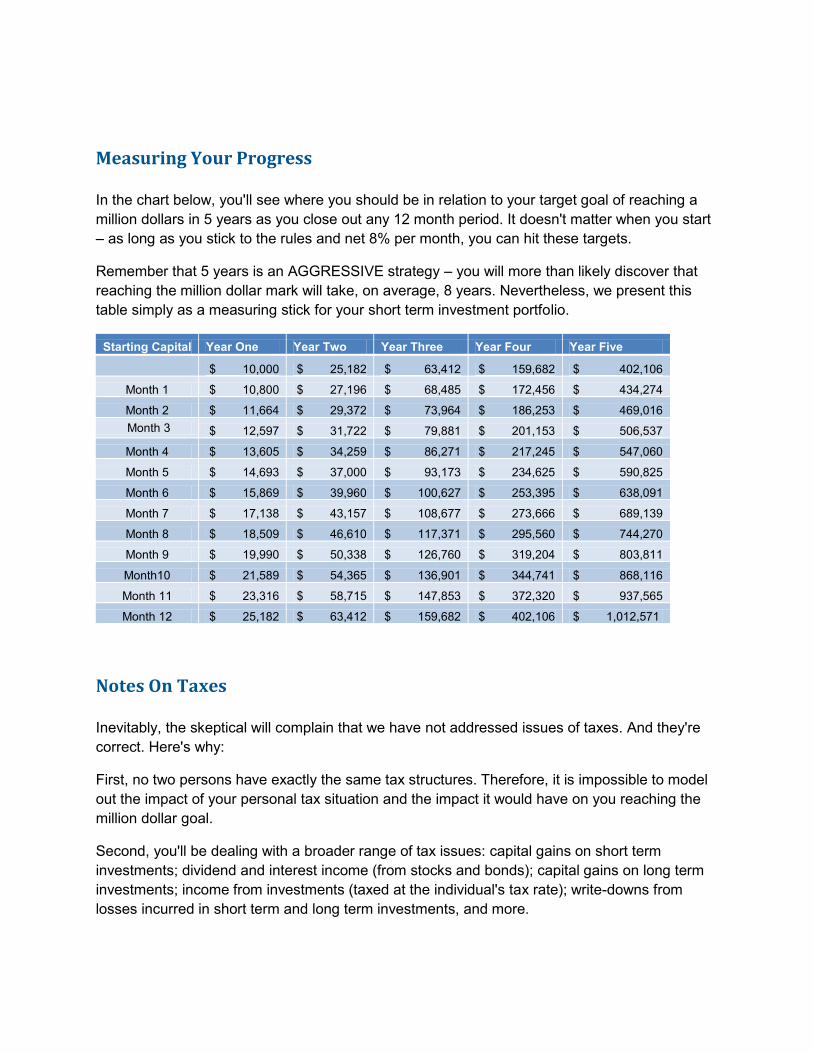
In the chart below, you'll see where you should be in relation to your target goal of reaching a
million dollars in 5 years as you close out any 12 month period. It doesn't matter when you start
– as long as you stick to the rules and net 8% per month, you can hit these targets.
Remember that 5 years is an AGGRESSIVE strategy – you will more than likely discover that
reaching the million dollar mark will take, on average, 8 years. Nevertheless, we present this
table simply as a measuring stick for your short term investment portfolio.
Starting Capital Year One Year Two Year Three Year Four Year Five
$ 10,000 $ 25,182 $ 63,412 $ 159,682 $ 402,106
Month 1 $ 10,800 $ 27,196 $ 68,485 $ 172,456 $ 434,274
Month 2 $ 11,664 $ 29,372 $ 73,964 $ 186,253 $ 469,016
Month 3 $ 12,597 $ 31,722 $ 79,881 $ 201,153 $ 506,537
Month 4 $ 13,605 $ 34,259 $ 86,271 $ 217,245 $ 547,060
Month 5 $ 14,693 $ 37,000 $ 93,173 $ 234,625 $ 590,825
Month 6 $ 15,869 $ 39,960 $ 100,627 $ 253,395 $ 638,091
Month 7 $ 17,138 $ 43,157 $ 108,677 $ 273,666 $ 689,139
Month 8 $ 18,509 $ 46,610 $ 117,371 $ 295,560 $ 744,270
Month 9 $ 19,990 $ 50,338 $ 126,760 $ 319,204 $ 803,811
Month10 $ 21,589 $ 54,365 $ 136,901 $ 344,741 $ 868,116
Month 11 $ 23,316 $ 58,715 $ 147,853 $ 372,320 $ 937,565
Month 12 $ 25,182 $ 63,412 $ 159,682 $ 402,106 $ 1,012,571
Notes On Taxes
Inevitably, the skeptical will complain that we have not addressed issues of taxes. And they're
correct. Here's why:
First, no two persons have exactly the same tax structures. Therefore, it is impossible to model
out the impact of your personal tax situation and the impact it would have on you reaching the
million dollar goal.
Second, you'll be dealing with a broader range of tax issues: capital gains on short term
investments; dividend and interest income (from stocks and bonds); capital gains on long term
investments; income from investments (taxed at the individual's tax rate); write-downs from
losses incurred in short term and long term investments, and more.
That's the problem with trying to forecast taxes – it's too broad to accurately apply; as well,
given the current political environment, it's impossible to predict whether Congress will reinstate
or allow to die the Bush Tax Cuts; raise capital gains taxes; cut capital gains taxes, etc.
Suffice it to say: If you follow this strategy, your money will grow very fast and you will likely face
tax issues. Taxes will not significantly impede your progress – it MAY delay your timeline in
reaching your million dollar goal by a few months to a year. But at the end of the day, if you're
making a decision NOT to grow your portfolio by using Time Diversification simply because you
might have to pay taxes, you will fall behind and fail to reach your financial goals.
Never, ever make an investing decision, or fail to make one, simply because you might owe
taxes to your respective federal or state government. Get qualified tax investment advice and
understand what taxes you may be liable for – and be sure to get corresponding write-off advice
as well.
And lastly, please make sure that you use or take advantage of tax deferred accounts – that's
what they're there for – to help you avoid taxes until you NEED the income (and at that,
lowering your tax exposure, potentially).
Thoughts on Probability and Stock Selection
We’ve mentioned the concept of probability when trading, and we used the horse race example
to highlight the notion of covering the field with your bets. One thing for certain is that when you
trade, you are going to be right sometimes, and wrong other times.
When you are wrong, try not to look at it as a failure of judgment. Rather, look at it as a
consequence of the odds working against you. Conversely, when you are right, avoid the
temptation to think of your judgment as the reason you came out on top.
Rather, also look at it as a case of the odds working in your favor, removing emotion from the
process.
Now, this is in no way an attempt to absolve you of the responsibility of trying to select the best
stocks out there. It is, however, a simple realization that nobody can predict the future when
trading. If we could, we would all be billionaires, and nobody would need a service like the
Millionaire Blueprint.
Once you accept the fact of your infallibility with respect to your stock selections, you can
ruthlessly and objectively employ trading tools such as sell limit orders and stop losses.
Another way to look at the notion of probability in stock trading is to use the analogy of rolling
the dice. This is, in essence, a probability proposition.
When you roll the dice, you have no way of knowing which numbers will come up.
When you buy stocks, you also have no real way of knowing what the outcome will be.

Fortunately, by maximizing your bets when your number comes up, and by minimizing your
losses when that number you’ve bet on fails to come up, you can beat the game without having
to roll a winning number every time.
Of course, there’s more to putting the odds in your favor than just successfully managing your
trading accounts in accordance with the 8:5 rules.
When selecting stocks, you must do so by using various techniques, including sound technical
and fundamental analysis. You also have to make sure your timing is right, and you have to
make sure you’re not swimming against the general market tide.
Yet even if you think you’ve figured out all of the variables, the dice may still end up on a
number you haven’t placed a bet on. Just remember that it’s okay, as long as you have the tools
in place to limit downside and maximize gains when you’re right.
The Millionaire Blueprint Program
In our discussions with investors and from surveys we've conducted, one important point we
learned was how difficult it can be for investors to find the right stocks to use with this Short
Term Investment plan.
That's why we created the Millionaire Blueprint Program – it contains everything you need to
combine the right stocks with the right plan to grow your portfolio with consistent, realistic gains,
month after month.
The Millionaire Blueprint Program provides weekly stock selections to its exclusive group of
investors based on the probability of reaching that 8% target price (or better). Millionaire
Blueprint Members benefit from the Three R's of the Millionaire Blueprint Program:
Research, Recommendations and Rules
Market Research and Weekly Stock Recommendations are made by the Lead Investor, Rick
Pendergraft and by Main Street Investor editor John Hutchinson. Together they offer over 40
years of stock market experience to members of the program.
Each Sunday, Rick and John provide a weekly report to members which includes an overall
assessment of the stock market, and between 1 and 4 four stock selections each week. The
report is simple to read and easy to execute and contains the top stock selections to be used
with the Millionaire Blueprint Rules.
Stock selections include WHEN TO BUY and what Prices to Buy a stock at, specific Profit
Targets and Stop Losses. Essentially, Rick and John do all the work for members; all members
need to do is enter their orders, set their profit targets and stop losses and go on about their
day.
But how do we select the right stocks?

We created a unique, proprietary program that uses both fundamental and technical analysis to
scour the stock market each week to find those stocks that have the best opportunity for short
term gains.
Remember that we're looking for stocks that will appreciate 8% or more in a time frame of a few
days to a few weeks. That requires using BOTH technical and fundamental analysis to eliminate
the usual "suspects" and get down to real "prospects" for gains.
Overall, we employ specific technical indicators and fundamental data points to assess stocks;
and while we use our model on a daily basis, we wait until the end of each week to find those
stocks that have the odds in our favor.
As Rick would say, fundamentals may tell you what to buy, but technical indicators tell you
WHEN to buy! And that's why we use a combination of both methods of analysis.
As well, we've recently introduced a unique 'barometer' which quantifies Market Sentiment. You
may not have heard of or paid much attention to Sentiment, so we'll brief you here on its
importance.
Market Sentiment tells us when the odds favor buyers over sellers or sellers over buyers. This is
critical, especially when considering whether a stock has the probability of going up in price.
Consider it this way: if all investors are bullish on a stock, who is left to buy the stock? Or, stated
another way, if there are no sellers left, then there are only buyers.
Stocks go up in price based on having more buyers than sellers – that may sound like a
simplification, but understand why: It is fundamental analysis combined with technical analysis
which explain WHY there are more buyers or sellers for a specific stock.
But it is Sentiment – overall direction – which tells us whether there are more buyers or more
sellers in the market.
This three-pronged approach to stock selection gives investors in the Millionaire Blueprint
Program an advantage by knowing when it's time to be "In" the market, and when it may be time
to be "Out" or "Contrarian".
Some of the tools we use to quantify Sentiment include the Investors Intelligence Advisors'
Sentiment Report, which measures bullishness or bearishness of more than 100 Investment
newsletter editors; this is a terrific contrarian indicator – when overly bullish, we've found the
market tends to sell-off; when overly bearish, it's a smart time to buy stocks.
We also use the Chicago Board of Options Exchange (CBOE) Equity Put/Call Ratio. This is yet
another contrarian indicator: the higher the ratio, the greater the pessimism in the market; the
lower the ratio, the greater the optimism. We use this as another tool in determining whether
probability for the market favors a price rise or fall.
We also incorporate the Short Interest Ratio for an individual stock. This helps identify those
stocks with higher short interest, which is the number of shares sold short expressed as a ratio

to the average daily volume. Anything above 5.0 sets the stage for a possible "short covering"
rally which can further push up the price of a stock during a technical or fundamental rally.
Together, it is the combination of Sentiment, Fundamental and Technical Analysis that gives
Millionaire Blueprint members their advantage in the markets.
Final Thoughts
We’ve covered a lot of ground in the Millionaire Blueprint, and we hope you’ve come away with
a good sense of what the plan is all about, and how the trading and portfolio management
techniques we use can help you accumulate a lot of wealth over a relatively short time.
If you simply do nothing else but execute the 8:5 trading rules in your own portfolio we’ve
succeeded in helping you evolve.
With these simple strategies for managing your money, protecting your downside, capturing
gains and diversifying risk, you effectively have the plans needed to build a sturdy financial
structure.
The next phase of construction is all picking the right materials for the job and that involves the
right stocks to use with the Millionaire Blueprint Rules.
Thank you for reading, and we wish you Godspeed in your future trades.
About Rick Pendergraft Rick has been involved with the stock market for over 25 years—studying, trading, writing about it and performing investment management. He started his investment publishing career at Schaeffer's Investment Research where he thrived in his new position and twice received the award for "Top Trader." Rick continued his career at Agora Publishing helping launch the investment
division Investor's Daily Edge. At Agora he narrowed his focus specifically to Exchange Traded Funds. Since his days at Schaeffer, he saw the potential of ETFs and the massive growth in terms of offerings as well as interest from investors. The opportunities within the ETF world are endless. Rick felt so strongly about ETFs that he launched PRO Investment Management which focuses on using ETFs to manage client portfolios. Its objective is to protect and grow client investment portfolios by using a blend of equity and fixed income ETFs. The goal is to provide a steady growth rate while trying to avoid big setbacks like we saw in the overall market from 2000-2002 and again in 2007-2009. Rick has developed a loyal following of readers who are grateful for his timely warnings and profitable advice. He is widely recognized as a market expert and has been quoted by Reuters, BusinessWeek, Forbes, USA Today, the New York Times, and the Washington Post. He has also appeared on CNBC, Bloomberg and Fox Business News.
About John Hutchinson John has been involved with the stock and Forex markets for over 12 years, managing investments, studying portfolio models and teaching technical and fundamental analysis techniques. John is a Managing Partner in Traders Reserve and the editor of Main Street Investor (www.mainstreetinvestor.com). He is the developer of the Millionaire Blueprint and the 8:5 Rules as well as the Time Diversification Portfolio Strategy.
Main Street Investor | Traders Reserve Copyright
Main Street Investor and its website, mainstreetinvestor.com are both properties of Traders
Reserve, LLC. All material in this report is, unless otherwise stated, the property of Traders
Reserve, LLC. Copyright and other intellectual property laws protect these materials.
Reproduction or retransmission of the materials, in whole or in part, in any manner, without the
prior written consent of the copyright holder, is a violation of copyright law.
A single copy of the materials available through this course may be made, solely for personal,
noncommercial use. Individuals must preserve any copyright or other notices contained in or
associated with them. Users may not distribute such copies to others, whether or not in
electronic form, whether or not for a charge or other consideration, without prior written consent
of the copyright holder of the materials. Contact information for requests for permission to
reproduce or distribute materials available through this report is listed below: