The Milliman RISE™ Score An easy way to measure retirement ...
11
INTRODUCING THE RISE SCORE™ Milliman has developed the Retirement Income Security Evaluation (RISE) Score™ to provide institutions, financial planners, and their customers with a ubiquitous, easy to understand measure of income security in retirement. RISE is modeled after the idea of a credit score, giving it instant familiarity to any consumer who has applied for a loan or a credit card. It uses the latest stochastic modeling techniques to provide a realistic estimation of results across a variety of circumstances. It takes into account the many guaranteed income options available to workers today. And it is both readily tangible and easy to use, with results that anyone can understand yet with the richness to make nuanced adjustments depending on target goals. While it is not a substitute for in-depth planning conversations, it is a more realistic starting point. We see RISE as additive to popular planning software tools, not a replacement. People who require more holistic, goals-based planning benefit greatly from comprehensive plans. QUANTIFYING RETIREMENT SECURITY: THE NEED FOR A NEW APPROACH Saving for a secure retirement is one of the greatest challenges facing workers in the United States today. According to the Society of Actuaries Longevity Illustrator, 2 a 65-year- old male (average health and non-smoker) has a 50% chance to live to age 85. A 65-year- old female (average health and non-smoker) has a 50% chance to live to age 88. With ever longer time horizons for retirement, workers are faced with many complex questions. How much do they need to save? What kinds of investments should they own? At what age should they retire? What income will they need for their lifestyle? Many of these questions require not only an honest appraisal of wants and needs, but also beg for a ubiquitous The Milliman RISE™ Score 1 : An easy way to measure retirement income security AUTHORS Lupco Blazeski Software Developer, Milliman Financial Risk Management [email protected] Keith Lockwood Senior Director, Milliman Financial Risk Management [email protected] Suzanne Norman CIMA® Principal, Milliman Financial Risk Management [email protected] Peter Sun, CFA, FSA, MAAA Consulting Actuary, Milliman Financial Risk Management [email protected]
Transcript of The Milliman RISE™ Score An easy way to measure retirement ...
INTRODUCING THE RISE SCORE™
Milliman has developed the Retirement Income Security Evaluation (RISE) Score™ to provide institutions, financial planners, and their customers with a ubiquitous, easy to understand measure of income security in retirement. RISE is modeled after the idea of a credit score, giving it instant familiarity to any consumer who has applied for a loan or a credit card. It uses the latest stochastic modeling techniques to provide a realistic estimation of results across a variety of circumstances. It takes into account the many guaranteed income options available to workers today. And it is both readily tangible and easy to use, with results that anyone can understand yet with the richness to make nuanced adjustments depending on target goals. While it is not a substitute for in-depth planning conversations, it is a more realistic starting point. We see RISE as additive to popular planning software tools, not a replacement. People who require more holistic, goals-based planning benefit greatly from comprehensive plans.
QUANTIFYING RETIREMENT SECURITY: THE NEED FOR A NEW APPROACH
Saving for a secure retirement is one of the greatest challenges facing workers in the United States today. According to the Society of Actuaries Longevity Illustrator,2 a 65-year-old male (average health and non-smoker) has a 50% chance to live to age 85. A 65-year-old female (average health and non-smoker) has a 50% chance to live to age 88. With ever longer time horizons for retirement, workers are faced with many complex questions. How much do they need to save? What kinds of investments should they own? At what age should they retire? What income will they need for their lifestyle? Many of these questions require not only an honest appraisal of wants and needs, but also beg for a ubiquitous
The Milliman RISE™ Score1: An easy way to measure retirement income security
AUTHORS
Lupco BlazeskiSoftware Developer, Milliman Financial Risk [email protected]
Keith LockwoodSenior Director, Milliman Financial Risk [email protected]
Suzanne Norman CIMA®Principal, Milliman Financial Risk [email protected]
Peter Sun, CFA, FSA, MAAA Consulting Actuary, Milliman Financial Risk Management [email protected]

2
MILLIMAN WHITE PAPER
metric that identifies, intuitively, if people are on track with their desired retirement income. Much like a credit score will tell lenders about credit worthiness, a RISE Score can indicate to savers and financial professionals what level of readiness someone has for their specified retirement income needs.
Goal setting is critical for this stage of life but, sadly, due to the complexities of inflation, economic cycles, investment returns, healthcare costs, and basic financial literacy, many people avoid taking the first critical step to check on their readiness. We believe we have found a way to make this easier and, therefore, more likely to be used. Since RISE was launched in early 2018, we have run almost one million proposals, delivering on our mission to help our clients protect the health and financial well-being of people everywhere. In addition, we have included the RISE Score to enhance financial readiness for participants on Milliman’s own retirement plan administration platform at MillimanBenefits.com.
Many tools and methodologies have been created to solve this problem (Exhibit A). Some use probability of success (e.g., 90% chance of success at least $1 remains at a determined date). However, many of these use simplifying assumptions and can often fail to consider the interrelated nature of many of the factors influencing retirement security. They may take a stochastic approach using Monte Carlo simulations that are more nuanced for some variables (such as returns of different asset classes), while taking a simpler deterministic approach for other variables (such as longevity and inflation). And they may only take into consideration a limited set of investment vehicles, often excluding lifetime income solution products such as the multitude of annuity options available to today’s consumer. As an independent actuarial consulting firm, we felt it was time to provide a universal FinTech engine that encompasses more nuanced calculations related to longevity and inflation.
This last point is particularly important given the impact of the Setting Every Community Up for Retirement Enhancement (SECURE) Act.3 The act removes barriers to allowing defined
contribution plans to include lifetime income options. In particular, it reduces or eliminates a plan’s legal liability if an annuity writer does not fulfill its fiduciary responsibilities. Guaranteed income products can be an attractive choice for those seeking to avoid running out of income in retirement. However, these products can be complex and, thanks to market innovation, are now available in a wide variety of configurations. Helping consumers understand the potential lifelong impact of including guaranteed income products, such as annuities, has become more important than ever.
While financial professionals and institutions often have sophisticated retirement planning tools at their disposal, they may struggle to translate the results they obtain into a form that consumers can easily understand. The other key challenge is, even if a planning tool is available, less than three out of 10 Americans actually have a written plan.4 If the outputs of a tool muddy the waters even further, they are of limited utility.
Clearly, there is a need for a tool that takes into consideration the many complex factors that contribute to retirement security or insecurity. This tool should use advanced, modern modeling techniques and, at the same time, deliver a result that is easy to comprehend for consumers yet offers financial professional planners with a dependable basis for a more in-depth conversation.
CASE STUDIES
In this section, we explore three case studies that demonstrate how the RISE Score changes for sample clients when changes are made to the following: income, retirement age, saving rate, expenses, asset allocation, and an annuity allocation. Baseline assumptions assume an average portfolio return of 5.09%, average inflation of 2.48%, and a life expectancy of 88 years in all cases, which reflect recent economic conditions.
The three cases cover a young saver, a couple nearing retirement age, and a recently retired.
EXHIBIT APlanning model Input/output Limitation
Monte Carlo simulation
Stochastic modeling with numerous inputs (e.g., 1,000 market returns for different asset classes) to obtain a distribution of results. In financial planning, often displayed as a “probability of success.”
Output only as good as the input. Also, depending on the model chosen or how output is aggregated, may not be a good predictor of left tail markets events. Binary answer to, “Do I have enough money?”
Replacement ratio Used to identify the percentage of pre-retirement income needed to produce retirement income. Rule of thumb- less than 100%.
Retirement spending can be dynamic versus static. Clients may overspend or underspend; they may conserve their savings during market turmoil or have more perceived excess savings income during market booms.
Reliance rate Percentage of your retirement income coming from your savings to help measure your sensitivity to your retirement strategy.
Limited ability to include guaranteed income sources; pension, social security, annuity income, etc.
Withdrawal rate Percentage of your overall savings used to generate income. Rule of thumb 3% to 4%.
A static number could be negatively affected by sequence of returns risk and is contingent on how other risks, such as longevity and inflation, unfold over time for a particular investor.

3
MILLIMAN WHITE PAPER
Case study YOUNG SAVER
In this case study, we examine the following scenario for a sample client. The inputs below are used to generate a baseline RISE Score. We then incorporate changes to see how this affects the score, and ultimately the perceived retirement security for the sample client.
Sex Male
Current Age 25
Health Excellent
Retirement/Withdrawal age 65
Social Security claim age 67
Current savings $25,000
Asset allocation Aggressive (78% equity/22% fixed income)
Annual savings contribution $10,169
Income sources in retirement
Social Security benefit $17,520 (inflation adjusted)
Portfolio withdrawals
Expenses
Annual basic living expenses in retirement
$45,756 (projected with non-medical inflation)
Annual basic medical expenses in retirement
$6,000 (projected with medical inflation)
RISE resultsThe RISE Score for the “Young saver” baseline portfolio is 531 (Poor) and represents below average progress toward meeting the stated retirement goals.
The expected income in retirement when we include portfolio withdrawals should cover 81% of his expenses on average in all modeled scenarios and 48% of expenses in the worst 10% of modeled scenarios.
Changes to the baseline portfolio (Exhibit B) can help the “Young saver” improve his score and explore ways to better meet his income objectives. By combining three things-- delaying retirement to age 70, modifying his asset allocation to very aggressive, and increasing his savings by $848 per month-- the RISE Score becomes 748 (very good). Assumptions underlying the 'improved score' include: an average portfolio return of 5.09%, average inflation of 2.48%, and a life expectancy of 89 years.
With an improved score of 748, the expected income in retirement when we include portfolio withdrawals should cover 98% of expenses in average scenarios and 81% of expenses in the worst 10% of possible scenarios.
EXHIBIT B: YOUNG SAVER - WAYS TO IMPROVE BASELINE RISE SCORE
Baseline RISE Score
Annuity Allocation
Due to the young age, adding an annuity does not increase the baseline score.
531
Reduce Expenses
Reducing expected retirement expenses by $381/month can help income and savings last longer, increasing the score by 26 points from the baseline score.
557
Asset Allocation
Adjusting your current asset allocations to a very aggressive (100% equity) profile could help savings grow, increasing the score by 38 points from the baseline score.
569
Delay Retirement
Delaying your retirement by as little as five years (age 72) could help you save more, rely less on savings, and improve the score by 68 points from the baseline score.
599
Additional Income
Earning an additional $500/month, working part-time in retirement could help keep you busy, while covering a portion of expenses, increases the score by 68 points from the baseline score.
599
Savings
Saving an additional $848/month, for example, contributing the maximum to a 401k with a match, increases the score by 145 points from the baseline score.
676
Adjust Asset Allocations
+
Delay Retirement
+
Savings
Three changes:*
• Very aggressive asset allocations
• Delaying retirement by five years
• Increasing savings by $848/month
* Point increases/decreases when combining may have cross effects if interrelated and thus not additive.
748

4
MILLIMAN WHITE PAPER
Case study COUPLE NEARING RETIREMENT AGE
In this case study, we examine the following scenario for sample clients. The inputs below are used to generate a baseline RISE Score. We then incorporate changes to see how this affects the score, and ultimately the perceived retirement security for the sample clients.
Wife Husband
Current Age 55 55
Retirement/Withdrawal age 65 65
Current savings $500,000
Asset allocation Moderately aggressive (65% equity/35% fixed income)
Annual savings contribution $26,592 $0
Income sources in retirement
Current annual Social Security benefit
$30,000 (inflation adjusted)
$15,000 (inflation adjusted)
Portfolio withdrawals
Expenses
Current annual basic living expenses
$45,756 (projected with non-medical inflation)
Reduced current annual basic living expenses $500 (after death of spouse)
Current annual basic medical expenses
$12,000 (projected with medical inflation)
Reduced current annual medical expenses $500 (after death of spouse)
RISE resultsThe RISE Score for the “Couple nearing retirement” baseline portfolio is 623 (fair) and represents average progress toward meeting their stated retirement goals.
The expected income in retirement when we include portfolio withdrawals should cover 86% of expenses on average in all modeled scenarios and 67% of expenses in the worst 10% of modeled scenarios.
Changes to the baseline portfolio (Exhibit C) can help the “Couple nearing retirement” improve their score and explore ways to better meet their income objectives. By combining three things-- modifying asset allocation to aggressive, allocating 20% of their savings to an annuity, and delaying retirement to age 67-- the RISE Score becomes 706 (very good). Assumptions underlying this 'improved score' include: an average portfolio return of 5.09%, average inflation of 2.48%, and a life expectancy of 89 years (female) and 87 (male).
With an improved score of 706, the expected income in retirement when we include portfolio withdrawals should cover 94% of expenses in average scenarios and 77% of expenses in the worst 10% of possible scenarios.
EXHIBIT C: COUPLE NEARING RETIREMENT - WAYS TO IMPROVE BASELINE RISE SCORE
Baseline RISE Score
Asset Allocation
Adjusting current asset allocations to an aggressive (78% equity) profile could help you and your spouse's savings grow, increasing score by 16 points from the baseline score.
639
Annuity Allocation
Allocating 20% to an annuity increases score by 18 points from the baseline score,
641
Savings
Saving an additional $600/month, possibly in a spousal IRA, increases the score by 20 points from the baseline score.
643
Reduce Expenses
Living a little frugally and reducing expected retirement expenses by $481/month will help income and savings go a long way, increasing score by 44 points from the baseline score.
667
Delay Retirement
Delaying you and your spouse's retirement by as little as two years could help you save more, rely less on savings, and improve your score by 50 points from the baseline score.
Delaying you and your spouse's retirement by five years could help you save more, rely less on savings, and improve your score by 87 points from the baseline score.
673
710
Additional Income
Earning an additional $500/month each, working part-time in retirement could help keep you and your spouse busy, while covering a portion of your expenses, increasing score by 95 points from the baseline score.
718
Adjust Asset Allocations
+
Adjust Asset Allocations
+
Delay Retirement
Three changes:*
• Saving additional $600/month
• 20% annuity allocation
• Delaying retirement by two years
* Point increases/decreases when combining may have cross effects if interrelated and thus not additive.
706

5
MILLIMAN WHITE PAPER
Case study RECENTLY RETIRED
In this case study, we examine the following scenario for a sample client. The inputs below are used to generate a baseline RISE Score. We then incorporate changes to see how this affects the score, and ultimately the perceived retirement security for the sample client.
Current Age 65
Retirement/Withdrawal age 65
Current savings $800,000
Asset allocation Moderate (53% equity/47% fixed income)
Income sources in retirement
Current annual Social Security benefit $30,000 (inflation adjusted)
Portfolio withdrawals
Expenses
Current annual basic living expenses
$47,756 (projected with non-medical inflation)
Current annual basic medical expenses
$6,000 (projected with medical inflation)
RISE resultsThe RISE Score for the “Recently retired” baseline portfolio is 640 (fair) and represents below average progress toward meeting the stated retirement goals.
The expected income in retirement when we include portfolio withdrawals should cover 85% of expenses on average in all modeled scenarios and 71% of expenses in the worst 10% of modeled scenarios.
Changes to the baseline portfolio (Exhibit D) can help the “Recently retired” improve her score and explore ways to better meet her income objectives. By combining three things-- additional $500 per month income in retirement, a 20% allocation to an annuity, and modifying asset allocation to moderately aggressive-- the RISE Score becomes 745 (very good). Assumptions underlying this 'improved score' include: an average portfolio return of 5.09%, average inflation of 2.48%, and a life expectancy of 88 years.
With an improved score of 745, the expected income in retirement when we include portfolio withdrawals should cover 94% of expenses in average scenarios and 84% of expenses in the worst 10% of possible scenarios.
EXHIBIT D: RECENTLY RETIRED INDIVIDUAL - WAYS TO IMPROVE BASELINE RISE SCORE
Baseline RISE Score
Additional Income
Earning an additional $500/month, working part-time in retirement could help keep you busy, while covering a portion of your expenses, increasing your score by 78 points.
718
Delay Retirement
Returning to work for as little as five years could help you save more, rely less on your savings, and improve your score by 65 points.
705
Reduce Expenses
Living a little frugally and reducing your expected retirement expenses by $381/month will help your income and savings go a long way, increasing your score by 59 points.
699
Annuity Allocation
Allocating 20% to an annuity increases score by 36 points from the baseline score.
676
Adjust Asset Allocation
Adjusting your current asset allocations to an aggressive (65% equity) profile could help your savings grow, increasing your score by 11 points.
659
Additional Income
+
Annuity Allocation
+
Adjust Asset Allocation
Three changes:*
• Earning an additional $500/month
• 20% annuity allocation
• Moderately aggressive asset allocation
* Point increases/decreases when combining may have cross effects if interrelated and thus not additive.
745

6
MILLIMAN WHITE PAPER
CONCLUSION
In a world where retirement uncertainty continues to grow—and where individuals are increasingly expected to provide for their own post-working income—solutions that provide people with a clear analysis of their situation and goals are desperately needed. The Milliman RISE score combines advanced, modern modeling techniques, rich data inputs, and a broad view of income options to deliver one simple metric that can serve as the starting point for better understanding as well as more effective conversations about retirement planning. Please visit www.therisescore.com to receive your RISE Score today. Participants with employer retirement plans administered by Milliman may access their RISE Score by signing into their account at MillimanBenefits.com.
APPENDIX I - THE RISE INPUTS
The purpose of the RISE Score is to provide consumers with a single, intuitive measure of income security in retirement—essentially, a credit score for retirement. A RISE Score can help assess how well their retirement portfolio will cover basic living expenses and healthcare costs and demonstrate how changing parameters related to saving and investing can affect expected retirement income. RISE begins by incorporating a wide range of information relevant to retirement savings and spending. This data can include:
• Annual compensation
• Employer-provided pension and savings plan information
• Current rate of contribution (as a percentage of annual compensation) to employer-provided retirement savings plans
• Income from rent, sales, or part-time work in retirement
• Data from savings, investment, and retirement accounts that will provide income in the user's retirement
• Current rate of contribution to other savings, investment, and retirement accounts
The model is based on a number of customizable assumptions. The following are examples in current use (more detail can be found in the section “How RISE works”):
• Retirement income needs provided by the individual, with estimates calculated from projected compensation and national average research on needs.
• Whether or not the individual is covered by Social Security and 100% of the Social Security benefit (based on current law) is available at retirement.
• Taxes (such as state and federal income taxes, taxes on capital gains, property taxes, etc.) are estimated through an effective tax rate in the current consumer-oriented version available on the Alliance for Lifetime Income website.5
• Knowledge of past investment performance over long periods is useful in planning for the future. Historical market returns are provided to show the history of market fluctuations based on a given investment allocation of stocks/bonds and cash.
• A distribution of life expectancies given the user's current age and retirement age is used to project the retirement portfolio over a number of longevity simulations rather than a deterministic longevity projection (e.g., arbitrary age at death)
The goal is to determine if the user's accumulated wealth, together with a pension, Social Security benefits, and other retirement income, is likely to generate enough income during retirement to cover anticipated retirement expenses. The results are aggregated and blended to produce an overall average case and an average of the worst cases to determine the final RISE score. In keeping with the objective of producing a result similar to a credit score, the tool outputs a number from zero to 850.
Financial professionals can use it as a way to diagnose conversations and shape expectations as well as to contextualize the more sophisticated results that come from traditional planning tools. Additionally, a RISE Application Programing Interface (API) is available and can integrate with any financial platform, including managed accounts (e.g., 401(k) overlays) as well as “robo-investing” automated allocation solutions.
APPENDIX II - HOW RISE WORKS
Retirement income and wealth values are estimated using the sophisticated modeling underpinning the RISE Score. This modeling6 includes a number of key features:
• A proprietary stochastic simulation generator, which models interest rates, inflation, equities, and fixed income returns holistically using Milliman’s own capital market assumptions and modeling methodology for each asset class. Each simulation represents a projected future market path.
• The stochastic simulation generator also incorporates stochastic inflation rather than a single deterministic inflation rate. Separately projected medical and non-medical inflation is more realistic when generated stochastically, rather than deterministically, such that inflation will not unreasonably be over- or under-representative in any given simulation along a future path. It is projected in concert with other asset class returns.
• A distribution of longevity simulations7 (Exhibit E) is used rather than a single, deterministic age used by many tools

7
MILLIMAN WHITE PAPER
that select an age far enough out to make sure assets do not deplete to zero. The longevity simulations are based on a mortality table and can also reflect different health statuses for different users.
• A sophisticated, dynamic withdrawal algorithm determines the amount a retiree would withdraw each year from their portfolio. Considerations include age at the time of withdrawal, the level of their current portfolio, recent market performance, inflation, and expected future expenses. This process is designed to reflect how a retiree would typically conserve savings during retirement. In other words, they may not always withdraw the maximum amount needed to cover expenses in a given year if it meant they would not have enough to cover expenses in the future.
• The dynamic withdrawal algorithm also captures different health statuses if indicated by the user because the algorithm considers current age and standard deviation of mortality.
• Incorporates annuity products, specifically those that provide lifetime income such as variable annuities, fixed indexed annuities, and deferred and single premium immediate annuities.
• Contemporary cloud computing technology to project and evaluate outcomes under tens of thousands of scenarios in a matter of seconds.
EXHIBIT E: MORTALITY – GOOD NEWS/BAD NEWS
Once the user enters all of their relevant savings and spending information, the engine then estimates how much wealth this portfolio and their current portfolio will accumulate from now until their retirement date by running through the model components described above. Along each longevity simulation, there is a simulation step which uses 1,000 wealth projections (incorporating market returns on assets and inflation on expenses and any inflation-adjusted income), each being a real world projection that considers the user's balance and savings levels, the randomness of the economy, the markets, and the
interrelated behavior of the various types of investments. Each of these simulation steps is then run through a number of longevity simulations (a representative distribution of the user's and their spouse’s/partner's lifetime) to develop the final projections; in total the projections are run through 10,000 to 25,000 different investment return, inflation, and longevity simulations.
The engine will use the balance at retirement and calculate the total income that can be generated from all retirement income sources (retirement savings withdrawal, Social Security, pension, and other retirement income given the expenses indicated by the user). Higher scores result when a user’s retirement portfolio can produce a steady income stream (from all sources) that grows with inflation over time to cover expenses in retirement. The amount a user can withdraw from their savings each year will be based on a dynamic withdrawal, where a 100% dynamic withdrawal adjustment results in a withdrawal equal to the total target income less the total of Social Security and pension benefits plus any other retirement income for that year. The dynamic withdrawal adjustment will be less than 100% where there are market downturns along a specific simulation path to mimic savings conservation (i.e., to ensure that the portfolio will provide a steady income stream over a lifetime by reducing expenditures in fewer years).
The RISE Score calculation is composed of two “subscores:” an average, which takes into account all simulated scenarios, and an adverse representing the average of the worst nth percentile, which considers the client’s portfolio only under adverse conditions. The purpose of capturing the adverse scenario score is to capture a “personal reserve” for an individual’s retirement balance sheet-- a conceptual rainy-day fund quantified into the score. Large financial institutions have the benefit of being able to diversify their risks across business lines, products, and customers, while individual savers do not have such an advantage. The need to capture a “personal reserve” is thus a necessity in assessing retirement security.
This adverse scenario score defaults to the average of the worst 10% of all scenarios (this can be designed to represent different risk tolerance levels). An individual with a higher risk tolerance would suggest a lower level of “personal reserve” and thus a higher adverse scenario score. For example, the average of the worst 30% of scenarios would lead to a higher overall RISE Score. An individual with a lower risk tolerance, on the other hand, would have a lower adverse scenario score (say, the worst 5% of scenarios), thus leading to a lower overall RISE Score. Put simply, risk tolerance will have an impact on the RISE Score and improvement in either or both of the subscores improves the RISE Score, beyond just decisions regarding asset allocations, savings behavior, and product/income choices, indicating greater retirement security.
8
MILLIMAN WHITE PAPER
• Delay retirement age
• Increase in retirement assets (current savings amount) for the same overall asset allocation
• Decrease in annual expenses
• Increase in other income items (Social Security, pension, annuity income, etc.)
• Change in asset allocation such that there is an increase in net return on assets for a given unit of market risk
• Change in asset allocation and lifetime income solution allocation such that there is an increase in income generated across all longevity scenarios for a given unit of market risk
The RISE Score model has limitations and does not consider every possible concern that a user or financial professional may ask when making retirement decisions. Other considerations a potential policyholder or financial professional may make during their decision process include, but are not limited to:
• Liquidity preferences and needs that are not captured by the RISE Score model
• Asset class returns that are not reasonably captured by the RISE Score model or where the capital market assumptions assumed are not representative of a specific individual’s asset allocation
• Tax considerations concerning an annuity
• Current and anticipated health status, where the mortality table assumed in the RISE Score model is not representative of a specific individual
• Short- and long-term ability of an issuing company to pay guaranteed income claims
• Additional fees or commissions paid to purchase an annuity where the RISE Score model is not representative of a specific product nor an individual’s situation
• Product features, riders, fund offerings, index offerings, and fees of a specific annuity that may significantly differ from those included in the model
• Need for Long term care insurance
• Accessing home equity (e.g. HELOCs, reverse mortgages)
• Varying expense requirements through retirement
• Unique circumstances and situations
The RISE Score is only one piece of information an individual should consider when making changes to a retirement portfolio. There are many other considerations when making these decisions, including but not limited to the actual fund performance of the fund options available in the relevant plan(s), risk tolerance, fees, liquidity preferences, other financial goals not captured, health status, and more. The RISE Score is not intended to provide a substitute for comprehensive financial planning and is not intended to provide financial or investment advice. The RISE Score is intended for informational and educational use only.
APPENDIX III – RISE UNDER THE HOOD
The formulas below show the calculation for the account supportability ratio used to develop the dynamic withdrawal (a value between 0% to 100%, where 100% would be the ratio when the current portfolio value is sufficient to cover future retirement expenses in excess of other fixed sources of income.)
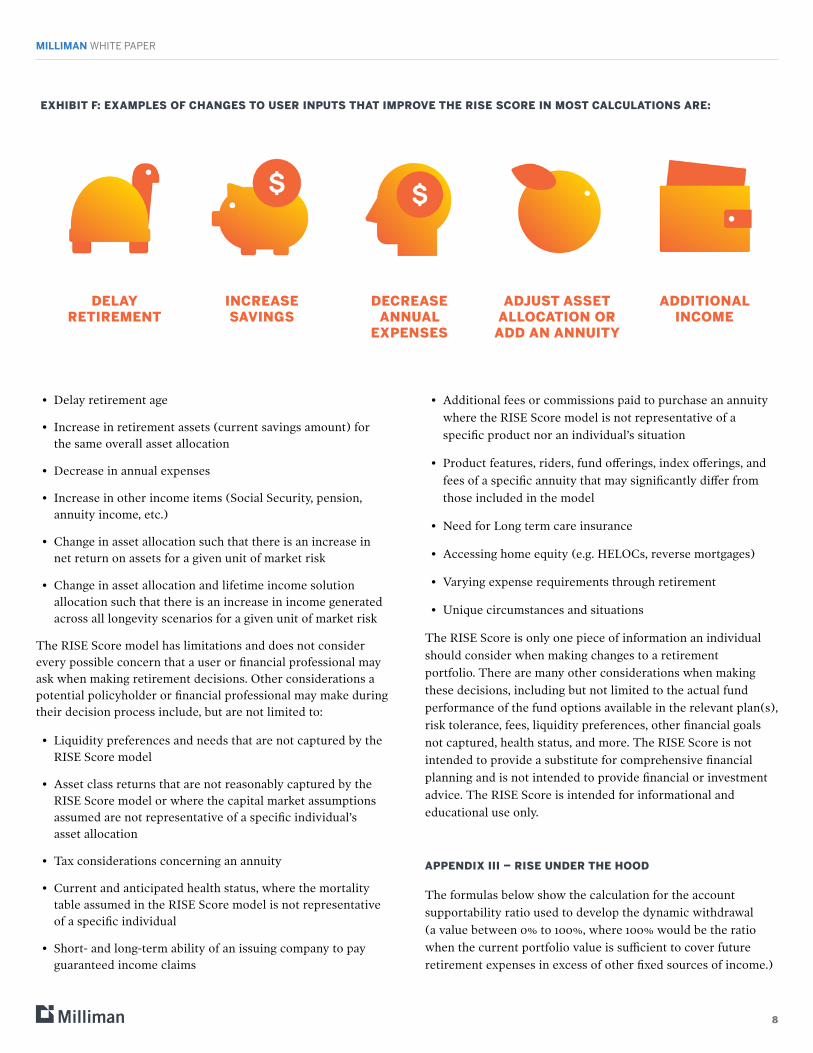
EXHIBIT F: EXAMPLES OF CHANGES TO USER INPUTS THAT IMPROVE THE RISE SCORE IN MOST CALCULATIONS ARE:
DELAY RETIREMENT
INCREASE SAVINGS
DECREASE ANNUAL
EXPENSES
ADJUST ASSET ALLOCATION OR
ADD AN ANNUITY
ADDITIONAL INCOME
9
MILLIMAN WHITE PAPER
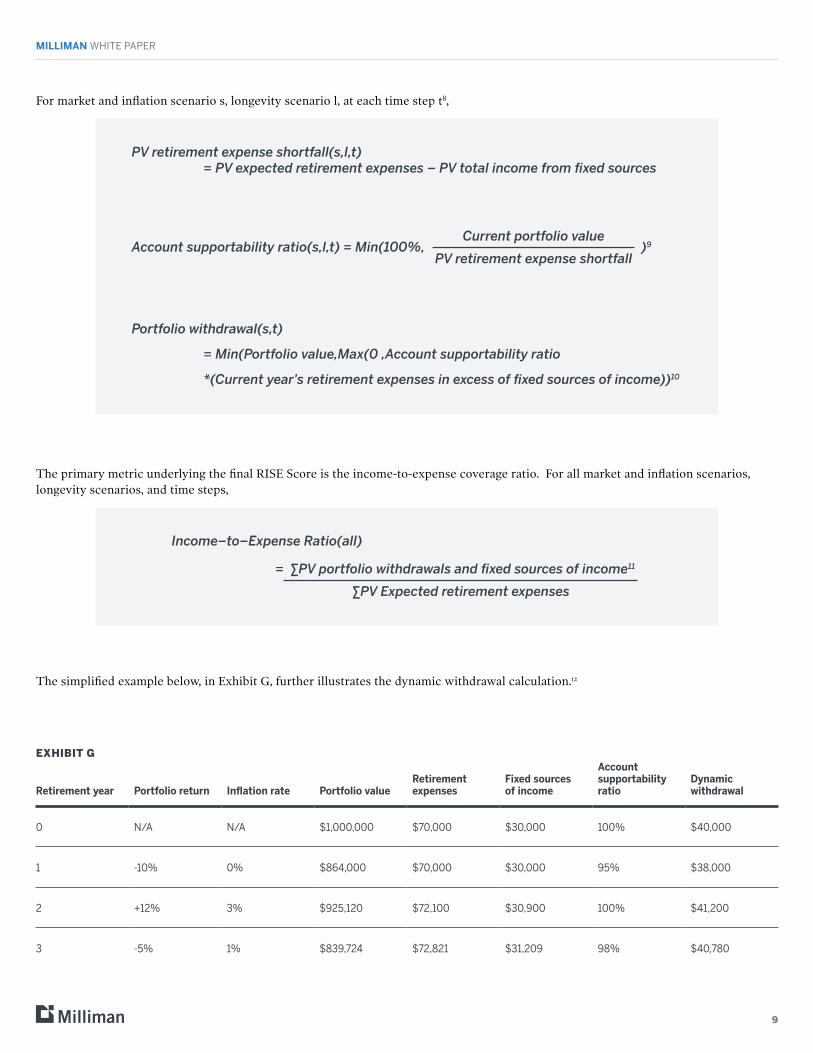
For market and inflation scenario s, longevity scenario l, at each time step t8,
PV retirement expense shortfall(s,l,t) = PV expected retirement expenses – PV total income from fixed sources
Account supportability ratio(s,l,t) = Min(100%, )9
Portfolio withdrawal(s,t)
= Min(Portfolio value,Max(0 ,Account supportability ratio
*(Current year's retirement expenses in excess of fixed sources of income))10
The primary metric underlying the final RISE Score is the income-to-expense coverage ratio. For all market and inflation scenarios, longevity scenarios, and time steps,
Income–to–Expense Ratio(all)
= ∑PV portfolio withdrawals and fixed sources of income11
The simplified example below, in Exhibit G, further illustrates the dynamic withdrawal calculation.12
EXHIBIT G
Retirement year Portfolio return Inflation rate Portfolio valueRetirement expenses
Fixed sources of income
Account supportability ratio
Dynamic withdrawal
0 N/A N/A $1,000,000 $70,000 $30,000 100% $40,000
1 -10% 0% $864,000 $70,000 $30,000 95% $38,000
2 +12% 3% $925,120 $72,100 $30,900 100% $41,200
3 -5% 1% $839,724 $72,821 $31,209 98% $40,780
Current portfolio value
PV retirement expense shortfall
∑PV Expected retirement expenses

10
MILLIMAN WHITE PAPER
FOOTNOTES
1 www.therisescore.com
2 Longevity Illustrator. Society of Actuaries and American Academy of Actuaries (2020). Retrieved on August 10, 2020, from https://www.longevityillustrator.org/
3 Godbout, Ted. Understanding the SECURE Act’s Lifetime Income Provisions (February 10, 2020). National Association of Plan Advisors (February 2020). Retrieved on October 13, 2020 from https://www.napa-net.org/news-info/daily-news/understanding-secure-acts-lifetime-income-provisions
4 Charles Schwab. Modern Wealth Survey (May 2019). Retrieved on October 13, 2020, from https://content.schwab.com/web/retail/public/about-schwab/Charles-Schwab-2019-Modern-Wealth-Survey-findings-0519-9JBP.pdf
5 The RISE Score (2020). Alliance for Lifetime Income (2020). Retrieved on August 10October 13, 2020, from https://www.protectedincome.org/retirement-tools/rise-calculator/
6 The RISE Score Methodology https://www.therisescore.com/education/methodology
7 Devine, Collin & Mungan, Ken. Planning for Retirement Income within an Increasingly Volatile and Uncertain World (March 2020). Alliance for Lifetime Income (2020). Retrieved on October 13, 2020, from https://go.mfin.com/rs/674-ATW-760/images/White_Paper-Devine_Mungan0324204.pdf
8 Thediscountrateassumedistheaverageinflationrate.
9 The minimum of the ratio or 100% is used in this formula so that no additional withdrawals are made beyond what is required to cover retirement expenses in the currentyearwhenthecurrentportfoliovalueismorethansufficienttocoverfutureretirementexpenses.Insituationswherefixedsourcesofincomeotherthantheportfolio withdrawal are greater than the current year’s retirement expenses, this excess income is reinvested into the portfolio.
10 The portfolio withdrawal is a non-zero value, never less than the total portfolio value norgreaterthanthecurrentyear’sretirementexpensesinexcessoffixedsourcesofincome.
11 Theactualincomereceivedbytheretiree,portfoliowithdrawalsplusfixedsourcesofincome, are further adjusted in the income ratio calculation to account for the vitality level possibility of retiree returning to work. In effect, where there are gaps in income, thisadjustmentinthecashflowsunderlyingthefinalRISEScorecalculationreflectsthat as retirees age, they are less likely to be able to return to, or desire returning to, the workforce.
12 The calculator at therisescore.com demonstrates the movement of the supportability ratio and the dynamic withdrawals along each scenario path modeled.
https://content.schwab.com/web/retail/public/about-schwab/Charles-Schwab-2019-Modern-Wealth-Survey-f

MILLIMAN WHITE PAPER
The information, products, or services described or referenced herein are intended to be for informational purposes only. This material is not intended to be a recommendation, offer, solicitation or advertisement to buy or sell any securities, securities related product or service, or investment strategy, nor is it intended to be to be relied upon as a forecast, research or investment advice. The products or services described or referenced herein may not be suitable or appropriate for the recipient. Many of the products and services described or referenced herein involve significant risks, and the recipient should not make any decision or enter into any transaction unless the recipient has fully understood all such risks and has independently determined that such decisions or transactions are appropriate for the recipient. Investment involves risks. Any discussion of risks contained herein with respect to any product or service should not be considered to be a disclosure of all risks or a complete discussion of the risks involved. The recipient should not construe any of the material contained herein as investment, hedging, trading, legal, regulatory, tax, accounting or other advice. The recipient should not act on any information in this document without consulting its investment, hedging, trading,
legal, regulatory, tax, accounting and other advisors. Information herein has been obtained from sources we believe to be reliable but neither Milliman Financial Risk Management LLC (“Milliman FRM”) nor its parents, subsidiaries or affiliates warrant its completeness or accuracy. No responsibility can be accepted for errors of facts obtained from third parties. The materials in this document represent the opinion of the authors at the time of authorship; they may change, and are not representative of the views of Milliman FRM or its parents, subsidiaries, or affiliates. Milliman FRM does not certify the information, nor does it guarantee the accuracy and completeness of such information. Use of such information is voluntary and should not be relied upon unless an independent review of its accuracy and completeness has been performed. Materials may not be reproduced without the express consent of Milliman FRM. Milliman Financial Risk Management LLC is an SEC-registered investment advisor and subsidiary of Milliman, Inc.© 2021 Milliman Financial Risk Management LLC - 3/21
Creating transformational improvement in the retirement savings industry.
For more information, visit frm.milliman.com or call +1 855 645 5462.
Milliman Financial Risk Management LLC is a global leader in financial risk management to the retirement savings industry. Milliman FRM provides investment advisory, hedging, and consulting services on approximately $150 billion in global assets (as of December 31, 2020). Established in 1998, the practice includes over 200 professionals operating from three trading platforms around the world (Chicago, London, and Sydney). Milliman FRM is a subsidiary of Milliman, Inc.
Milliman is among the world’s largest providers of actuarial and related products and services. The firm has consulting practices in healthcare, property & casualty insurance, life insurance and financial services, and employee benefits. Founded in 1947, Milliman is an independent firm with offices in major cities around the globe.
C
L
S
Chicago71 S. Wacker Drive31st FloorChicago, IL 60606United StatesTel: +1 312 726 0677
London11 Old JewryThird FloorLondon, EC2R 8DUUnited KingdomTel: +44 207 847 1500
SydneyLevel 532 Walker StreetSydney, NSW 2060AustraliaTel: +61 2 8090 9100