The Millennium Development Goals Report - UNIC Riounicrio.org.br/2010/relatorioodm_en.pdf · The...
80
UNITED NATIONS The Millennium Development Goals Report 2010 MDG Report 2010 En 20100604 r14 Final.indd 1 MDG Report 2010 En 20100604 r14 Final.indd 1 6/15/2010 12:51:26 PM 6/15/2010 12:51:26 PM
-
Upload
vuongquynh -
Category
Documents
-
view
219 -
download
0
Transcript of The Millennium Development Goals Report - UNIC Riounicrio.org.br/2010/relatorioodm_en.pdf · The...
U N I T E D N AT I O N S
The Millennium Development Goals Report
2010
MDG Report 2010 En 20100604 r14 Final.indd 1MDG Report 2010 En 20100604 r14 Final.indd 1 6/15/2010 12:51:26 PM6/15/2010 12:51:26 PM
UNITED NATIONS
2
Cover Inside
This report is based on a master set of data that has been compiled by an Inter-Agency and Expert Group on MDG Indicators led by the Department of Economic and Social Affairs of the United Nations Secretariat, in response to the wishes of the General Assembly for periodic assessment of progress towards the MDGs. The Group comprises representatives of the international organizations whose activities include the preparation of one or more of the series of statistical indicators that were identifi ed as appropriate for monitoring progress towards the MDGs, as refl ected in the list below. A number of national statisticians and outside expert advisers also contributed.
INTERNATIONAL LABOUR ORGANIZATION
FOOD AND AGRICULTURE ORGANIZATION OF THE UNITED NATIONS
UNITED NATIONS EDUCATIONAL, SCIENTIFIC AND CULTURAL ORGANIZATION
UNITED NATIONS INDUSTRIAL DEVELOPMENT ORGANIZATION
WORLD HEALTH ORGANIZATION
THE WORLD BANK
INTERNATIONAL MONETARY FUND
INTERNATIONAL TELECOMMUNICATION UNION
ECONOMIC COMMISSION FOR AFRICA
ECONOMIC COMMISSION FOR EUROPE
ECONOMIC COMMISSION FOR LATIN AMERICA AND THE CARIBBEAN
ECONOMIC AND SOCIAL COMMISSION FOR ASIA AND THE PACIFIC
ECONOMIC AND SOCIAL COMMISSION FOR WESTERN ASIA
JOINT UNITED NATIONS PROGRAMME ON HIV/AIDS
UNITED NATIONS CHILDREN’S FUND
UNITED NATIONS CONFERENCE ON TRADE AND DEVELOPMENT
UNITED NATIONS DEVELOPMENT FUND FOR WOMEN
UNITED NATIONS DEVELOPMENT PROGRAMME
UNITED NATIONS ENVIRONMENT PROGRAMME
UNITED NATIONS FRAMEWORK CONVENTION ON CLIMATE CHANGE
UNITED NATIONS HIGH COMMISSIONER FOR REFUGEES
UNITED NATIONS HUMAN SETTLEMENTS PROGRAMME
UNITED NATIONS POPULATION FUND
INTERNATIONAL TRADE CENTRE
INTER-PARLIAMENTARY UNION
ORGANISATION FOR ECONOMIC CO-OPERATION AND DEVELOPMENT
WORLD TRADE ORGANIZATION
MDG Report 2010 En 20100604 r14 Final.indd 2MDG Report 2010 En 20100604 r14 Final.indd 2 6/15/2010 12:51:29 PM6/15/2010 12:51:29 PM
THE MILLENNIUM DEVELOPMENT GOALS REPORT 2010
3
The Millennium Development Goals Report 2010
U N I T E D N AT I O N S
N E W YO R K , 2010
MDG Report 2010 En 20100604 r14 Final.indd Sec1:3MDG Report 2010 En 20100604 r14 Final.indd Sec1:3 6/15/2010 12:51:29 PM6/15/2010 12:51:29 PM

UNITED NATIONS
4
MDG Report 2010 En 20100604 r14 Final.indd Sec1:4MDG Report 2010 En 20100604 r14 Final.indd Sec1:4 6/15/2010 12:51:29 PM6/15/2010 12:51:29 PM
THE MILLENNIUM DEVELOPMENT GOALS REPORT 2010
3
ForewordThe Millennium Declaration in 2000 was a milestone
in international cooperation, inspiring development
efforts that have improved the lives of hundreds of
millions of people around the world. Ten years later,
world leaders will gather again at the United Nations
in New York to review progress, assess obstacles
and gaps, and agree on concrete strategies and
actions to meet the eight Millennium Development
Goals by 2015.
The Goals represent human needs and basic rights
that every individual around the world should be
able to enjoy—freedom from extreme poverty and
hunger; quality education, productive and decent
employment, good health and shelter; the right of
women to give birth without risking their lives; and a
world where environmental sustainability is a priority,
and women and men live in equality. Leaders also
pledged to forge a wide-ranging global partnership
for development to achieve these universal
objectives.
This report shows how much progress has been
made. Perhaps most important, it shows that
the Goals are achievable when nationally owned
development strategies, policies and programmes
are supported by international development partners.
At the same time, it is clear that improvements in
the lives of the poor have been unacceptably slow,
and some hard-won gains are being eroded by the
climate, food and economic crises.
The world possesses the resources and knowledge
to ensure that even the poorest countries, and others
held back by disease, geographic isolation or civil
strife, can be empowered to achieve the MDGs.
Meeting the goals is everyone’s business. Falling
short would multiply the dangers of our world – from
instability to epidemic diseases to environmental
degradation. But achieving the goals will put us on
a fast track to a world that is more stable, more just,
and more secure.
Billions of people are looking to the international
community to realize the great vision embodied in the
Millennium Declaration. Let us keep that promise.
Ban Ki-moonSecretary-General, United Nations
MDG Report 2010 En 20100604 r14 Final.indd Sec2:3MDG Report 2010 En 20100604 r14 Final.indd Sec2:3 6/15/2010 12:51:31 PM6/15/2010 12:51:31 PM
UNITED NATIONS
4
OverviewKeeping the promiseFive years from the target date for the Millennium Development Goals, leaders from around the world will be gathering at the United Nations to undertake a comprehensive review of progress and together chart a course for accelerated action on the MDGs between now and 2015.
Many countries are moving forward, including some of the poorest, demonstrating that setting bold, collective goals in the fi ght against poverty yields results. For every life that has benefi ted from the establishment of a quantitative, time-bound framework of accountability, the MDGs have made a real difference.
But unmet commitments, inadequate resources, lack of focus and accountability, and insuffi cient dedication to sustainable development have created shortfalls in many areas. Some of these shortfalls were aggravated by the global food and economic and fi nancial crises.
Nevertheless, the data and analysis on the following pages provide clear evidence that targeted interventions, sustained by adequate funding and political commitment, have resulted in rapid progress in some areas. In others, the poorest groups, those without education or living in more remote areas, have been neglected and not provided the conditions to improve their lives.
Bridging the gapsThough progress has been made, it is uneven. And without a major push forward, many of the MDG targets are likely to be missed in most regions. Old and new challenges threaten to further slow progress in some areas or even undo successes achieved so far.
The most severe impact of climate change is being felt by vulnerable populations who have contributed least to the problem. The risk of death or disability and economic loss due to natural disasters is increasing globally and is concentrated in poorer countries. Armed confl ict remains a major threat to human security and to hard-won MDG gains. Large populations of refugees remain in camps with limited opportunities to improve their lives. In 2009, 42 million people had been displaced by confl ict or persecution, four fi fths of them in developing countries.
The number of people who are undernourished has continued to grow, while slow progress in reducing the prevalence of hunger stalled—or even reversed itself—in some regions between 2000-2002 and 2005-2007. About one in four children under the age of fi ve are underweight, mainly due to lack of food and quality food, inadequate water, sanitation and health services, and poor care and feeding practices.
An estimated 1.4 billion people were still living in extreme poverty in 2005. Moreover, the effects of the global fi nancial crisis are likely to persist: poverty rates will be slightly higher in 2015 and even beyond, to 2020, than they would have been had the world economy grown steadily at its pre-crisis pace.
Gender equality and the empowerment of women are at the heart of the MDGs and are preconditions for overcoming poverty, hunger and disease. But progress has been sluggish on all fronts—from education to access to political decision-making.
Building on successesThe collective efforts towards achievement of the MDGs have made inroads in many areas. Encouraging trends before 2008 had put many regions on track to achieve at least some of the goals. The economic growth momentum in developing regions remains strong and, learning from the many successes of even the most challenged countries, achieving the MDGs is still within our grasp:
Progress on poverty reduction is still being made, • despite signifi cant setbacks due to the 2008-2009 economic downturn, and food and energy crises. The developing world as a whole remains on track to achieve the poverty reduction target by 2015. The overall poverty rate is still expected to fall to 15 per cent by 2015, which translates to around 920 million people living under the international poverty line—half the number in 1990.
Major advances have been made in getting children into • school in many of the poorest countries, most of them in sub-Saharan Africa.
Remarkable improvements in key interventions—for • malaria and HIV control, and measles immunization, for example—have cut child deaths from 12.5 million in 1990 to 8.8 million in 2008.
Between 2003 and 2008, the number of people • receiving antiretroviral therapy increased tenfold—from 400,000 to 4 million—corresponding to 42 per cent of the 8.8 million people who needed treatment for HIV.
Major increases in funding and a stronger commitment • to control malaria have accelerated delivery of malaria interventions. Across Africa, more communities are benefi ting from bed net protection and more children are being treated with effective drugs.
The rate of deforestation, though still alarmingly high, • appears to have slowed, due to tree-planting schemes combined with the natural expansion of forests.
Increased use of improved water sources in rural • areas has narrowed the large gap with urban areas, where coverage has remained at 94 per cent—almost unchanged since 1990. However, the safety of water supplies remains a challenge and urgently needs to be addressed.
Mobile telephony continues to expand in the developing • world and is increasingly being used for m-banking, disaster management and other non-voice applications for development. By the end of 2009, cellular subscriptions per 100 people had reached the 50 per cent mark.
MDG Report 2010 En 20100604 r14 Final.indd Sec2:4MDG Report 2010 En 20100604 r14 Final.indd Sec2:4 6/15/2010 12:51:31 PM6/15/2010 12:51:31 PM
THE MILLENNIUM DEVELOPMENT GOALS REPORT 2010
5
Towards 2015The Millennium Declaration represents the most important promise ever made to the world’s most vulnerable people. The MDG framework for accountability derived from the Declaration has generated an unprecedented level of commitment and partnership in building decent, healthier lives for billions of people and in creating an environment that contributes to peace and security.
The Millennium Development Goals are still attainable. The critical question today is how to transform the pace of change from what we have seen over the last decade into dramatically faster progress. The experience of these last ten years offers ample evidence of what works and has provided tools that can help us achieve the MDGs by 2015. The Millennium Development Goals summit in September will be an opportunity for world leaders to translate this evidence into a concrete agenda for action.
SHA ZUKANGUnder-Secretary-General for Economic and Social Affairs
Achieving the MDGs will also require increased attention to those most vulnerable. Policies and interventions will be needed to eliminate the persistent or even increasing inequalities between the rich and the poor, between those living in rural or remote areas or in slums versus better-off urban populations, and those disadvantaged by geographic location, sex, age, disability or ethnicity:
In all developing regions, children in rural areas are • more likely to be underweight than urban children. In Latin America and the Caribbean and parts of Asia, this disparity increased between 1990 and 2008.
The gap between the richest and the poorest • households remains enormous. In Southern Asia, 60 per cent of children in the poorest areas are underweight compared to 25 per cent of children in the richest households.
In developing regions overall, girls in the poorest 20 per • cent of households are 3.5 times more likely to be out of school than girls in the richest households and four times more likely to be out of school than boys from the richest households.
Even in countries close to achieving universal primary • education, children with disabilities are the majority of those excluded.
Maternal health is one of the areas in which the gap • between rich and poor is most conspicuous. While almost all births are attended by skilled health personnel in the developed countries, less than half of women receive such care when giving birth in parts of the developing world.
Disparities in access to care during pregnancy are also • striking, with women in the richest households 1.7 times more likely to visit a skilled health worker at least once before birth than the poorest women.
Lack of education is another major obstacle to • accessing tools that could improve people’s lives. For instance, poverty and unequal access to schooling perpetuate high adolescent birth rates, jeopardizing the health of girls and diminishing their opportunities for social and economic advancement.
Contraceptive use is four times higher among women • with a secondary education than among those with no education. For women in the poorest households and among those with no education, negligible progress was seen over the last decade.
Only about half of the developing world’s population • are using improved sanitation, and addressing this inequality will have a major impact on several of the MDGs. Disparities between rural and urban areas remain daunting, with only 40 per cent of rural populations covered. And while 77 per cent of the population in the richest 20 per cent of households use improved sanitation facilities, the share is only 16 per cent of those in the poorest households.
MDG Report 2010 En 20100604 r14 Final.indd Sec2:5MDG Report 2010 En 20100604 r14 Final.indd Sec2:5 6/15/2010 12:51:31 PM6/15/2010 12:51:31 PM
UNITED NATIONS
6
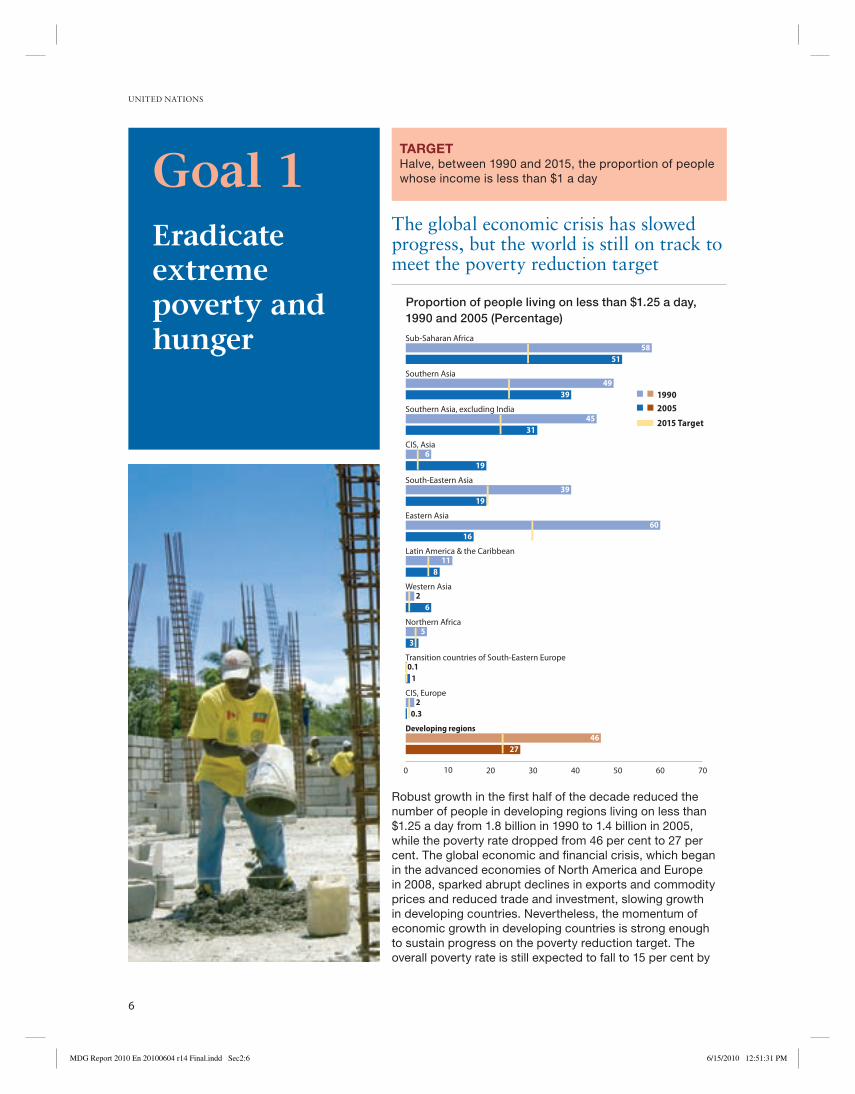
The global economic crisis has slowed progress, but the world is still on track to meet the poverty reduction target
Robust growth in the fi rst half of the decade reduced the
number of people in developing regions living on less than
$1.25 a day from 1.8 billion in 1990 to 1.4 billion in 2005,
while the poverty rate dropped from 46 per cent to 27 per
cent. The global economic and fi nancial crisis, which began
in the advanced economies of North America and Europe
in 2008, sparked abrupt declines in exports and commodity
prices and reduced trade and investment, slowing growth
in developing countries. Nevertheless, the momentum of
economic growth in developing countries is strong enough
to sustain progress on the poverty reduction target. The
overall poverty rate is still expected to fall to 15 per cent by
TARGETHalve, between 1990 and 2015, the proportion of people
whose income is less than $1 a dayGoal 1Eradicate extreme poverty and hunger
0 10 20 30 40 50 60 70
Developing regions
CIS, Europe
Transition countries of South-Eastern Europe
Northern Africa
Western Asia
Latin America & the Caribbean
Eastern Asia
South-Eastern Asia
CIS, Asia
Southern Asia, excluding India
Southern Asia
Sub-Saharan Africa
Proportion of people living on less than $1.25 a day, 1990 and 2005 (Percentage)
60
5851
4939
4531
619
3919
16
118
26
53
4627
0.1
0.3
1
2
19902005
2015 Target
MDG Report 2010 En 20100604 r14 Final.indd Sec2:6MDG Report 2010 En 20100604 r14 Final.indd Sec2:6 6/15/2010 12:51:31 PM6/15/2010 12:51:31 PM
THE MILLENNIUM DEVELOPMENT GOALS REPORT 2010
7
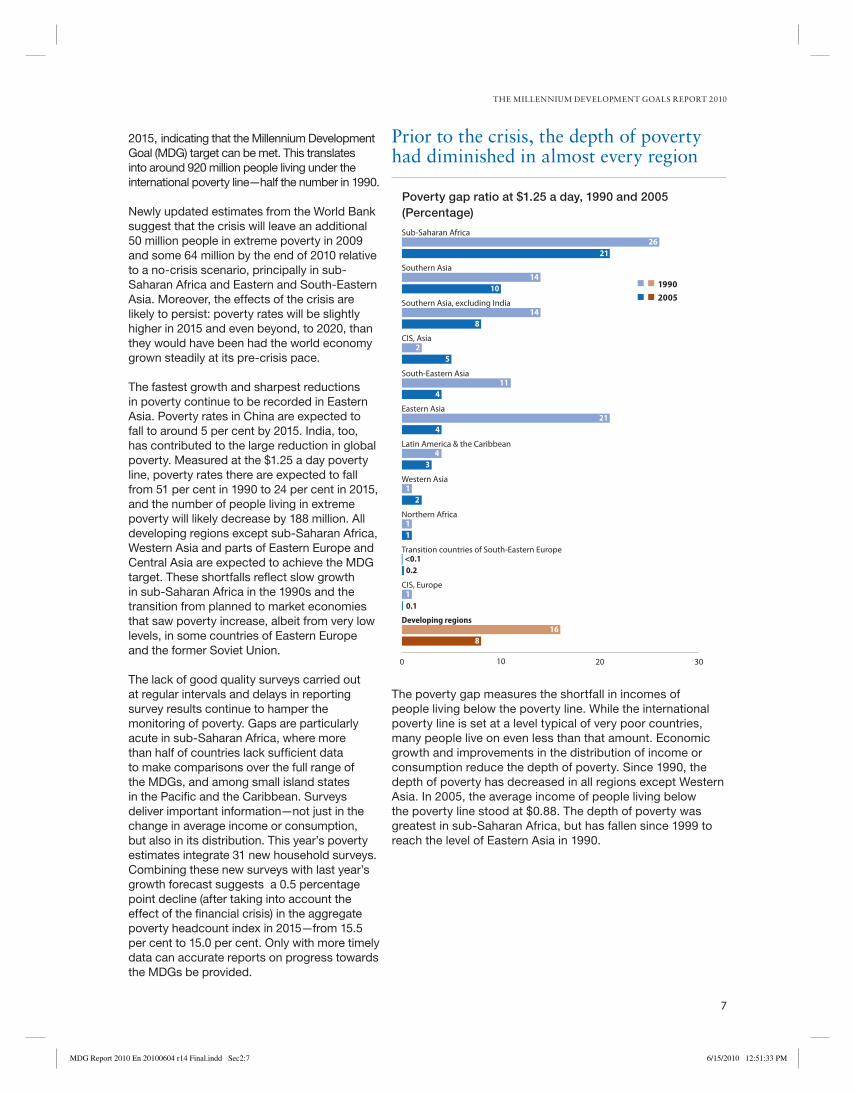
Prior to the crisis, the depth of poverty had diminished in almost every region
2015, indicating that the Millennium Development
Goal (MDG) target can be met. This translates
into around 920 million people living under the
international poverty line—half the number in 1990.
Newly updated estimates from the World Bank
suggest that the crisis will leave an additional
50 million people in extreme poverty in 2009
and some 64 million by the end of 2010 relative
to a no-crisis scenario, principally in sub-
Saharan Africa and Eastern and South-Eastern
Asia. Moreover, the effects of the crisis are
likely to persist: poverty rates will be slightly
higher in 2015 and even beyond, to 2020, than
they would have been had the world economy
grown steadily at its pre-crisis pace.
The fastest growth and sharpest reductions
in poverty continue to be recorded in Eastern
Asia. Poverty rates in China are expected to
fall to around 5 per cent by 2015. India, too,
has contributed to the large reduction in global
poverty. Measured at the $1.25 a day poverty
line, poverty rates there are expected to fall
from 51 per cent in 1990 to 24 per cent in 2015,
and the number of people living in extreme
poverty will likely decrease by 188 million. All
developing regions except sub-Saharan Africa,
Western Asia and parts of Eastern Europe and
Central Asia are expected to achieve the MDG
target. These shortfalls refl ect slow growth
in sub-Saharan Africa in the 1990s and the
transition from planned to market economies
that saw poverty increase, albeit from very low
levels, in some countries of Eastern Europe
and the former Soviet Union.
The lack of good quality surveys carried out
at regular intervals and delays in reporting
survey results continue to hamper the
monitoring of poverty. Gaps are particularly
acute in sub-Saharan Africa, where more
than half of countries lack suffi cient data
to make comparisons over the full range of
the MDGs, and among small island states
in the Pacifi c and the Caribbean. Surveys
deliver important information—not just in the
change in average income or consumption,
but also in its distribution. This year’s poverty
estimates integrate 31 new household surveys.
Combining these new surveys with last year’s
growth forecast suggests a 0.5 percentage
point decline (after taking into account the
effect of the fi nancial crisis) in the aggregate
poverty headcount index in 2015—from 15.5
per cent to 15.0 per cent. Only with more timely
data can accurate reports on progress towards
the MDGs be provided.
The poverty gap measures the shortfall in incomes of
people living below the poverty line. While the international
poverty line is set at a level typical of very poor countries,
many people live on even less than that amount. Economic
growth and improvements in the distribution of income or
consumption reduce the depth of poverty. Since 1990, the
depth of poverty has decreased in all regions except Western
Asia. In 2005, the average income of people living below
the poverty line stood at $0.88. The depth of poverty was
greatest in sub-Saharan Africa, but has fallen since 1999 to
reach the level of Eastern Asia in 1990.
0 10 20 30
Developing regions
CIS, Europe
Transition countries of South-Eastern Europe
Northern Africa
Western Asia
Latin America & the Caribbean
Eastern Asia
South-Eastern Asia
CIS, Asia
Southern Asia, excluding India
Southern Asia
Sub-Saharan Africa
Poverty gap ratio at $1.25 a day, 1990 and 2005 (Percentage)
<0.10.2
0.1
2621
1410
148
25
114
214
43
1
1
1
1
168
2
19902005
MDG Report 2010 En 20100604 r14 Final.indd Sec2:7MDG Report 2010 En 20100604 r14 Final.indd Sec2:7 6/15/2010 12:51:33 PM6/15/2010 12:51:33 PM
UNITED NATIONS
8
Investments in disaster risk reduction can yield long-term benefi ts, including progress on the MDGs
The risk of death or disability and
economic loss resulting from natural
disasters is increasing globally and is
concentrated in poorer countries. Reducing
such risk can have multiplier effects that
can accelerate achievement of the MDGs.
The horrifi c loss of life from earthquakes
in Haiti, Chile and China, and fl oods in
Brazil, underscore the need to make the
built environment more resilient in the face
of potential hazards—both seismic and
climatic (or weather-related).
Urbanization, climate change and
ecosystem degradation are increasing the
toll of natural disasters, and countries least
able to reduce their risk are suffering the
most. An estimated 97 per cent of global
mortality risk from natural disasters is
faced by populations in low- and lower-
middle-income countries, which also
experience higher economic losses relative
to the size of their economies. From the
start of 2008 through March 2010, 470,000
people were reportedly killed as a result of
natural disasters; economic losses were
estimated to be more than $262 billion (not
including 2010). Small island developing
states and landlocked developing countries
together constitute 60 per cent and 67
per cent, respectively, of the countries
considered to have a high or very high
economic vulnerability to natural hazards.
Experience from countries has shown
that investments in disaster risk reduction
produce long-term benefi ts—from reduced
future losses and avoided reconstruction
to co-benefi ts such as more robust
livelihoods, resilient communities, and
protective and productive ecosystems.
In Peru, incorporation of risk reduction
into development has led to benefi ts that
exceeded costs by as much as 37 times.
When China spent $3.15 billion on reducing
the impact of fl oods between 1960 and
2000, it averted losses estimated at $12
billion.
TARGETAchieve, full and productive employment and decent
work for all, including women and young people
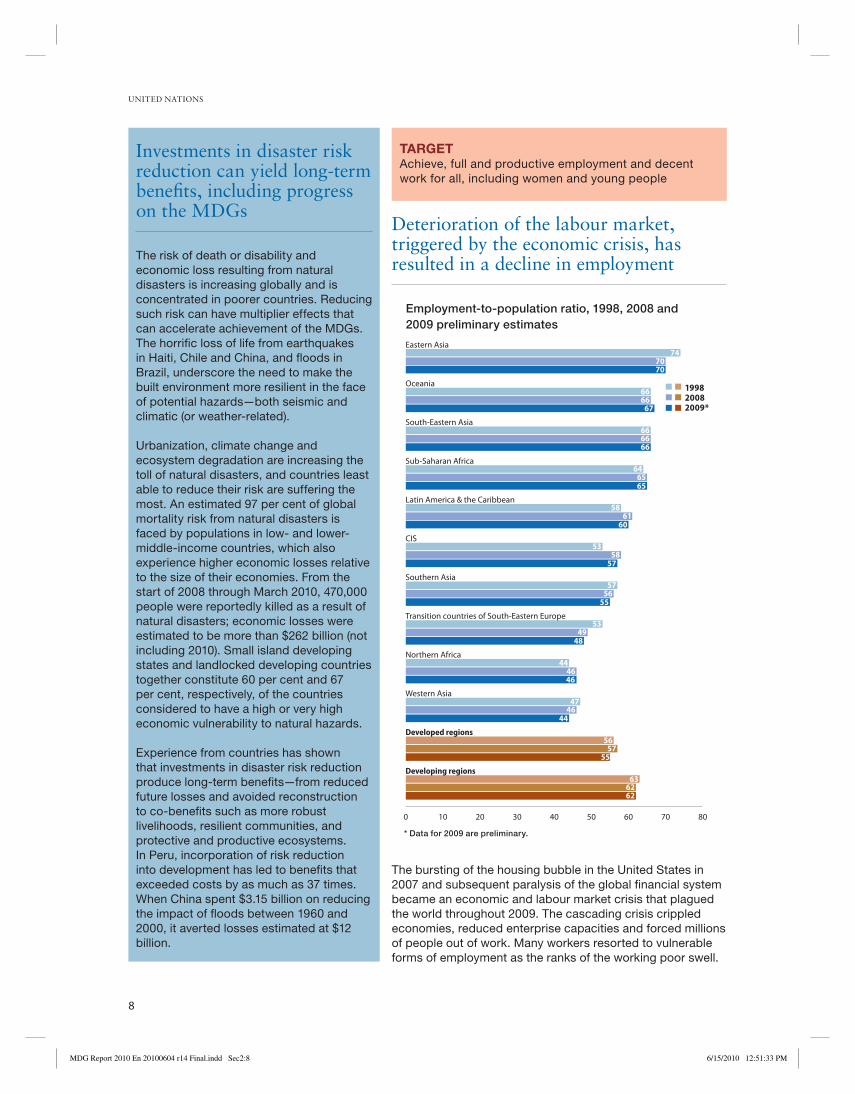
Deterioration of the labour market, triggered by the economic crisis, has resulted in a decline in employment
The bursting of the housing bubble in the United States in
2007 and subsequent paralysis of the global fi nancial system
became an economic and labour market crisis that plagued
the world throughout 2009. The cascading crisis crippled
economies, reduced enterprise capacities and forced millions
of people out of work. Many workers resorted to vulnerable
forms of employment as the ranks of the working poor swell.
0 10 20 30 40 50 60 70 80
Developing regions
Developed regions
Western Asia
Northern Africa
Transition countries of South-Eastern Europe
Southern Asia
CIS
Latin America & the Caribbean
Sub-Saharan Africa
South-Eastern Asia
Oceania
Eastern Asia
Employment-to-population ratio, 1998, 2008 and 2009 preliminary estimates
747070
6666
666666
646565
5861
60
5358
57
5756
55
5349
48
444646
4746
44
5657
55
636262
67
* Data for 2009 are preliminary.
199820082009*
MDG Report 2010 En 20100604 r14 Final.indd Sec2:8MDG Report 2010 En 20100604 r14 Final.indd Sec2:8 6/15/2010 12:51:33 PM6/15/2010 12:51:33 PM

THE MILLENNIUM DEVELOPMENT GOALS REPORT 2010
9
As the crisis deepened, government
stimulus measures began to curb the slide
in economic activity and lessen the impact
of global job losses. The coordinated efforts
of countries responding to the crisis have
been instrumental in averting even greater
social and economic hardships. However,
labour market conditions have continued to
deteriorate in many countries and will likely
threaten much of the progress made over the
last decade towards decent work.
The economic deterioration resulted in a
sharp drop in employment-to-population
ratios. In addition, labour productivity
declined in 2009. In most regions, the
decrease in gross domestic product was
even greater than the decline in employment,
resulting in diminishing output per worker.
Preliminary estimates indicate a negative
growth in output per worker in all regions
except Northern Africa, Eastern Asia and
Southern Asia. The largest fall in output per
worker was in CIS countries in Europe, the
transition countries of South-Eastern Europe
and in Latin America and the Caribbean.
Declining labour output contributes to poorer
working conditions, worsening the plight of
workers in regions where labour productivity
was already low before the economic crisis,
as in sub-Saharan Africa.
As jobs were lost, more workers have been forced into vulnerable employment
The positive downward trend in vulnerable employment was
interrupted by deteriorating conditions on the labour market
following the fi nancial crisis. For many wage and salaried
workers who lost their jobs, as well as fi rst-time job seekers
who entered the labour market in the midst of the crisis, own-
account and unpaid family work are options of last resort.
Those engaged in ‘vulnerable employment’, defi ned as the
sum of own-account workers and contributing family workers,
are not typically bound by formal work arrangements. They
are therefore more likely to lack benefi ts associated with
decent employment, such as adequate social security
0 10 20 30 40 50 60 70 80 90
Developing regions
Developed regions
CIS, Europe
Western Asia
Transition countries of South-Eastern Europe
Latin America & the Caribbean
Northern Africa
CIS, Asia
Eastern Asia
South-Eastern Asia
Sub-Saharan Africa
Southern Asia
Oceania
Proportion of own-account and contributing family workers in total employment, 1998, 2008 and 2009 second scenario (Percentage)
7478
79
8076
77
8275
77
636161
625353
4741
44
3531
34
3531
32
3224
29
3927
28
8910
1110
11
6559
60
*Forecasts for 2009 are based on the International Labour Organization’s second scenario. Details are available at mdgs.un.org
199820082009*
MDG Report 2010 En 20100604 r14 Final.indd Sec2:9MDG Report 2010 En 20100604 r14 Final.indd Sec2:9 6/15/2010 12:51:34 PM6/15/2010 12:51:34 PM
UNITED NATIONS
10
and recourse to effective mechanisms for
social dialogue. Vulnerable employment is
often characterized by inadequate earnings,
low productivity and substandard working
conditions that undermine fundamental labour
rights.
Prior to the economic crisis, over three
quarters of workers in Oceania, Southern
Asia and sub-Saharan Africa were without the
security that wage and salaried jobs could
provide. The crisis is likely to have further
increased the number of workers engaged
in vulnerable employment in these regions in
2009. The International Labour Organization
(ILO) estimates* the global vulnerable
employment rate in 2009 to be between 49
per cent and 53 per cent, which translates
into 1.5 billion to 1.6 billion people who are
working on their own or as unpaid family
workers worldwide.
* Details are available at http://mdgs.un.org
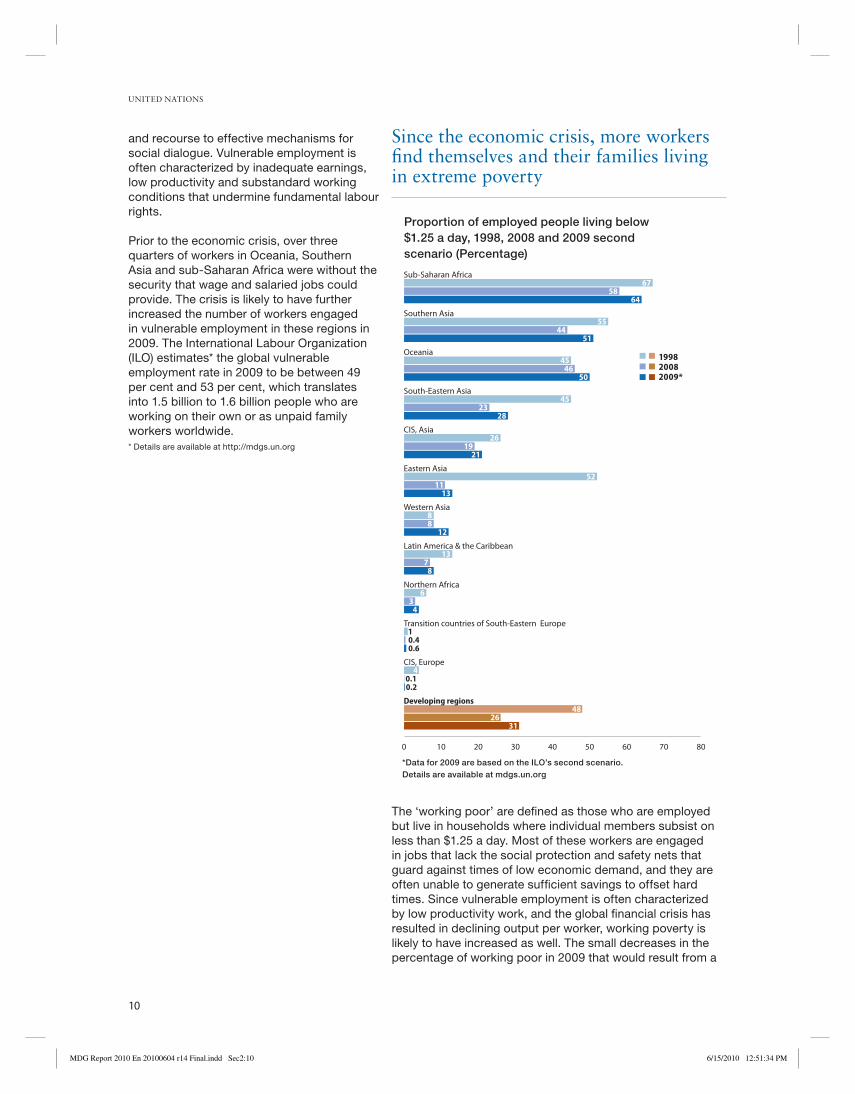
Since the economic crisis, more workers fi nd themselves and their families living in extreme poverty
The ‘working poor’ are defi ned as those who are employed
but live in households where individual members subsist on
less than $1.25 a day. Most of these workers are engaged
in jobs that lack the social protection and safety nets that
guard against times of low economic demand, and they are
often unable to generate suffi cient savings to offset hard
times. Since vulnerable employment is often characterized
by low productivity work, and the global fi nancial crisis has
resulted in declining output per worker, working poverty is
likely to have increased as well. The small decreases in the
percentage of working poor in 2009 that would result from a
0 10 20 30 40 50 60 70 80
Developing regions
CIS, Europe
Transition countries of South-Eastern Europe
Northern Africa
Latin America & the Caribbean
Western Asia
Eastern Asia
CIS, Asia
South-Eastern Asia
Oceania
Southern Asia
Sub-Saharan Africa
Proportion of employed people living below $1.25 a day, 1998, 2008 and 2009 second scenario (Percentage)
6758
64
5544
51
4546
50
4523
28
2619
21
5211
88
12
137
8
63
4
4
4826
31
0.10.2
10.40.6
13
*Data for 2009 are based on the ILO’s second scenario. Details are available at mdgs.un.org
199820082009*
MDG Report 2010 En 20100604 r14 Final.indd Sec2:10MDG Report 2010 En 20100604 r14 Final.indd Sec2:10 6/15/2010 12:51:34 PM6/15/2010 12:51:34 PM

THE MILLENNIUM DEVELOPMENT GOALS REPORT 2010
11
continuation of historical trends (scenario 1)
are therefore not likely to have materialized.
Rather, it is estimated that an additional 3.6
per cent of the world’s workers were at risk
of falling into poverty between 2008 and
2009 (scenario 2), an alarming increase and a
setback of many years of steady progress.
The largest negative impact is most likely
to be seen in sub-Saharan Africa, Southern
Asia, South-Eastern Asia and Oceania, where
extreme poverty among the employed may
have increased by four percentage points or
more in the second scenario. These estimates
refl ect the fact that, prior to the crisis, many
workers in these regions were only slightly
above the poverty line. In the case of sub-
Saharan Africa, the large majority of workers
(63.5 per cent) were at risk of falling below the
extreme poverty line in this scenario.
Hunger may have spiked in 2009, one of the many dire consequences of the global food and fi nancial crises
Since 1990, developing regions have made some progress
towards the MDG target of halving the proportion of
people suffering from hunger. The share of undernourished
populations decreased from 20 per cent in 1990-1992 to 16
per cent in 2005-2007, the latest period with available data.
However, progress has stalled since 2000-2002. Overall
progress in reducing the prevalence of hunger has not been
suffi cient to reduce the number of undernourished people. In
2005-2007, the last period assessed, 830 million people were
still undernourished, an increase from 817 million in 1990-
1992.
Food prices spiked in 2008 and falling income due to the
fi nancial crisis further worsened the situation. The Food and
Agricultural Organization of the United Nations estimates that
the number of people who were undernourished in 2008 may
be as high as 915 million and exceed 1 billion in 2009.
TARGETHalve, between 1990 and 2015, the proportion of people
who suffer from hunger
0
300
600
900
1200
1500
Proportion of people who are undernourished in the developing regions (Percentage) and number of undernourished people (Millions), 1990-1992, 1995-1997, 2000-2002 and 2005-2007
817 797 805 830
Mill
ions
Perc
enta
ge
0
5
10
15
20
25
2005-20072000-20021995-19971990-1992
Number of undernourished peoplePercentage of undernourished people
MDG Report 2010 En 20100604 r14 Final.indd Sec2:11MDG Report 2010 En 20100604 r14 Final.indd Sec2:11 6/15/2010 12:51:34 PM6/15/2010 12:51:34 PM
UNITED NATIONS
12
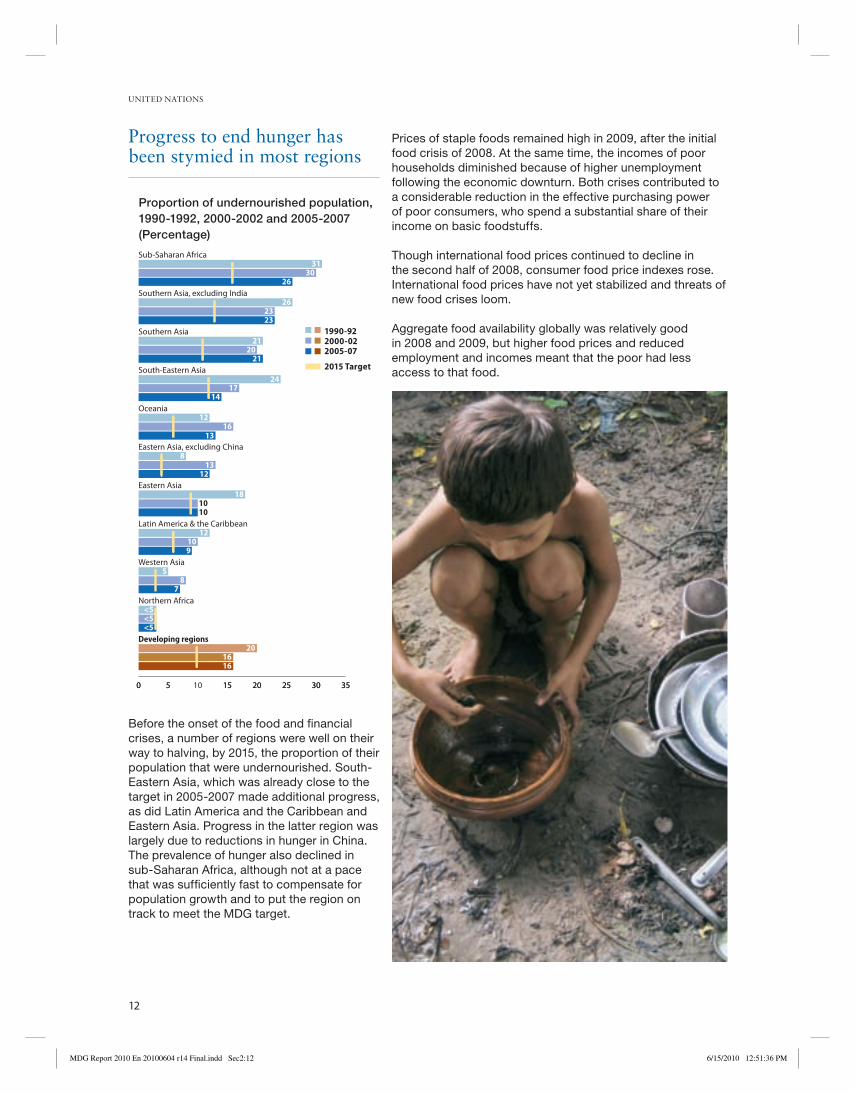
Progress to end hunger has been stymied in most regions
Before the onset of the food and fi nancial
crises, a number of regions were well on their
way to halving, by 2015, the proportion of their
population that were undernourished. South-
Eastern Asia, which was already close to the
target in 2005-2007 made additional progress,
as did Latin America and the Caribbean and
Eastern Asia. Progress in the latter region was
largely due to reductions in hunger in China.
The prevalence of hunger also declined in
sub-Saharan Africa, although not at a pace
that was suffi ciently fast to compensate for
population growth and to put the region on
track to meet the MDG target.
Prices of staple foods remained high in 2009, after the initial
food crisis of 2008. At the same time, the incomes of poor
households diminished because of higher unemployment
following the economic downturn. Both crises contributed to
a considerable reduction in the effective purchasing power
of poor consumers, who spend a substantial share of their
income on basic foodstuffs.
Though international food prices continued to decline in
the second half of 2008, consumer food price indexes rose.
International food prices have not yet stabilized and threats of
new food crises loom.
Aggregate food availability globally was relatively good
in 2008 and 2009, but higher food prices and reduced
employment and incomes meant that the poor had less
access to that food.
0 5 10 15 20 25 30 35
Developing regions
Northern Africa
Western Asia
Latin America & the Caribbean
Eastern Asia
Eastern Asia, excluding China
Oceania
South-Eastern Asia
Southern Asia
Southern Asia, excluding India
Sub-Saharan Africa
Proportion of undernourished population, 1990-1992, 2000-2002 and 2005-2007 (Percentage)
3130
26
262323
2120
21
2417
14
1216
13
813
12
181010
12109
5
<5<5<5
201616
87
0 5 15 20 25 30 35
1990-922000-022005-07
2015 Target
MDG Report 2010 En 20100604 r14 Final.indd Sec2:12MDG Report 2010 En 20100604 r14 Final.indd Sec2:12 6/15/2010 12:51:36 PM6/15/2010 12:51:36 PM
THE MILLENNIUM DEVELOPMENT GOALS REPORT 2010
13
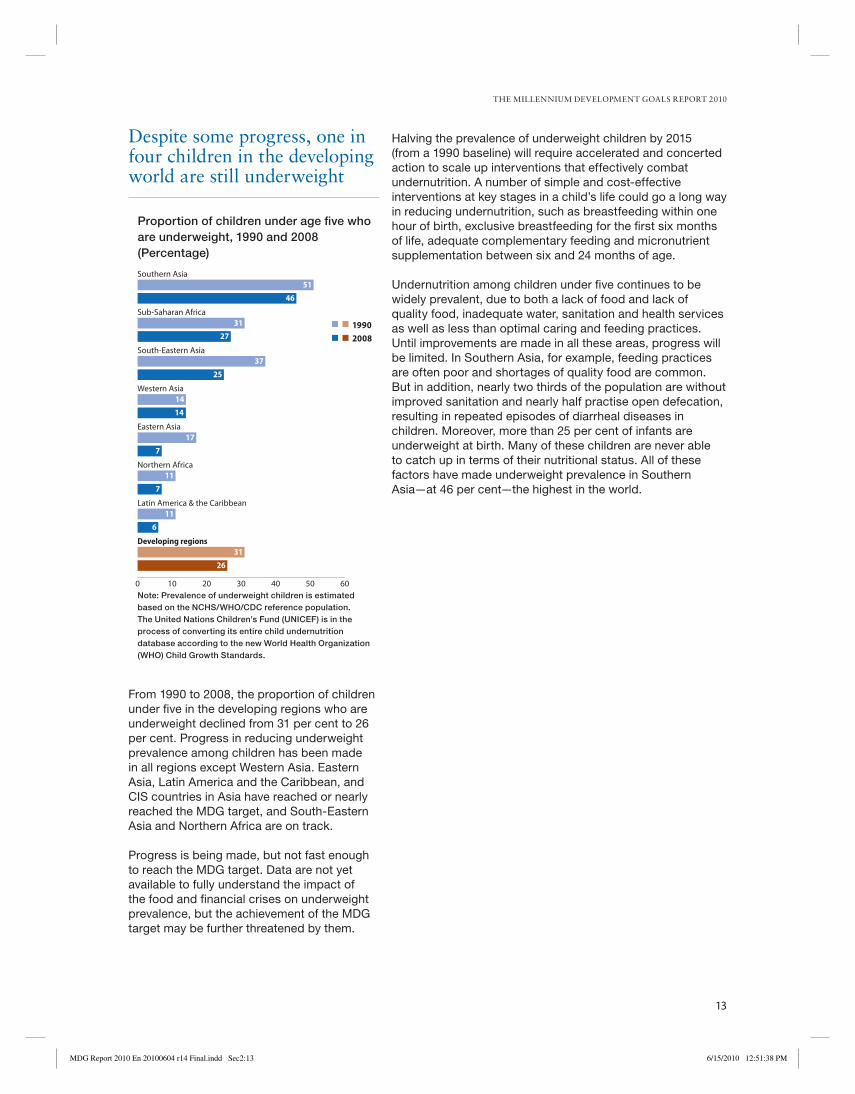
Despite some progress, one in four children in the developing world are still underweight
From 1990 to 2008, the proportion of children
under fi ve in the developing regions who are
underweight declined from 31 per cent to 26
per cent. Progress in reducing underweight
prevalence among children has been made
in all regions except Western Asia. Eastern
Asia, Latin America and the Caribbean, and
CIS countries in Asia have reached or nearly
reached the MDG target, and South-Eastern
Asia and Northern Africa are on track.
Progress is being made, but not fast enough
to reach the MDG target. Data are not yet
available to fully understand the impact of
the food and fi nancial crises on underweight
prevalence, but the achievement of the MDG
target may be further threatened by them.
Halving the prevalence of underweight children by 2015
(from a 1990 baseline) will require accelerated and concerted
action to scale up interventions that effectively combat
undernutrition. A number of simple and cost-effective
interventions at key stages in a child’s life could go a long way
in reducing undernutrition, such as breastfeeding within one
hour of birth, exclusive breastfeeding for the fi rst six months
of life, adequate complementary feeding and micronutrient
supplementation between six and 24 months of age.
Undernutrition among children under fi ve continues to be
widely prevalent, due to both a lack of food and lack of
quality food, inadequate water, sanitation and health services
as well as less than optimal caring and feeding practices.
Until improvements are made in all these areas, progress will
be limited. In Southern Asia, for example, feeding practices
are often poor and shortages of quality food are common.
But in addition, nearly two thirds of the population are without
improved sanitation and nearly half practise open defecation,
resulting in repeated episodes of diarrheal diseases in
children. Moreover, more than 25 per cent of infants are
underweight at birth. Many of these children are never able
to catch up in terms of their nutritional status. All of these
factors have made underweight prevalence in Southern
Asia—at 46 per cent—the highest in the world.
0 10 20 30 40 50 60
Developing regions
Latin America & the Caribbean
Northern Africa
Eastern Asia
Western Asia
South-Eastern Asia
Sub-Saharan Africa
Southern Asia
Proportion of children under age five who are underweight, 1990 and 2008 (Percentage)
Note: Prevalence of underweight children is estimated based on the NCHS/WHO/CDC reference population. The United Nations Children’s Fund (UNICEF) is in the process of converting its entire child undernutrition database according to the new World Health Organization (WHO) Child Growth Standards.
51
46
31
27
37
25
14
14
17
7
11
7
11
6
31
26
19902008
MDG Report 2010 En 20100604 r14 Final.indd Sec2:13MDG Report 2010 En 20100604 r14 Final.indd Sec2:13 6/15/2010 12:51:38 PM6/15/2010 12:51:38 PM

UNITED NATIONS
14
Children in rural areas are nearly twice as likely to be underweight as those in urban areas
In all developing regions, children in rural
areas are more likely to be underweight than
children living in cities and towns. In parts of
Asia and in Latin America and the Caribbean,
the relative disparity actually increased
between 1990 and 2008. In Eastern Asia,
there was a striking increase in the rural/
urban ratio (from 2.1 to 4.8), indicating that, in
2008, children in rural areas were almost fi ve
times as likely to be underweight as children
in urban areas. This region, however, has
already achieved the target—in both rural and
urban areas—of halving the 1990 underweight
prevalence: only 2 per cent of children in
urban areas are underweight, versus 9 per
cent of rural children.
South-Eastern Asia, sub-Saharan Africa and
Northern Africa have succeeded in reducing
child malnutrition more rapidly in rural areas
and in narrowing the gap with the urban
population, demonstrating that more equitable
progress is indeed possible.
In some regions, the prevalence of underweight children is dramatically higher among the poor
Across the developing world, children from the poorest
households are twice as likely to be underweight as children
from the richest households. The disparity is most dramatic
in regions with a high prevalence of underweight children.
This is the situation in Southern Asia, where as many as 60
per cent of children in the poorest families are underweight,
compared to about 25 per cent in the richest households.
0.0 1.0 2.0 3.0 4.0 5.0
Developing regions
Eastern Asia
Western Asia
Latin America & the Caribbean
Northern Africa
Sub-Saharan Africa
South-Eastern Asia
Southern Asia
Ratio between the proportion of under-five children who are underweight in rural areas and urban areas, 1990 and 2008
1.31.4
1.41.2
1.51.4
1.71.5
2.02.4
2.12.5
2.1
1.71.9
4.8
Rural children disadvantaged
Around 1990Around 2008Parity
0
10
20
30
40
50
60
70
Richest 20%Richer 20%Middle 20%Poorer 20%Poorest 20%
Proportion of under-five children who are underweight, by household wealth, around 2008 (Percentage)
Southern AsiaDeveloping regionsSub-Saharan AfricaNorthern AfricaCIS, Asia
MDG Report 2010 En 20100604 r14 Final.indd Sec2:14MDG Report 2010 En 20100604 r14 Final.indd Sec2:14 6/15/2010 12:51:39 PM6/15/2010 12:51:39 PM

THE MILLENNIUM DEVELOPMENT GOALS REPORT 2010
15
Over 42 million people have been uprooted by confl ict or persecution
Confl icts are a major threat to human security and to
hard-won MDG gains. Years after a confl ict has ended,
large populations of refugees remain in camps with limited
employment and education opportunities and inadequate
health services. Not surprisingly, refugees often become
dependent on subsistence-level assistance and lead lives of
poverty and unrealized potential.
More than 42 million people are currently displaced by
confl ict or persecution. Of these, 15.2 million are refugees
(residing outside their countries of origin) and 27.1 million
people have been uprooted but remain within the borders of
their own countries. Developing countries hosted four fi fths
of the global refugee population in 2009. They included 10.4
million people who fall under the aegis of the United Nations
High Commissioner for Refugees (UNHCR) and 4.8 million
Palestinian refugees, who are the responsibility of the United
Nations Relief and Works Agency for Palestine Refugees in
the Near East (UNRWA).
The number of refugees has remained relatively stable over
the past two years—about 15 million—in part because of the
lack of durable solutions. In 2009, some 250,000 refugees
were able to return to their homes voluntarily, the lowest level
in 20 years. Afghans and Iraqis continue to be the largest
refugee populations under the UNHCR mandate, totalling
2.9 million and 1.8 million people, respectively, at the end of
2009. Together they account for nearly half of all refugees
under UNHCR care.
Number of refugees and internally displaced persons, 2000-2009 (Millions)
0
10
20
30
40
2009200820072006200520042003200220012000
Internally displaced persons Refugees
15.9
16.0 14.6 13.7 13.813.0
14.316.0 15.2
15.2
21.225.0 25.0 24.6 25.3 23.7 24.4 26.0 26.0 27.1
MDG Report 2010 En 20100604 r14 Final.indd Sec2:15MDG Report 2010 En 20100604 r14 Final.indd Sec2:15 6/15/2010 12:51:40 PM6/15/2010 12:51:40 PM
UNITED NATIONS
16
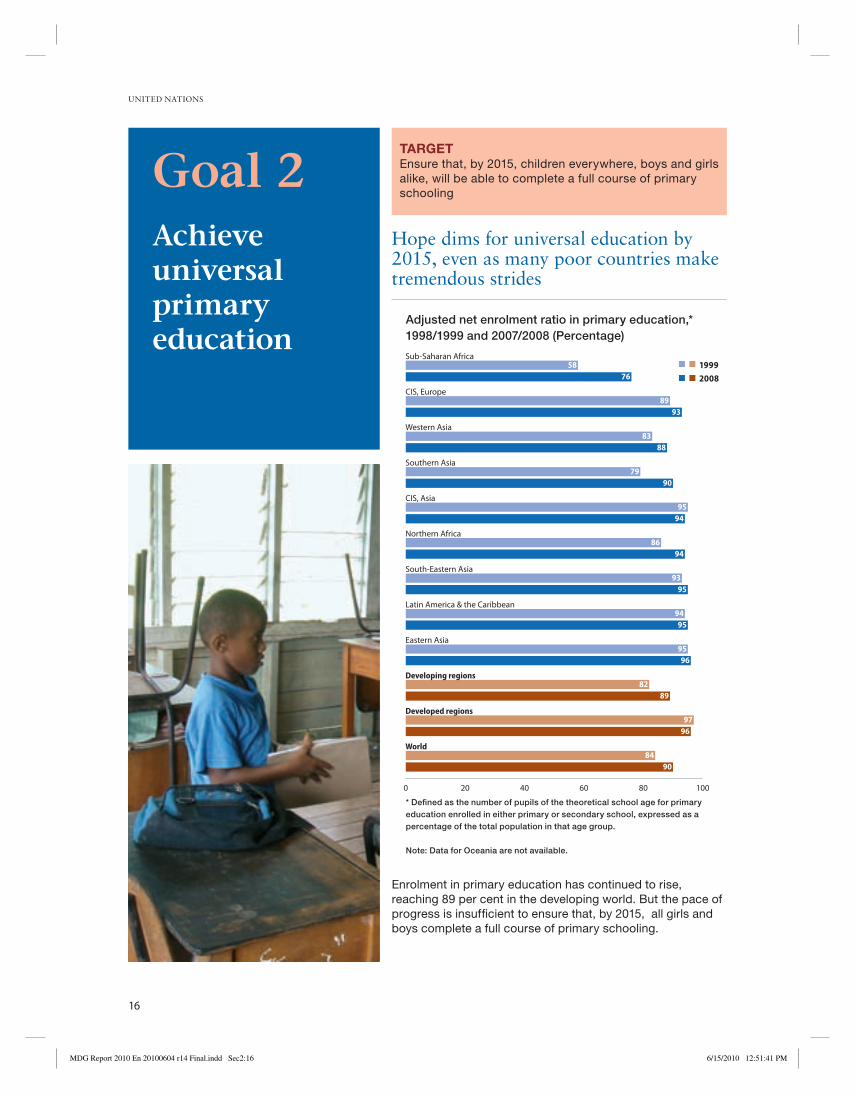
Hope dims for universal education by 2015, even as many poor countries make tremendous strides
Enrolment in primary education has continued to rise,
reaching 89 per cent in the developing world. But the pace of
progress is insuffi cient to ensure that, by 2015, all girls and
boys complete a full course of primary schooling.
TARGETEnsure that, by 2015, children everywhere, boys and girls
alike, will be able to complete a full course of primary
schoolingGoal 2Achieve universal primary education
0 20 40 60 80 100
World
Developed regions
Developing regions
Eastern Asia
Latin America & the Caribbean
South-Eastern Asia
Northern Africa
CIS, Asia
Southern Asia
Western Asia
CIS, Europe
Sub-Saharan Africa
Adjusted net enrolment ratio in primary education,* 1998/1999 and 2007/2008 (Percentage)
5876
8993
8388
7990
9594
8694
9395
9495
9596
8289
9796
8490
* Defined as the number of pupils of the theoretical school age for primary education enrolled in either primary or secondary school, expressed as a percentage of the total population in that age group.
Note: Data for Oceania are not available.
19992008
MDG Report 2010 En 20100604 r14 Final.indd Sec2:16MDG Report 2010 En 20100604 r14 Final.indd Sec2:16 6/15/2010 12:51:41 PM6/15/2010 12:51:41 PM
THE MILLENNIUM DEVELOPMENT GOALS REPORT 2010
17
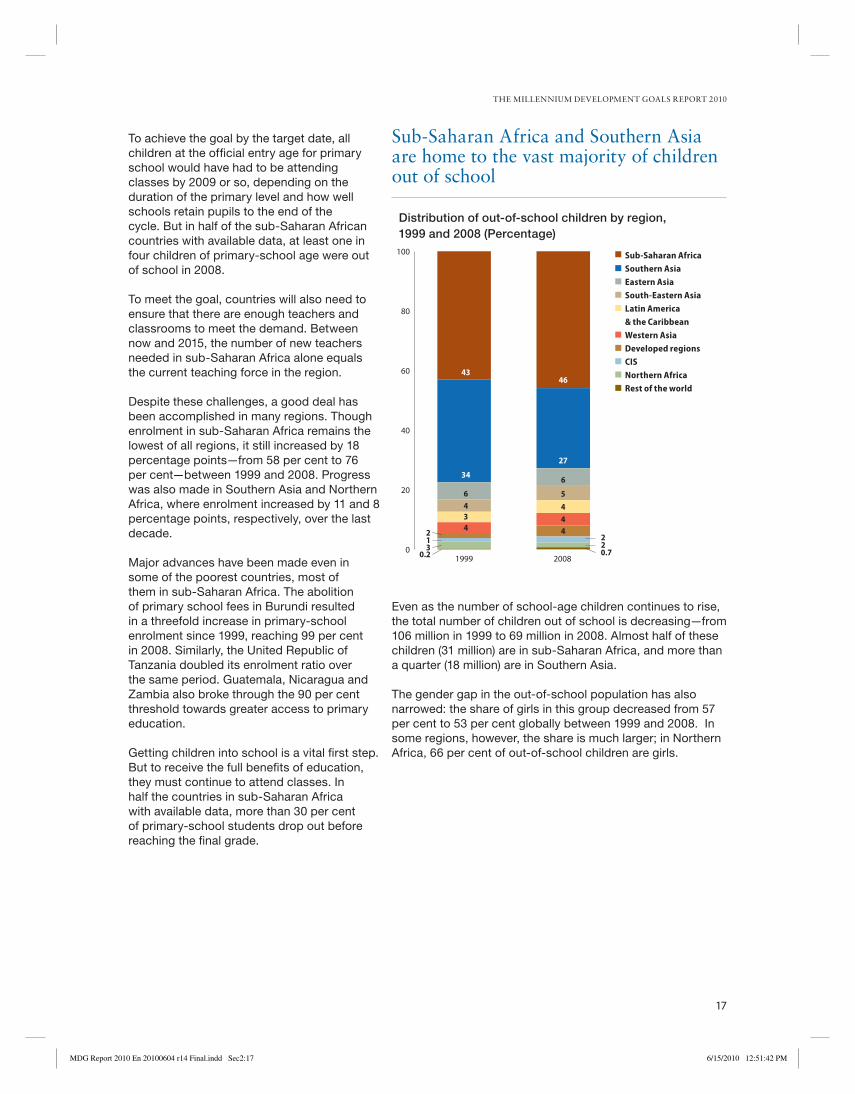
Sub-Saharan Africa and Southern Asia are home to the vast majority of children out of school
Even as the number of school-age children continues to rise,
the total number of children out of school is decreasing—from
106 million in 1999 to 69 million in 2008. Almost half of these
children (31 million) are in sub-Saharan Africa, and more than
a quarter (18 million) are in Southern Asia.
The gender gap in the out-of-school population has also
narrowed: the share of girls in this group decreased from 57
per cent to 53 per cent globally between 1999 and 2008. In
some regions, however, the share is much larger; in Northern
Africa, 66 per cent of out-of-school children are girls.
0
20
40
60
80
100
20081999
Distribution of out-of-school children by region, 1999 and 2008 (Percentage)
Sub-Saharan AfricaSouthern AsiaEastern AsiaSouth-Eastern AsiaLatin America & the CaribbeanWestern AsiaDeveloped regionsCISNorthern AfricaRest of the world
4643
27
6
5
4
44
2
34
6434
30.2
12 2
0.7
To achieve the goal by the target date, all
children at the offi cial entry age for primary
school would have had to be attending
classes by 2009 or so, depending on the
duration of the primary level and how well
schools retain pupils to the end of the
cycle. But in half of the sub-Saharan African
countries with available data, at least one in
four children of primary-school age were out
of school in 2008.
To meet the goal, countries will also need to
ensure that there are enough teachers and
classrooms to meet the demand. Between
now and 2015, the number of new teachers
needed in sub-Saharan Africa alone equals
the current teaching force in the region.
Despite these challenges, a good deal has
been accomplished in many regions. Though
enrolment in sub-Saharan Africa remains the
lowest of all regions, it still increased by 18
percentage points—from 58 per cent to 76
per cent—between 1999 and 2008. Progress
was also made in Southern Asia and Northern
Africa, where enrolment increased by 11 and 8
percentage points, respectively, over the last
decade.
Major advances have been made even in
some of the poorest countries, most of
them in sub-Saharan Africa. The abolition
of primary school fees in Burundi resulted
in a threefold increase in primary-school
enrolment since 1999, reaching 99 per cent
in 2008. Similarly, the United Republic of
Tanzania doubled its enrolment ratio over
the same period. Guatemala, Nicaragua and
Zambia also broke through the 90 per cent
threshold towards greater access to primary
education.
Getting children into school is a vital fi rst step.
But to receive the full benefi ts of education,
they must continue to attend classes. In
half the countries in sub-Saharan Africa
with available data, more than 30 per cent
of primary-school students drop out before
reaching the fi nal grade.
MDG Report 2010 En 20100604 r14 Final.indd Sec2:17MDG Report 2010 En 20100604 r14 Final.indd Sec2:17 6/15/2010 12:51:42 PM6/15/2010 12:51:42 PM
UNITED NATIONS
18
barriers to education are also common. In many countries,
educating girls is widely perceived as being of less value
than educating boys. And children with disabilities across
the world face far more limited opportunities than their non-
disabled peers.
The link between disability and marginalization in education
is evident in countries at all levels of development. In Malawi
and the United Republic of Tanzania, being disabled doubles
the probability that a child will never attend school, and in
Burkina Faso the risk rises to two and a half times. Even
in some countries that are closer to achieving the goal
of universal primary education, children with disabilities
represent the majority of those who are excluded. In Bulgaria
and Romania, net enrolment ratios for children aged 7 to
15 were over 90 per cent in 2002, but only 58 per cent for
children with disabilities.
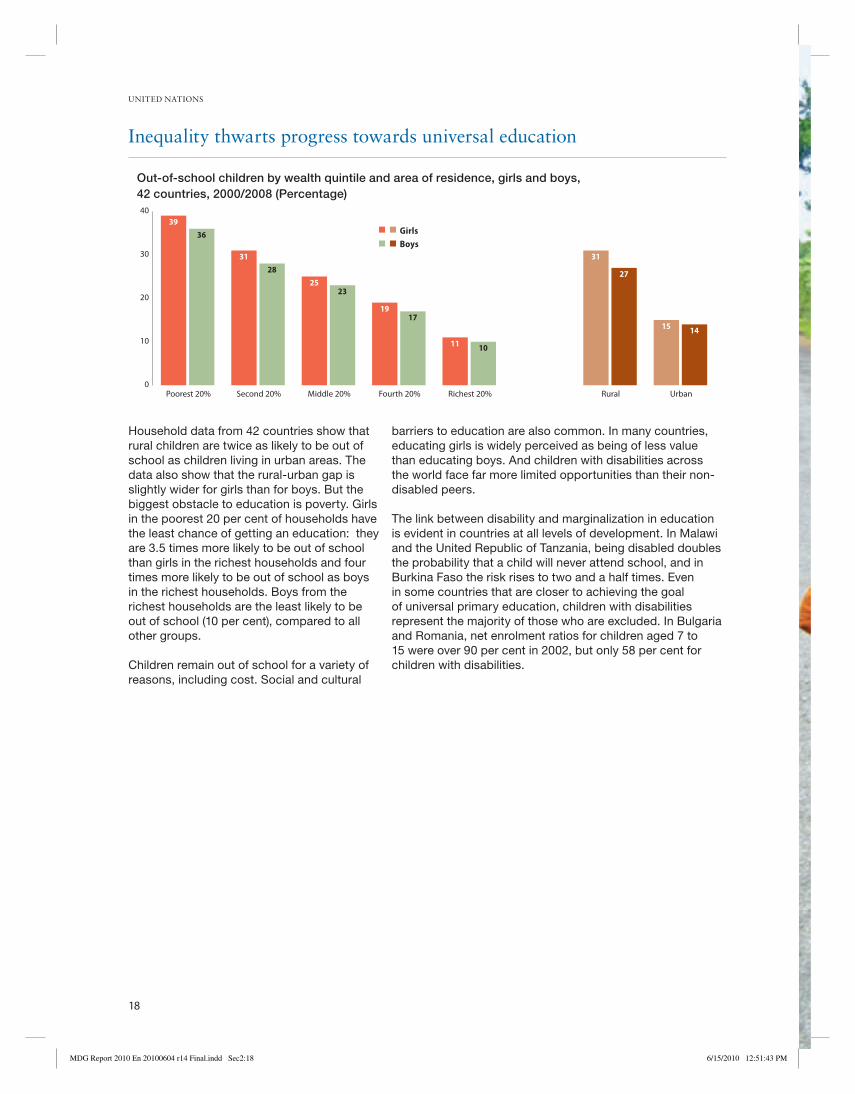
Inequality thwarts progress towards universal education
0
10
20
30
40
UrbanRural Richest 20%Fourth 20%Middle 20%Second 20%Poorest 20%
Out-of-school children by wealth quintile and area of residence, girls and boys, 42 countries, 2000/2008 (Percentage)
GirlsBoys
11 10
1917
2523
31
28
39
36
15 14
31
27
Household data from 42 countries show that
rural children are twice as likely to be out of
school as children living in urban areas. The
data also show that the rural-urban gap is
slightly wider for girls than for boys. But the
biggest obstacle to education is poverty. Girls
in the poorest 20 per cent of households have
the least chance of getting an education: they
are 3.5 times more likely to be out of school
than girls in the richest households and four
times more likely to be out of school as boys
in the richest households. Boys from the
richest households are the least likely to be
out of school (10 per cent), compared to all
other groups.
Children remain out of school for a variety of
reasons, including cost. Social and cultural
MDG Report 2010 En 20100604 r14 Final.indd Sec2:18MDG Report 2010 En 20100604 r14 Final.indd Sec2:18 6/15/2010 12:51:43 PM6/15/2010 12:51:43 PM
THE MILLENNIUM DEVELOPMENT GOALS REPORT 2010
19
MDG Report 2010 En 20100604 r14 Final.indd Sec2:19MDG Report 2010 En 20100604 r14 Final.indd Sec2:19 6/15/2010 12:51:44 PM6/15/2010 12:51:44 PM

UNITED NATIONS
20
TARGETEliminate gender disparity in primary and secondary
education, preferably by 2005, and in all levels of
education no later than 2015Goal 3Promote gender equality and empower women
For girls in some regions, education remains elusive
The developing regions as a whole are approaching gender
parity in educational enrolment. In 2008, there were 96 girls
for every 100 boys enrolled in primary school, and 95 girls
for every 100 boys enrolled in secondary school. In 1999, the
ratios were 91:100 and 88:100 for the two levels of education,
respectively. Despite this progress, gender parity in primary
and secondary education—a target that was to be met by
0 60 120
Developing regions
CIS
Latin America & the Caribbean
South-Eastern Asia
Eastern Asia
Northern Africa
Western Asia
Oceania
Southern Asia
Sub-Saharan Africa
Developing regions
Latin America & the Caribbean
Eastern Asia
South-Eastern Asia
Northern Africa
CIS
Oceania
Southern Asia
Western Asia
Sub-Saharan Africa
Developing regions
Eastern Asia
CIS
South-Eastern Asia
Latin America & the Caribbean
Southern Asia
Northern Africa
Western Asia
Sub-Saharan Africa
Oceania
20 40 80 100 140
82
121
115
95
66
74
82
81
65
71
88
107
93
95
93
101
89
75
76
83
91
101
99
96
97
84
90
87
85
91
97
130
125
107
100
95
92
84
76
67
95
108
105
103
98
98
87
87
86
79
96
104
99
97
97
96
94
92
91
89
Girls’ primary-school enrolment in relation to boys’, 1998/1999 and 2007/2008 (Girls per 100 boys)
Primary
Secondary
Tertiary
19992008
2015 Target = GPI between 97 and 103
MDG Report 2010 En 20100604 r14 Final.indd Sec2:20MDG Report 2010 En 20100604 r14 Final.indd Sec2:20 6/15/2010 12:51:45 PM6/15/2010 12:51:45 PM
THE MILLENNIUM DEVELOPMENT GOALS REPORT 2010
21
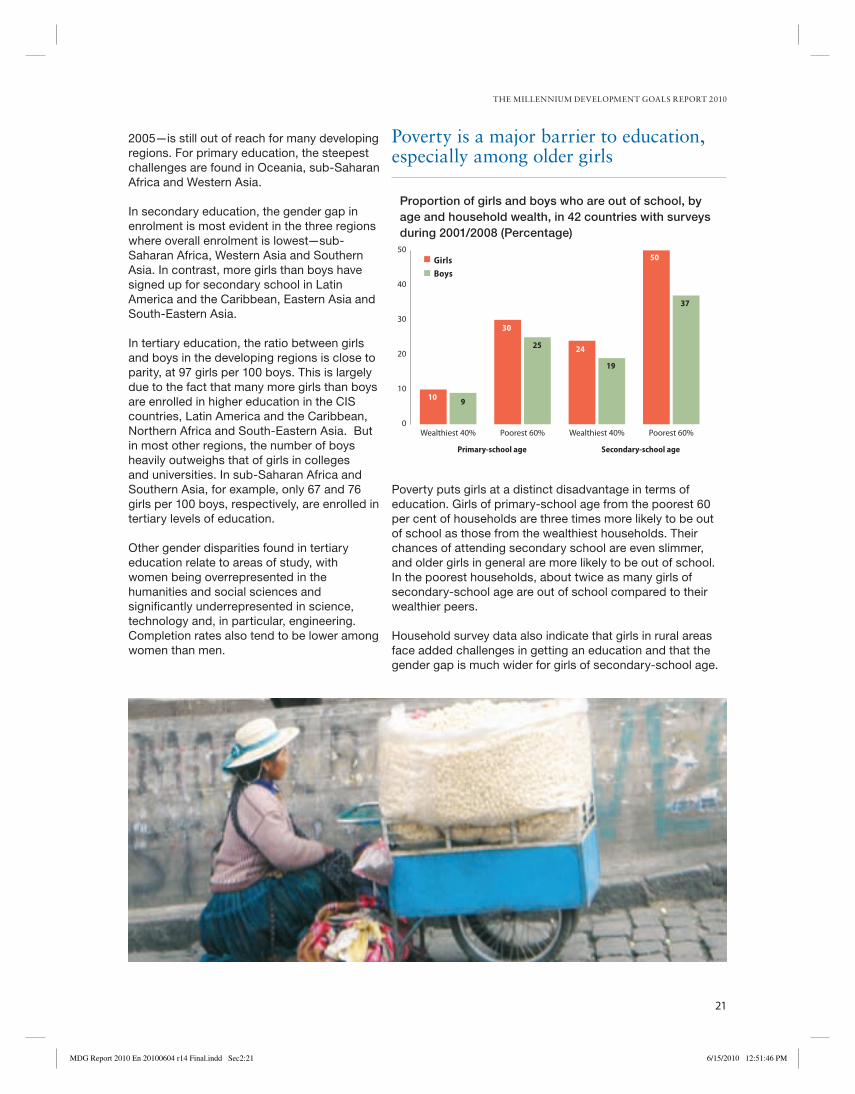
Poverty is a major barrier to education, especially among older girls
Poverty puts girls at a distinct disadvantage in terms of
education. Girls of primary-school age from the poorest 60
per cent of households are three times more likely to be out
of school as those from the wealthiest households. Their
chances of attending secondary school are even slimmer,
and older girls in general are more likely to be out of school.
In the poorest households, about twice as many girls of
secondary-school age are out of school compared to their
wealthier peers.
Household survey data also indicate that girls in rural areas
face added challenges in getting an education and that the
gender gap is much wider for girls of secondary-school age.
2005—is still out of reach for many developing
regions. For primary education, the steepest
challenges are found in Oceania, sub-Saharan
Africa and Western Asia.
In secondary education, the gender gap in
enrolment is most evident in the three regions
where overall enrolment is lowest—sub-
Saharan Africa, Western Asia and Southern
Asia. In contrast, more girls than boys have
signed up for secondary school in Latin
America and the Caribbean, Eastern Asia and
South-Eastern Asia.
In tertiary education, the ratio between girls
and boys in the developing regions is close to
parity, at 97 girls per 100 boys. This is largely
due to the fact that many more girls than boys
are enrolled in higher education in the CIS
countries, Latin America and the Caribbean,
Northern Africa and South-Eastern Asia. But
in most other regions, the number of boys
heavily outweighs that of girls in colleges
and universities. In sub-Saharan Africa and
Southern Asia, for example, only 67 and 76
girls per 100 boys, respectively, are enrolled in
tertiary levels of education.
Other gender disparities found in tertiary
education relate to areas of study, with
women being overrepresented in the
humanities and social sciences and
signifi cantly underrepresented in science,
technology and, in particular, engineering.
Completion rates also tend to be lower among
women than men.
0
10
20
30
40
50
Proportion of girls and boys who are out of school, by age and household wealth, in 42 countries with surveys during 2001/2008 (Percentage)
10 9
30
25 24
19
50
37
Primary-school age Secondary-school age
Poorest 60%Wealthiest 40%Poorest 60%Wealthiest 40%
GirlsBoys
MDG Report 2010 En 20100604 r14 Final.indd Sec2:21MDG Report 2010 En 20100604 r14 Final.indd Sec2:21 6/15/2010 12:51:46 PM6/15/2010 12:51:46 PM

UNITED NATIONS
22
In every developing region except the CIS, men outnumber women in paid employment
Globally, the share of women in paid employment outside
the agricultural sector has continued to increase slowly and
reached 41 per cent in 2008. But women in some regions
are seriously lagging behind. In Southern Asia, Northern
Africa and Western Asia, only 20 per cent of those employed
outside agriculture are women. Gender equality in the labour
market is also a concern in sub-Saharan Africa, where only
one in three paid jobs outside of agriculture are occupied by
women.
But even when women represent a large share of waged
workers, it does not mean that they have secure, decent jobs.
In fact, women are typically paid less and have less secure
employment than men.
In countries where the agricultural sector predominates,
women are mostly employed in agriculture and largely in
vulnerable jobs—in subsistence farming, as unpaid family
workers or as own-account workers—with no or little fi nancial
security or social benefi ts.
201520082005200019951990
Employees in non-agricultural wage employment who are women, 1990–2008, and projections to 2015 (Percentage)
0
10
20
30
40
50
60
CIS
Latin America & the CaribbeanEastern Asia
South-Eastern Asia
Sub-SaharanAfrica
Northern Africa
Southern Asia
Oceania
Western Asia
50.6 51.5
42.445.1
41.242.5
38.139.2
36.0
37.1
20.1 21.8
32.4
36.7
19.2
22.2
19.2 19.2
MDG Report 2010 En 20100604 r14 Final.indd Sec2:22MDG Report 2010 En 20100604 r14 Final.indd Sec2:22 6/15/2010 12:51:48 PM6/15/2010 12:51:48 PM
THE MILLENNIUM DEVELOPMENT GOALS REPORT 2010
23
Women are largely relegated to more vulnerable forms of employment
0 20 40 60 80 100
Developing regions
Transition countries of South-Eastern Europe
CIS
Latin America & the Caribbean
Western Asia
Northern Africa
Eastern Asia
South-Eastern Asia
Southern Asia
Sub-Saharan Africa
Oceania
Proportion of own-account and contributing family workers in total employment, 2009 projections (Percentage)
65
26
17
31
37
53
58
65
84
84
85
57
30
20
32
26
28
50
58
74
71
73
WomenMen
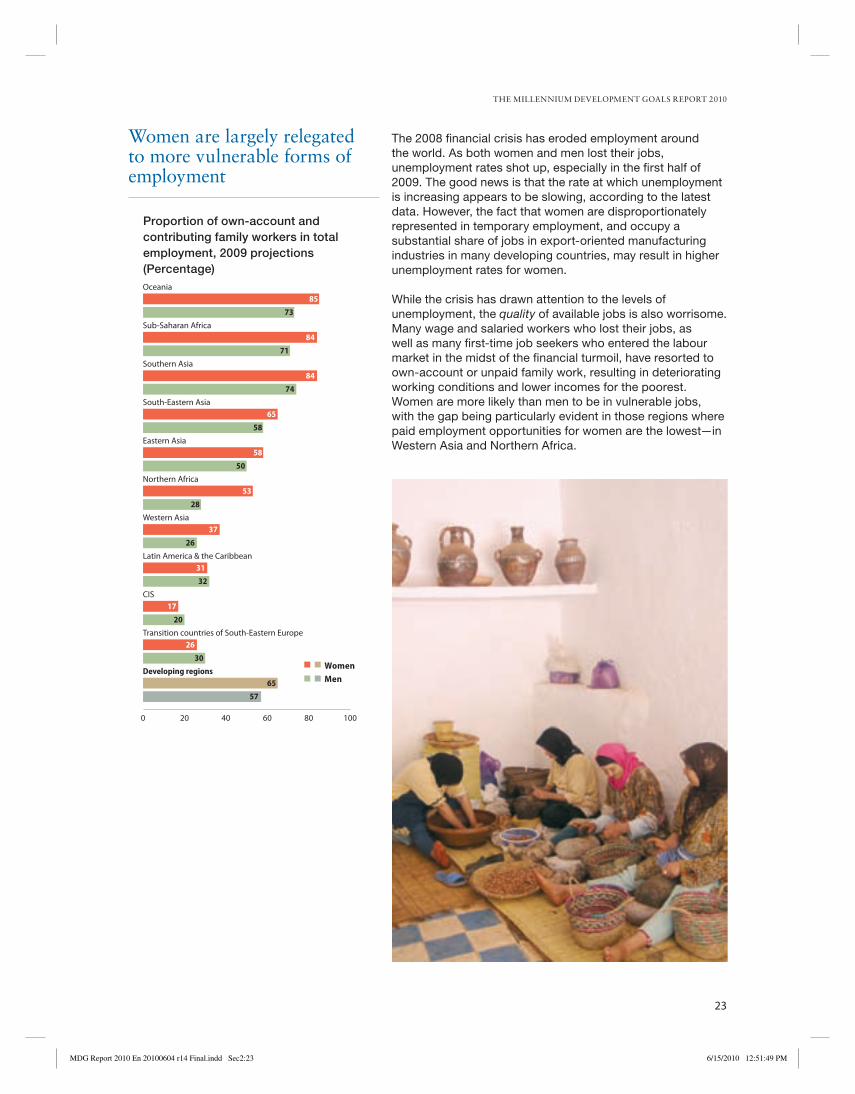
The 2008 fi nancial crisis has eroded employment around
the world. As both women and men lost their jobs,
unemployment rates shot up, especially in the fi rst half of
2009. The good news is that the rate at which unemployment
is increasing appears to be slowing, according to the latest
data. However, the fact that women are disproportionately
represented in temporary employment, and occupy a
substantial share of jobs in export-oriented manufacturing
industries in many developing countries, may result in higher
unemployment rates for women.
While the crisis has drawn attention to the levels of
unemployment, the quality of available jobs is also worrisome.
Many wage and salaried workers who lost their jobs, as
well as many fi rst-time job seekers who entered the labour
market in the midst of the fi nancial turmoil, have resorted to
own-account or unpaid family work, resulting in deteriorating
working conditions and lower incomes for the poorest.
Women are more likely than men to be in vulnerable jobs,
with the gap being particularly evident in those regions where
paid employment opportunities for women are the lowest—in
Western Asia and Northern Africa.
MDG Report 2010 En 20100604 r14 Final.indd Sec2:23MDG Report 2010 En 20100604 r14 Final.indd Sec2:23 6/15/2010 12:51:49 PM6/15/2010 12:51:49 PM

UNITED NATIONS
24
Top-level jobs still go to men — to an overwhelming degree
Though the number of women who secured paid jobs
outside the agricultural sector increased between 1990 and
2008, women have generally failed to access higher-level
positions. The top jobs—as senior offi cials or managers—are
still dominated by men. Globally, only one in four senior
offi cials or managers are women. And in all regions, women
are underrepresented among high-level workers, accounting
for 30 per cent or more of such positions in only three out
of 10 regions. In Western Asia, Southern Asia and Northern
Africa, less than 10 per cent of top-level positions are held by
women.
Women are overrepresented in informal employment, with its lack of benefi ts and security
It is likely that the recent fi nancial crisis has
also led to a surge in informal employment
due to job losses in the formal sector. In
some developing countries, over 80 per cent
of workers have informal jobs—as owners
of informal-sector businesses, contributing
family workers or employees without written
contracts or social security benefi ts (including
subcontracted workers operating from home
and domestic services workers). In most of
these countries, women are overrepresented
in informal employment.
0 20 40 60 80 100
Russian Federation
Republic of Moldova
Turkey
Kyrgyzstan
Panama
Venezuela
Brazil (urban areas)
Mexico
Colombia
South Africa
Peru (metropolitan Lima)
Ecuador (urban areas)
India
Mali
Informal employment as a percentage of total non-agricultural employment, women and men, selected countries, 2003/2005 (Percentage)
10
25
35
47
49
47
50
48
61
51
65
73
84
74
8
18
36
41
50
52
52
54
62
65
72
77
88
89
WomenMen
0 10 20 30 40 50
Developed regions
Southern Asia
Northern Africa
Western Asia
Eastern Asia
Oceania
South-Eastern Asia
Sub-Saharan Africa
Latin America & the Caribbean
CIS
Share of women in top-level and all occupations, average for the period 2000/2008 (Percentage)
20
20
24
45
39
39
45
36
45
49
9
9
10
16
21
26
29
32
32
37
All occupationsSenior officialsand managers
MDG Report 2010 En 20100604 r14 Final.indd Sec2:24MDG Report 2010 En 20100604 r14 Final.indd Sec2:24 6/15/2010 12:51:50 PM6/15/2010 12:51:50 PM
THE MILLENNIUM DEVELOPMENT GOALS REPORT 2010
25
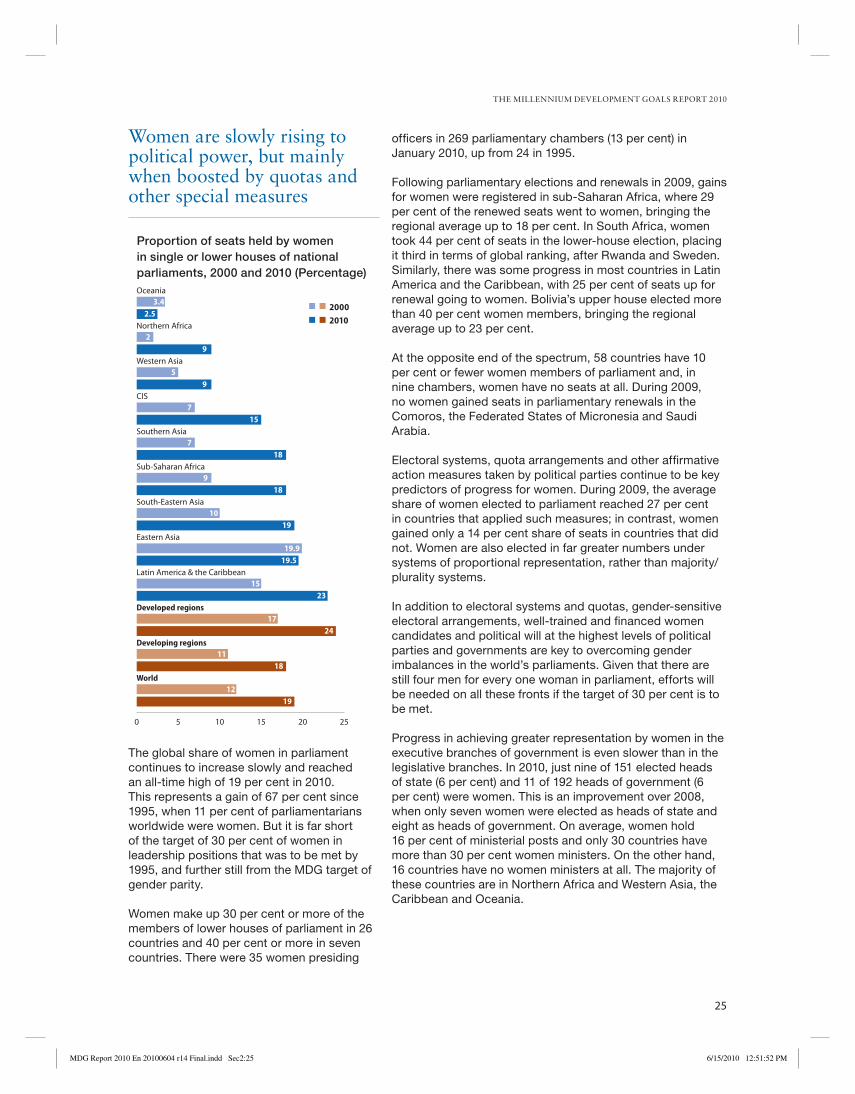
Women are slowly rising to political power, but mainly when boosted by quotas and other special measures
The global share of women in parliament
continues to increase slowly and reached
an all-time high of 19 per cent in 2010.
This represents a gain of 67 per cent since
1995, when 11 per cent of parliamentarians
worldwide were women. But it is far short
of the target of 30 per cent of women in
leadership positions that was to be met by
1995, and further still from the MDG target of
gender parity.
Women make up 30 per cent or more of the
members of lower houses of parliament in 26
countries and 40 per cent or more in seven
countries. There were 35 women presiding
0 5 10 15 20 25
World
Developing regions
Developed regions
Latin America & the Caribbean
Eastern Asia
South-Eastern Asia
Sub-Saharan Africa
Southern Asia
CIS
Western Asia
Northern Africa
Oceania
Proportion of seats held by women in single or lower houses of national parliaments, 2000 and 2010 (Percentage)
19
18
24
23
19.5
19
18
18
15
9
9
2.5
12
11
17
15
19.9
10
9
7
7
5
2
3.420002010
offi cers in 269 parliamentary chambers (13 per cent) in
January 2010, up from 24 in 1995.
Following parliamentary elections and renewals in 2009, gains
for women were registered in sub-Saharan Africa, where 29
per cent of the renewed seats went to women, bringing the
regional average up to 18 per cent. In South Africa, women
took 44 per cent of seats in the lower-house election, placing
it third in terms of global ranking, after Rwanda and Sweden.
Similarly, there was some progress in most countries in Latin
America and the Caribbean, with 25 per cent of seats up for
renewal going to women. Bolivia’s upper house elected more
than 40 per cent women members, bringing the regional
average up to 23 per cent.
At the opposite end of the spectrum, 58 countries have 10
per cent or fewer women members of parliament and, in
nine chambers, women have no seats at all. During 2009,
no women gained seats in parliamentary renewals in the
Comoros, the Federated States of Micronesia and Saudi
Arabia.
Electoral systems, quota arrangements and other affi rmative
action measures taken by political parties continue to be key
predictors of progress for women. During 2009, the average
share of women elected to parliament reached 27 per cent
in countries that applied such measures; in contrast, women
gained only a 14 per cent share of seats in countries that did
not. Women are also elected in far greater numbers under
systems of proportional representation, rather than majority/
plurality systems.
In addition to electoral systems and quotas, gender-sensitive
electoral arrangements, well-trained and fi nanced women
candidates and political will at the highest levels of political
parties and governments are key to overcoming gender
imbalances in the world’s parliaments. Given that there are
still four men for every one woman in parliament, efforts will
be needed on all these fronts if the target of 30 per cent is to
be met.
Progress in achieving greater representation by women in the
executive branches of government is even slower than in the
legislative branches. In 2010, just nine of 151 elected heads
of state (6 per cent) and 11 of 192 heads of government (6
per cent) were women. This is an improvement over 2008,
when only seven women were elected as heads of state and
eight as heads of government. On average, women hold
16 per cent of ministerial posts and only 30 countries have
more than 30 per cent women ministers. On the other hand,
16 countries have no women ministers at all. The majority of
these countries are in Northern Africa and Western Asia, the
Caribbean and Oceania.
MDG Report 2010 En 20100604 r14 Final.indd Sec2:25MDG Report 2010 En 20100604 r14 Final.indd Sec2:25 6/15/2010 12:51:52 PM6/15/2010 12:51:52 PM
UNITED NATIONS
26
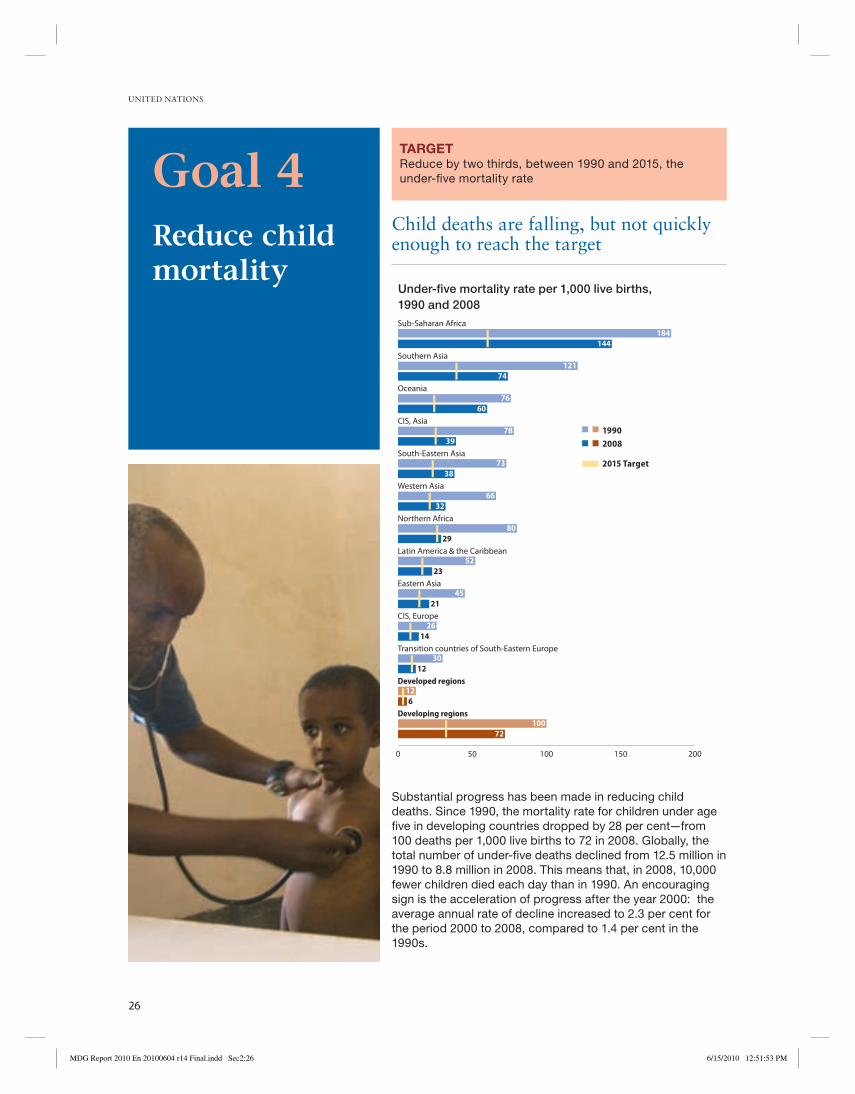
Child deaths are falling, but not quickly enough to reach the target
Substantial progress has been made in reducing child
deaths. Since 1990, the mortality rate for children under age
fi ve in developing countries dropped by 28 per cent—from
100 deaths per 1,000 live births to 72 in 2008. Globally, the
total number of under-fi ve deaths declined from 12.5 million in
1990 to 8.8 million in 2008. This means that, in 2008, 10,000
fewer children died each day than in 1990. An encouraging
sign is the acceleration of progress after the year 2000: the
average annual rate of decline increased to 2.3 per cent for
the period 2000 to 2008, compared to 1.4 per cent in the
1990s.
TARGETReduce by two thirds, between 1990 and 2015, the
under-fi ve mortality rateGoal 4Reduce child mortality
0 50 100 150 200
Developing regions
Developed regions
Transition countries of South-Eastern Europe
CIS, Europe
Eastern Asia
Latin America & the Caribbean
Northern Africa
Western Asia
South-Eastern Asia
CIS, Asia
Oceania
Southern Asia
Sub-Saharan Africa
Under-five mortality rate per 1,000 live births, 1990 and 2008
184144
12174
7660
39
7338
6632
8029
5223
4521
2614
3012
126
10072
78 19902008
2015 Target
MDG Report 2010 En 20100604 r14 Final.indd Sec2:26MDG Report 2010 En 20100604 r14 Final.indd Sec2:26 6/15/2010 12:51:53 PM6/15/2010 12:51:53 PM
THE MILLENNIUM DEVELOPMENT GOALS REPORT 2010
27
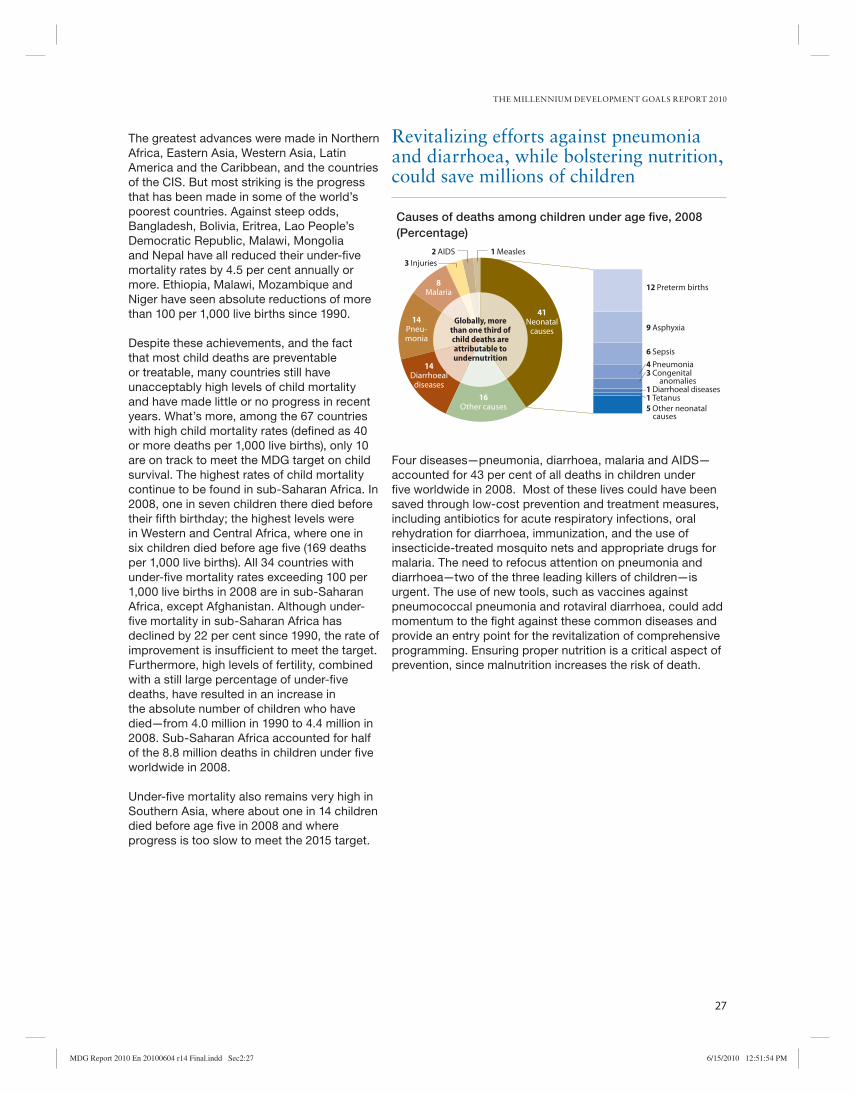
Revitalizing efforts against pneumonia and diarrhoea, while bolstering nutrition, could save millions of children
Four diseases—pneumonia, diarrhoea, malaria and AIDS—
accounted for 43 per cent of all deaths in children under
fi ve worldwide in 2008. Most of these lives could have been
saved through low-cost prevention and treatment measures,
including antibiotics for acute respiratory infections, oral
rehydration for diarrhoea, immunization, and the use of
insecticide-treated mosquito nets and appropriate drugs for
malaria. The need to refocus attention on pneumonia and
diarrhoea—two of the three leading killers of children—is
urgent. The use of new tools, such as vaccines against
pneumococcal pneumonia and rotaviral diarrhoea, could add
momentum to the fi ght against these common diseases and
provide an entry point for the revitalization of comprehensive
programming. Ensuring proper nutrition is a critical aspect of
prevention, since malnutrition increases the risk of death.
The greatest advances were made in Northern
Africa, Eastern Asia, Western Asia, Latin
America and the Caribbean, and the countries
of the CIS. But most striking is the progress
that has been made in some of the world’s
poorest countries. Against steep odds,
Bangladesh, Bolivia, Eritrea, Lao People’s
Democratic Republic, Malawi, Mongolia
and Nepal have all reduced their under-fi ve
mortality rates by 4.5 per cent annually or
more. Ethiopia, Malawi, Mozambique and
Niger have seen absolute reductions of more
than 100 per 1,000 live births since 1990.
Despite these achievements, and the fact
that most child deaths are preventable
or treatable, many countries still have
unacceptably high levels of child mortality
and have made little or no progress in recent
years. What’s more, among the 67 countries
with high child mortality rates (defi ned as 40
or more deaths per 1,000 live births), only 10
are on track to meet the MDG target on child
survival. The highest rates of child mortality
continue to be found in sub-Saharan Africa. In
2008, one in seven children there died before
their fi fth birthday; the highest levels were
in Western and Central Africa, where one in
six children died before age fi ve (169 deaths
per 1,000 live births). All 34 countries with
under-fi ve mortality rates exceeding 100 per
1,000 live births in 2008 are in sub-Saharan
Africa, except Afghanistan. Although under-
fi ve mortality in sub-Saharan Africa has
declined by 22 per cent since 1990, the rate of
improvement is insuffi cient to meet the target.
Furthermore, high levels of fertility, combined
with a still large percentage of under-fi ve
deaths, have resulted in an increase in
the absolute number of children who have
died—from 4.0 million in 1990 to 4.4 million in
2008. Sub-Saharan Africa accounted for half
of the 8.8 million deaths in children under fi ve
worldwide in 2008.
Under-fi ve mortality also remains very high in
Southern Asia, where about one in 14 children
died before age fi ve in 2008 and where
progress is too slow to meet the 2015 target.
Causes of deaths among children under age five, 2008(Percentage)
41Neonatal
causes
12 Preterm births
9 Asphyxia
6 Sepsis
1 Diarrhoeal diseases
4 Pneumonia
1 Tetanus
3 Congenital anomalies
5 Other neonatal causes
8Malaria
3 Injuries2 AIDS 1 Measles
16Other causes
Globally, morethan one third ofchild deaths areattributable toundernutrition
14Pneu-monia
14Diarrhoeal
diseases
MDG Report 2010 En 20100604 r14 Final.indd Sec2:27MDG Report 2010 En 20100604 r14 Final.indd Sec2:27 6/15/2010 12:51:54 PM6/15/2010 12:51:54 PM
UNITED NATIONS
28
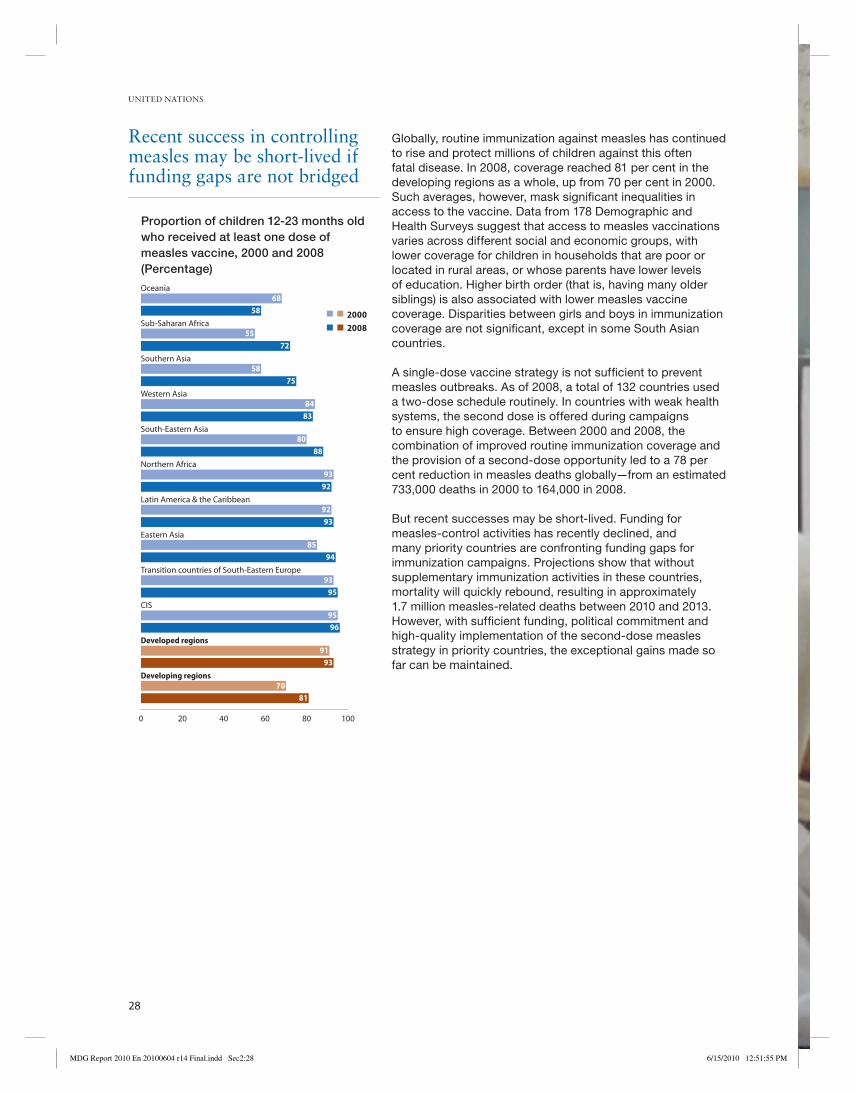
Globally, routine immunization against measles has continued
to rise and protect millions of children against this often
fatal disease. In 2008, coverage reached 81 per cent in the
developing regions as a whole, up from 70 per cent in 2000.
Such averages, however, mask signifi cant inequalities in
access to the vaccine. Data from 178 Demographic and
Health Surveys suggest that access to measles vaccinations
varies across different social and economic groups, with
lower coverage for children in households that are poor or
located in rural areas, or whose parents have lower levels
of education. Higher birth order (that is, having many older
siblings) is also associated with lower measles vaccine
coverage. Disparities between girls and boys in immunization
coverage are not signifi cant, except in some South Asian
countries.
A single-dose vaccine strategy is not suffi cient to prevent
measles outbreaks. As of 2008, a total of 132 countries used
a two-dose schedule routinely. In countries with weak health
systems, the second dose is offered during campaigns
to ensure high coverage. Between 2000 and 2008, the
combination of improved routine immunization coverage and
the provision of a second-dose opportunity led to a 78 per
cent reduction in measles deaths globally—from an estimated
733,000 deaths in 2000 to 164,000 in 2008.
But recent successes may be short-lived. Funding for
measles-control activities has recently declined, and
many priority countries are confronting funding gaps for
immunization campaigns. Projections show that without
supplementary immunization activities in these countries,
mortality will quickly rebound, resulting in approximately
1.7 million measles-related deaths between 2010 and 2013.
However, with suffi cient funding, political commitment and
high-quality implementation of the second-dose measles
strategy in priority countries, the exceptional gains made so
far can be maintained.
Recent success in controlling measles may be short-lived if funding gaps are not bridged
0 20 40 60 80 100
Developing regions
Developed regions
CIS
Transition countries of South-Eastern Europe
Eastern Asia
Latin America & the Caribbean
Northern Africa
South-Eastern Asia
Western Asia
Southern Asia
Sub-Saharan Africa
Oceania
Proportion of children 12-23 months old who received at least one dose of measles vaccine, 2000 and 2008 (Percentage)
20002008
6858
5572
5875
83
8088
9392
9293
8594
9395
9596
9193
7081
84
MDG Report 2010 En 20100604 r14 Final.indd Sec2:28MDG Report 2010 En 20100604 r14 Final.indd Sec2:28 6/15/2010 12:51:55 PM6/15/2010 12:51:55 PM
THE MILLENNIUM DEVELOPMENT GOALS REPORT 2010
29
MDG Report 2010 En 20100604 r14 Final.indd Sec2:29MDG Report 2010 En 20100604 r14 Final.indd Sec2:29 6/15/2010 12:51:56 PM6/15/2010 12:51:56 PM
UNITED NATIONS
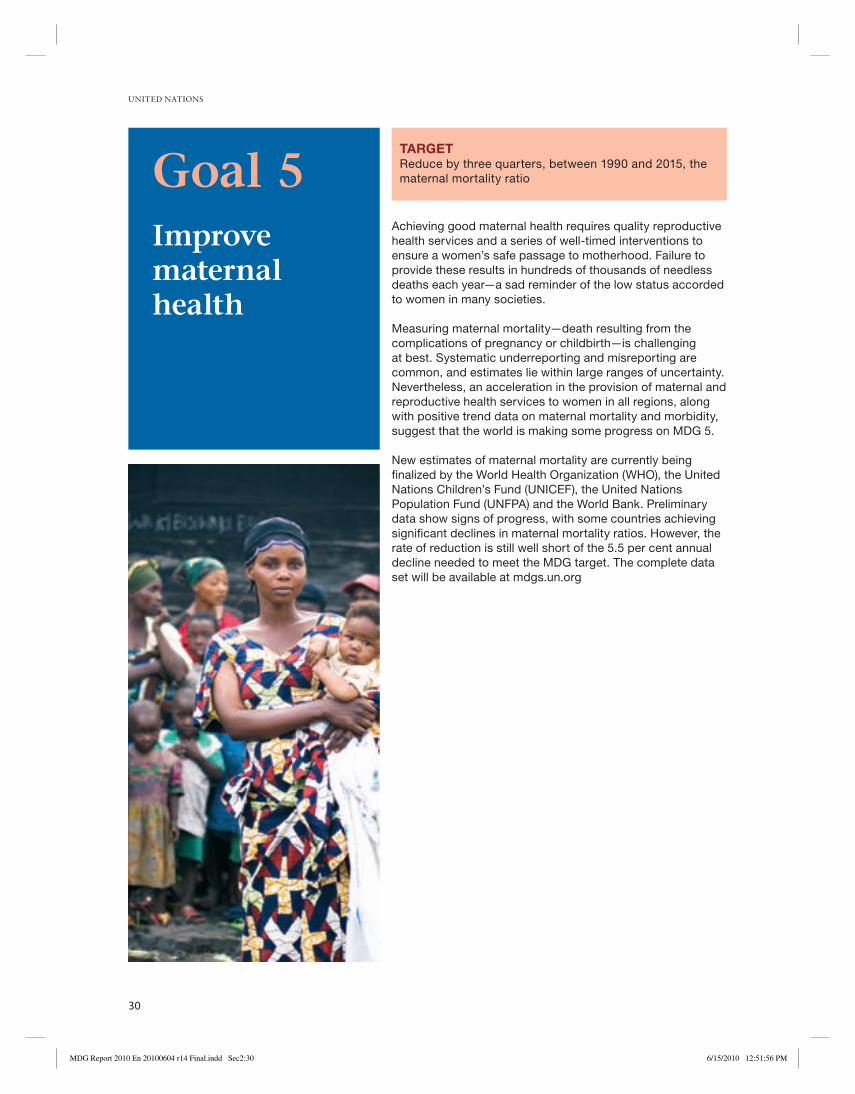
30
Achieving good maternal health requires quality reproductive
health services and a series of well-timed interventions to
ensure a women’s safe passage to motherhood. Failure to
provide these results in hundreds of thousands of needless
deaths each year—a sad reminder of the low status accorded
to women in many societies.
Measuring maternal mortality—death resulting from the
complications of pregnancy or childbirth—is challenging
at best. Systematic underreporting and misreporting are
common, and estimates lie within large ranges of uncertainty.
Nevertheless, an acceleration in the provision of maternal and
reproductive health services to women in all regions, along
with positive trend data on maternal mortality and morbidity,
suggest that the world is making some progress on MDG 5.
New estimates of maternal mortality are currently being
fi nalized by the World Health Organization (WHO), the United
Nations Children’s Fund (UNICEF), the United Nations
Population Fund (UNFPA) and the World Bank. Preliminary
data show signs of progress, with some countries achieving
signifi cant declines in maternal mortality ratios. However, the
rate of reduction is still well short of the 5.5 per cent annual
decline needed to meet the MDG target. The complete data
set will be available at mdgs.un.org
TARGETReduce by three quarters, between 1990 and 2015, the
maternal mortality ratioGoal 5Improve maternal health
MDG Report 2010 En 20100604 r14 Final.indd Sec2:30MDG Report 2010 En 20100604 r14 Final.indd Sec2:30 6/15/2010 12:51:56 PM6/15/2010 12:51:56 PM
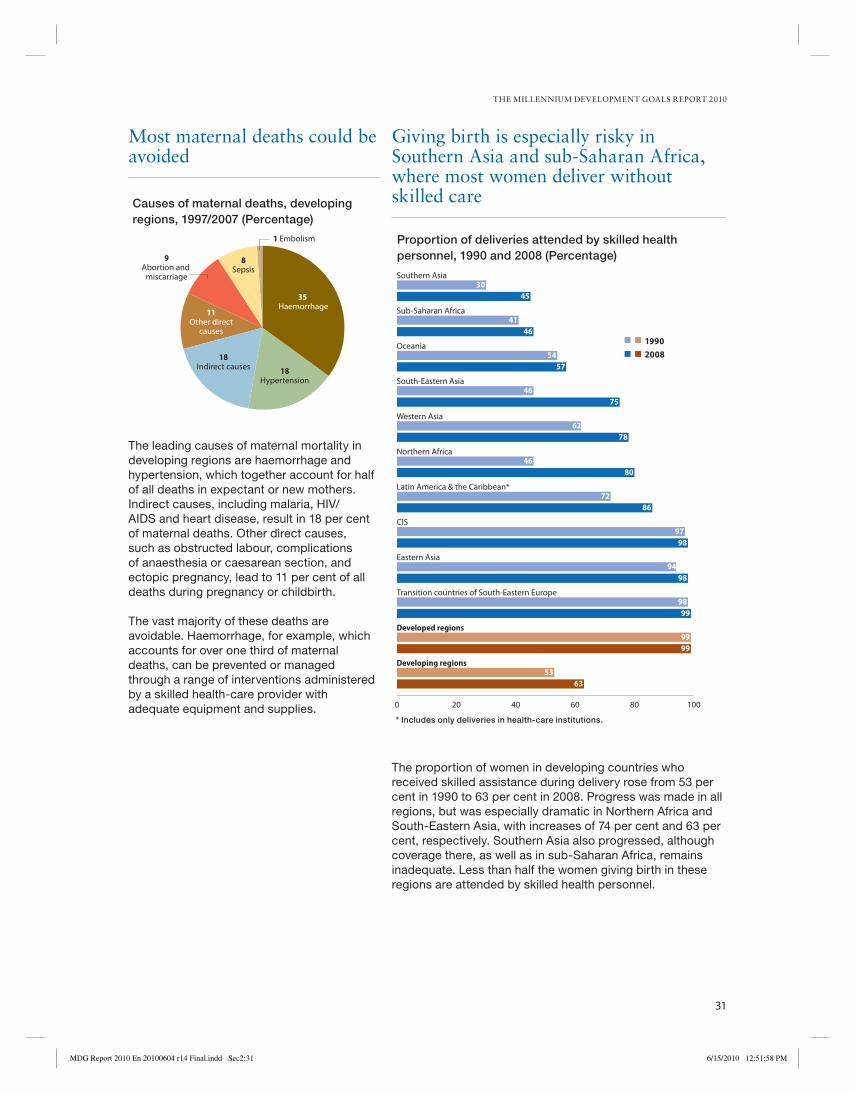
THE MILLENNIUM DEVELOPMENT GOALS REPORT 2010
31
Most maternal deaths could be avoided
The leading causes of maternal mortality in
developing regions are haemorrhage and
hypertension, which together account for half
of all deaths in expectant or new mothers.
Indirect causes, including malaria, HIV/
AIDS and heart disease, result in 18 per cent
of maternal deaths. Other direct causes,
such as obstructed labour, complications
of anaesthesia or caesarean section, and
ectopic pregnancy, lead to 11 per cent of all
deaths during pregnancy or childbirth.
The vast majority of these deaths are
avoidable. Haemorrhage, for example, which
accounts for over one third of maternal
deaths, can be prevented or managed
through a range of interventions administered
by a skilled health-care provider with
adequate equipment and supplies.
Giving birth is especially risky in Southern Asia and sub-Saharan Africa, where most women deliver without skilled care
The proportion of women in developing countries who
received skilled assistance during delivery rose from 53 per
cent in 1990 to 63 per cent in 2008. Progress was made in all
regions, but was especially dramatic in Northern Africa and
South-Eastern Asia, with increases of 74 per cent and 63 per
cent, respectively. Southern Asia also progressed, although
coverage there, as well as in sub-Saharan Africa, remains
inadequate. Less than half the women giving birth in these
regions are attended by skilled health personnel.
Causes of maternal deaths, developingregions, 1997/2007 (Percentage)
35 Haemorrhage
18Indirect causes 18
Hypertension
11Other direct
causes
9Abortion and
miscarriage
1 Embolism
8Sepsis
0 20 40 60 80 100
Developing regions
Developed regions
Transition countries of South-Eastern Europe
Eastern Asia
CIS
Latin America & the Caribbean*
Northern Africa
Western Asia
South-Eastern Asia
Oceania
Sub-Saharan Africa
Southern Asia
Proportion of deliveries attended by skilled health personnel, 1990 and 2008 (Percentage)
94
97
72
46
62
46
54
41
98
30
98
98
86
80
78
75
57
46
99
9999
5363
45
* Includes only deliveries in health-care institutions.
19902008
MDG Report 2010 En 20100604 r14 Final.indd Sec2:31MDG Report 2010 En 20100604 r14 Final.indd Sec2:31 6/15/2010 12:51:58 PM6/15/2010 12:51:58 PM
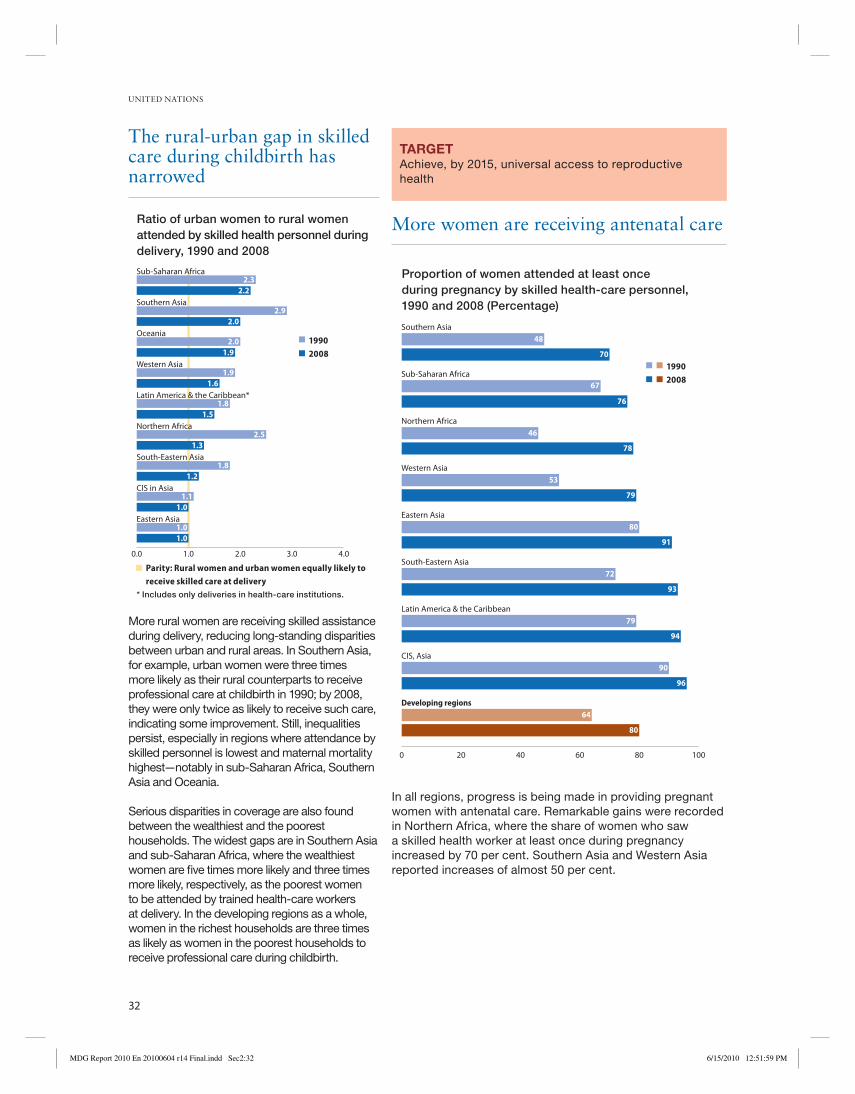
UNITED NATIONS
32
The rural-urban gap in skilled care during childbirth has narrowed
More rural women are receiving skilled assistance
during delivery, reducing long-standing disparities
between urban and rural areas. In Southern Asia,
for example, urban women were three times
more likely as their rural counterparts to receive
professional care at childbirth in 1990; by 2008,
they were only twice as likely to receive such care,
indicating some improvement. Still, inequalities
persist, especially in regions where attendance by
skilled personnel is lowest and maternal mortality
highest—notably in sub-Saharan Africa, Southern
Asia and Oceania.
Serious disparities in coverage are also found
between the wealthiest and the poorest
households. The widest gaps are in Southern Asia
and sub-Saharan Africa, where the wealthiest
women are fi ve times more likely and three times
more likely, respectively, as the poorest women
to be attended by trained health-care workers
at delivery. In the developing regions as a whole,
women in the richest households are three times
as likely as women in the poorest households to
receive professional care during childbirth.
More women are receiving antenatal care
TARGETAchieve, by 2015, universal access to reproductive
health
In all regions, progress is being made in providing pregnant
women with antenatal care. Remarkable gains were recorded
in Northern Africa, where the share of women who saw
a skilled health worker at least once during pregnancy
increased by 70 per cent. Southern Asia and Western Asia
reported increases of almost 50 per cent.
0.0 1.0 2.0 3.0 4.0
Eastern Asia
CIS in Asia
South-Eastern Asia
Northern Africa
Latin America & the Caribbean*
Western Asia
Oceania
Southern Asia
Sub-Saharan Africa
Ratio of urban women to rural women attended by skilled health personnel during delivery, 1990 and 2008
1.01.0
1.11.0
1.81.2
2.51.3
1.81.5
1.91.6
2.01.9
2.92.0
2.32.2
* Includes only deliveries in health-care institutions.
19902008
Parity: Rural women and urban women equally likely to receive skilled care at delivery
0 20 40 60 80 100
Developing regions
CIS, Asia
Latin America & the Caribbean
South-Eastern Asia
Eastern Asia
Western Asia
Northern Africa
Sub-Saharan Africa
Southern Asia
Proportion of women attended at least once during pregnancy by skilled health-care personnel, 1990 and 2008 (Percentage)
48
70
67
46
78
53
79
80
91
72
93
79
90
64
80
96
94
76
19902008
MDG Report 2010 En 20100604 r14 Final.indd Sec2:32MDG Report 2010 En 20100604 r14 Final.indd Sec2:32 6/15/2010 12:51:59 PM6/15/2010 12:51:59 PM

THE MILLENNIUM DEVELOPMENT GOALS REPORT 2010
33
Inequalities in care during pregnancy are striking
40
50
60
70
80
90
100
Richest 20%Fourth 20%Middle 20%Second 20%Poorest 20%
Proportion of women attended at least once during pregnancy by skilled health personnel, by household wealth quintile, 2003/2008 (Percentage)
South-Eastern Asia
CIS
Developing regions
Northern Africa
Southern Asia
Sub-Saharan Africa
Disparities in the share of women receiving
antenatal care by wealth are striking,
particularly in Southern Asia, Northern Africa
and sub-Saharan Africa. Even in South-Eastern
Asia, where over 90 per cent of women receive
skilled care during pregnancy, only 77 per
cent of women in the poorest households are
covered, versus almost 100 per cent of women
in the wealthiest households.
Large disparities also exist between women living in rural and
urban areas, although the gap narrowed between 1990 and
2008. In sub-Saharan Africa, the proportion of urban women
who received antenatal care at least once increased from 84
per cent in 1990 to 89 per cent in 2008. The corresponding
proportions for rural women are 55 to 66 per cent, indicating
that coverage has improved at a faster pace among rural
women.
MDG Report 2010 En 20100604 r14 Final.indd Sec2:33MDG Report 2010 En 20100604 r14 Final.indd Sec2:33 6/15/2010 12:52:00 PM6/15/2010 12:52:00 PM

UNITED NATIONS
34
Only one in three rural women in developing regions receive the recommended care during pregnancy
Women should receive care from a
trained health-care practitioner at least
four times during the course of their
pregnancies, according to WHO and UNICEF
recommendations. However, less than half
of pregnant women in developing regions
and only a third of rural women receive the
recommended four visits. Among rural women
in Southern Asia, the share is only 25 per
cent.
Progress has stalled in reducing the number of teenage pregnancies, putting more young mothers at risk
In all regions, the adolescent birth rate (the number of births
per 1,000 women aged 15 to 19) decreased between 1990
and 2000. Since that time, progress has slowed and, in some
regions, increases have even been recorded. The highest
birth rate among adolescents is found in sub-Saharan Africa,
which has seen little progress since 1990. Adolescents,
in general, face greater obstacles than adult women in
accessing reproductive health services.
0 20 40 60 80 100
Developing regions
South-Eastern Asia
Southern Asia
Latin America & the Caribbean
Sub-Saharan Africa
Northern Africa
Proportion of women attended four or more times during pregnancy by area of residence, 2003/2008 (Percentage)
49
70
37
63
63
84
25
58
68
84
34
67
Rural Urban
0 20 40 60 80 100 120 140
Developing regions
Developed regions
Eastern Asia
CIS
Northern Africa
South-Eastern Asia
Western Asia
Southern Asia
Oceania
Latin America & the Caribbean
Sub-Saharan Africa
Number of births per 1,000 women aged 15-19, 1990, 2000 and 2007
124119
121
9180
74
8363
61
8959
53
625253
5339
44
433131
522829
156
5
2925
23
6555
52
199020002007
MDG Report 2010 En 20100604 r14 Final.indd Sec2:34MDG Report 2010 En 20100604 r14 Final.indd Sec2:34 6/15/2010 12:52:01 PM6/15/2010 12:52:01 PM

THE MILLENNIUM DEVELOPMENT GOALS REPORT 2010
35
Poverty and lack of education perpetuate high adolescent birth rates
Data for 24 countries in sub-Saharan Africa
show that adolescents in the poorest
households are three times more likely
to become pregnant and give birth than
those in the richest households. In rural
areas, adolescent birth rates are almost
double those of urban areas. But the largest
disparities are linked to education: girls with
a secondary education are the least likely to
become mothers. The birth rate among girls
with no education is over four times higher.
Even more worrisome is the widening of
disparities over time. The adolescent birth
rate declined in 18 of the 24 sub-Saharan
countries studied. However, in almost all
these 18 countries the decline was largest
among adolescents living in urban areas,
among those with at least a secondary
education, and among those belonging to
the richest 20 per cent of households. Thus,
disparities between those groups and rural,
less educated and poorer adolescents have
increased, rather than decreased, over time.
0
50
100
150
200
250
RuralUrbanNo educationPrimary education
Secondary education
or more
Poorest 20%
Second 20%
Middle 20%
Fourth 20%
Richest 20%
Adolescent birth rates by background characteristics in 24 sub-Saharan African countries, 1998/2008 (Number of births to women aged 15-19 per 1,000 women)
58
113
141
164
184
48
139
207
79
149
MDG Report 2010 En 20100604 r14 Final.indd Sec2:35MDG Report 2010 En 20100604 r14 Final.indd Sec2:35 6/15/2010 12:52:02 PM6/15/2010 12:52:02 PM

UNITED NATIONS
36
2000 and a widening gap among regions. From 2000 to
2007, the annual rate of increase in contraceptive prevalence
in almost all regions was lower than it had been during the
1990s. Moreover, contraceptive prevalence in sub-Saharan
Africa and Oceania continues to be very low. And in several
subregions, traditional and less effective methods of
contraception are still widely used.
Satisfying women’s unmet need for family planning—that is,
facilitating access to modern contraceptives by women who
desire to delay or avoid pregnancy but who are currently not
using contraception—could improve maternal health and
reduce the number of maternal deaths. Recent estimates
indicate that meeting that need could result in a 27 per
cent drop in maternal deaths each year by reducing the
annual number of unintended pregnancies from 75 million
to 22 million. Preventing closely spaced pregnancies and
pregnancies among adolescents would also improve the
health of women and girls and increase the chances that their
children will survive.
The unmet need for family planning remains moderate to high
in most regions, particularly in sub-Saharan Africa, where one
in four women aged 15 to 49 who are married or in union and
have expressed the desire to use contraceptives do not have
access to them.
Progress in expanding the use of contraceptives by women has slowed
During the 1990s, use of contraceptives
increased among women in almost every
region. By 2007, over 60 per cent of women
aged 15 to 49 who were married or in union
were using some form of contraception. Yet
this average masks two disturbing trends:
a considerable slowdown in progress since
0 20 40 60 80 100
Developing regions
Developed regions
Eastern Asia
Latin America & the Caribbean
CIS
South-Eastern Asia
Northern Africa
Western Asia
Southern Asia
Oceania
Sub-Saharan Africa
Proportion of women who are using any method of contraception among women aged 15-49, married or in union, 1990, 2000 and 2007 (Percentage)
122022
282828
4047
54
4651
55
445960
4857
62
616970
627172
788686
707171
5260
62
199020002007
MDG Report 2010 En 20100604 r14 Final.indd Sec2:36MDG Report 2010 En 20100604 r14 Final.indd Sec2:36 6/15/2010 12:52:06 PM6/15/2010 12:52:06 PM
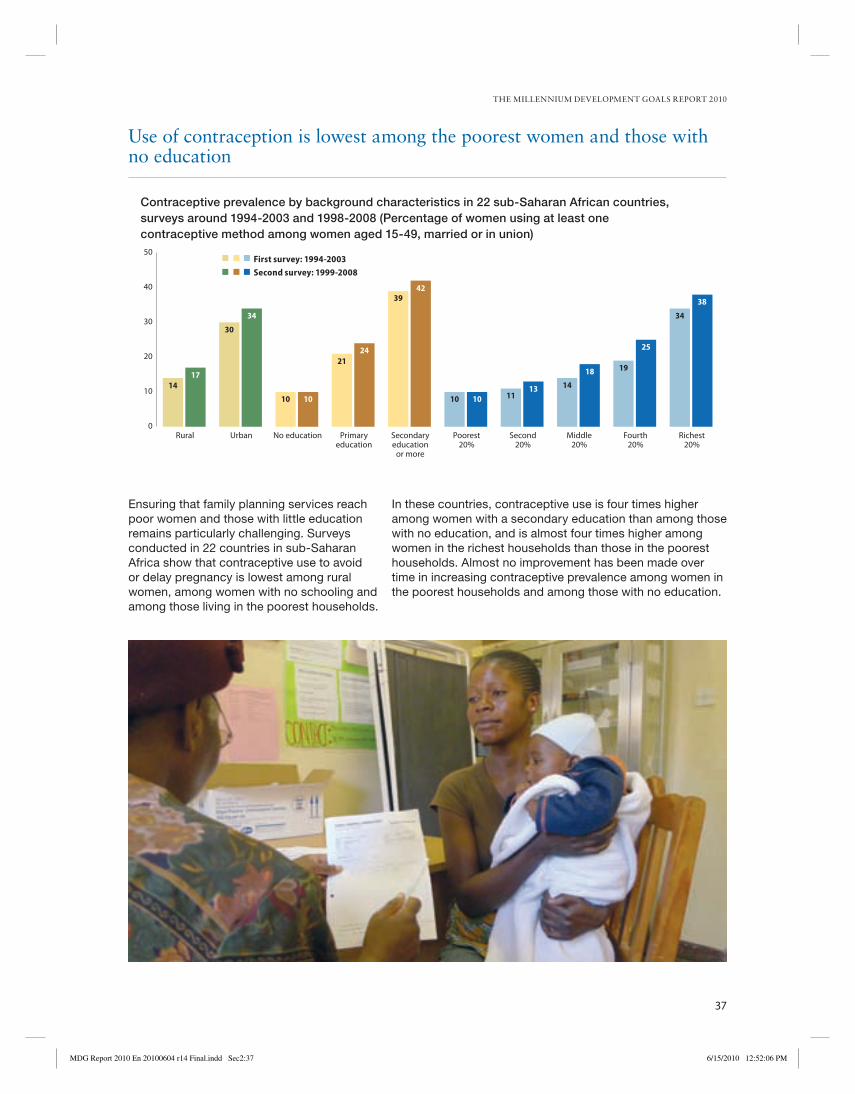
THE MILLENNIUM DEVELOPMENT GOALS REPORT 2010
37
Use of contraception is lowest among the poorest women and those with no education
Ensuring that family planning services reach
poor women and those with little education
remains particularly challenging. Surveys
conducted in 22 countries in sub-Saharan
Africa show that contraceptive use to avoid
or delay pregnancy is lowest among rural
women, among women with no schooling and
among those living in the poorest households.
0
10
20
30
40
50
Richest20%
Fourth20%
Middle20%
Second20%
Poorest20%
Secondaryeducation
or more
Primaryeducation
No educationUrbanRural
Contraceptive prevalence by background characteristics in 22 sub-Saharan African countries, surveys around 1994-2003 and 1998-2008 (Percentage of women using at least one contraceptive method among women aged 15-49, married or in union)
34
3414
17
30
34
10 10
2124
3942
10 10 1113 14
18
34
38
25
19
First survey: 1994-2003Second survey: 1999-2008
In these countries, contraceptive use is four times higher
among women with a secondary education than among those
with no education, and is almost four times higher among
women in the richest households than those in the poorest
households. Almost no improvement has been made over
time in increasing contraceptive prevalence among women in
the poorest households and among those with no education.
MDG Report 2010 En 20100604 r14 Final.indd Sec2:37MDG Report 2010 En 20100604 r14 Final.indd Sec2:37 6/15/2010 12:52:06 PM6/15/2010 12:52:06 PM
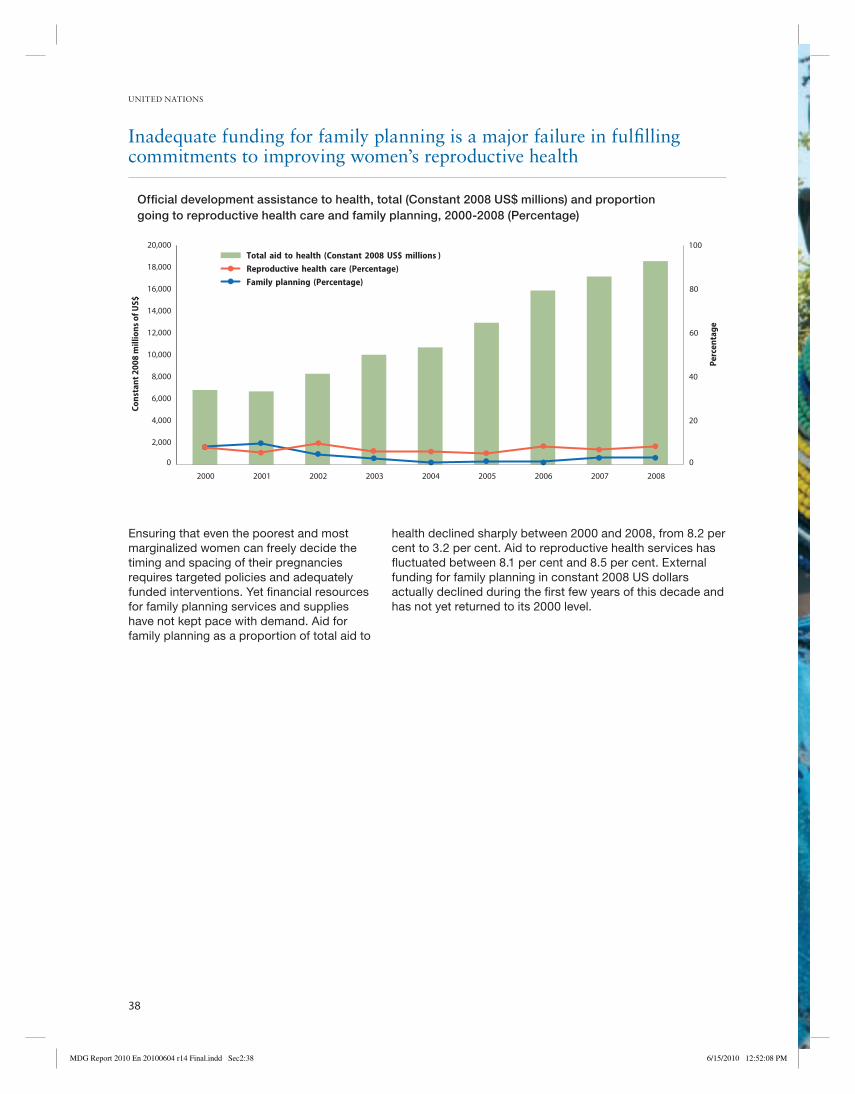
UNITED NATIONS
38
Inadequate funding for family planning is a major failure in fulfi lling commitments to improving women’s reproductive health
Ensuring that even the poorest and most
marginalized women can freely decide the
timing and spacing of their pregnancies
requires targeted policies and adequately
funded interventions. Yet fi nancial resources
for family planning services and supplies
have not kept pace with demand. Aid for
family planning as a proportion of total aid to
health declined sharply between 2000 and 2008, from 8.2 per
cent to 3.2 per cent. Aid to reproductive health services has
fl uctuated between 8.1 per cent and 8.5 per cent. External
funding for family planning in constant 2008 US dollars
actually declined during the fi rst few years of this decade and
has not yet returned to its 2000 level.
0
2,000
4,000
6,000
8,000
10,000
12,000
14,000
16,000
18,000
20,000
200820072006200520042003200220012000
0
20
40
60
80
100
Official development assistance to health, total (Constant 2008 US$ millions) and proportion going to reproductive health care and family planning, 2000-2008 (Percentage)
Cons
tant
200
8 m
illio
ns o
f US$
Perc
enta
ge
39Total aid to health (Constant 2008 US$ millions )Reproductive health care (Percentage)Family planning (Percentage)
MDG Report 2010 En 20100604 r14 Final.indd Sec2:38MDG Report 2010 En 20100604 r14 Final.indd Sec2:38 6/15/2010 12:52:08 PM6/15/2010 12:52:08 PM
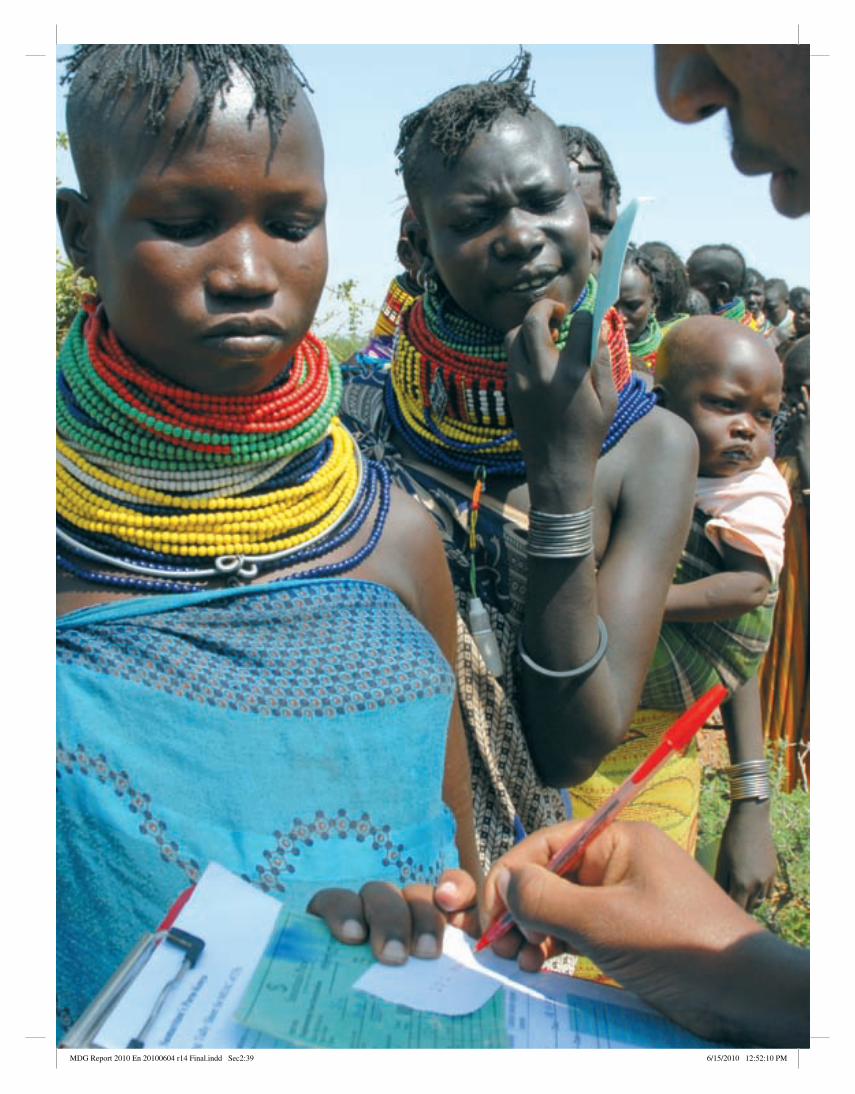
THE MILLENNIUM DEVELOPMENT GOALS REPORT 2010
39
MDG Report 2010 En 20100604 r14 Final.indd Sec2:39MDG Report 2010 En 20100604 r14 Final.indd Sec2:39 6/15/2010 12:52:10 PM6/15/2010 12:52:10 PM

UNITED NATIONS
40
The spread of HIV appears to have stabilized in most regions, and more people are surviving longer
The latest epidemiological data indicate that, globally, the
spread of HIV appears to have peaked in 1996, when 3.5
million* people were newly infected. By 2008, that number
had dropped to an estimated 2.7 million. AIDS-related
mortality peaked in 2004, with 2.2 million deaths. By 2008,
that toll had dropped to 2 million, although HIV remains the
world’s leading infectious killer.
The epidemic appears to have stabilized in most regions,
although prevalence continues to rise in Eastern Europe,
Central Asia and other parts of Asia due to a high rate of new
HIV infections. Sub-Saharan Africa remains the most heavily
affected region, accounting for 72 per cent of all new HIV
infections in 2008.
* All AIDS-related fi gures cited are the midpoint in a range. The estimate of 3.5 million new infections, for example, is based on a range of 3.2 million-3.8 million. The complete data series of ranges and corresponding midpoints is available at mdgs.un.org
TARGETHave halted by 2015 and begun to reverse the spread of
HIV/AIDSGoal 6Combat HIV/AIDS, malaria & other diseases
2008200620042002200019981996199419921990
Number of people living with HIV, number of people newly infected with HIV and number of AIDS deaths worldwide, 1990-2008 (Millions)
7.3
9.2
11.3
13.5
15.9
18.3
20.6
22.7
24.6
26.3
27.829.0
30.030.8
31.4 31.9 32.4 32.833.4
0
5
10
15
20
25
30
35
40
0
0.5
1.0
1.5
2.0
2.5
3.0
3.5
4.0
Peop
le n
ewly
infe
cted
wit
h H
IV a
nd d
eath
s du
e to
AID
S (M
illio
ns)
Peop
le li
ving
wit
h H
IV (M
illio
ns)
Number of people living with HIVNumber of people newly infected with HIVNumber of deaths due to AIDS
MDG Report 2010 En 20100604 r14 Final.indd Sec2:40MDG Report 2010 En 20100604 r14 Final.indd Sec2:40 6/15/2010 12:52:11 PM6/15/2010 12:52:11 PM
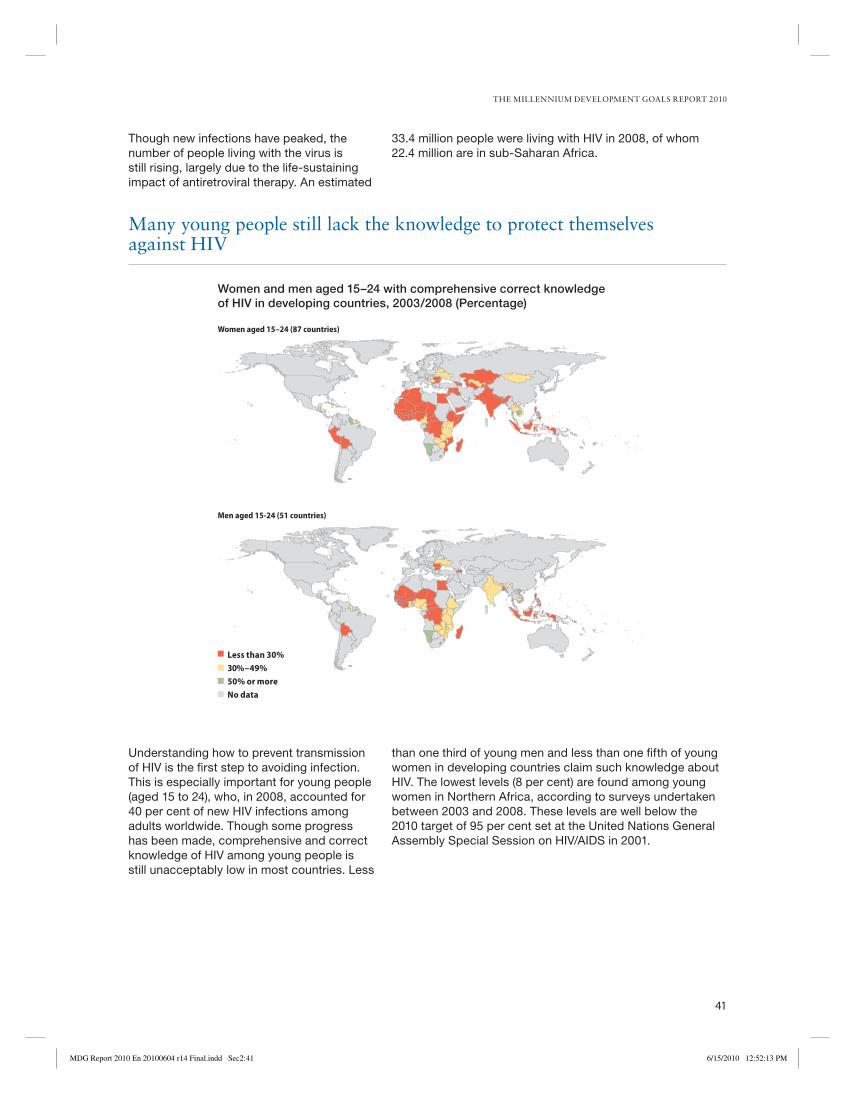
THE MILLENNIUM DEVELOPMENT GOALS REPORT 2010
41
Many young people still lack the knowledge to protect themselves against HIV
Though new infections have peaked, the
number of people living with the virus is
still rising, largely due to the life-sustaining
impact of antiretroviral therapy. An estimated
Women and men aged 15–24 with comprehensive correct knowledgeof HIV in developing countries, 2003/2008 (Percentage)
Less than 30%30%–49%50% or moreNo data
Women aged 15–24 (87 countries)
Men aged 15-24 (51 countries)
Understanding how to prevent transmission
of HIV is the fi rst step to avoiding infection.
This is especially important for young people
(aged 15 to 24), who, in 2008, accounted for
40 per cent of new HIV infections among
adults worldwide. Though some progress
has been made, comprehensive and correct
knowledge of HIV among young people is
still unacceptably low in most countries. Less
than one third of young men and less than one fi fth of young
women in developing countries claim such knowledge about
HIV. The lowest levels (8 per cent) are found among young
women in Northern Africa, according to surveys undertaken
between 2003 and 2008. These levels are well below the
2010 target of 95 per cent set at the United Nations General
Assembly Special Session on HIV/AIDS in 2001.
33.4 million people were living with HIV in 2008, of whom
22.4 million are in sub-Saharan Africa.
MDG Report 2010 En 20100604 r14 Final.indd Sec2:41MDG Report 2010 En 20100604 r14 Final.indd Sec2:41 6/15/2010 12:52:13 PM6/15/2010 12:52:13 PM
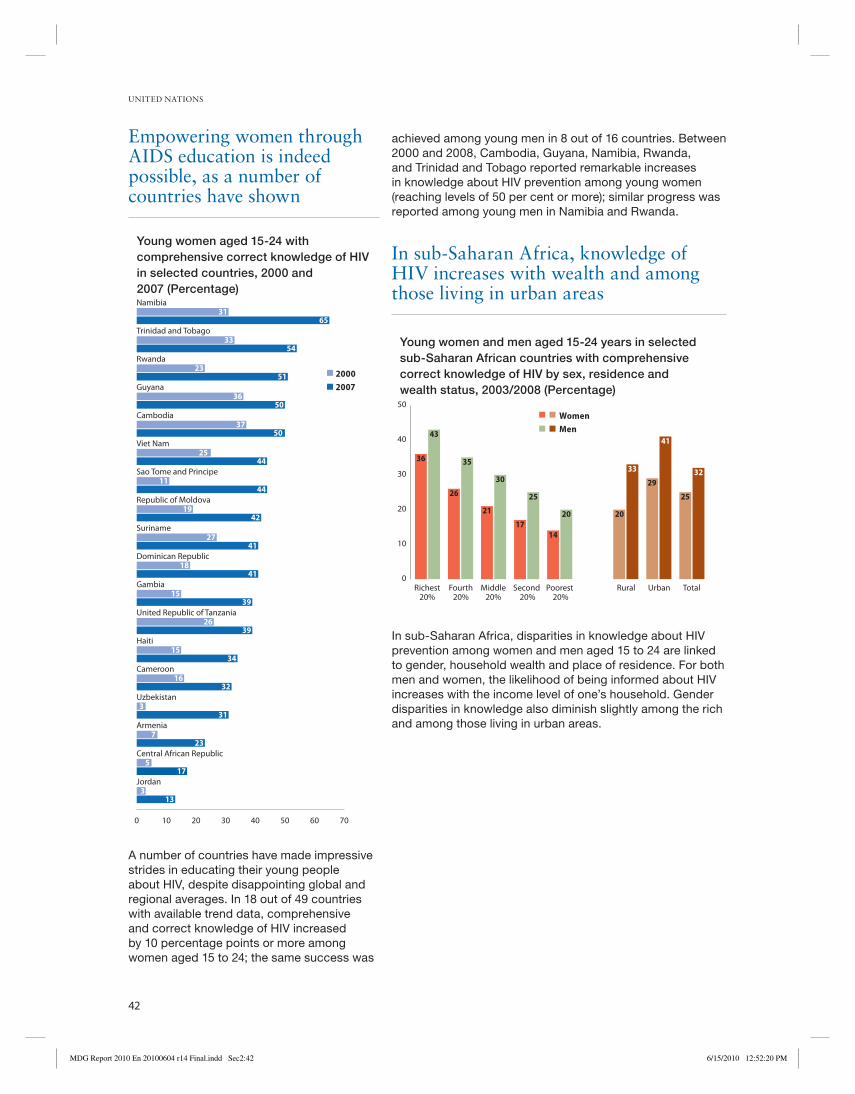
UNITED NATIONS
42
In sub-Saharan Africa, knowledge of HIV increases with wealth and among those living in urban areas
In sub-Saharan Africa, disparities in knowledge about HIV
prevention among women and men aged 15 to 24 are linked
to gender, household wealth and place of residence. For both
men and women, the likelihood of being informed about HIV
increases with the income level of one’s household. Gender
disparities in knowledge also diminish slightly among the rich
and among those living in urban areas.
Empowering women through AIDS education is indeed possible, as a number of countries have shown
A number of countries have made impressive
strides in educating their young people
about HIV, despite disappointing global and
regional averages. In 18 out of 49 countries
with available trend data, comprehensive
and correct knowledge of HIV increased
by 10 percentage points or more among
women aged 15 to 24; the same success was
0 10 20 30 40 50 60 70
Jordan
Central African Republic
Armenia
Uzbekistan
Cameroon
Haiti
United Republic of Tanzania
Gambia
Dominican Republic
Suriname
Republic of Moldova
Sao Tome and Principe
Viet Nam
Cambodia
Guyana
Rwanda
Trinidad and Tobago
Namibia
Young women aged 15-24 with comprehensive correct knowledge of HIV in selected countries, 2000 and 2007 (Percentage)
20002007
3165
3354
2351
3650
3750
2544
1144
1942
2741
1841
1539
2639
1534
1632
331
723
517
313
0
10
20
30
40
50
TotalUrbanRuralPoorest 20%
Second 20%
Middle20%
Fourth20%
Richest20%
Young women and men aged 15-24 years in selected sub-Saharan African countries with comprehensive correct knowledge of HIV by sex, residence and wealth status, 2003/2008 (Percentage)
WomenMen
36
43
26
35
25
33 32
20
41
29
14
20
25
17
30
21
achieved among young men in 8 out of 16 countries. Between
2000 and 2008, Cambodia, Guyana, Namibia, Rwanda,
and Trinidad and Tobago reported remarkable increases
in knowledge about HIV prevention among young women
(reaching levels of 50 per cent or more); similar progress was
reported among young men in Namibia and Rwanda.
MDG Report 2010 En 20100604 r14 Final.indd Sec2:42MDG Report 2010 En 20100604 r14 Final.indd Sec2:42 6/15/2010 12:52:20 PM6/15/2010 12:52:20 PM
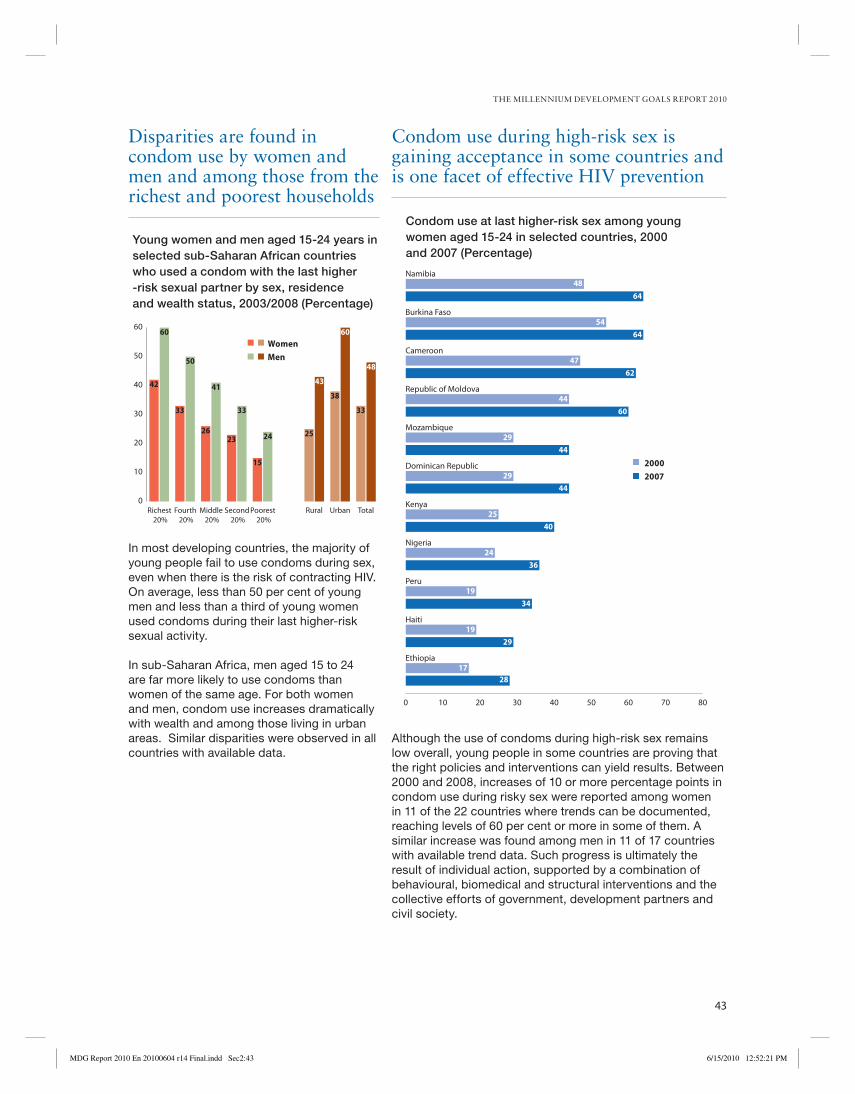
THE MILLENNIUM DEVELOPMENT GOALS REPORT 2010
43
Condom use during high-risk sex is gaining acceptance in some countries and is one facet of effective HIV prevention
Although the use of condoms during high-risk sex remains
low overall, young people in some countries are proving that
the right policies and interventions can yield results. Between
2000 and 2008, increases of 10 or more percentage points in
condom use during risky sex were reported among women
in 11 of the 22 countries where trends can be documented,
reaching levels of 60 per cent or more in some of them. A
similar increase was found among men in 11 of 17 countries
with available trend data. Such progress is ultimately the
result of individual action, supported by a combination of
behavioural, biomedical and structural interventions and the
collective efforts of government, development partners and
civil society.
Disparities are found in condom use by women and men and among those from the richest and poorest households
In most developing countries, the majority of
young people fail to use condoms during sex,
even when there is the risk of contracting HIV.
On average, less than 50 per cent of young
men and less than a third of young women
used condoms during their last higher-risk
sexual activity.
In sub-Saharan Africa, men aged 15 to 24
are far more likely to use condoms than
women of the same age. For both women
and men, condom use increases dramatically
with wealth and among those living in urban
areas. Similar disparities were observed in all
countries with available data.
0 10 20 30 40 50 60 70 80
Ethiopia
Haiti
Peru
Nigeria
Kenya
Dominican Republic
Mozambique
Republic of Moldova
Cameroon
Burkina Faso
Namibia
Condom use at last higher-risk sex among young women aged 15-24 in selected countries, 2000 and 2007 (Percentage)
19
24
25
29
29
44
47
54
19
48
34
36
40
44
44
60
62
64
29
1728
64
2000 2007
Young women and men aged 15-24 years in selected sub-Saharan African countries who used a condom with the last higher-risk sexual partner by sex, residence and wealth status, 2003/2008 (Percentage)
0
10
20
30
40
50
60
TotalUrbanRuralPoorest 20%
Second 20%
Middle 20%
Fourth 20%
Richest 20%
WomenMen
42
60
33
50
33
43
48
25
60
38
15
24
33
23
41
26
MDG Report 2010 En 20100604 r14 Final.indd Sec2:43MDG Report 2010 En 20100604 r14 Final.indd Sec2:43 6/15/2010 12:52:21 PM6/15/2010 12:52:21 PM
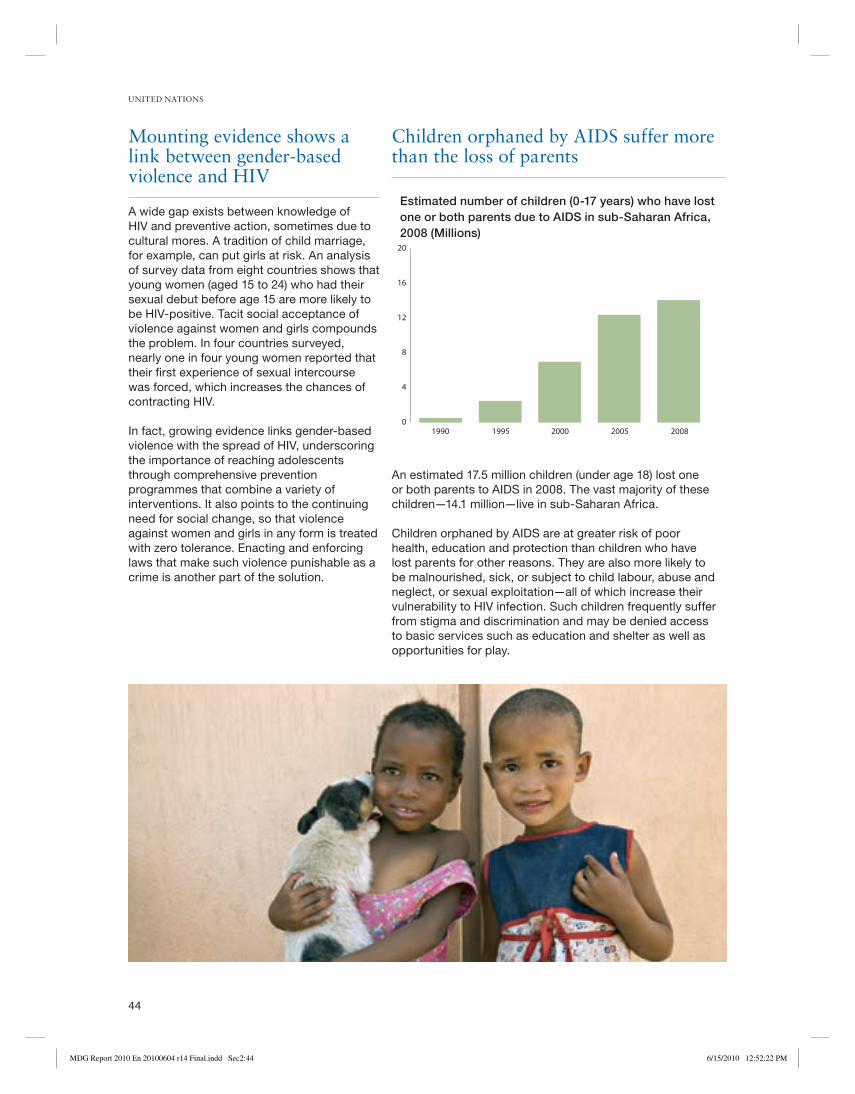
UNITED NATIONS
44
Children orphaned by AIDS suffer more than the loss of parents
An estimated 17.5 million children (under age 18) lost one
or both parents to AIDS in 2008. The vast majority of these
children—14.1 million—live in sub-Saharan Africa.
Children orphaned by AIDS are at greater risk of poor
health, education and protection than children who have
lost parents for other reasons. They are also more likely to
be malnourished, sick, or subject to child labour, abuse and
neglect, or sexual exploitation—all of which increase their
vulnerability to HIV infection. Such children frequently suffer
from stigma and discrimination and may be denied access
to basic services such as education and shelter as well as
opportunities for play.
Mounting evidence shows a link between gender-based violence and HIV
A wide gap exists between knowledge of
HIV and preventive action, sometimes due to
cultural mores. A tradition of child marriage,
for example, can put girls at risk. An analysis
of survey data from eight countries shows that
young women (aged 15 to 24) who had their
sexual debut before age 15 are more likely to
be HIV-positive. Tacit social acceptance of
violence against women and girls compounds
the problem. In four countries surveyed,
nearly one in four young women reported that
their fi rst experience of sexual intercourse
was forced, which increases the chances of
contracting HIV.
In fact, growing evidence links gender-based
violence with the spread of HIV, underscoring
the importance of reaching adolescents
through comprehensive prevention
programmes that combine a variety of
interventions. It also points to the continuing
need for social change, so that violence
against women and girls in any form is treated
with zero tolerance. Enacting and enforcing
laws that make such violence punishable as a
crime is another part of the solution.
Estimated number of children (0-17 years) who have lost one or both parents due to AIDS in sub-Saharan Africa, 2008 (Millions)
0
4
8
12
16
20
20082005200019951990
MDG Report 2010 En 20100604 r14 Final.indd Sec2:44MDG Report 2010 En 20100604 r14 Final.indd Sec2:44 6/15/2010 12:52:22 PM6/15/2010 12:52:22 PM
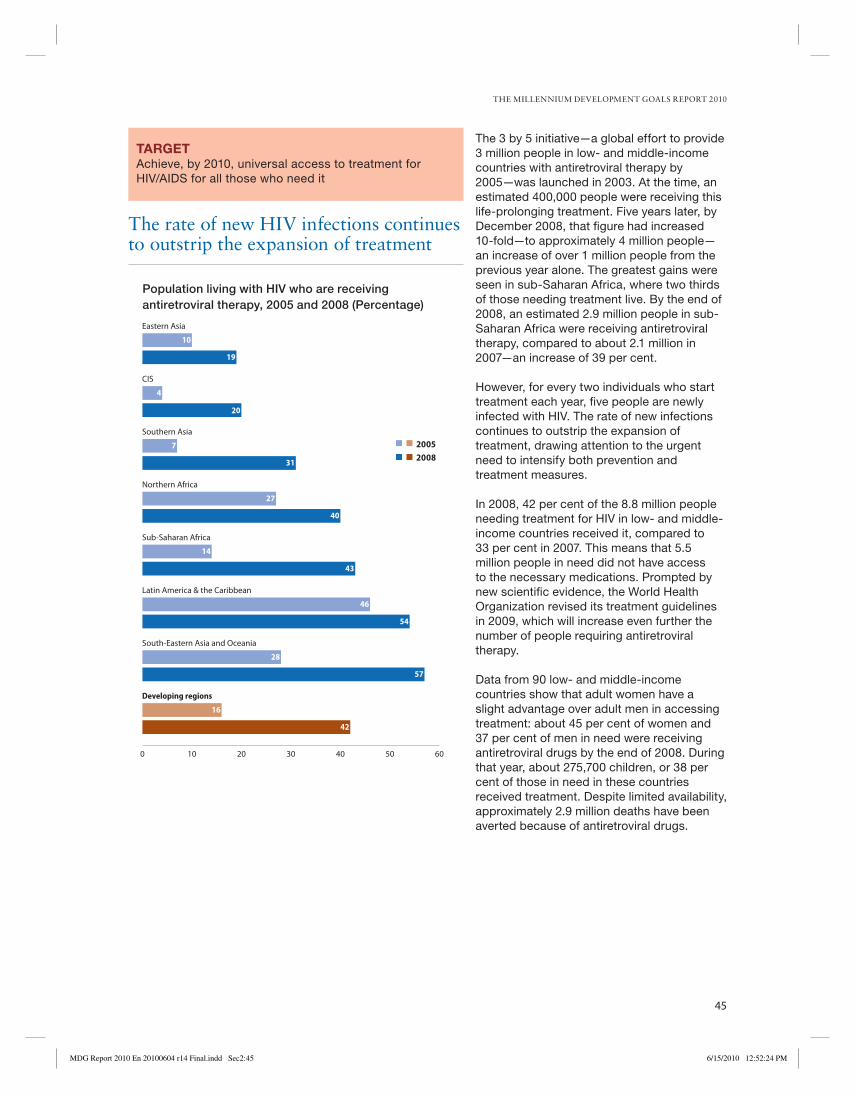
THE MILLENNIUM DEVELOPMENT GOALS REPORT 2010
45
The rate of new HIV infections continues to outstrip the expansion of treatment
The 3 by 5 initiative—a global effort to provide
3 million people in low- and middle-income
countries with antiretroviral therapy by
2005—was launched in 2003. At the time, an
estimated 400,000 people were receiving this
life-prolonging treatment. Five years later, by
December 2008, that fi gure had increased
10-fold—to approximately 4 million people—
an increase of over 1 million people from the
previous year alone. The greatest gains were
seen in sub-Saharan Africa, where two thirds
of those needing treatment live. By the end of
2008, an estimated 2.9 million people in sub-
Saharan Africa were receiving antiretroviral
therapy, compared to about 2.1 million in
2007—an increase of 39 per cent.
However, for every two individuals who start
treatment each year, fi ve people are newly
infected with HIV. The rate of new infections
continues to outstrip the expansion of
treatment, drawing attention to the urgent
need to intensify both prevention and
treatment measures.
In 2008, 42 per cent of the 8.8 million people
needing treatment for HIV in low- and middle-
income countries received it, compared to
33 per cent in 2007. This means that 5.5
million people in need did not have access
to the necessary medications. Prompted by
new scientifi c evidence, the World Health
Organization revised its treatment guidelines
in 2009, which will increase even further the
number of people requiring antiretroviral
therapy.
Data from 90 low- and middle-income
countries show that adult women have a
slight advantage over adult men in accessing
treatment: about 45 per cent of women and
37 per cent of men in need were receiving
antiretroviral drugs by the end of 2008. During
that year, about 275,700 children, or 38 per
cent of those in need in these countries
received treatment. Despite limited availability,
approximately 2.9 million deaths have been
averted because of antiretroviral drugs.
TARGETAchieve, by 2010, universal access to treatment for
HIV/AIDS for all those who need it
0 10 20 30 40 50 60
Developing regions
South-Eastern Asia and Oceania
Latin America & the Caribbean
Sub-Saharan Africa
Northern Africa
Southern Asia
CIS
Eastern Asia
Population living with HIV who are receiving antiretroviral therapy, 2005 and 2008 (Percentage)
10
19
4
20
7
31
27
40
14
43
46
54
28
57
16
42
20052008
MDG Report 2010 En 20100604 r14 Final.indd Sec2:45MDG Report 2010 En 20100604 r14 Final.indd Sec2:45 6/15/2010 12:52:24 PM6/15/2010 12:52:24 PM
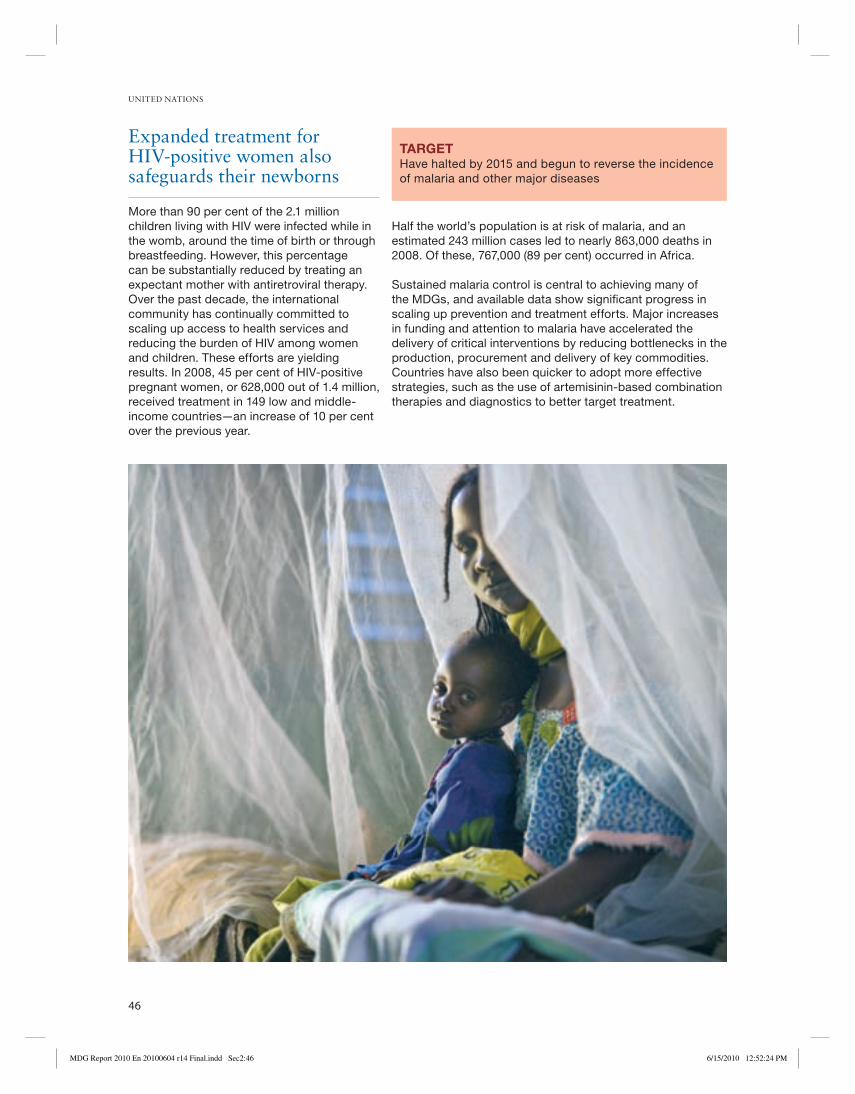
UNITED NATIONS
46
Half the world’s population is at risk of malaria, and an
estimated 243 million cases led to nearly 863,000 deaths in
2008. Of these, 767,000 (89 per cent) occurred in Africa.
Sustained malaria control is central to achieving many of
the MDGs, and available data show signifi cant progress in
scaling up prevention and treatment efforts. Major increases
in funding and attention to malaria have accelerated the
delivery of critical interventions by reducing bottlenecks in the
production, procurement and delivery of key commodities.
Countries have also been quicker to adopt more effective
strategies, such as the use of artemisinin-based combination
therapies and diagnostics to better target treatment.
Expanded treatment for HIV-positive women also safeguards their newborns
More than 90 per cent of the 2.1 million
children living with HIV were infected while in
the womb, around the time of birth or through
breastfeeding. However, this percentage
can be substantially reduced by treating an
expectant mother with antiretroviral therapy.
Over the past decade, the international
community has continually committed to
scaling up access to health services and
reducing the burden of HIV among women
and children. These efforts are yielding
results. In 2008, 45 per cent of HIV-positive
pregnant women, or 628,000 out of 1.4 million,
received treatment in 149 low and middle-
income countries—an increase of 10 per cent
over the previous year.
TARGETHave halted by 2015 and begun to reverse the incidence
of malaria and other major diseases
MDG Report 2010 En 20100604 r14 Final.indd Sec2:46MDG Report 2010 En 20100604 r14 Final.indd Sec2:46 6/15/2010 12:52:24 PM6/15/2010 12:52:24 PM
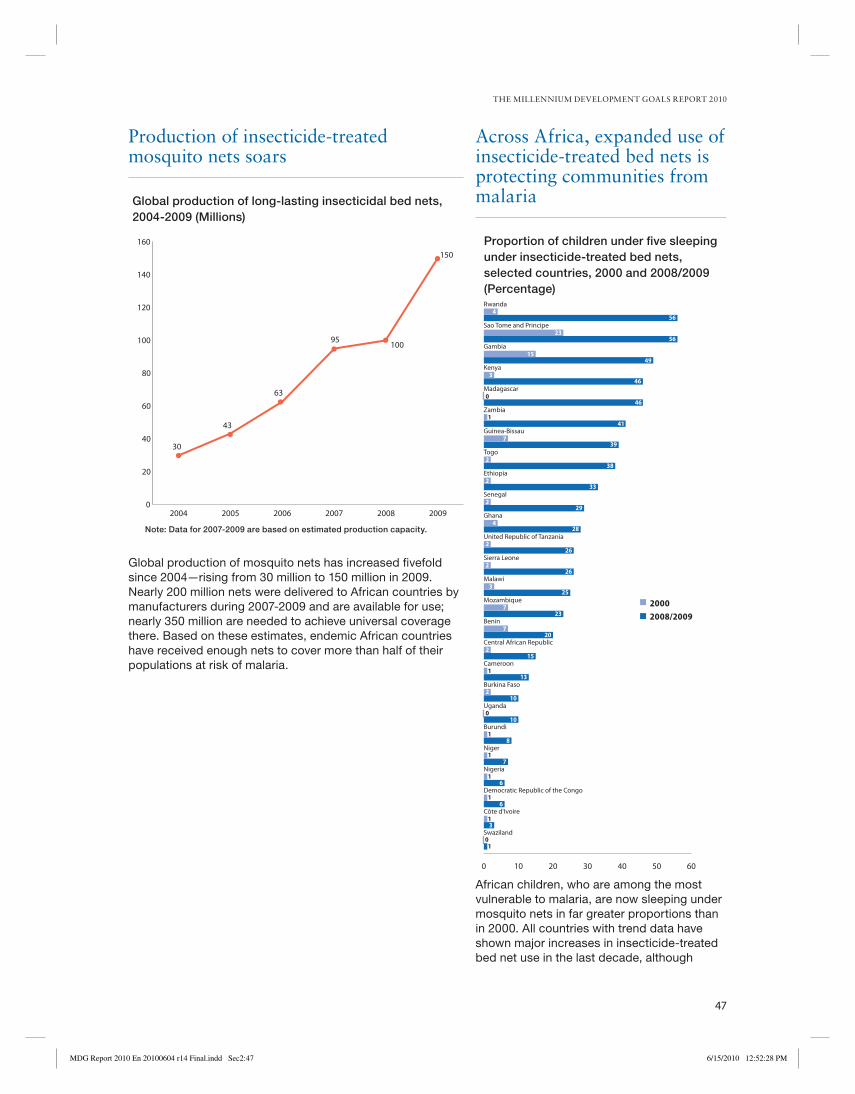
THE MILLENNIUM DEVELOPMENT GOALS REPORT 2010
47
Across Africa, expanded use of insecticide-treated bed nets is protecting communities from malaria
African children, who are among the most
vulnerable to malaria, are now sleeping under
mosquito nets in far greater proportions than
in 2000. All countries with trend data have
shown major increases in insecticide-treated
bed net use in the last decade, although
Production of insecticide-treated mosquito nets soars
Global production of mosquito nets has increased fi vefold
since 2004—rising from 30 million to 150 million in 2009.
Nearly 200 million nets were delivered to African countries by
manufacturers during 2007-2009 and are available for use;
nearly 350 million are needed to achieve universal coverage
there. Based on these estimates, endemic African countries
have received enough nets to cover more than half of their
populations at risk of malaria.
0
20
40
60
80
100
120
140
160
200920082007200620052004
Global production of long-lasting insecticidal bed nets, 2004-2009 (Millions)
30
43
63
95100
150
Note: Data for 2007-2009 are based on estimated production capacity.
0 10 20 30 40 50 60
Swaziland
Côte d'Ivoire
Democratic Republic of the Congo
Nigeria
Niger
Burundi
Uganda
Burkina Faso
Cameroon
Central African Republic
Benin
Mozambique
Malawi
Sierra Leone
United Republic of Tanzania
Ghana
Senegal
Ethiopia
Togo
Guinea-Bissau
Zambia
Madagascar
Kenya
Gambia
Sao Tome and Principe
Rwanda
Proportion of children under five sleeping under insecticide-treated bed nets, selected countries, 2000 and 2008/2009(Percentage)
56
56
49
46
46
41
39
38
33
29
28
26
26
25
23
20
15
13
10
10
8
7
6
6
3
4
23
15
3
0
1
7
2
2
4
2
2
3
7
7
2
2
0
1
1
1
1
01
1
1
2
20002008/2009
MDG Report 2010 En 20100604 r14 Final.indd Sec2:47MDG Report 2010 En 20100604 r14 Final.indd Sec2:47 6/15/2010 12:52:28 PM6/15/2010 12:52:28 PM

UNITED NATIONS
48
Global procurement of more effective antimalarial drugs continues to rise rapidly
Prompt and effective treatment is critical for preventing
life-threatening complications from malaria, particularly
in children. In recent years, many African countries have
reinvigorated their treatment programmes by increasing
access to new combinations of antimalarial medications that
have been shown to outperform earlier drugs.
Since 2003, countries have shifted their national drug policies
to promote artemisinin-based combination therapies, a
more effective—but also more expensive—treatment course.
Global procurement of these medicines has risen sharply
since 2005.
Antimalarial treatment coverage, however, remains
substantially different across African countries—ranging
from 67 per cent to only 1 per cent of children under fi ve
with fevers receiving any type of antimalarial drug. In fact,
the proportion of febrile children under fi ve receiving any
antimalarial medication was above 50 per cent in only eight
of the 37 African countries with recent data (2005-2009). And
in nine of these countries, only 10 per cent or fewer febrile
children were receiving treatment. However, lower levels of
antimalarial treatment may refl ect expanded use of diagnostic
tools to only target those children who actually have the
disease.
Poverty continues to limit use of mosquito nets
Through campaigns to distribute free
insecticide-treated mosquito nets in areas of
intense malaria transmission, some countries
have been able to achieve more equitable
use of bed nets by poor, rural households.
But not all countries have managed to do
so. On average, girls and boys in the poorest
households are still less likely to use mosquito
nets, though the data indicate no signifi cant
gender differences in use.
0
20
40
60
80
100
120
140
160
180
200920082007200620052004200320022001
Number of doses of artemisinin-based combination therapies procured worldwide, 2001-2009 (Millions)
0.5 0.6 2.1
31.3
130.0
160.0
5.0
82.7
97.0
Children under five sleeping under an insecticide-treated bed net by residence and wealth quintile, sub-Saharan Africa, 2006/2009 (Percentage)
0
5
10
15
20
25
UrbanRuralPoorest 20%
Second 20%
Middle 20%
Fourth 20%
Richest 20%
23
19
1716
14
2019
Note: Disaggregation by residence is based on estimates from 32 countries in sub-Saharan Africa with residence information, covering 86 per cent of children under five in the region. Disaggregation by household wealth is based on estimates from 30 countries in sub-Saharan Africa with household wealth information, covering 83 per cent of children under five.
scaling up in most countries only began in
2005. Across Africa, use of such nets by
children rose from just 2 per cent in 2000 to
22 per cent in 2008, in 26 African countries
with trend data (covering 71 per cent of the
under-fi ve population in Africa). Twenty of
these countries documented at least a fi ve-
fold increase in coverage during this time, with
11 achieving a 10-fold gain or more.
MDG Report 2010 En 20100604 r14 Final.indd Sec2:48MDG Report 2010 En 20100604 r14 Final.indd Sec2:48 6/15/2010 12:52:28 PM6/15/2010 12:52:28 PM
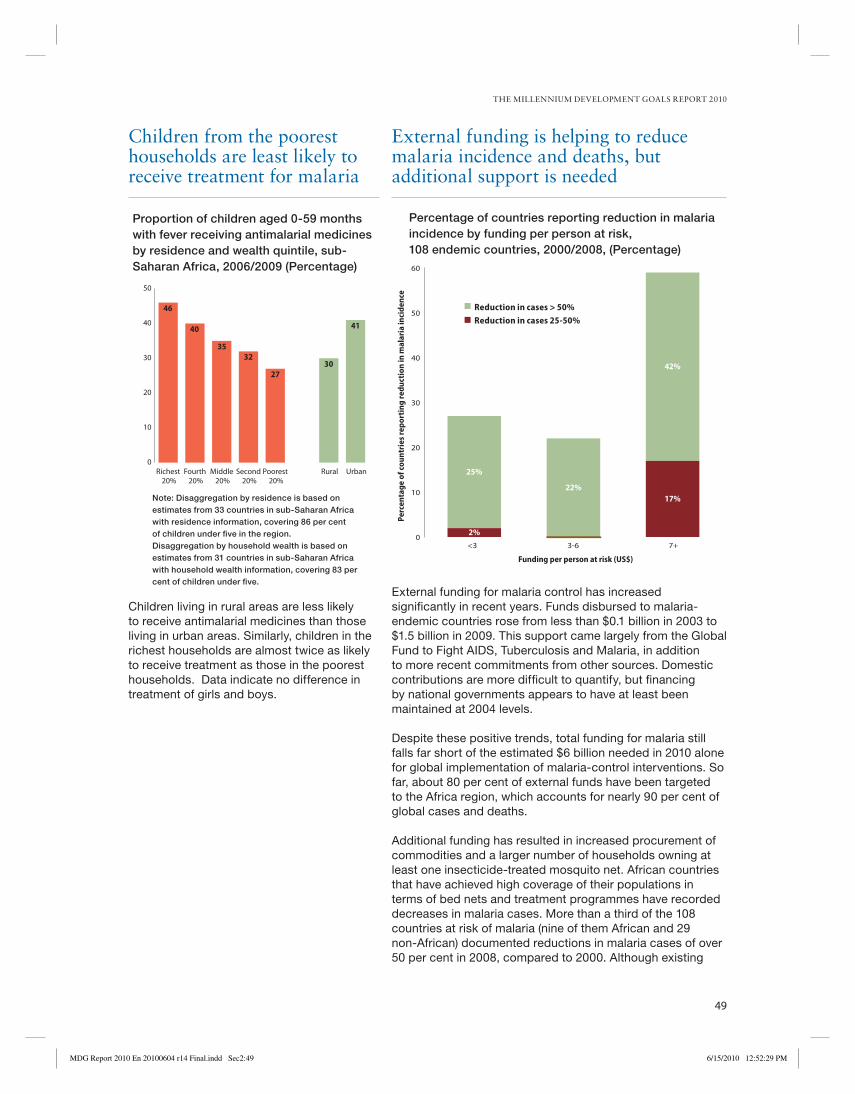
THE MILLENNIUM DEVELOPMENT GOALS REPORT 2010
49
External funding is helping to reduce malaria incidence and deaths, but additional support is needed
External funding for malaria control has increased
signifi cantly in recent years. Funds disbursed to malaria-
endemic countries rose from less than $0.1 billion in 2003 to
$1.5 billion in 2009. This support came largely from the Global
Fund to Fight AIDS, Tuberculosis and Malaria, in addition
to more recent commitments from other sources. Domestic
contributions are more diffi cult to quantify, but fi nancing
by national governments appears to have at least been
maintained at 2004 levels.
Despite these positive trends, total funding for malaria still
falls far short of the estimated $6 billion needed in 2010 alone
for global implementation of malaria-control interventions. So
far, about 80 per cent of external funds have been targeted
to the Africa region, which accounts for nearly 90 per cent of
global cases and deaths.
Additional funding has resulted in increased procurement of
commodities and a larger number of households owning at
least one insecticide-treated mosquito net. African countries
that have achieved high coverage of their populations in
terms of bed nets and treatment programmes have recorded
decreases in malaria cases. More than a third of the 108
countries at risk of malaria (nine of them African and 29
non-African) documented reductions in malaria cases of over
50 per cent in 2008, compared to 2000. Although existing
Children from the poorest households are least likely to receive treatment for malaria
Children living in rural areas are less likely
to receive antimalarial medicines than those
living in urban areas. Similarly, children in the
richest households are almost twice as likely
to receive treatment as those in the poorest
households. Data indicate no difference in
treatment of girls and boys.
0
10
20
30
40
50
60
7+3-6<3
Percentage of countries reporting reduction in malaria incidence by funding per person at risk, 108 endemic countries, 2000/2008, (Percentage)
Reduction in cases > 50%Reduction in cases 25-50%
Perc
enta
ge o
f cou
ntri
es re
port
ing
redu
ctio
n in
mal
aria
inci
denc
e
Funding per person at risk (US$)
22%
42%
17%
25%
2%
Proportion of children aged 0-59 months with fever receiving antimalarial medicinesby residence and wealth quintile, sub-Saharan Africa, 2006/2009 (Percentage)
0
10
20
30
40
50
UrbanRuralPoorest 20%
Second 20%
Middle 20%
Fourth 20%
Richest 20%
46
40
3532
27
41
30
Note: Disaggregation by residence is based on estimates from 33 countries in sub-Saharan Africa with residence information, covering 86 per cent of children under five in the region. Disaggregation by household wealth is based on estimates from 31 countries in sub-Saharan Africa with household wealth information, covering 83 per cent of children under five.
MDG Report 2010 En 20100604 r14 Final.indd Sec2:49MDG Report 2010 En 20100604 r14 Final.indd Sec2:49 6/15/2010 12:52:29 PM6/15/2010 12:52:29 PM
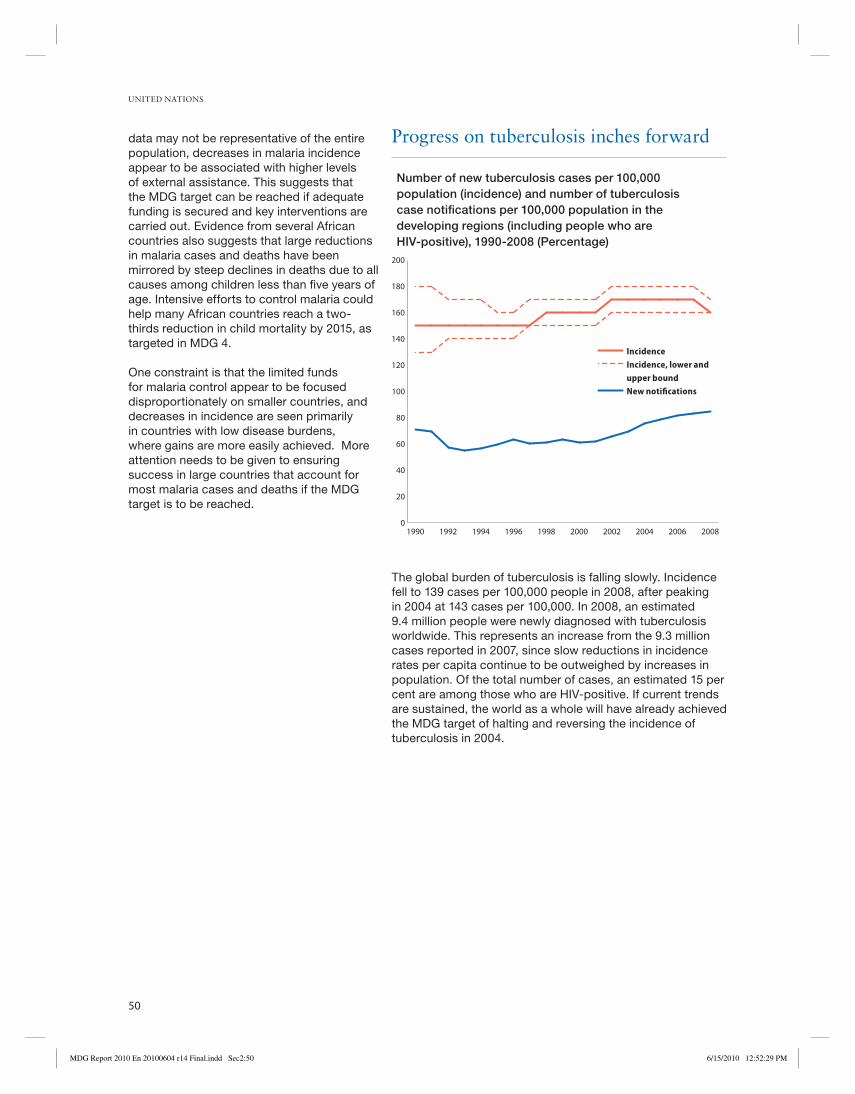
UNITED NATIONS
50
Progress on tuberculosis inches forward
The global burden of tuberculosis is falling slowly. Incidence
fell to 139 cases per 100,000 people in 2008, after peaking
in 2004 at 143 cases per 100,000. In 2008, an estimated
9.4 million people were newly diagnosed with tuberculosis
worldwide. This represents an increase from the 9.3 million
cases reported in 2007, since slow reductions in incidence
rates per capita continue to be outweighed by increases in
population. Of the total number of cases, an estimated 15 per
cent are among those who are HIV-positive. If current trends
are sustained, the world as a whole will have already achieved
the MDG target of halting and reversing the incidence of
tuberculosis in 2004.
data may not be representative of the entire
population, decreases in malaria incidence
appear to be associated with higher levels
of external assistance. This suggests that
the MDG target can be reached if adequate
funding is secured and key interventions are
carried out. Evidence from several African
countries also suggests that large reductions
in malaria cases and deaths have been
mirrored by steep declines in deaths due to all
causes among children less than fi ve years of
age. Intensive efforts to control malaria could
help many African countries reach a two-
thirds reduction in child mortality by 2015, as
targeted in MDG 4.
One constraint is that the limited funds
for malaria control appear to be focused
disproportionately on smaller countries, and
decreases in incidence are seen primarily
in countries with low disease burdens,
where gains are more easily achieved. More
attention needs to be given to ensuring
success in large countries that account for
most malaria cases and deaths if the MDG
target is to be reached.
0
20
40
60
80
100
120
140
160
180
200
2008200620042002200019981996199419921990
Number of new tuberculosis cases per 100,000 population (incidence) and number of tuberculosis case notifications per 100,000 population in the developing regions (including people who are HIV-positive), 1990-2008 (Percentage)
IncidenceIncidence, lower and upper boundNew notifications
MDG Report 2010 En 20100604 r14 Final.indd Sec2:50MDG Report 2010 En 20100604 r14 Final.indd Sec2:50 6/15/2010 12:52:29 PM6/15/2010 12:52:29 PM
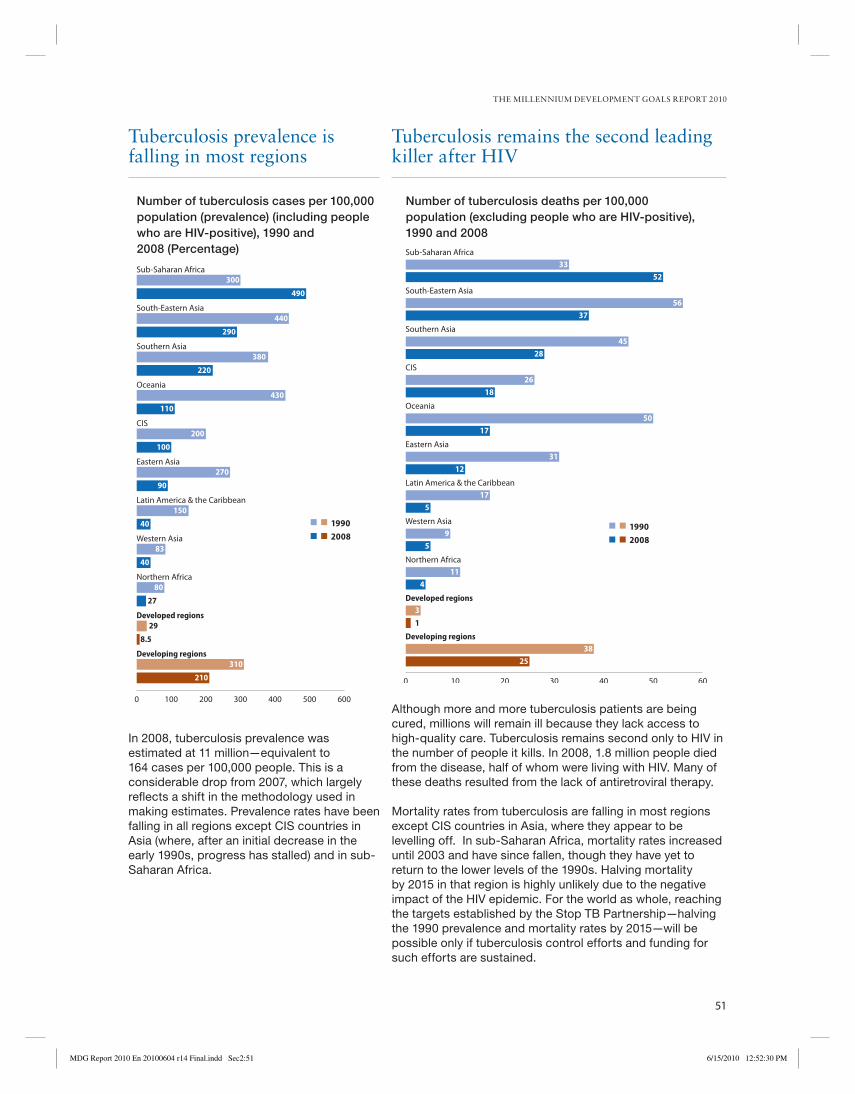
THE MILLENNIUM DEVELOPMENT GOALS REPORT 2010
51
Tuberculosis remains the second leading killer after HIV
Although more and more tuberculosis patients are being
cured, millions will remain ill because they lack access to
high-quality care. Tuberculosis remains second only to HIV in
the number of people it kills. In 2008, 1.8 million people died
from the disease, half of whom were living with HIV. Many of
these deaths resulted from the lack of antiretroviral therapy.
Mortality rates from tuberculosis are falling in most regions
except CIS countries in Asia, where they appear to be
levelling off. In sub-Saharan Africa, mortality rates increased
until 2003 and have since fallen, though they have yet to
return to the lower levels of the 1990s. Halving mortality
by 2015 in that region is highly unlikely due to the negative
impact of the HIV epidemic. For the world as whole, reaching
the targets established by the Stop TB Partnership—halving
the 1990 prevalence and mortality rates by 2015—will be
possible only if tuberculosis control efforts and funding for
such efforts are sustained.
Tuberculosis prevalence is falling in most regions
In 2008, tuberculosis prevalence was
estimated at 11 million—equivalent to
164 cases per 100,000 people. This is a
considerable drop from 2007, which largely
refl ects a shift in the methodology used in
making estimates. Prevalence rates have been
falling in all regions except CIS countries in
Asia (where, after an initial decrease in the
early 1990s, progress has stalled) and in sub-
Saharan Africa.
0 100 200 300 400 500 600
Developing regions
Developed regions
Northern Africa
Western Asia
Latin America & the Caribbean
Eastern Asia
CIS
Oceania
Southern Asia
South-Eastern Asia
Sub-Saharan Africa
Number of tuberculosis cases per 100,000 population (prevalence) (including people who are HIV-positive), 1990 and 2008 (Percentage)
300
490
440
290
380
220
430
110
150
40
83
40
80
27
29
310
210
8.5
270
90
200
100
19902008
0 10 20 30 40 50 60
Developing regions
Developed regions
Northern Africa
Western Asia
Latin America & the Caribbean
Eastern Asia
Oceania
CIS
Southern Asia
South-Eastern Asia
Sub-Saharan Africa
Number of tuberculosis deaths per 100,000 population (excluding people who are HIV-positive), 1990 and 2008
33
52
56
37
45
28
26
18
17
5
9
5
11
4
3
38
25
1
31
12
50
17
19902008
MDG Report 2010 En 20100604 r14 Final.indd Sec2:51MDG Report 2010 En 20100604 r14 Final.indd Sec2:51 6/15/2010 12:52:30 PM6/15/2010 12:52:30 PM

UNITED NATIONS
52
The rate of deforestation shows signs of decreasing, but is still alarmingly high
Global deforestation—mainly the conversion of tropical
forests to agricultural land—is slowing, but continues at a
high rate in many countries. Over the last decade, about 13
million hectares of forest worldwide were converted to other
uses or lost through natural causes each year, compared to
16 million hectares per year in the 1990s.
TARGETIntegrate the principles of sustainable development into
country policies and programmes and reverse the loss of
environmental resourcesGoal 7Ensure environmental sustainability
0 20 40 60 80 100
World
Developed regions
Developing regions
Northern Africa
Western Asia
CIS, Asia
Southern Asia
Eastern Asia
Sub-Saharan Africa
Caribbean
Transition countries of South-Eastern Europe
CIS, Europe
Latin America & the Caribbean
Latin America
South-Eastern Asia
Oceania
Forested area as percentage of land area, 1990 and 2010 (Percentage)
1414
20
28
11
33
44
16
30
2630
33
4848
4752
4852
4957
6368
32
31
31
30
2931
31
19902010
MDG Report 2010 En 20100604 r14 Final.indd Sec2:52MDG Report 2010 En 20100604 r14 Final.indd Sec2:52 6/15/2010 12:52:31 PM6/15/2010 12:52:31 PM

THE MILLENNIUM DEVELOPMENT GOALS REPORT 2010
53
A decisive response to climate change is urgently needed
In 2007, global emissions of carbon dioxide (CO2) again rose,
reaching 30 billion metric tons, an increase of 3.2 per cent
from the previous year. This represents a 35 per cent increase
above the 1990 level. Per capita emissions remain highest
in the developed regions—about 12 metric tons of CO2 per
person per year in 2007, compared to about 3 metric tons on
average per person in the developing regions and 0.9 metric
tons in sub-Saharan Africa, the lowest regional value. Since
1990, emissions per unit of economic output fell by more than
26 per cent in the developed regions and by about 11 per
cent in the developing regions.
Figures for 2008 are expected to show a slight shift in the
trend: according to the 2009 edition of the World Energy
Outlook, published by the International Energy Agency, the
rate of growth in global CO2 emissions is expected to have
declined in 2008 as a result of the global fi nancial crisis, and
global emissions may even have fallen between 2008 and
Ambitious tree-planting programmes in
several countries, combined with the natural
expansion of forests in some regions, have
added more than 7 million hectares of new
forest annually. As a result, the net loss of
forest area over the period 2000-2010 was
reduced to 5.2 million hectares per year, down
from 8.3 million hectares per year in 1990-
2000.
South America and Africa continue to show
the largest net losses of forests, at just under
4 million and 3.4 million hectares per year,
respectively, over the period 2000–2010. In
the developed regions, Australia experienced
a large loss, partly due to severe drought
and fi res since 2000. Asia, on the other
hand, registered a net gain of some 2.2
million hectares annually in the last decade,
mainly because of large-scale afforestation
programmes in China, India and Viet Nam.
These three countries have expanded their
forest area by a total of nearly 4 million
hectares annually in the last fi ve years.
However, rapid conversion of forested
lands to other uses continued in many other
countries in the region.
0 5 10 15 20 25 30
World
Developed regions
Developing regions
Oceania
Northern Africa
Eastern Asia, excluding China
Sub-Saharan Africa
Southern Asia, excluding India
South-Eastern Asia
Western Asia
Latin America & the Caribbean
Southern Asia
CIS
Eastern Asia
Emissions of carbon dioxide (CO2), 1990 and 2007 (Billions of metric tons)
21.929.6
10.912.1
7.1
<0.1<0.1
0.20.5
0.50.7
0.50.6
0.30.7
0.41.1
0.71.3
1.11.6
1.02.3
3.82.4
3.07.2
14.9
19902007
MDG Report 2010 En 20100604 r14 Final.indd Sec2:53MDG Report 2010 En 20100604 r14 Final.indd Sec2:53 6/15/2010 12:52:33 PM6/15/2010 12:52:33 PM
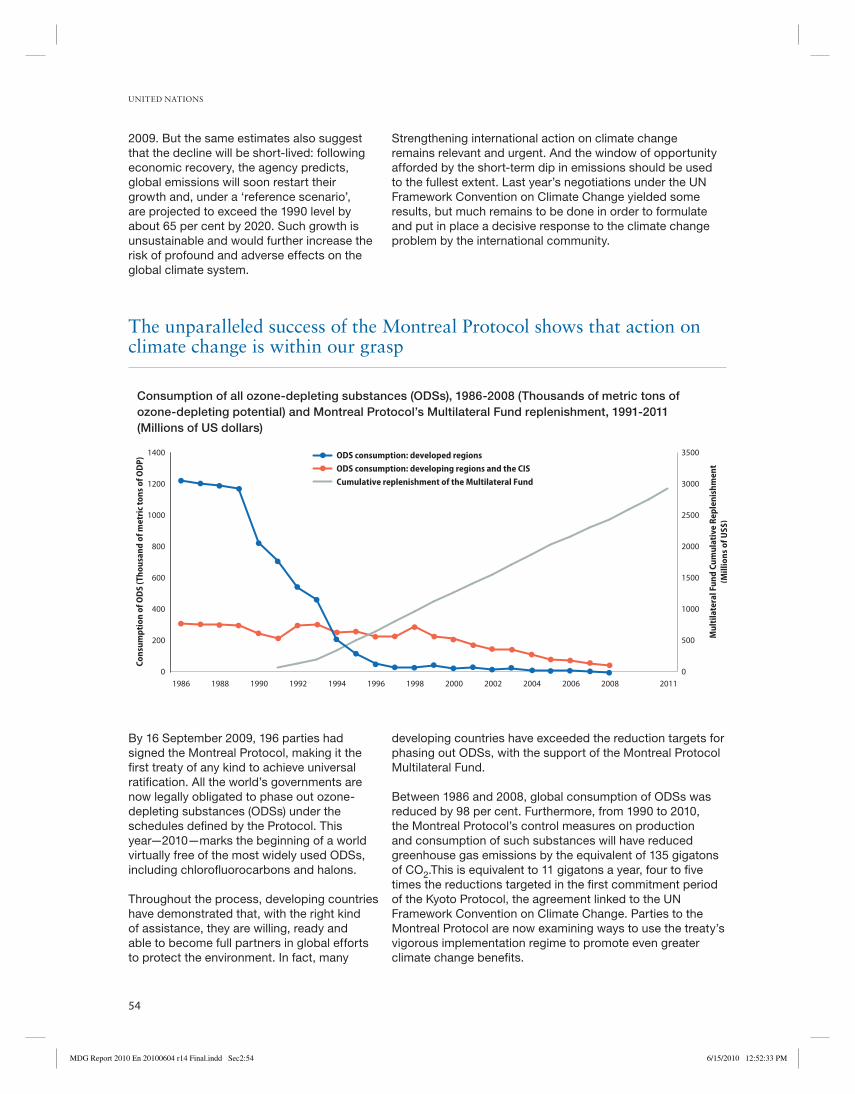
UNITED NATIONS
54
By 16 September 2009, 196 parties had
signed the Montreal Protocol, making it the
fi rst treaty of any kind to achieve universal
ratifi cation. All the world’s governments are
now legally obligated to phase out ozone-
depleting substances (ODSs) under the
schedules defi ned by the Protocol. This
year—2010—marks the beginning of a world
virtually free of the most widely used ODSs,
including chlorofl uorocarbons and halons.
Throughout the process, developing countries
have demonstrated that, with the right kind
of assistance, they are willing, ready and
able to become full partners in global efforts
to protect the environment. In fact, many
Strengthening international action on climate change
remains relevant and urgent. And the window of opportunity
afforded by the short-term dip in emissions should be used
to the fullest extent. Last year’s negotiations under the UN
Framework Convention on Climate Change yielded some
results, but much remains to be done in order to formulate
and put in place a decisive response to the climate change
problem by the international community.
2009. But the same estimates also suggest
that the decline will be short-lived: following
economic recovery, the agency predicts,
global emissions will soon restart their
growth and, under a ‘reference scenario’,
are projected to exceed the 1990 level by
about 65 per cent by 2020. Such growth is
unsustainable and would further increase the
risk of profound and adverse effects on the
global climate system.
Consumption of all ozone-depleting substances (ODSs), 1986-2008 (Thousands of metric tons of ozone-depleting potential) and Montreal Protocol’s Multilateral Fund replenishment, 1991-2011 (Millions of US dollars)
Cons
umpt
ion
of O
DS
(Tho
usan
d of
met
ric
tons
of O
DP)
Mul
tila
tera
l Fun
d Cu
mul
ativ
e Re
plen
ishm
ent
(Mill
ions
ofU
S$)
500
1000
1500
2000
2500
3000
3500
0
ODS consumption: developed regionsODS consumption: developing regions and the CISCumulative replenishment of the Multilateral Fund
0
200
400
600
800
1000
1200
1400
2011200820062004200220001998199619941992199019881986
developing countries have exceeded the reduction targets for
phasing out ODSs, with the support of the Montreal Protocol
Multilateral Fund.
Between 1986 and 2008, global consumption of ODSs was
reduced by 98 per cent. Furthermore, from 1990 to 2010,
the Montreal Protocol’s control measures on production
and consumption of such substances will have reduced
greenhouse gas emissions by the equivalent of 135 gigatons
of CO2.This is equivalent to 11 gigatons a year, four to fi ve
times the reductions targeted in the fi rst commitment period
of the Kyoto Protocol, the agreement linked to the UN
Framework Convention on Climate Change. Parties to the
Montreal Protocol are now examining ways to use the treaty’s
vigorous implementation regime to promote even greater
climate change benefi ts.
The unparalleled success of the Montreal Protocol shows that action on climate change is within our grasp
MDG Report 2010 En 20100604 r14 Final.indd Sec2:54MDG Report 2010 En 20100604 r14 Final.indd Sec2:54 6/15/2010 12:52:33 PM6/15/2010 12:52:33 PM
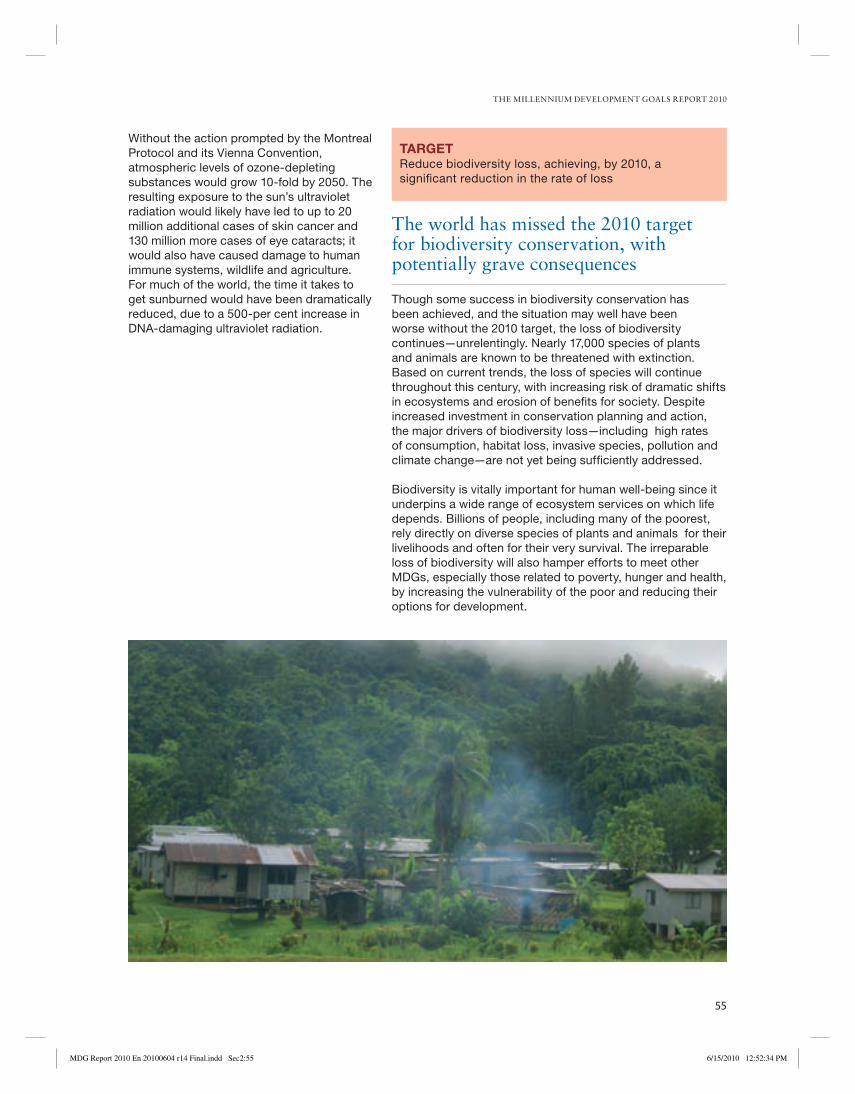
THE MILLENNIUM DEVELOPMENT GOALS REPORT 2010
55
The world has missed the 2010 target for biodiversity conservation, with potentially grave consequences
Though some success in biodiversity conservation has
been achieved, and the situation may well have been
worse without the 2010 target, the loss of biodiversity
continues—unrelentingly. Nearly 17,000 species of plants
and animals are known to be threatened with extinction.
Based on current trends, the loss of species will continue
throughout this century, with increasing risk of dramatic shifts
in ecosystems and erosion of benefi ts for society. Despite
increased investment in conservation planning and action,
the major drivers of biodiversity loss—including high rates
of consumption, habitat loss, invasive species, pollution and
climate change—are not yet being suffi ciently addressed.
Biodiversity is vitally important for human well-being since it
underpins a wide range of ecosystem services on which life
depends. Billions of people, including many of the poorest,
rely directly on diverse species of plants and animals for their
livelihoods and often for their very survival. The irreparable
loss of biodiversity will also hamper efforts to meet other
MDGs, especially those related to poverty, hunger and health,
by increasing the vulnerability of the poor and reducing their
options for development.
Without the action prompted by the Montreal
Protocol and its Vienna Convention,
atmospheric levels of ozone-depleting
substances would grow 10-fold by 2050. The
resulting exposure to the sun’s ultraviolet
radiation would likely have led to up to 20
million additional cases of skin cancer and
130 million more cases of eye cataracts; it
would also have caused damage to human
immune systems, wildlife and agriculture.
For much of the world, the time it takes to
get sunburned would have been dramatically
reduced, due to a 500-per cent increase in
DNA-damaging ultraviolet radiation.
TARGETReduce biodiversity loss, achieving, by 2010, a
signifi cant reduction in the rate of loss
MDG Report 2010 En 20100604 r14 Final.indd Sec2:55MDG Report 2010 En 20100604 r14 Final.indd Sec2:55 6/15/2010 12:52:34 PM6/15/2010 12:52:34 PM

UNITED NATIONS
56
0
10
20
30
40
50
2007200019901980197019601950
Proportion of key biodiversity areas protected, 1950-2007 (Percentage)
Note: Data refer to 10,993 Important Bird Areas (IBAs) and 561 Alliance
Alliance for Zero Extinction sitesImportant Bird Areas
Key habitats for threatened species are not being adequately protected
Although nearly 12 per cent of the planet’s land area
and nearly 1 per cent of its sea area are currently under
protection, other areas critical to the earth’s biodiversity
are not yet adequately safeguarded. In 2009, only half of
the world’s 821 terrestrial ecoregions—large areas with
characteristic combinations of habitats, species, soils
and landforms—had more than 10 per cent of their area
protected. Under the Convention on Biological Diversity, one
tenth of the areas of all these ecoregions should have been
under protection by 2010.
Progress in key areas of biodiversity has been made, but
not fast enough. By 2007, 35 per cent of 561 Alliance for
Zero Extinction sites and 26 per cent of 10,993 Important
Bird Areas were completely protected, a signifi cant increase
from 25 per cent and 19 per cent, respectively, in 1990.
Alliance for Zero Extinction sites are home to over 95 per
cent of the world population of a ‘critically endangered’ or
‘endangered’ species, as defi ned by the International Union
for Conservation of Nature’s (IUCN’s) Red List of Threatened
Species. Important Bird Areas are critical sites for the
conservation of the world’s birds. Protecting all of these areas
would signifi cantly contribute to the Convention on Biological
Diversity’s target to safeguard areas of particular importance.
However, at present, more than two thirds of these sites are
unprotected or only partially protected. In addition, while
certain areas may be offi cially ‘protected’, this does not
mean that they are adequately managed or that the coverage
provided is suffi cient to effectively conserve critical habitats
and species.
MDG Report 2010 En 20100604 r14 Final.indd Sec2:56MDG Report 2010 En 20100604 r14 Final.indd Sec2:56 6/15/2010 12:52:34 PM6/15/2010 12:52:34 PM

THE MILLENNIUM DEVELOPMENT GOALS REPORT 2010
57
0.84
0.86
0.88
0.90
0.92
0.94
200820042000199619921988
Proportion of species expected to remain extant in the near future in the absence of additional conservation action (IUCN Red List Index of species survival for birds, 1988-2008, and mammals, 1996-2008)
19
25
39
Note: A Red List Index value of 1.0 means that all species are categorized as of ‘least concern’, and hence none are expected to go extinct in the near future. A value of zero indicates that all species have gone extinct.
Bett
erW
orse
39
Birds: developed regionsBirds: developing regionsMammals: developed countriesMammals: developing countries
The IUCN’s Red List Index—which charts the proportion of species expected to remain in existence in the near
future in the absence of additional conservation action—shows that more species are being driven towards
extinction than are improving in status. Mammals are more threatened than birds. And for both groups,
species in the developing regions are more threatened and deteriorating as fast as, or faster than, species in
the developed regions.
The number of species facing extinction is growing by the day, especially in developing countries
Overexploitation of global fi sheries has stabilized, but steep challenges remain to ensure their sustainability
Global production of marine capture fi sheries peaked in 1997 at 88.4 million metric tons and has since
declined slightly, to about 83.5 million metric tons in 2006. The proportion of overexploited, depleted and
recovering stocks has remained relatively stable over the last 10 years, at about 28 per cent. However, the
proportion of underexploited and moderately exploited stocks has declined continuously, indicating that the
negative impact of fi sheries is increasing. Only about 20 per cent of fi sh stocks were moderately exploited or
underexploited, with the possibility of producing more.
MDG Report 2010 En 20100604 r14 Final.indd Sec2:57MDG Report 2010 En 20100604 r14 Final.indd Sec2:57 6/15/2010 12:52:36 PM6/15/2010 12:52:36 PM
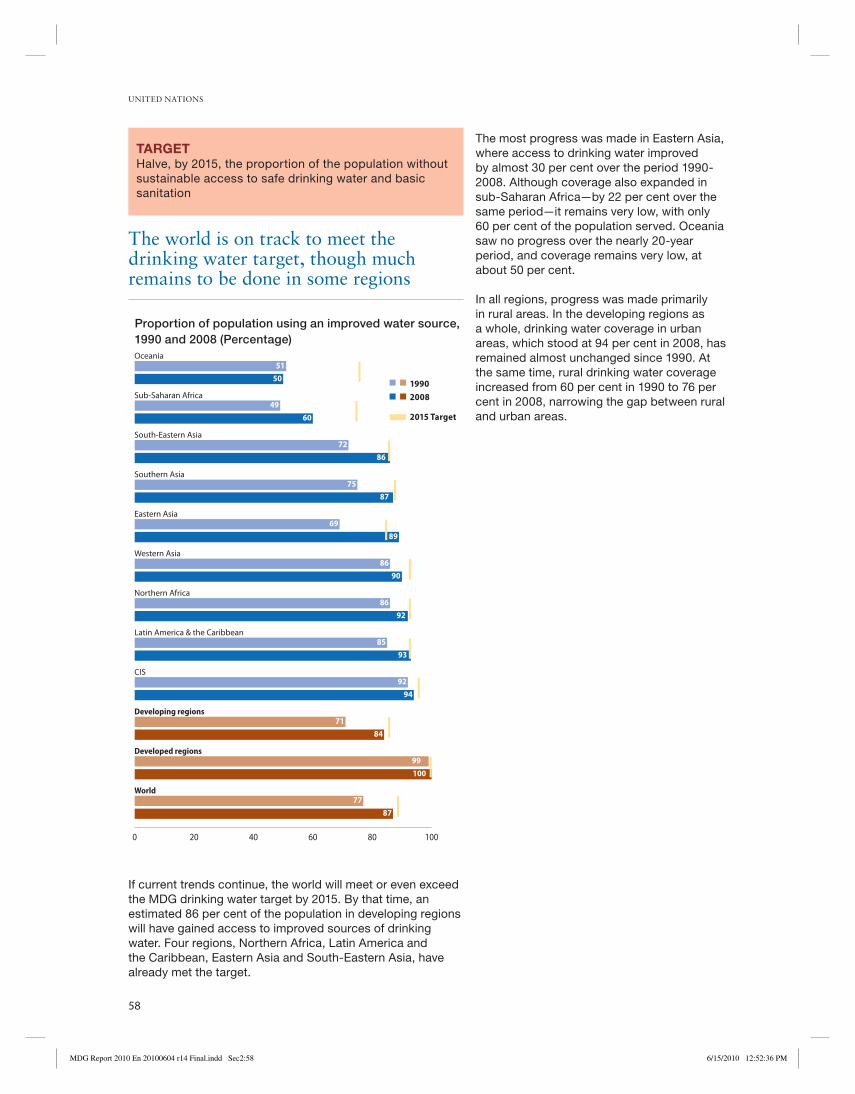
UNITED NATIONS
58
The most progress was made in Eastern Asia,
where access to drinking water improved
by almost 30 per cent over the period 1990-
2008. Although coverage also expanded in
sub-Saharan Africa—by 22 per cent over the
same period—it remains very low, with only
60 per cent of the population served. Oceania
saw no progress over the nearly 20-year
period, and coverage remains very low, at
about 50 per cent.
In all regions, progress was made primarily
in rural areas. In the developing regions as
a whole, drinking water coverage in urban
areas, which stood at 94 per cent in 2008, has
remained almost unchanged since 1990. At
the same time, rural drinking water coverage
increased from 60 per cent in 1990 to 76 per
cent in 2008, narrowing the gap between rural
and urban areas.
The world is on track to meet the drinking water target, though much remains to be done in some regions
If current trends continue, the world will meet or even exceed
the MDG drinking water target by 2015. By that time, an
estimated 86 per cent of the population in developing regions
will have gained access to improved sources of drinking
water. Four regions, Northern Africa, Latin America and
the Caribbean, Eastern Asia and South-Eastern Asia, have
already met the target.
TARGETHalve, by 2015, the proportion of the population without
sustainable access to safe drinking water and basic
sanitation
0 20 40 60 80 100
World
Developed regions
Developing regions
CIS
Latin America & the Caribbean
Northern Africa
Western Asia
Eastern Asia
Southern Asia
South-Eastern Asia
Sub-Saharan Africa
Oceania
Proportion of population using an improved water source,1990 and 2008 (Percentage)
51
50
49
60
72
86
87
69
89
86
86
90
92
85
93
92
94
71
84
99
100
77
87
75
19902008
2015 Target
MDG Report 2010 En 20100604 r14 Final.indd Sec2:58MDG Report 2010 En 20100604 r14 Final.indd Sec2:58 6/15/2010 12:52:36 PM6/15/2010 12:52:36 PM

THE MILLENNIUM DEVELOPMENT GOALS REPORT 2010
59
Accelerated and targeted efforts are needed to bring drinking water to all rural households
Despite overall progress in drinking water coverage and
narrowing of the urban-rural gap, rural areas remain at a
disadvantage in all developing regions. The largest disparities
are in Oceania and sub-Saharan Africa, but signifi cant
differences between urban and rural areas are found even in
regions that have achieved relatively high coverage, such as
Western Asia and Latin America and the Caribbean.
The rural-urban gap is much wider when only households
having a piped drinking water supply on premises are
considered. The proportion of people who enjoy the health
and economic benefi ts of piped water is more than twice as
high in urban areas than in rural areas—79 per cent versus
34 per cent. Disparities are particularly evident in Oceania
and sub-Saharan Africa, where rural coverage of piped water
remains very low at 37 per cent and 47 per cent, respectively,
as compared to 91 per cent and 83 per cent in urban areas.
Globally, eight out of 10 people who are still without access to
an improved drinking water source live in rural areas.
0 20 40 60 80 100
World
Developing regions
Developed regions
CIS
Northern Africa
Southern Asia
Eastern Asia
South-Eastern Asia
Latin America & the Caribbean
Western Asia
Sub-Saharan Africa
Oceania
Proportion of population using an improved water source, rural and urban areas, 2008 (Percentage)
9678
4783
9237
9780
9281
9882
9583
9587
9887
10098
9476
9678
Rural areasUrban areas
Safe water supply remains a challenge in many parts of the world
During the last decade, expanded activity in
agriculture and manufacturing has not only
increased the demand for water, but has
also contributed to the pollution of surface
and ground water. Moreover, problems
of contamination with naturally occurring
inorganic arsenic, in particular in Bangladesh
and other parts of Southern Asia, or fl uoride
in a number of countries, including China
and India, have affected the safety of water
supplies.
In the future, water quality will need to be
considered when setting targets for access to
safe water. Despite efforts to compile global
water quality data, measuring the safety of
water can be diffi cult; in developing regions,
it has been attempted so far only in pilot
surveys. Rapid, reliable and cost-effective
ways of measuring water quality locally and
reporting fi ndings at the global level will
need to be identifi ed to overcome the current
technical and logistic constraints, along with
the high cost.
MDG Report 2010 En 20100604 r14 Final.indd Sec2:59MDG Report 2010 En 20100604 r14 Final.indd Sec2:59 6/15/2010 12:52:37 PM6/15/2010 12:52:37 PM
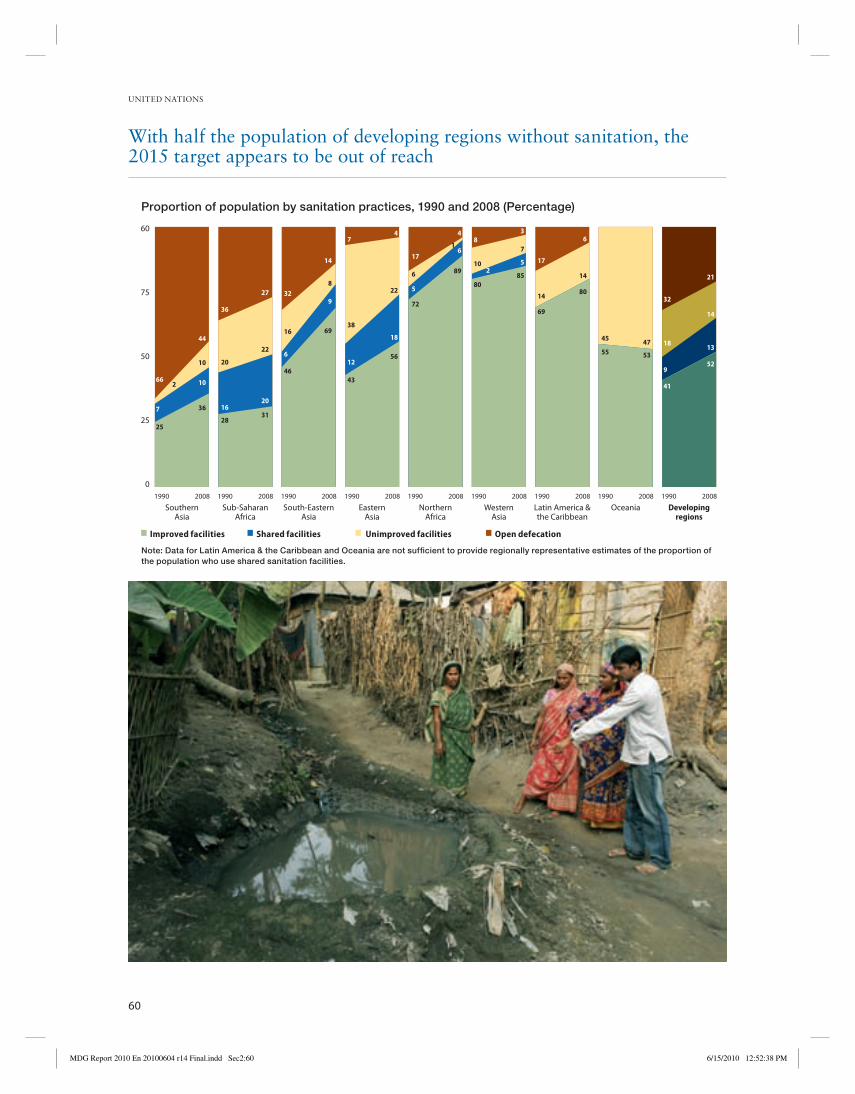
UNITED NATIONS
60
Proportion of population by sanitation practices, 1990 and 2008 (Percentage)
0
25
50
75
60
1990 2008 1990 2008 1990 2008 1990 2008 1990 2008 1990 2008 1990 2008 1990 2008 1990 2008
Sub-SaharanAfrica
South-EasternAsia
EasternAsia
NorthernAfrica
WesternAsia
Latin America &the Caribbean
Oceania Developingregions
SouthernAsia
Improved facilities Shared facilities Unimproved facilities Open defecation
25
7
66
36
27
20
31
22
20
16
28
69
9
14
4 4 3
5
85
7
14
80
5352
13
14
21
47
6
6
89
1
18
56
228
4643
72
80
69
17
14 32
18
9
41
45
55
8
102
5
17
6
12
7
38
6
16
32
44
10
10
36
2
Note: Data for Latin America & the Caribbean and Oceania are not sufficient to provide regionally representative estimates of the proportion of the population who use shared sanitation facilities.
With half the population of developing regions without sanitation, the 2015 target appears to be out of reach
MDG Report 2010 En 20100604 r14 Final.indd Sec2:60MDG Report 2010 En 20100604 r14 Final.indd Sec2:60 6/15/2010 12:52:38 PM6/15/2010 12:52:38 PM

THE MILLENNIUM DEVELOPMENT GOALS REPORT 2010
61
Disparities in urban and rural sanitation coverage remain daunting
Most progress in sanitation has occurred in rural areas. Over
the period 1990-2008, sanitation coverage for the whole of
the developing regions increased by only 5 per cent in urban
areas and by 43 per cent in rural areas. In Southern Asia,
coverage rose from 56 per cent to 57 per cent of the urban
population—a mere 1 per cent increase—while doubling in
rural areas, from 13 per cent to 26 per cent. The gap between
rural and urban areas, however, remains huge, especially in
Southern Asia, sub-Saharan Africa and Oceania.
At the current rate of progress, the world will
miss the target of halving the proportion of
people without access to basic sanitation. In
2008, an estimated 2.6 billion people around
the world lacked access to an improved
sanitation facility. If the trend continues, that
number will grow to 2.7 billion by 2015.
In 2008, 48 per cent of the population in
developing regions were without basic
sanitation. The two regions facing the greatest
challenges are sub-Saharan Africa and
Southern Asia, where 69 per cent and 64
per cent of the population, respectively, lack
access.
Among sanitation practices, the one that
poses the greatest threat to human health
is open defecation. It is encouraging that
this practice has declined in all developing
regions. However, the largest relative decline
was in two regions where open defecation
was already practised the least—Northern
Africa and Western Asia. In contrast, the
least progress (a decrease of 25 per cent)
was made in sub-Saharan Africa, where rates
of open defecation are high. Southern Asia,
which has the highest rate of open defecation
in the world (44 per cent of the population),
made only limited progress.
The practice of open defecation by 1.1
billion people is an affront to human dignity.
Moreover, indiscriminate defecation is the root
cause of faecal-oral transmission of disease,
which can have lethal consequences for the
most vulnerable members of society—young
children. If open defecation rates continue to
decline, the impact on reducing child deaths
could be enormous, primarily by preventing
diarrhoeal diseases and the stunting and
undernutrition that tend to follow. Success
stories among some of the poorest and most
disadvantaged groups in society show that
behaviours can change. What is required is
the political will to mobilize the resources
needed to stop open defecation, which
represents the greatest obstacle to tackling
the sanitation problem.
0 20 40 60 80 100
World
Developing regions
Developed regions
CIS
Northern Africa
Western Asia
South-Eastern Asia
Latin America & the Caribbean
Eastern Asia
Oceania
Southern Asia
Sub-Saharan Africa
Proportion of population using an improved sanitation facility in urban and rural areas, 2008 (Percentage)
2444
2657
4581
5361
5586
6794
6079
9483
9383
96100
4068
4576
Rural areasUrban areas
MDG Report 2010 En 20100604 r14 Final.indd Sec2:61MDG Report 2010 En 20100604 r14 Final.indd Sec2:61 6/15/2010 12:52:41 PM6/15/2010 12:52:41 PM
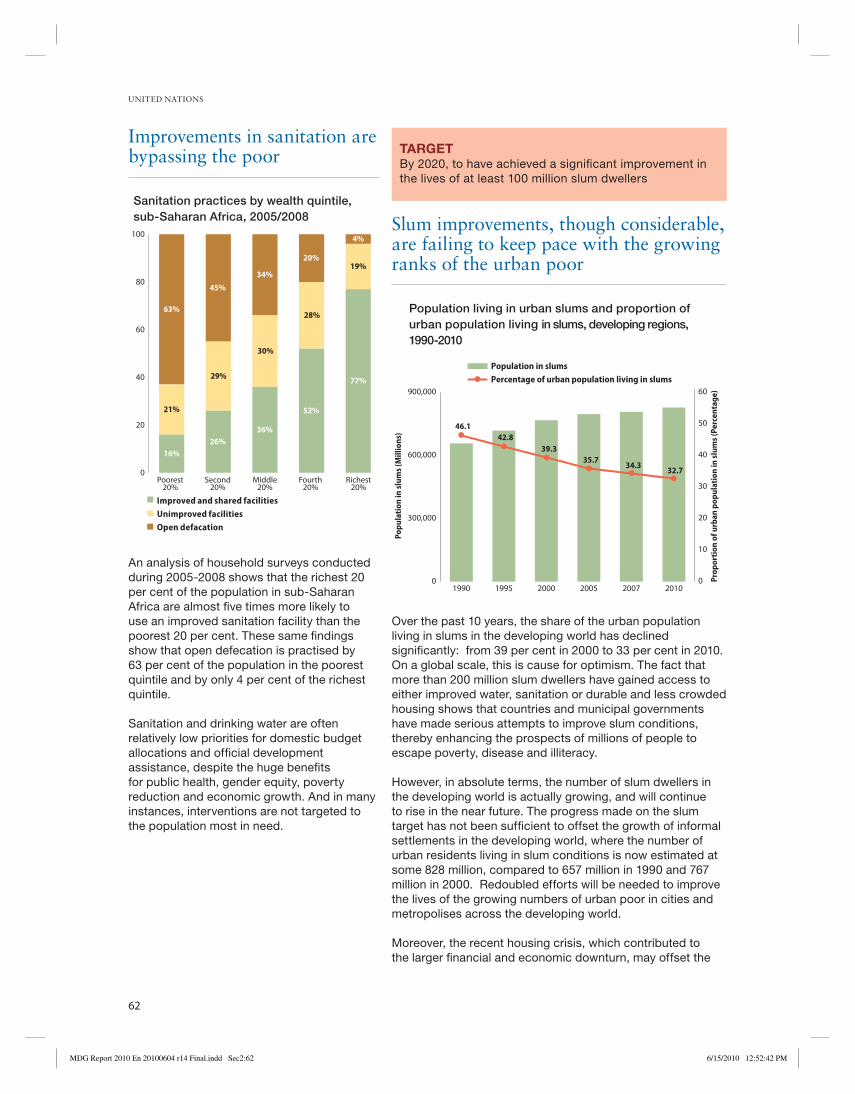
UNITED NATIONS
62
Improvements in sanitation are bypassing the poor
An analysis of household surveys conducted
during 2005-2008 shows that the richest 20
per cent of the population in sub-Saharan
Africa are almost fi ve times more likely to
use an improved sanitation facility than the
poorest 20 per cent. These same fi ndings
show that open defecation is practised by
63 per cent of the population in the poorest
quintile and by only 4 per cent of the richest
quintile.
Sanitation and drinking water are often
relatively low priorities for domestic budget
allocations and offi cial development
assistance, despite the huge benefi ts
for public health, gender equity, poverty
reduction and economic growth. And in many
instances, interventions are not targeted to
the population most in need.
TARGETBy 2020, to have achieved a signifi cant improvement in
the lives of at least 100 million slum dwellers
0
20
40
60
80
100
Richest20%
Fourth20%
Middle20%
Second20%
Poorest20%
Sanitation practices by wealth quintile, sub-Saharan Africa, 2005/2008
Improved and shared facilitiesUnimproved facilitiesOpen defacation
29%
16%
21%
63%
45%
26%36%
52%
77%
19%
4%
20%
34%
30%
28%
Slum improvements, though considerable, are failing to keep pace with the growing ranks of the urban poor
Over the past 10 years, the share of the urban population
living in slums in the developing world has declined
signifi cantly: from 39 per cent in 2000 to 33 per cent in 2010.
On a global scale, this is cause for optimism. The fact that
more than 200 million slum dwellers have gained access to
either improved water, sanitation or durable and less crowded
housing shows that countries and municipal governments
have made serious attempts to improve slum conditions,
thereby enhancing the prospects of millions of people to
escape poverty, disease and illiteracy.
However, in absolute terms, the number of slum dwellers in
the developing world is actually growing, and will continue
to rise in the near future. The progress made on the slum
target has not been suffi cient to offset the growth of informal
settlements in the developing world, where the number of
urban residents living in slum conditions is now estimated at
some 828 million, compared to 657 million in 1990 and 767
million in 2000. Redoubled efforts will be needed to improve
the lives of the growing numbers of urban poor in cities and
metropolises across the developing world.
Moreover, the recent housing crisis, which contributed to
the larger fi nancial and economic downturn, may offset the
0
300,000
600,000
900,000
2010200720052000199519900
10
20
30
40
50
60
Population living in urban slums and proportion of urban population living in slums, developing regions, 1990-2010
46.142.8
39.335.7
34.332.7
4%
Popu
lati
on in
slu
ms
(Mill
ions
)
Prop
orti
on o
f urb
an p
opul
atio
n in
slu
ms
(Per
cent
age)
Population in slumsPercentage of urban population living in slums
MDG Report 2010 En 20100604 r14 Final.indd Sec2:62MDG Report 2010 En 20100604 r14 Final.indd Sec2:62 6/15/2010 12:52:42 PM6/15/2010 12:52:42 PM

THE MILLENNIUM DEVELOPMENT GOALS REPORT 2010
63
progress that was made since 1990. Although
the crisis did not originate in developing
regions, it has hit their populations and
cities, where millions continue to live in
precarious conditions, often characterized by
a lack of basic services and serious health
threats. In many cases, public authorities
have exacerbated the housing crisis through
failures on four major counts: lack of land
titles and other forms of secure tenure;
cutbacks in funds for subsidized housing for
the poor; lack of land reserves earmarked
for low-income housing; and an inability to
intervene in the market to control land and
property speculation. Low incomes in the
face of rising land prices virtually rule out the
possibility that the working poor can ever own
land, contributing to the problem of urban
slums.
A revised target for slum improvement is needed to spur country-level action
When the international community adopted
the Millennium Declaration and endorsed
the ‘Cities without Slums’ target in 2000,
experts had underestimated the number
of people living in substandard conditions.
They had also determined that improving
the lives of 100 million slum dwellers was a
signifi cant number and a realistic target to
be achieved within the next 20 years. Three
years later, in 2003, new and improved data
sources showed for the fi rst time that 100
million was only a small fraction—about 10
per cent—of the global slum population.
In addition, unlike other MDGs, the slum
target was not set as a proportion with
reference to a specifi c baseline (generally
the year 1990). Instead, the target was
set as an absolute number, and for the
world as a whole. This makes it diffi cult,
if not impossible, for governments to set
meaningful country-specifi c goals. Clearly,
the target will require redefi nition if it is to
elicit serious commitment from national
governments and the donor community—
and hold them accountable for continued
progress.
MDG Report 2010 En 20100604 r14 Final.indd Sec2:63MDG Report 2010 En 20100604 r14 Final.indd Sec2:63 6/15/2010 12:52:42 PM6/15/2010 12:52:42 PM
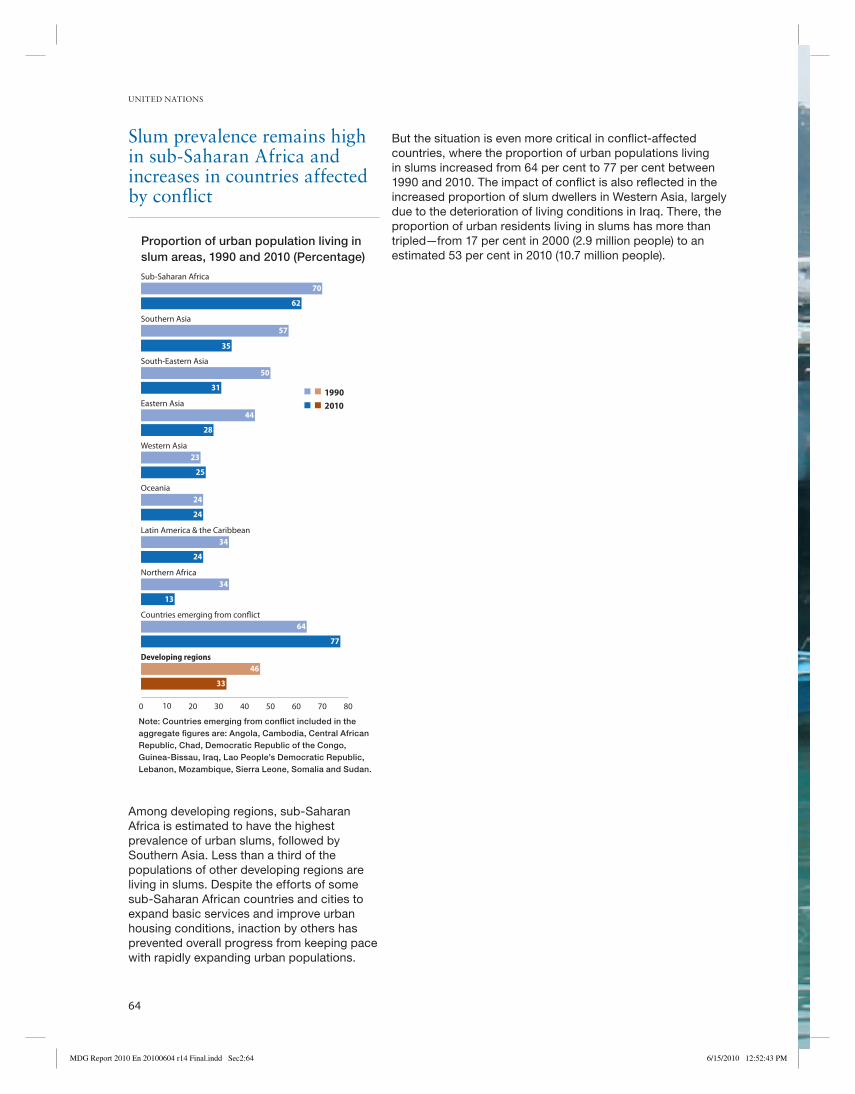
UNITED NATIONS
64
But the situation is even more critical in confl ict-affected
countries, where the proportion of urban populations living
in slums increased from 64 per cent to 77 per cent between
1990 and 2010. The impact of confl ict is also refl ected in the
increased proportion of slum dwellers in Western Asia, largely
due to the deterioration of living conditions in Iraq. There, the
proportion of urban residents living in slums has more than
tripled—from 17 per cent in 2000 (2.9 million people) to an
estimated 53 per cent in 2010 (10.7 million people).
Slum prevalence remains high in sub-Saharan Africa and increases in countries affected by confl ict
Among developing regions, sub-Saharan
Africa is estimated to have the highest
prevalence of urban slums, followed by
Southern Asia. Less than a third of the
populations of other developing regions are
living in slums. Despite the efforts of some
sub-Saharan African countries and cities to
expand basic services and improve urban
housing conditions, inaction by others has
prevented overall progress from keeping pace
with rapidly expanding urban populations.
0 10 20 30 40 50 60 70 80
Developing regions
Countries emerging from conflict
Northern Africa
Latin America & the Caribbean
Oceania
Western Asia
Eastern Asia
South-Eastern Asia
Southern Asia
Sub-Saharan Africa
Proportion of urban population living in slum areas, 1990 and 2010 (Percentage)
70
62
57
35
50
31
44
28
23
25
24
24
34
24
34
13
64
77
46
33
Note: Countries emerging from conflict included in the aggregate figures are: Angola, Cambodia, Central African Republic, Chad, Democratic Republic of the Congo, Guinea-Bissau, Iraq, Lao People’s Democratic Republic, Lebanon, Mozambique, Sierra Leone, Somalia and Sudan.
19902010
MDG Report 2010 En 20100604 r14 Final.indd Sec2:64MDG Report 2010 En 20100604 r14 Final.indd Sec2:64 6/15/2010 12:52:43 PM6/15/2010 12:52:43 PM

THE MILLENNIUM DEVELOPMENT GOALS REPORT 2010
65
MDG Report 2010 En 20100604 r14 Final.indd Sec2:65MDG Report 2010 En 20100604 r14 Final.indd Sec2:65 6/15/2010 12:52:44 PM6/15/2010 12:52:44 PM
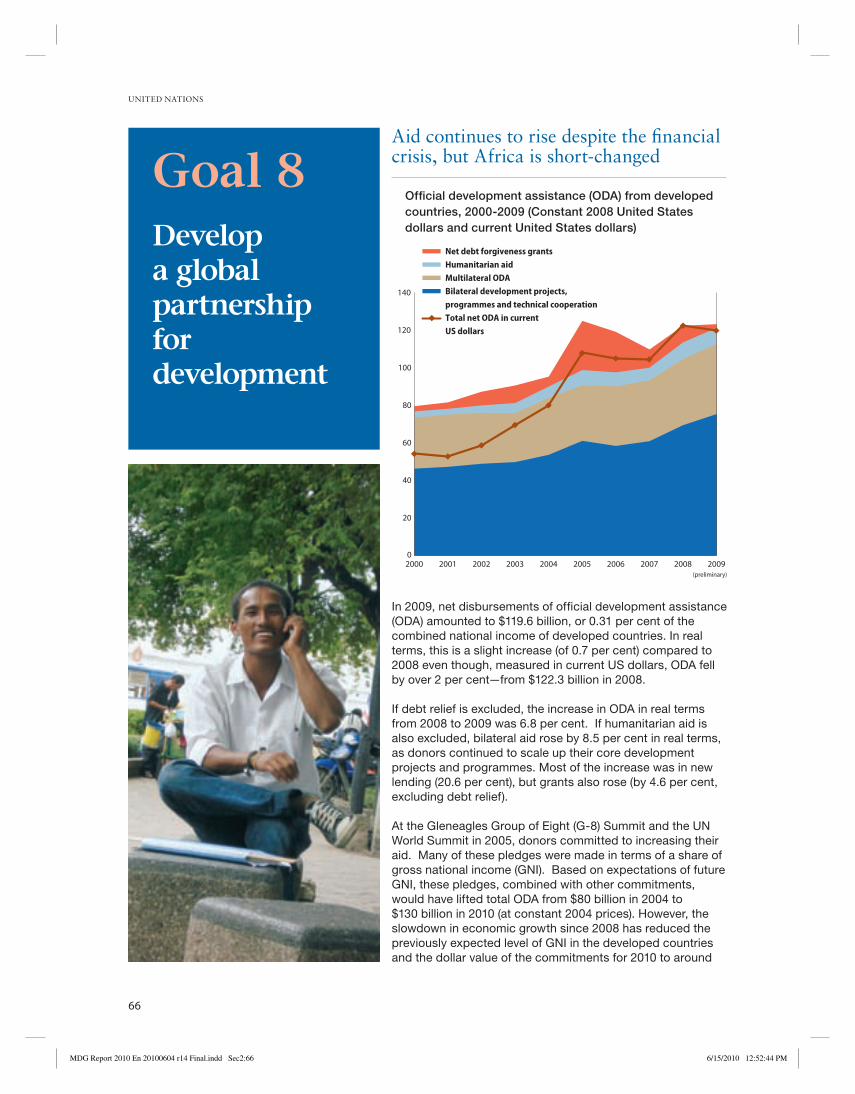
UNITED NATIONS
66
Aid continues to rise despite the fi nancial crisis, but Africa is short-changed
In 2009, net disbursements of offi cial development assistance
(ODA) amounted to $119.6 billion, or 0.31 per cent of the
combined national income of developed countries. In real
terms, this is a slight increase (of 0.7 per cent) compared to
2008 even though, measured in current US dollars, ODA fell
by over 2 per cent—from $122.3 billion in 2008.
If debt relief is excluded, the increase in ODA in real terms
from 2008 to 2009 was 6.8 per cent. If humanitarian aid is
also excluded, bilateral aid rose by 8.5 per cent in real terms,
as donors continued to scale up their core development
projects and programmes. Most of the increase was in new
lending (20.6 per cent), but grants also rose (by 4.6 per cent,
excluding debt relief).
At the Gleneagles Group of Eight (G-8) Summit and the UN
World Summit in 2005, donors committed to increasing their
aid. Many of these pledges were made in terms of a share of
gross national income (GNI). Based on expectations of future
GNI, these pledges, combined with other commitments,
would have lifted total ODA from $80 billion in 2004 to
$130 billion in 2010 (at constant 2004 prices). However, the
slowdown in economic growth since 2008 has reduced the
previously expected level of GNI in the developed countries
and the dollar value of the commitments for 2010 to around
Goal 8Develop a global partnership for development
Official development assistance (ODA) from developed countries, 2000-2009 (Constant 2008 United States dollars and current United States dollars)
0
20
40
60
80
100
120
140
2009200820072006200520042003200220012000
Net debt forgiveness grantsHumanitarian aidMultilateral ODABilateral development projects, programmes and technical cooperationTotal net ODA in current US dollars
(preliminary)
MDG Report 2010 En 20100604 r14 Final.indd Sec2:66MDG Report 2010 En 20100604 r14 Final.indd Sec2:66 6/15/2010 12:52:44 PM6/15/2010 12:52:44 PM

THE MILLENNIUM DEVELOPMENT GOALS REPORT 2010
67
Only fi ve donor countries have reached the UN target for offi cial aid
Aid remains well below the United Nations target of 0.7 per
cent of gross national income for most donors. In 2009, the
only countries to reach or exceed the target were Denmark,
Luxembourg, the Netherlands, Norway and Sweden. The
largest donors by volume in 2009 were the United States,
followed by France, Germany, the United Kingdom and
Japan.
This year is a milestone for European Union members of the
Development Assistance Committee of the Organisation for
Economic Co-operation and Development. In 2005, DAC-
EU member states agreed to reach a collective total of 0.56
per cent of GNI in net ODA in 2010, with a minimum country
target of 0.51 per cent.
Some countries will achieve or even surpass that goal:
Sweden, with the world’s highest ODA as a percentage of
GNI (1.01 per cent), is followed by Luxembourg (1 per cent),
Denmark (0.83 per cent), the Netherlands (0.8 per cent),
Belgium (0.7 per cent), the United Kingdom (0.6 per cent),
$126 billion (at constant 2004 prices).
Moreover, the economic slowdown has put
pressure on government budgets in the
developed countries. While the majority of
the initial commitments remain in force, some
large donors have reduced or postponed the
pledges they made for 2010. On the basis
of current 2010 budget proposals, as well as
the lower GNI forecasts, total ODA for 2010 is
projected to be $108 billion (at 2004 prices).
The shortfall in aid affects Africa in particular.
At the 2005 Gleneagles Summit, G-8
members projected that their commitments,
combined with those of other donors, would
double ODA to Africa by 2010. Preliminary
data for 2009 show that bilateral ODA to
Africa as a whole rose by 3 per cent in real
terms. For sub-Saharan Africa, bilateral aid
increased by 5.1 per cent in real terms over
2008. It is estimated that Africa will receive
only about $11 billion out of the $25 billion
increase envisaged at Gleneagles, due mainly
to the underperformance of some European
donors who earmark large shares of their aid
to Africa.
TARGETAddress the special needs of the least developed
countries, landlocked countries and small island
developing states
0.00
0.05
0.10
0.15
0.20
0.25
0.30
0.35
0.40
2009 (preliminary)
2008200620042002200019981996199419921990
Net official development assistance from OECD-DAC countries as a proportion of donors’ gross national income, 1990-2009 (Percentage)
Total ODAODA to LDCs
MDG Report 2010 En 20100604 r14 Final.indd Sec2:67MDG Report 2010 En 20100604 r14 Final.indd Sec2:67 6/15/2010 12:52:46 PM6/15/2010 12:52:46 PM

UNITED NATIONS
68
Finland (0.56 per cent), Ireland (0.52 per cent)
and Spain (0.51 per cent).
But others are unlikely to reach the target:
ODA as a percentage of GNI is estimated at
between 0.44 and 0.48 per cent for France,
0.40 for Germany, 0.37 for Austria, 0.34 for
Portugal, 0.21 for Greece, and 0.20 for Italy.
This year is also special for DAC-EU donors
because it represents the midpoint between
their 2005 commitments and the 2015 target
date for meeting the 0.7 per cent GNI target.
Aid concentrates increasingly on the poorest
countries, with the least developed countries
(LDCs) receiving about a third of donors’ total
aid fl ows. In 2007-2008, out of an average
total of $71.6 billion of bilateral ODA that
was allocated for specifi c purposes, $15.2
billion focused on achievement of MDG
3—the promotion of gender equality and the
empowerment of women.
Developing countries gain greater access to the markets of developed countries
Over the last decade, developing countries and LDCs have
gained greater access to the markets of developed countries.
The proportion of imports (excluding arms and oil) by
developed countries from all developing countries admitted
free of duty reached almost 80 per cent in 2008—up from 54
per cent in 1998. For the LDCs, this proportion increased only
marginally from 78 per cent in 1998 to almost 81 per cent in
2008.
For the developing countries as a whole, increased market
access is attributable mainly to the elimination of tariffs under
‘most favoured nation’ (MFN) treatment, notably before 2004.
Since then, no signifi cant tariff reduction has been made by
developed countries in terms of MFN treatment.
TARGETDevelop further an open, rule-based, predictable, non-
discriminatory trading and fi nancial system
0
10
20
30
40
50
60
70
80
90
2008200620042002200019981996
Proportion of developed country imports from developing countries and from the least developed countries (LDCs) admitted free of duty and admitted free of duty while their competitors' products were subject to a tariff under MFN (preferential duty free access), 1996-2008 (Percentage)
39
Total duty free access, LDCsTotal duty free access, all developing countriesPreferential duty free access, LDCsPreferential duty free access, all developing countries
MDG Report 2010 En 20100604 r14 Final.indd Sec2:68MDG Report 2010 En 20100604 r14 Final.indd Sec2:68 6/15/2010 12:52:46 PM6/15/2010 12:52:46 PM
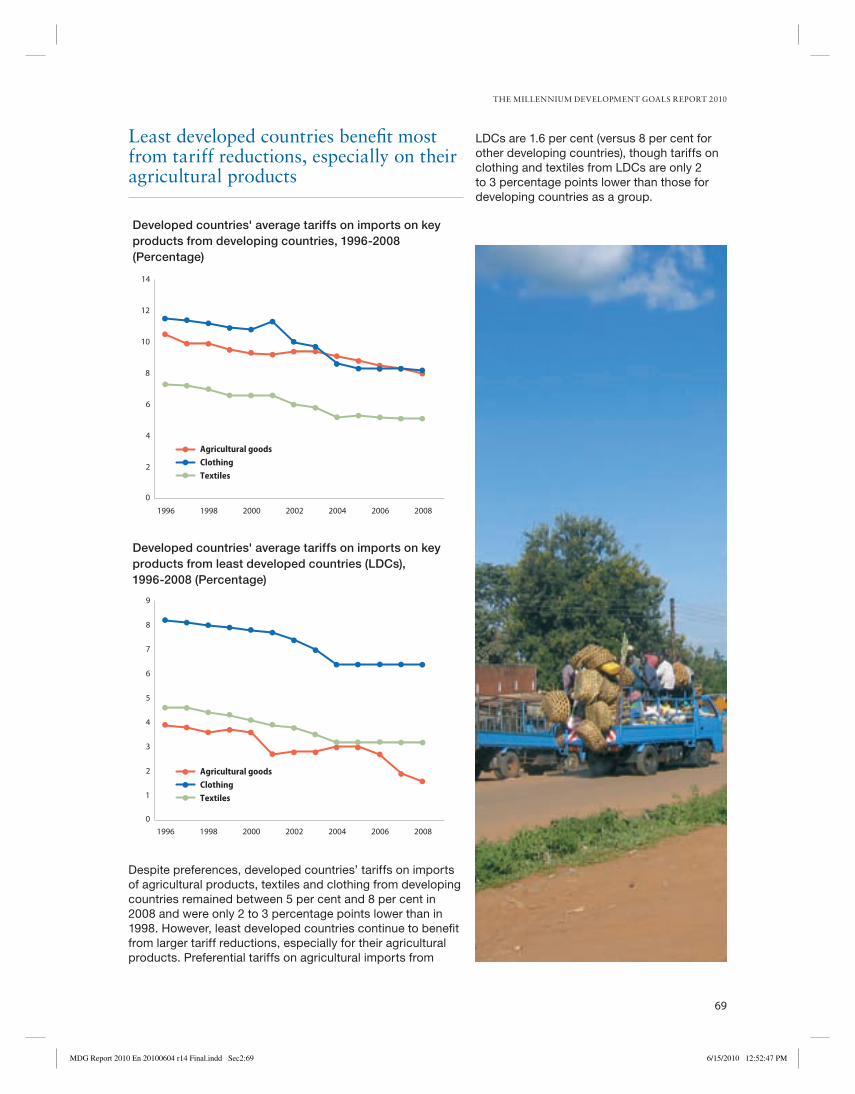
THE MILLENNIUM DEVELOPMENT GOALS REPORT 2010
69
Least developed countries benefi t most from tariff reductions, especially on their agricultural products
Despite preferences, developed countries’ tariffs on imports
of agricultural products, textiles and clothing from developing
countries remained between 5 per cent and 8 per cent in
2008 and were only 2 to 3 percentage points lower than in
1998. However, least developed countries continue to benefi t
from larger tariff reductions, especially for their agricultural
products. Preferential tariffs on agricultural imports from
LDCs are 1.6 per cent (versus 8 per cent for
other developing countries), though tariffs on
clothing and textiles from LDCs are only 2
to 3 percentage points lower than those for
developing countries as a group.
Developed countries' average tariffs on imports on key products from developing countries, 1996-2008 (Percentage)
0
2
4
6
8
10
12
14
2008200620042002200019981996
Agricultural goodsClothingTextiles
Agricultural goodsClothingTextiles
Developed countries' average tariffs on imports on key products from least developed countries (LDCs), 1996-2008 (Percentage)
0
1
2
3
4
5
6
7
8
9
2008200620042002200019981996
MDG Report 2010 En 20100604 r14 Final.indd Sec2:69MDG Report 2010 En 20100604 r14 Final.indd Sec2:69 6/15/2010 12:52:47 PM6/15/2010 12:52:47 PM
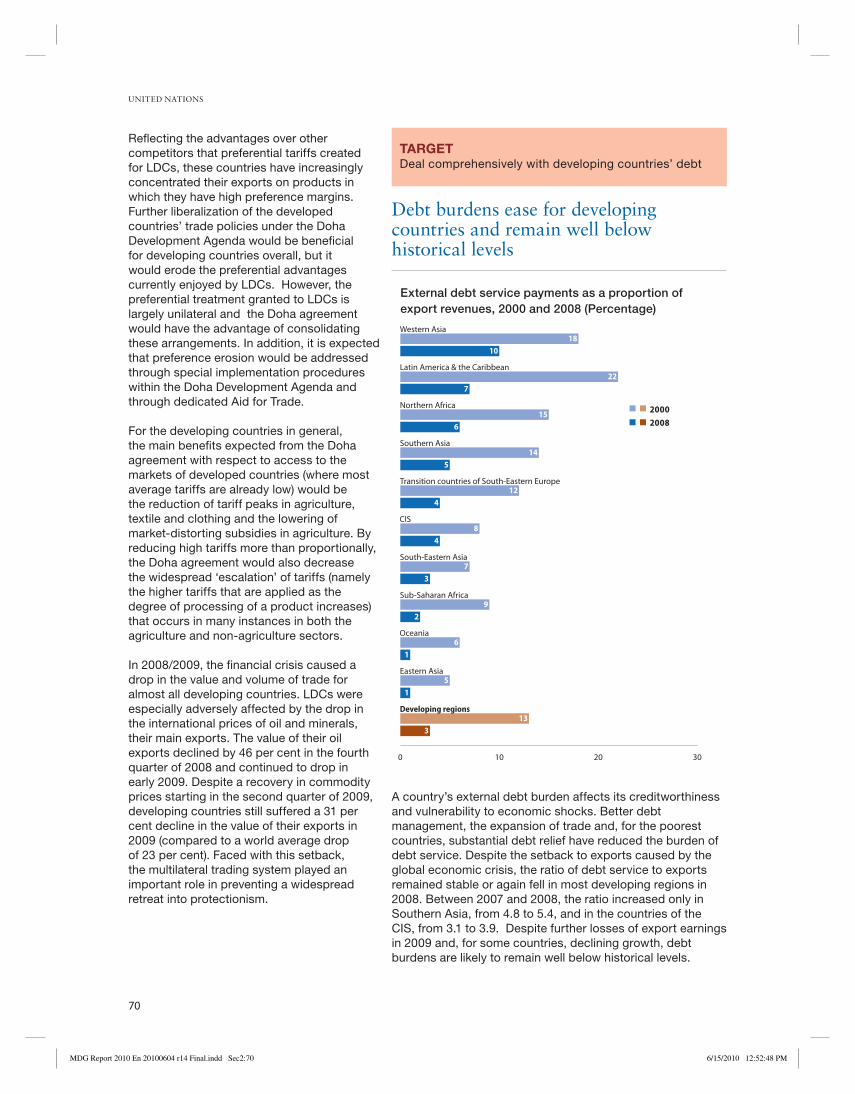
UNITED NATIONS
70
Refl ecting the advantages over other
competitors that preferential tariffs created
for LDCs, these countries have increasingly
concentrated their exports on products in
which they have high preference margins.
Further liberalization of the developed
countries’ trade policies under the Doha
Development Agenda would be benefi cial
for developing countries overall, but it
would erode the preferential advantages
currently enjoyed by LDCs. However, the
preferential treatment granted to LDCs is
largely unilateral and the Doha agreement
would have the advantage of consolidating
these arrangements. In addition, it is expected
that preference erosion would be addressed
through special implementation procedures
within the Doha Development Agenda and
through dedicated Aid for Trade.
For the developing countries in general,
the main benefi ts expected from the Doha
agreement with respect to access to the
markets of developed countries (where most
average tariffs are already low) would be
the reduction of tariff peaks in agriculture,
textile and clothing and the lowering of
market-distorting subsidies in agriculture. By
reducing high tariffs more than proportionally,
the Doha agreement would also decrease
the widespread ‘escalation’ of tariffs (namely
the higher tariffs that are applied as the
degree of processing of a product increases)
that occurs in many instances in both the
agriculture and non-agriculture sectors.
In 2008/2009, the fi nancial crisis caused a
drop in the value and volume of trade for
almost all developing countries. LDCs were
especially adversely affected by the drop in
the international prices of oil and minerals,
their main exports. The value of their oil
exports declined by 46 per cent in the fourth
quarter of 2008 and continued to drop in
early 2009. Despite a recovery in commodity
prices starting in the second quarter of 2009,
developing countries still suffered a 31 per
cent decline in the value of their exports in
2009 (compared to a world average drop
of 23 per cent). Faced with this setback,
the multilateral trading system played an
important role in preventing a widespread
retreat into protectionism.
Debt burdens ease for developing countries and remain well below historical levels
TARGETDeal comprehensively with developing countries’ debt
A country’s external debt burden affects its creditworthiness
and vulnerability to economic shocks. Better debt
management, the expansion of trade and, for the poorest
countries, substantial debt relief have reduced the burden of
debt service. Despite the setback to exports caused by the
global economic crisis, the ratio of debt service to exports
remained stable or again fell in most developing regions in
2008. Between 2007 and 2008, the ratio increased only in
Southern Asia, from 4.8 to 5.4, and in the countries of the
CIS, from 3.1 to 3.9. Despite further losses of export earnings
in 2009 and, for some countries, declining growth, debt
burdens are likely to remain well below historical levels.
0 10 20 30
Developing regions
Eastern Asia
Oceania
Sub-Saharan Africa
South-Eastern Asia
CIS
Transition countries of South-Eastern Europe
Southern Asia
Northern Africa
Latin America & the Caribbean
Western Asia
External debt service payments as a proportion of export revenues, 2000 and 2008 (Percentage)
20002008
1810
227
156
145
124
84
73
92
61
51
133
MDG Report 2010 En 20100604 r14 Final.indd Sec2:70MDG Report 2010 En 20100604 r14 Final.indd Sec2:70 6/15/2010 12:52:48 PM6/15/2010 12:52:48 PM

THE MILLENNIUM DEVELOPMENT GOALS REPORT 2010
71
TARGETIn cooperation with the private sector, make available the
benefi ts of new technologies, especially information and
communications
Demand grows for information and communications technology
Forty countries are eligible for debt relief under the Heavily
Indebted Poor Countries (HIPC) initiative. Of these, 35
countries have reached the ‘decision point’ stage in the
process and have had future debt payments reduced by
$57 billion; 28 countries that have reached their ‘completion
0
10
20
30
40
50
60
70
80
2009*200620042002200019981996199419921990
Number of fixed telephone lines, mobile cellular subscriptionsand Internet users per 100 population, world, 1990-2009
Fixed telephone linesMobile cellular subscriptionsInternet users
Note: * Data for 2009 are estimates.
point’ have received additional assistance of
$25 billion under the Multilateral Debt Relief
Initiative. The debt burdens of countries
included in HIPC initiative are below the
average for all least developed countries.
Despite the recent economic downturn, use of
information and communications technology
(ICT) continues to grow worldwide. By the
end of 2009, global subscriptions to mobile
cellular services had ballooned to an estimated
4.6 billion—equivalent to one mobile cellular
subscription for 67 out of every 100 people.
Growth in mobile telephony remains strongest
in the developing world, where, by end-2009,
mobile penetration had passed the 50 per cent
mark.
Mobile telephony is offering new and critical
communications opportunities to regions that
used to be without access to ICT. In sub-
Saharan Africa, for example, a region where
fi xed telephone line penetration remains at
around 1 per cent, mobile penetration has
well exceeded 30 per cent. Mobile technology
is also increasingly being used for non-voice
applications, including text messaging,
m-banking and disaster management, and its
role as a development tool is widely recognized.
MDG Report 2010 En 20100604 r14 Final.indd Sec2:71MDG Report 2010 En 20100604 r14 Final.indd Sec2:71 6/15/2010 12:52:48 PM6/15/2010 12:52:48 PM

UNITED NATIONS
72
Access to the World Wide Web is still closed to the majority of the world’s people
Internet use has also continued to expand,
albeit at a slower pace over the last year. By
the end of 2008, 23 per cent of the world’s
population (or 1.6 billion people) were using
the Internet. In the developed regions, the
percentage remains much higher than in the
developing world, where only 1 in 6 people
are online.
A large gap separates those with high-speed Internet connections, mostly in developed nations, and dial-up users
A challenge in bringing more people online in developing
countries is the limited availability of broadband networks.
Many of the most effective development applications of
ICT, such as telemedicine, e-commerce, e-banking and
e-government, are only available through a high-speed
Internet connection. But a signifi cant divide exists between
those who enjoy fast access to an online world increasingly
rich in multimedia content and those still struggling with slow,
shared dial-up links.
By the end of 2008, fi xed broadband penetration in the
developing world averaged less than 3 per cent and was
heavily concentrated in a few countries. China—the largest
fi xed broadband market in the world—accounts for about
half of the 200 million fi xed broadband subscriptions. In most
least developed countries, the number of fi xed broadband
subscriptions is still negligible; service remains prohibitively
expensive and inaccessible to most people. However, the
introduction of high-speed wireless broadband networks
is expected to increase the number of Internet users in
developing countries in the near future.
0 10 20 30 40 50 60 70 80
World
Developed regions
Developing regions
Transition countries of South-Eastern Europe
Latin America & the Caribbean
CIS, Europe
Eastern Asia
Western Asia
Northern Africa
South-Eastern Asia
CIS, Asia
Sub-Saharan Africa
Oceania
Southern Asia
Number of Internet users per 100 population, 2003 and 2008
2
1
2
6
46
6
12
514
419
932
824
925
7
12
27
29
49
5
68
15
1223
20032008
0
5
10
15
20
25
30
35
40
45
2009* 20082007200620052004200320022001200019991998
Fixed broadband subscriptions per 100 population, 1998-2009, and mobile broadband subscriptions per 100 population, 2000-2009
39
Developed regionsDeveloping regions
Developed regionsDeveloping regions
Fixed broadband
Mobile broadband
Note: * Data for 2009 are estimates.
MDG Report 2010 En 20100604 r14 Final.indd Sec2:72MDG Report 2010 En 20100604 r14 Final.indd Sec2:72 6/15/2010 12:52:48 PM6/15/2010 12:52:48 PM
THE MILLENNIUM DEVELOPMENT GOALS REPORT 2010
73
MDG Report 2010 En 20100604 r14 Final.indd Sec2:73MDG Report 2010 En 20100604 r14 Final.indd Sec2:73 6/15/2010 12:52:50 PM6/15/2010 12:52:50 PM

UNITED NATIONS
74
A note to the readerMeasuring progress towards the MDGsProgress towards the eight Millennium Development Goals is measured through 21 targets and 60 offi cial indicators.1 This report presents an accounting to date of how far the world has come in meeting the goals using data available as of May 2010.2
Most of the MDG targets have a deadline of 2015, and 1990 is the baseline against which progress is gauged. When relevant and available, data for 2000 are also presented, to describe changes since the Millennium Declaration was signed. Country data are aggregated at the subregional and regional levels to show overall advances over time. Although the aggregate fi gures are a convenient way to track progress, the situation of individual countries within a given region may vary signifi cantly from regional averages. Data for individual countries, along with the composition of all regions and subregions, are available at http://mdgs.un.org.
1 The complete list of goals, targets and indicators is available at mdgs.un.org2 Given the time lag between collecting data and analysing them, few
indicators can be compiled for the current year. Most of them are based on data
from earlier years—generally up to 2008 or 2009.
Improving monitoring systemsImproved data and monitoring tools are crucial for devising appropriate policies and interventions needed to achieve the MDGs. Although some progress is being made, reliable statistics for monitoring development remain inadequate in many poor countries, and the challenge of building in-country capacity to produce better policy-relevant data is enormous. Since periodic assessment of the MDGs began almost ten years ago, activities have been under way to improve data availability in countries and reporting mechanisms to international organizations. As a result, data production in countries is increasingly aligned with internationally agreed-upon recommendations and standards. Moreover, international agencies have developed a better understanding of countries’ data availability and of how to work with national experts to produce and estimate indicators. More data are now available in the international series for the assessment of trends for all MDGs. In 2009, 118 countries had data for at least two points in time for 16-22 indicators as compared to 2003, when only four countries had the same data coverage. This is the result of increased national capacity to venture into new data collection initiatives as well as to increase the frequency of data collection. For instance, the number of countries with two or more data points on contraceptive prevalence increased from 50 in the period 1986-1994 to 94 in 1995-2004. At the same time, the number of countries with no data on this indicator decreased from 106 to 63. The production of quality data is also expanding in other areas, such as monitoring the spread of HIV, leading to a better understanding of the epidemic. Between 2003 and 2008, 87 developing countries had conducted nationally representative surveys that collected data on comprehensive and correct knowledge of HIV among young women, compared to 48 countries in 1998-2002 and only fi ve prior to 1998. Even in areas with less well-established data collection tools, like the environment, major improvements have been made in obtaining data from national and regional authorities. For example, the number of sites included in the World Database on Protected Areas has increased from just over 1,000 in 1962 to more than 102,000 in 2003 and 134,000 in 2009.
The basis for this analysis Regional and subregional fi gures presented in this report are compiled by members of the United Nations Inter-Agency and Expert Group on MDG Indicators (IAEG). In general, the fi gures are weighted averages of country data, using the population of reference as a weight. For each indicator, individual agencies were designated as offi cial providers of data and as leaders in developing methodologies for data collection and analysis (see inside front cover for a list of contributing organizations).
Data are typically drawn from offi cial statistics provided by governments. This is accomplished through periodic data collection by ministries and national statistical offi ces around the world. To fi ll data gaps, which occur frequently, many of the indicators are supplemented by or derived exclusively from data collected through surveys sponsored and carried out by international agencies. These include many of the health indicators, which are compiled, for the most part, from Multiple Indicator Cluster Surveys (MICS) and Demographic and Health Surveys (DHS).
In some cases, countries may have more recent data that have not yet become available to the relevant specialized agency. In other cases, the responsible international agencies must estimate missing values or make adjustments to national data to ensure international comparability. Data from international sources, therefore, often differ from those available within countries.
The United Nations Statistics Division maintains the offi cial website of the IAEG and its database (http://mdgs.un.org). In an effort to improve transparency, the country data series in the database are given colour codes to indicate whether the fi gures are estimated or provided by national agencies; they are also accompanied by metadata with a detailed description of how the indicators are produced and of the methodologies used for regional aggregations.
Reconciling national and international dataReliable, timely and internationally comparable data on the MDG indicators are crucial for holding the international community to account. They are also important in encouraging public support and funding for development, allocating aid effectively, and comparing progress among regions and across countries. Discrepancies among sources and gaps in national data have raised concerns in the statistical community and troubled country data producers who fi nd themselves dealing with different fi gures for the same indicator.
A number of initiatives have been launched to reconcile national and international monitoring and to resolve differences in methods and defi nitions used. These efforts are beginning to yield results. The IAEG has promoted a dialogue between national and international agencies to improve the coherence of national and international data and to ensure the quality and transparency of methodologies and data produced. The IAEG has also provided training on the production of indicators to national statistics experts in more than 40 countries.
MDG Report 2010 En 20100604 r14 Final.indd Sec2:74MDG Report 2010 En 20100604 r14 Final.indd Sec2:74 6/15/2010 12:52:50 PM6/15/2010 12:52:50 PM
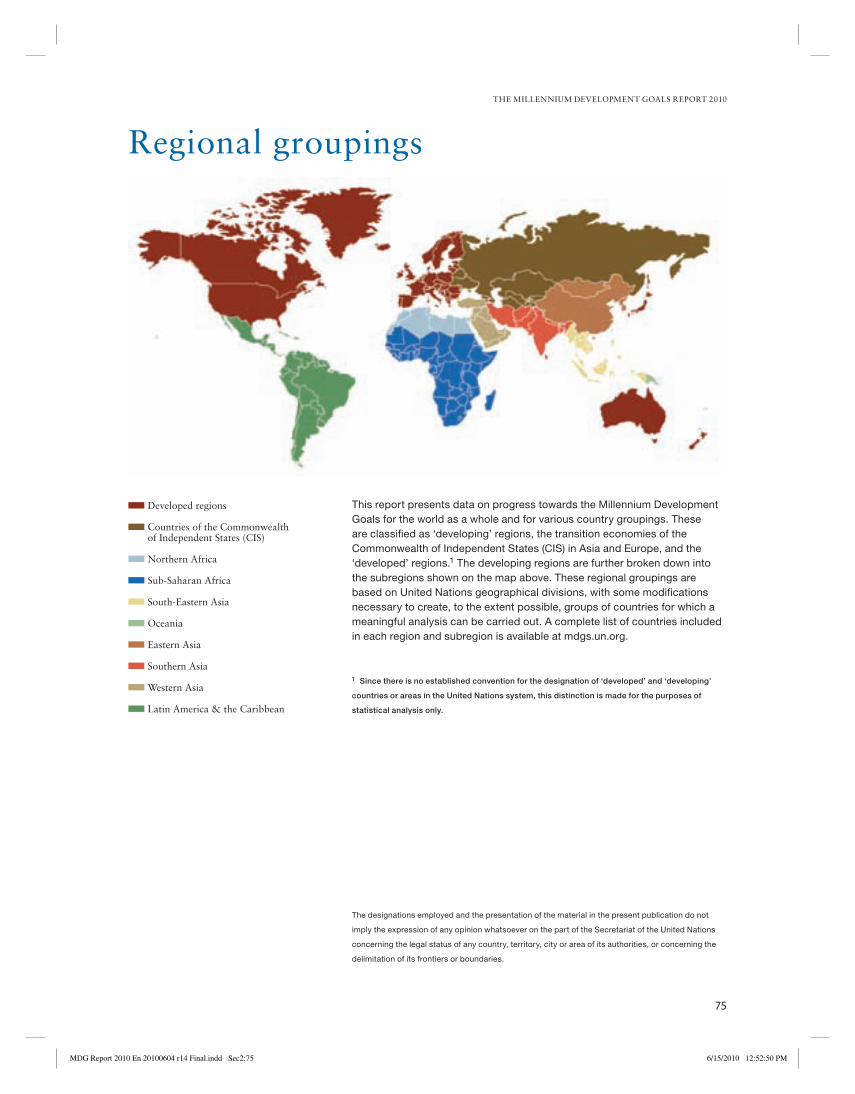
THE MILLENNIUM DEVELOPMENT GOALS REPORT 2010
75
Regional groupings
This report presents data on progress towards the Millennium Development
Goals for the world as a whole and for various country groupings. These
are classifi ed as ‘developing’ regions, the transition economies of the
Commonwealth of Independent States (CIS) in Asia and Europe, and the
‘developed’ regions.1 The developing regions are further broken down into
the subregions shown on the map above. These regional groupings are
based on United Nations geographical divisions, with some modifi cations
necessary to create, to the extent possible, groups of countries for which a
meaningful analysis can be carried out. A complete list of countries included
in each region and subregion is available at mdgs.un.org.
1 Since there is no established convention for the designation of ‘developed’ and ‘developing’
countries or areas in the United Nations system, this distinction is made for the purposes of
statistical analysis only.
The designations employed and the presentation of the material in the present publication do not
imply the expression of any opinion whatsoever on the part of the Secretariat of the United Nations
concerning the legal status of any country, territory, city or area of its authorities, or concerning the
delimitation of its frontiers or boundaries.
Developed regions
Countries of the Commonwealth of Independent States (CIS)
Northern Africa
Sub-Saharan Africa
South-Eastern Asia
Oceania
Eastern Asia
Southern Asia
Western Asia
Latin America & the Caribbean
MDG Report 2010 En 20100604 r14 Final.indd Sec2:75MDG Report 2010 En 20100604 r14 Final.indd Sec2:75 6/15/2010 12:52:50 PM6/15/2010 12:52:50 PM

UNITED NATIONS
76
For more information visit the UN Statistics Division
Millennium Development Goals website at http://mdgs.un.org
Visit the UN Millennium Development Goals website at
www.un.org/millenniumgoals
Visit the UN Millennium Campaign Offi ce website at
www.endpoverty2015.org
PHOTO CREDITS
Cover: © Sara Duerto Valero
Page 2: © UN Photo/116454
Page 6: © UN Photo/Logan Abassi
Page 11: © Sara Duerto Valero
Page 12: © UNICEF/NYHQ2009-2315/Mosammat Kamrun
Page 15: © UNICEF/NYHQ2009-1732/Truls Brekke
Page 16: © Sara Duerto Valero
Page 19: © UNICEF/NYHQ2009-2314/Mohammad Jashim Uddin
Page 20: © UNICEF/NYHQ1996-1183/Giacomo Pirozzi
Page 21: © Sara Duerto Valero
Page 22: © Sara Duerto Valero
Page 23: © Sara Duerto Valero
Page 26: © UNICEF/NYHQ2006-0038/Brendan Bannon
Page 29: © UNICEF/NYHQ1996-1081/Nicole Toutounji
Page 30: © UNICEF/NYHQ2008-1312/Olivier Asselin
Page 33: © UNICEF/NYHQ2005-1047/Radhika Chalasani
Page 35: © UNICEF/NYHQ2009-2317/Md. Ilias Mia
Page 37: © UNICEF/NYHQ2009-0697/Christine Nesbitt
Page 39: © UNICEF/NYHQ2008-1437/Guillaume Bonn
Page 40: © UNICEF/NYHQ2006-1478/Giacomo Pirozzi
Page 44: © UNICEF/NYHQ2008-0842/John Isaac
Page 46: © UNICEF/NYHQ2010-0402/Kate Holt
Page 52: © Sara Duerto Valero
Page 55: © Sara Duerto Valero
Page 56: © UNICEF/NYHQ2007-0426/Giacomo Pirozzi
Page 60: © UNICEF/NYHQ2009-0859/Shehzad Noorani
Page 63: © UNICEF/NYHQ2009-1449/Peter Wurzel
Page 65: © Sara Duerto Valero
Page 66: © Sara Duerto Valero
Page 69: © Maria Martinho
Page 71: © Masaru Goto / World Bank
Page 73: © Sara Duerto Valero
Editor: Lois Jensen
Copyright © United Nations, 2010
All rights reserved.
MDG Report 2010 En 20100604 r14 Final.indd Sec2:76MDG Report 2010 En 20100604 r14 Final.indd Sec2:76 6/15/2010 12:52:51 PM6/15/2010 12:52:51 PM

THE MILLENNIUM DEVELOPMENT GOALS REPORT 2010
77
MDG Report 2010 En 20100604 r14 Final.indd Sec2:77MDG Report 2010 En 20100604 r14 Final.indd Sec2:77 6/15/2010 12:52:51 PM6/15/2010 12:52:51 PM
“We must not fail the billions
who look to the international
community to fulfi ll the promise
of the Millennium Declaration
for a better world.
Let us keep the promise.”
— UN Secretary-General Ban Ki-moon
Published by the United Nations Department of Economic and Social Affairs
(DESA) — June 2010
SALES NUMBER: E.10.I.7ISBN 978-92-1-101218-7
MDG Report 2010 En 20100604 r14 Final.indd Sec2:78MDG Report 2010 En 20100604 r14 Final.indd Sec2:78 6/15/2010 12:52:51 PM6/15/2010 12:52:51 PM