The mid-fusiform sulcus: A landmark identifying both ...
13
The mid-fusiform sulcus: A landmark identifying both cytoarchitectonic and functional divisions of human ventral temporal cortex Kevin S. Weiner a, ⁎, Golijeh Golarai a , Julian Caspers c,d,g , Miguel R. Chuapoco a , Hartmut Mohlberg d , Karl Zilles d,e,f , Katrin Amunts c,d , Kalanit Grill-Spector a,b a Department of Psychology, Stanford University, Stanford, CA 94305, USA b Neuroscience Institute, Stanford University, Stanford, CA 94305, USA c C. and O. Vogt Institute for Brain Research, Heinrich Heine University Düsseldorf, 40001 Düsseldorf, Germany d Institute for Neuroscience and Medicine (INM-1), Research Centre Jülich, 52425 Jülich, Germany e JARA-BRAIN, Jülich–Aachen Research Alliance, 52425 Jülich, Germany f Department of Psychiatry, Psychotherapy and Psychosomatics, RWTH Aachen University, 52074 Aachen, Germany g Department of Diagnostic and Interventional Radiology, University Düsseldorf, Medical Faculty, D-40225 Düsseldorf, Germany abstract article info Article history: Accepted 29 August 2013 Available online 8 September 2013 Keywords: Cytoarchitectonics Fusiform gyrus Mid-fusiform sulcus Eccentricity bias Fusiform face area Human ventral temporal cortex (VTC) plays a pivotal role in high-level vision. An under-studied macroanatomical feature of VTC is the mid-fusiform sulcus (MFS), a shallow longitudinal sulcus separating the lateral and medial fusiform gyrus (FG). Here, we quantified the morphological features of the MFS in 69 subjects (ages 7–40), and in- vestigated its relationship to both cytoarchitectonic and functional divisions of VTC with four main findings. First, despite being a minor sulcus, we found that the MFS is a stable macroanatomical structure present in all 138 hemi- spheres with morphological characteristics developed by age 7. Second, the MFS is the locus of a lateral–medial cytoarchitectonic transition within the posterior FG serving as the boundary between cytoarchitectonic regions FG1 and FG2. Third, the MFS predicts a lateral–medial functional transition in eccentricity bias representations in children, adolescents, and adults. Fourth, the anterior tip of the MFS predicts the location of a face-selective re- gion, mFus-faces/FFA-2. These findings are the first to illustrate that a macroanatomical landmark identifies both cytoarchitectonic and functional divisions of high-level sensory cortex in humans and have important implications for understanding functional and structural organization in the human brain. © 2013 Elsevier Inc. All rights reserved. Introduction Human ventral temporal cortex (VTC) plays a pivotal role in percep- tual and cognitive tasks spanning high-level vision (Haxby et al., 2000; Malach et al., 2002; Martin, 2007; Op de Beeck et al., 2008; Tarr and Gauthier, 2000; Weiner and Grill-Spector, 2013), memory (Henson et al., 2000; Wagner et al., 1999), and multi-sensory integration (Amedi et al., 2002; James et al., 2002; Kitada et al., 2009). One of the most replicable organizational features of human VTC documented by functional magnetic resonance imaging (fMRI) is a large-scale lateral– medial functional distinction. For instance, inanimate (Mahon and Caramazza, 2009; Martin, 2007), place (Aguirre et al., 1998; Epstein and Kanwisher, 1998; Nasr et al., 2011), and peripherally-biased (Hasson et al., 2002; Levy et al., 2001; Malach et al., 2002) representa- tions are located in medial VTC encompassing the medial FG and collat- eral sulcus (CoS), while animate (Connolly et al., 2012; Mahon and Caramazza, 2009; Martin, 2007), face (Kanwisher et al., 1997), and foveally-biased (Hasson et al., 2002; Levy et al., 2001; Malach et al., 2002) representations are located in lateral VTC, encompassing the lateral fusiform gyrus (FG) and occipito-temporal sulcus (OTS). Intrigu- ingly, in addition to this lateral–medial functional distinction, a lateral– medial cytoarchitectonic distinction has recently been identified (Caspers et al., 2012). Using novel tools detecting transitions in both cell density and layering across gray matter, Caspers et al. (2012) re- ported two cytoarchitectonic regions in the posterior aspect of VTC: FG1 and FG2. Macroanatomically, FG1 is located on the medial FG extending into the CoS, while FG2 is located on the lateral FG extending into the OTS. Cytoarchitectonically, FG1 displays a columnar arrange- ment of small pyramidal cells, while FG2 contains large pyramidal cells in layer III and a prominent layer IV, but no columnar arrangement. If and how these functional and cytoarchitectonic parcellations are re- lated to one another is presently unknown. A major obstacle preventing the full understanding of cyto- architectonic and functional correspondences in VTC is that macroanatomical structures are yet to be fully characterized. For in- stance, an often over-looked feature of VTC is that the FG is divided lon- gitudinally by a minor sulcus referred to as the mid-fusiform sulcus, or MFS (Allison et al., 1999; Nasr et al., 2011; Nobre et al., 1998; Puce et al., 1996; Weiner and Grill-Spector, 2010, 2012, 2013; Weiner et al., NeuroImage 84 (2014) 453–465 ⁎ Corresponding author. E-mail address: [email protected] (K.S. Weiner). 1053-8119/$ – see front matter © 2013 Elsevier Inc. All rights reserved. http://dx.doi.org/10.1016/j.neuroimage.2013.08.068 Contents lists available at ScienceDirect NeuroImage journal homepage: www.elsevier.com/locate/ynimg
Transcript of The mid-fusiform sulcus: A landmark identifying both ...
NeuroImage 84 (2014) 453–465
Contents lists available at ScienceDirect
NeuroImage
j ourna l homepage: www.e lsev ie r .com/ locate /yn img
The mid-fusiform sulcus: A landmark identifying both cytoarchitectonicand functional divisions of human ventral temporal cortex
Kevin S. Weiner a,⁎, Golijeh Golarai a, Julian Caspers c,d,g, Miguel R. Chuapoco a, Hartmut Mohlberg d,Karl Zilles d,e,f, Katrin Amunts c,d, Kalanit Grill-Spector a,b
a Department of Psychology, Stanford University, Stanford, CA 94305, USAb Neuroscience Institute, Stanford University, Stanford, CA 94305, USAc C. and O. Vogt Institute for Brain Research, Heinrich Heine University Düsseldorf, 40001 Düsseldorf, Germanyd Institute for Neuroscience and Medicine (INM-1), Research Centre Jülich, 52425 Jülich, Germanye JARA-BRAIN, Jülich–Aachen Research Alliance, 52425 Jülich, Germanyf Department of Psychiatry, Psychotherapy and Psychosomatics, RWTH Aachen University, 52074 Aachen, Germanyg Department of Diagnostic and Interventional Radiology, University Düsseldorf, Medical Faculty, D-40225 Düsseldorf, Germany
⁎ Corresponding author.E-mail address: [email protected] (K.S. Weiner).
1053-8119/$ – see front matter © 2013 Elsevier Inc. All rihttp://dx.doi.org/10.1016/j.neuroimage.2013.08.068
a b s t r a c t
a r t i c l e i n f oArticle history:Accepted 29 August 2013Available online 8 September 2013
Keywords:CytoarchitectonicsFusiform gyrusMid-fusiform sulcusEccentricity biasFusiform face area
Human ventral temporal cortex (VTC) plays a pivotal role in high-level vision. An under-studiedmacroanatomicalfeature of VTC is the mid-fusiform sulcus (MFS), a shallow longitudinal sulcus separating the lateral and medialfusiform gyrus (FG). Here, we quantified themorphological features of theMFS in 69 subjects (ages 7–40), and in-vestigated its relationship to both cytoarchitectonic and functional divisions of VTC with four main findings. First,despite being aminor sulcus, we found that theMFS is a stablemacroanatomical structure present in all 138 hemi-spheres with morphological characteristics developed by age 7. Second, the MFS is the locus of a lateral–medialcytoarchitectonic transition within the posterior FG serving as the boundary between cytoarchitectonic regionsFG1 and FG2. Third, the MFS predicts a lateral–medial functional transition in eccentricity bias representationsin children, adolescents, and adults. Fourth, the anterior tip of the MFS predicts the location of a face-selective re-gion, mFus-faces/FFA-2. These findings are the first to illustrate that a macroanatomical landmark identifies bothcytoarchitectonic and functional divisions of high-level sensory cortex in humans and have important implicationsfor understanding functional and structural organization in the human brain.
© 2013 Elsevier Inc. All rights reserved.
Introduction
Human ventral temporal cortex (VTC) plays a pivotal role in percep-tual and cognitive tasks spanning high-level vision (Haxby et al., 2000;Malach et al., 2002; Martin, 2007; Op de Beeck et al., 2008; Tarr andGauthier, 2000; Weiner and Grill-Spector, 2013), memory (Hensonet al., 2000; Wagner et al., 1999), and multi-sensory integration(Amedi et al., 2002; James et al., 2002; Kitada et al., 2009). One of themost replicable organizational features of human VTC documented byfunctional magnetic resonance imaging (fMRI) is a large-scale lateral–medial functional distinction. For instance, inanimate (Mahon andCaramazza, 2009; Martin, 2007), place (Aguirre et al., 1998; Epsteinand Kanwisher, 1998; Nasr et al., 2011), and peripherally-biased(Hasson et al., 2002; Levy et al., 2001; Malach et al., 2002) representa-tions are located in medial VTC encompassing themedial FG and collat-eral sulcus (CoS), while animate (Connolly et al., 2012; Mahon andCaramazza, 2009; Martin, 2007), face (Kanwisher et al., 1997), andfoveally-biased (Hasson et al., 2002; Levy et al., 2001; Malach et al.,
ghts reserved.
2002) representations are located in lateral VTC, encompassing thelateral fusiform gyrus (FG) and occipito-temporal sulcus (OTS). Intrigu-ingly, in addition to this lateral–medial functional distinction, a lateral–medial cytoarchitectonic distinction has recently been identified(Caspers et al., 2012). Using novel tools detecting transitions in bothcell density and layering across gray matter, Caspers et al. (2012) re-ported two cytoarchitectonic regions in the posterior aspect of VTC:FG1 and FG2. Macroanatomically, FG1 is located on the medial FGextending into the CoS, while FG2 is located on the lateral FG extendinginto the OTS. Cytoarchitectonically, FG1 displays a columnar arrange-ment of small pyramidal cells, while FG2 contains large pyramidalcells in layer III and a prominent layer IV, but no columnar arrangement.If and how these functional and cytoarchitectonic parcellations are re-lated to one another is presently unknown.
A major obstacle preventing the full understanding of cyto-architectonic and functional correspondences in VTC is thatmacroanatomical structures are yet to be fully characterized. For in-stance, an often over-looked feature of VTC is that the FG is divided lon-gitudinally by a minor sulcus referred to as the mid-fusiform sulcus, orMFS (Allison et al., 1999; Nasr et al., 2011; Nobre et al., 1998; Puceet al., 1996; Weiner and Grill-Spector, 2010, 2012, 2013; Weiner et al.,
R
MFS
OTS
a b
medialFG
lateral FG
lateral
posterior
late
ral
FG
CoS
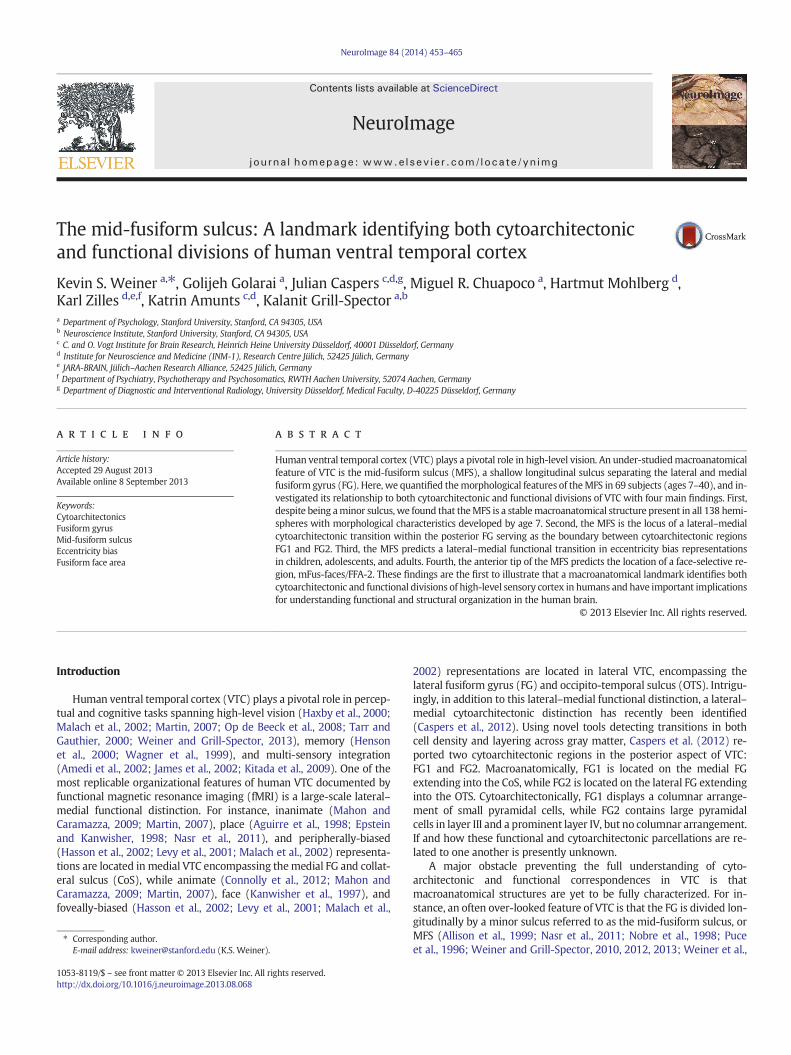
Fig. 1. The mid-fusiform sulcus (MFS). Example right hemisphere from a ten-year oldmale. (a) Inflated cortical surface with sulci illustrated in dark gray. The MFS (outlinedin red) is a longitudinal sulcus dividing the fusiformgyrus (FG) into lateral andmedial par-titions, flanked by the occipito-temporal sulcus (OTS) laterally and the collateral sulcus(CoS) medially (inset for location of zoomed portion). (b) The MFS, OTS, and CoS have adistinctive ω pattern on single coronal slices where the MFS is the shallower sulcusflanked by the much deeper CoS and OTS. Top: Example coronal slice from the positionof the dotted line in (a). Bottom: Schematic of theω pattern of the MFS, OTS, and CoS.
454 K.S. Weiner et al. / NeuroImage 84 (2014) 453–465
2010). Indeed, although the MFS was first labeled as such in the latenineties (Allison et al., 1999; Nobre et al., 1998; Puce et al., 1996), ithas been mentioned in the literature less than ten times (Davidenkoet al., 2012; Nasr et al., 2011; Parvizi et al., 2012; Schultz et al., 2003;Weiner and Grill-Spector, 2010, 2012, 2013; Weiner et al., 2010).Despite the paucity of studies mentioning the MFS, recent research inadults provides insight into how incorporating the MFS into functionalneuroimaging might enhance the understanding of VTC functionalorganization. Specifically, these studies show that the MFS serves asa lateral–medial functional boundary dividing face-selective regions(Davidenko et al., 2012; Nasr et al., 2011; Parvizi et al., 2012; Weinerand Grill-Spector, 2010, 2012, 2013; Weiner et al., 2010) from place-selective regions (Nasr et al., 2011), and also dissociates differentialrepetition suppression mechanisms (Weiner et al., 2010). However,it is unknown (1) if themorphology of theMFS is stable across develop-ment, (2) if the MFS is coupled with cytoarchitectonic partitionsof VTC, (3) whether the MFS predicts additional lateral–medial func-tional gradients in VTC such as eccentricity bias representations, and(4) if the MFS also predicts the fine-scale clustering of face-selectiveregions.
To address these questions, we conducted four separate studies.First, we characterized the morphology of the MFS in 69 subjects(ages 7–40), determining the developmental and stable features of theMFS in children, adolescents, and adults. Second, we examined the rela-tionship between the MFS and cytoarchitectonic regions FG1 and FG2using an independent set of 10 postmortem brains. Third, using anovel classification approach,we tested if theMFS serves as a functionalboundary separating the large-scale eccentricity biasmap (Hasson et al.,2002; Levy et al., 2001; Malach et al., 2002) in 36 subjects (ages 7–40).We chose eccentricity biasmeasurements because they show amedial–lateral gradient across VTC and constitute a large-scale category-independent representation. Fourth, we tested if the MFS serves as afunctional landmark identifying the fine-scale functional organizationof face-selective regions pFus-faces/FFA-1 and mFus-faces/FFA-2(Weiner and Grill-Spector, 2010) using high-resolution fMRI (HR-fMRI) in 14 adult subjects. To our knowledge, this is the first in depthanalysis of human high-level visual cortex spanning cytoarchitectonics,macroanatomy, and functional organization at multiple spatial scales.We demonstrate that the MFS is a stable macroanatomical featureacross development, as well as a crucial landmark identifying bothcytoarchitectonic and functional divisions of VTC.
Materials and methods
Wedescribe themethods in two sections, one for the anatomical andfunctional MRI scans and a separate section for the cytoarchitectonicalanalysis.
Participants
To obtain macroanatomical data, 69 subjects participated in ananatomical MRI session. Subjects included 20 children (ages 7–11, 7females), 14 adolescents (ages 12–17, 8 females), and 35 adults (ages18–40, 18 females), all of whom were healthy with no report of neuro-logical or psychiatric disease. To obtain data on the functional organiza-tion of VTC, 36 (12 children, 12 adolescents, and 12 adults) of these 69subjects also participated in an fMRI session. Written consent wasobtained from each subject. Procedures were approved by the StanfordInternal Review Board on human subjects research.
Anatomical scans and analysis
Scanning. All subjects were scanned on a GE 3-Tesla Signa scanner atStanford University. A high-resolution anatomical volume of thewhole brain was acquired with a whole head coil using a T1-weighted
SPGR pulse sequence (TR = 1000 ms, flip angle = 45°, 2 NEX, FOV =200 mm, resolution of 0.78 × 0.78 × 1.2 mm).
Data analysis.Datawere analyzedwithMATLAB (MathWorks) using themrVista toolbox (http://white.stanford.edu/software).
Cortical surface reconstruction. Anatomical volumes were aligned to theAC-PC plane and resampled to 1 mm isotropic voxels. Using a combina-tion of automated (FreeSurfer: http://surfer.nmr.mgh.harvard.edu) andmanual segmentation tools (ITK-SNAP: http://white.stanford.edu/itkgray), each anatomical volume was segmented to separate grayfrom white matter, from which we reconstructed the cortical surfacefor each subject (Wandell et al., 2000).
Identification of the MFS on single slices and cortical surface reconstruc-tions. The MFS is a longitudinal sulcus dividing the FG into lateral andmedial partitions as viewed on the cortical surface (Fig. 1). Here, we de-termined the identifying features of the MFS relative to surroundingsulci on single sections in order to define the MFS consistently on ana-tomical MRIs as well as in single histological sections. As illustrated inFig. 1, the MFS is positioned between the OTS and CoS on the corticalsurface (Fig. 1a), resulting in a distinct omega (ω) pattern on single cor-onal slices (Fig. 1b). Thisω pattern (red outline in Figs. 1–2) is a charac-terizing feature of the MFS despite differences in how it may appear onthe cortical surface.
Sulcal length measurements. Lines were manually drawn along the fun-dus of the MFS on the cortical surface for each subject and hemisphere.The length of this line was determined using a modified version ofDijkstra's algorithm (as in Wandell et al., 2000). As the cortical surfacereconstruction is composed of a series of connected vertices, the algo-rithm computes the length by determining the shortest path betweenendpoints on the line taking into consideration their actual distance ingray matter. When the MFS was fractionated into more than one com-ponent (Table 1, Fig. 2, and Results), the total length was based on thesum of the independent sulcal components excluding the interspersed
CoSOTS
Adult
OTS CoS
Adolescent
OTS CoS
Child
OTS CoS
Adolescent
Fusiform
Type IA Type IB Type IIA Type IIBR R R R
posterior
late
ral
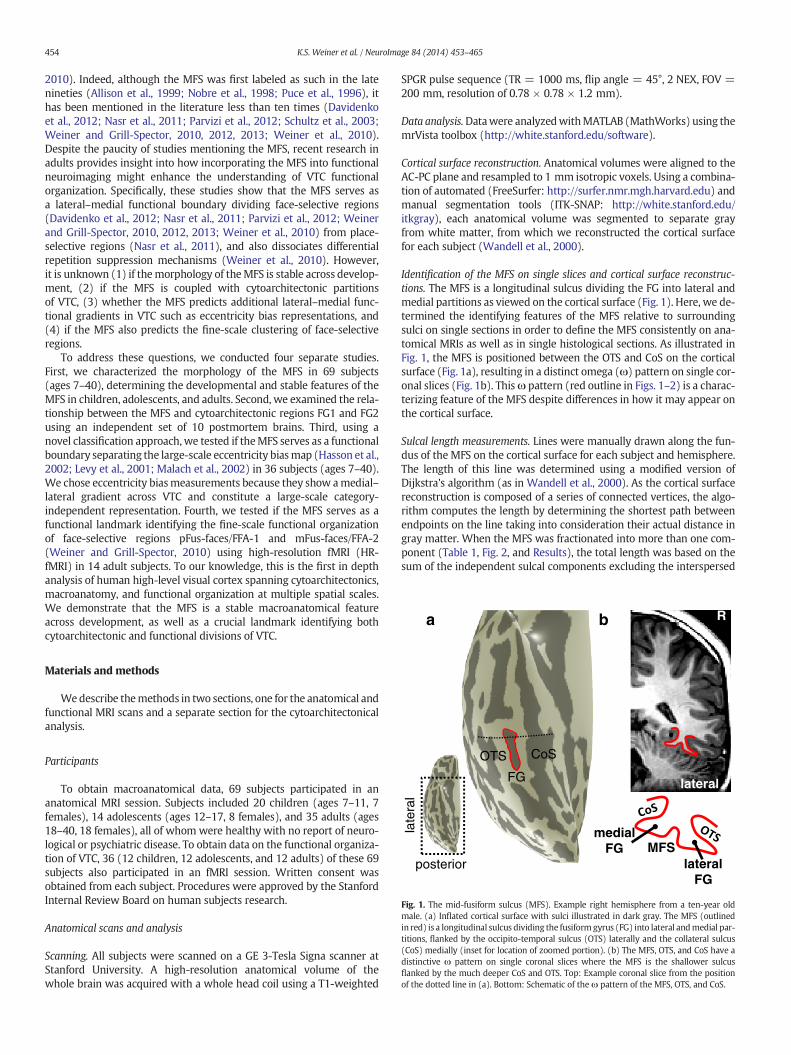
Fig. 2.The fourmorphological patterns of theMFS. TheMFS is outlined in red in both single coronal slices (top) and corresponding inflated hemispheres (bottom). Dotted lines indicate thelocation of the coronal slice. Note that theω pattern described in Fig. 1 persists on single coronal slices despite differences in fractionation and/or contiguity with surrounding sulci on thecortical surface. All patterns are equally likely across ages and hemispheres (Table 1). CoS: collateral sulcus; OTS: occipito-temporal sulcus.
455K.S. Weiner et al. / NeuroImage 84 (2014) 453–465
gyral components. We repeated the length measurement including theintergyral components, which were on average 5.26 ± 0.22 mm long,but it minimally affected MFS length measurements as these occur inless than 30% of hemispheres (length with intergyral: 29.2 ±13.5 mm, without intergyral: 27.3 ± 10.8 mm). To further relatethese measurements to stereotaxic space, we calculated the Talairachcoordinates of the anterior and posterior extents of the MFS in the 70adult hemispheres (Table 2).
Sulcal depth measurements. Lines were manually drawn from the laterallip to themedial lip of each sulcus of interest (MFS, OTS, and CoS) on thecortical surface (dotted lines on the cortical surface and correspondingcoronal slices in Figs. 1–2). The distance of this linewasfirst determinedusing the same algorithm as the lengthmeasurements and then dividedby two to transform these width measurements into depth measure-ments. To test the validity of this approach, we also measured sulcaldepth in coronal slices — evaluating the distance between the fundusof a sulcus (the MFS, CoS, or OTS) to the morphologically closed borderof the cerebrum in the 35 adult subjects. In a two-way repeated mea-sures ANOVA with factors method (cortical surface and coronal slices)and sulcus (MFS, CoS, and OTS), there was no significant main effect
Table 1Incidence characteristics of the mid-fusiform sulcus (MFS) in the right (RH) and left (LH)hemispheres.
ChildRH
ChildLH
TeenRH
TeenLH
AdultRH
AdultLH
Total Total %
Type IA 9/20 10/20 8/14 2/14 20/35 18/35 67/138 48.55%Type IB 5/20 5/20 3/14 2/14 5/35 7/35 27/138 19.57%Type IIA 5/20 3/20 2/14 6/14 7/35 6/35 29/138 21.01%Type IIB 1/20 2/20 1/14 4/14 3/35 4/35 15/138 10.87%
of method, no main effect of subject, and no significant interaction(ps N .54). Thus, we report depth measurements from the corticalsurface.
fMRI scans and analysis
Large-scale functional–structural correspondence. To test if the MFS reli-ably delineates lateral–medial functional divisions of VTC across devel-opment, we examined 12 children (ages 8–11), 12 adolescents (ages12–16), and 12 adults (ages 18–40) using fMRI. During fMRI, subjectsviewed images of faces and houses presented either centrally spanning3° or peripherally in a ring whose inner radius was 7° and outer radiuswas 14°. Stimuli in the periphery were scaled in size to account forlower acuity in the peripheral visual field and their diameter was ~6°.Subjects participated in 2 runs of this experiment where each run was384 s long containing four, 12-second blocks of each condition. Subjectswere instructed to fixate on a central dot and to indicate with a buttonpress when the fixation color changed.
Acquisition. We acquired 32 slices at a resolution of 3.125 ×3.125 × 3 mm mm using a two-shot T2*-sensitive spiral acquisition
Table 2Talairach coordinates of the anterior and posterior tips of the MFS in the adult brain(n = 35).
x y z
AnteriorRight (ave ± std) 32 (3.79) −41 (6.40) −16 (4.19)Left (ave ± std) −31 (3.50) −40 (6.18) −17 (3.76)
PosteriorRight (ave ± std) 28 (4.61) −59 (8.38) −13 (5.46)Left (ave ± std) −30 (3.94) −62 (7.88) −15 (3.74)
456 K.S. Weiner et al. / NeuroImage 84 (2014) 453–465
sequence (Glover, 1999) (FOV = 200 mm; TR = 2 s, TE = 30 ms,and flip angle = 77°) on a 3 T GE scanner. Inplane anatomical scanswere acquired with the same prescription using a two-dimensionalRF-spoiled GRASS (SPGR) sequence (TE = 1.9 ms, flip angle = 15°,bandwidth = 15.63 kHz).
Time series processing. Functional data of each session were motioncorrected using an affine transformation (Nestares and Heeger, 2000).Time series data were filtered using a temporal high-pass filter with a1/20 Hz cutoff and then converted to percentage signal change bydivid-ing the time series of each voxel by itsmean intensity.We estimated theblood oxygen level dependent (BOLD) response amplitudes for eachcondition using a general linear model (GLM) applied to the time seriesof each voxel using as predictors the experimental conditions convolvedwith the hemodynamic impulse response function used in SPM5. Datawere not spatially smoothed.
Anatomical ROIs. Lateral andmedial anatomical VTC regions of inter-est (ROIs)were defined on the cortical surface of each subject and hemi-sphere, blind to functional data. The anterior and posterior boundariesof each ROI were the anterior and posterior extents of the MFS, respec-tively. Lateral VTC was defined as the region between the lateral lip ofthe MFS and OTS. Medial VTC was defined as the region between themedial lip of the MFS and CoS (Fig. 7a). The average sizes of lateraland medial anatomical ROIs were similar across age groups (children:2600 mm3 ± 158 mm3; adolescents: 2580 mm3 ± 151 mm3; adults:2380 mm3 ± 126 mm3; no significant effect of age, p = .47).
Linear discriminant analysis (LDA) of functional–structural correspon-dence. To test if the MFS serves as a functional landmark in VTC, weconducted a linear discriminant analysis (LDA) to examine if theanatomical location of each voxel (i.e. whether it belonged to the lateralor medial VTC) in one subject's brain could be classified from thefunctional data in other subjects' brains. For each ROI and hemisphere,we used 500 voxels whose time series were best fit by the GLM. Thisvoxel selection criterion was implemented to be independent of stimu-lus condition and to exclude voxels with excessive noise. Within-groupclassification was conducted with a leave-one-subject-out procedure.Across-group classification was conducted by training on one agegroup and testing on subjects from another age group. The training setconsisted of eccentricity bias values measured at the level of eachvoxel (t-value of fovea–periphery, collapsed across stimulus categories)labeled as belonging to either the lateral ormedial VTCROIs.We used anLDA to derive a linear boundary separating these t-values based on theiranatomical classification. The test set consisted of functional t-valuesfrom voxels with an unknown anatomical location from a subject notused in the training. Using the boundary derived from the training set,we classified the test set voxels to either the lateral or medial VTC ROI.Classification performances on test sets were evaluated by comparingthe classification results to the actual anatomical location of eachvoxel, and then calculating the percentage of voxels classified correctly.Since there was no effect of hemisphere on classification performance(p = .23), data were concatenated across hemispheres resulting in1000 voxels from each subject used for classification.
Distance between eccentricity bias boundary and the MFS fundus. Fol-lowing the classification analyses, which were blind to the functionaldata, we measured the distance along the cortical surface betweeneach point of the eccentricity bias boundary in VTC (defined as the tran-sition between foveally-biased and peripherally-biased voxels) and theMFS fundus, and calculated the average distance in each hemisphere.Unlike the classification analysis, this analysis included voxels withinthe MFS itself to measure the exact position of the functional transitionwithin the MFS. In Fig. 8, we show the average distance between theeccentricity bias boundary and the MFS fundus collapsed across hemi-spheres and subjects for each age group.
Fine-scale functional–structural correspondence. To examine the MFS-functional coupling in the anterior–posterior dimension, 14 of the 35adults were scanned with high-resolution fMRI (HR-fMRI) during a
block design experiment while viewing images of different categoriesincluding faces, limbs, objects, houses and texture patterns as describedin prior studies (Parvizi et al., 2012; Weiner and Grill-Spector, 2010,2011; Weiner et al., 2010). HR-fMRI improves localization of functionalregions and improves measurements of the anterior portion of theMFS,where the timeseries signal-to-noise ratio is often low due to the earcanal susceptibility artifact (Weiner and Grill-Spector, 2013).
Acquisition. Data were collected on a 3 T GE scanner with either a32-channel surface coil, EPI sequence, and 1.8 mm isotropic voxels(FOV = 192 mm; TR = 2 s, TE = 30 ms, and flip angle = 77°, 28slices; 7 subjects) or 8-channel surface coil, spiral acquisition sequence,and 1.5 × 1.5 × 3 mm voxels (FOV = 192 mm; TR = 2 s, TE = 30 ms,andflip angle = 77°, 12 slices, 7 subjects). As therewasno effect of acqui-sition on the MFS-functional coupling reported in Figs. 9–10 (1-wayANOVA with factor of acquisition; p = .71), we report results averagedacross all 14 subjects.
Analysis. To determine the structural–functional coupling betweenthe MFS and face selectivity using HR-fMRI, we defined anatomical,Talairach, and functional ROIs for each subject and hemisphere. Ana-tomical ROIs: 1 cm disk ROIs were placed on the anterior and posteri-or extents of the MFS extending laterally into the FG (Fig. 10).Talairach ROIs: 1 cm disk ROIs were centered on the Talairach coordi-nates of FFA-1 and FFA-2 from prior studies (Pinsk et al., 2009). Func-tional ROIs: pFus-faces/FFA-1 and mFus-faces/FFA-2 were defined asvoxels in the FG responding more to faces N nonfaces, t N 3, voxellevel, uncorrected (see Davidenko et al., 2012; Parvizi et al., 2012;Weiner and Grill-Spector, 2010, 2011, 2013; Weiner et al., 2010).We examined the percentage overlap between these anatomical andfunctional ROIs as well as Talairach and functional ROIs in eachsubject.
Postmortem data acquisition and analysis
To examine the relationship between theMFS and cytoarchitectonicdivisions of the FG, 10 postmortem (PM) brains were studied. Thesebrains were from adults (ages 37–85, 5 females)with no history of neu-rological or psychiatric disease (with the exception of one individualwith transitory motor disease. See Table 1 from Amunts et al., 2000;Caspers et al., 2012; Rottschy et al., 2007). All 10 PM brains came fromthe body donor program of the Institute of Anatomy, University ofDusseldorf, all procedures were approved and in alignment with theprogram guidelines (Amunts et al., 2000).
ScanningPostmortem brains were scanned on a Siemens 1.5 T Scanner
(Erlangen, Germany) after being removed from the subject's skull8–24 h after death.
Anatomical brain volumesA high-resolution anatomical volume of the whole brain was ac-
quired using a T1-weighted 3D-FLASH sequence (TR = 40 ms, flipangle = 40°, TE = 5 ms; resolution of 1 × 1 × 1 mm) before histolog-ical processing and after fixation in 4% formalin or Bodian's fixative forat least 6 months.
Cortical surface reconstructionDetailed methods of histology and 3D reconstruction have been de-
scribed previously (Amunts et al., 1999, 2005; Zilles et al., 2002). Thefixated brains were embedded in paraffin, serially sectioned in coronalsections (20 μm thick), and stained with the Merker-method for cellbodies (Merker, 1983). This method yields a high contrast betweencell bodies (black) and the neuropil (unstained). 3D reconstructionswere computed using (a) the 3D-MRI volume of each brain, (b) imagesof the paraffin block face for precise alignment of the histological sec-tions, and (c) digitized images of the cell body-stained sections(Amunts et al., 2004). For direct comparison to the 69 subjects, brains
457K.S. Weiner et al. / NeuroImage 84 (2014) 453–465
were also manually segmented to separate gray from white matterusing ITK-SNAP (http://white.stanford.edu/itkgray), from which wereconstructed the cortical surfaces (Fig. 6a).
Detection of FG1 and FG2 boundaryA detailed description for defining cytoarchitectonic areas of FG1
and FG2 is given elsewhere (Amunts and Zilles, 2001; Amunts et al.,2000; Caspers et al., 2012). Briefly, the border between FG1 and FG2was defined (Caspers et al., 2012) using a statistically testable, quantita-tive, and observer-independent cortical parcellation technique (Amuntset al., 2000; Schleicher et al., 1999, 2005; Zilles et al., 2002). Specifically,gray-level indices (GLI) were determined in digitized histological sec-tions as a measure of the volume proportion between cell bodies andthe neuropil. GLI profiles were calculated along curvilinear trajectoriesoriented perpendicular to the cortical layers, thus measuring the GLIfrom the superficial to the innermost layer in cortical regions of interest.The shape of GLI profiles was determined based on ten features: themean GLI value, the position of the center of gravity on the profilecurve (cortical depth), the standard deviation of the mean GLI (indicat-ing the variability of the GLI throughout all layers), skewness and kurto-sis of the profile curve, and the respective features from the profile'sfirstderivative (Schleicher et al., 1999). The borders between areas weredetermined based on the cortical position of the greatest difference be-tween neighboring GLI profiles quantified by the Mahalanobis distanceand tested for significance (Fig. 4; Hotelling's T2 test; Bonferroni-corrected). Areal borders are expected at positions along the corticalribbon showing a great dissimilarity in laminar patterns between adja-cent blocks of profiles. To assure that the areal boundarywas not depen-dent on the block size, the procedurewas titrated for block sizes rangingfrom 8 to 24 profiles per block. Cortical borders were confirmed if theywere consistently positioned in adjacent histological sections and acrossseveral block sizes (Fig. 4).
Distance between the FG1/FG2 boundary and the MFSIn all 20 hemispheres, we measured the distance along the cortical
surface between each point of the FG1/FG2 boundary and the nearestpoint on the MFS in a given hemisphere. We used the average distancefor each subject in each hemisphere as our measure of the distancebetween the FG1/FG2 boundary and the MFS and report the meandistance across subjects. In the 18 hemispheres within which thecytoarchitectonic boundary between FG1 and FG2 occurred inthe MFS, we also measured the percentage of the MFS containing theFG1/FG2 boundary (Fig. 6b) and the average distance of this boundaryfrom the fundus of the MFS (Fig. 6c).
Relationship between Talairach coordinates and the FG1/FG2 boundaryUsing the average Talairach coordinates of the MFS from our inde-
pendent adult sample (Table 2), we compared the ability of Talairachcoordinates to predict the FG1/FG2 boundary relative to the actualMFS coordinates. In all 20 hemispheres, we drew a line between the an-terior and posterior points of the MFS as predicted by Talairach coordi-nates.We thenmeasured the average distance between this line and theFG1/FG2 boundary and compared this metric to the distance betweenthe FG1/FG2 boundary and the MFS as described in the above section.
Results
Incidence, morphology, and development of the mid-fusiform sulcus (MFS)
The MFS displays four morphological patterns and is identifiable inevery hemisphere
We first examined the incidence and morphological features of theMFS on the cortical surface and single coronal slices in 138 hemispheresacross three age groups: children, adolescents, and adults. Although theMFS is a minor sulcus and not mentioned in the most commonly usedhuman neuroanatomical atlases from the last century (Brodmann,
1909; Duvernoy, 1999; Evans et al., 1992; Ono et al., 1990; Talairachand Tournoux, 1988), it was identifiable in all 138 hemispheres, and isbest described as a longitudinal sulcus dividing the FG into lateral andmedial partitions (Fig. 1)with a distinctive “ω” pattern on single coronalslices (red outline in Figs. 1–2).
The organization of the MFS relative to surrounding sulci exhibitedtwo characteristic pattern types (Type I and Type II) that were evidentwhen viewing the cortical surface. In Type I patterns, the MFS appearedas a distinct sulcus separate from the OTS and CoS. In Type II patterns,the MFS intersected with either the OTS or CoS. Both Type I and TypeII patterns were further classified based on whether the MFS was con-tinuous (subtype A) or fractionated (subtype B). Thus, the features ofthe different MFS patterns are defined as follows:
Type IA: a single longitudinal sulcus, distinct from the OTS and CoS(Fig. 2, far left).Type IB: a fractionated longitudinal sulcus, distinct from the OTS andCoS (Fig. 2, middle left).Type IIA: a single longitudinal sulcus, sharing a sulcal bed with theOTS or CoS (Fig. 2, middle right).Type IIB: a fractionated longitudinal sulcus, with at least one compo-nent sharing a sulcal bed with the OTS or CoS (Fig. 2, far right).
These morphological patterns occurred with similar frequenciesacross hemispheres, genders, and age groups tested (Table 1). Type IMFS patterns (manifesting as a distinct sulcus) were themost common,occurring in about two-thirds (68%) of hemispheres. Type II MFS pat-terns occurred in about a third of hemispheres (32%) and were distinctfrom the recently described lateral branches of the CoS (Huntgeburthand Petrides, 2012). Further, unfractionated A patterns were abouttwo times as frequent as fractionated B patterns (ratio: 2.5 for Type I;1.9 for Type II) and fractionated B patterns were most frequently com-posed of two components (34/42; 81%). Thus, the MFS is a stable ana-tomical landmark on the FG with four typical morphological patternsthat are common across hemispheres, genders, and age groups.
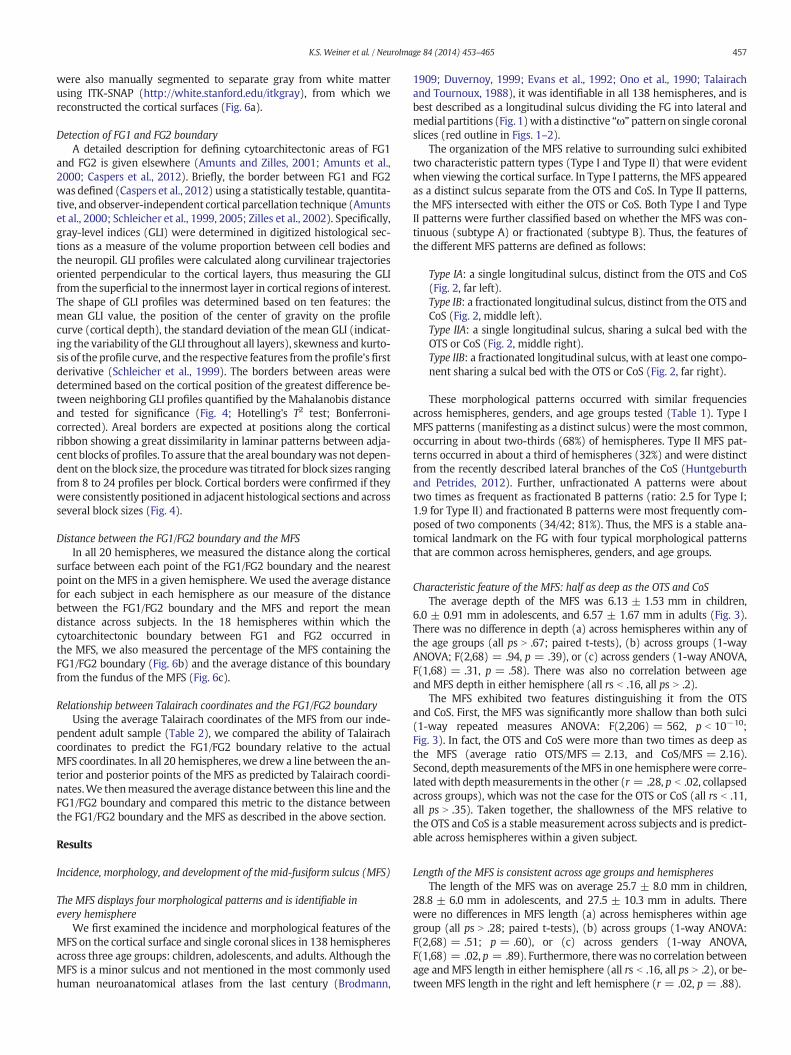
Characteristic feature of the MFS: half as deep as the OTS and CoSThe average depth of the MFS was 6.13 ± 1.53 mm in children,
6.0 ± 0.91 mm in adolescents, and 6.57 ± 1.67 mm in adults (Fig. 3).There was no difference in depth (a) across hemispheres within any ofthe age groups (all ps N .67; paired t-tests), (b) across groups (1-wayANOVA; F(2,68) = .94, p = .39), or (c) across genders (1-way ANOVA,F(1,68) = .31, p = .58). There was also no correlation between ageand MFS depth in either hemisphere (all rs b .16, all ps N .2).
The MFS exhibited two features distinguishing it from the OTSand CoS. First, the MFS was significantly more shallow than both sulci(1-way repeated measures ANOVA: F(2,206) = 562, p b 10−10;Fig. 3). In fact, the OTS and CoS were more than two times as deep asthe MFS (average ratio OTS/MFS = 2.13, and CoS/MFS = 2.16).Second, depthmeasurements of theMFS in onehemispherewere corre-latedwith depthmeasurements in the other (r = .28, p b .02, collapsedacross groups), which was not the case for the OTS or CoS (all rs b .11,all ps N .35). Taken together, the shallowness of the MFS relative tothe OTS and CoS is a stable measurement across subjects and is predict-able across hemispheres within a given subject.
Length of the MFS is consistent across age groups and hemispheresThe length of the MFS was on average 25.7 ± 8.0 mm in children,
28.8 ± 6.0 mm in adolescents, and 27.5 ± 10.3 mm in adults. Therewere no differences in MFS length (a) across hemispheres within agegroup (all ps N .28; paired t-tests), (b) across groups (1-way ANOVA:F(2,68) = .51; p = .60), or (c) across genders (1-way ANOVA,F(1,68) = .02, p = .89). Furthermore, therewas no correlation betweenage andMFS length in either hemisphere (all rs b .16, all ps N .2), or be-tween MFS length in the right and left hemisphere (r = .02, p = .88).
OTS MFS CoS0
5
10
15
20
sulc
al d
epth
[mm
]
OTS MFS CoS0
5
10
15
20
OTS MFS CoS0
5
10
15
20
OTS MFS CoS0
5
10
15
20Children (N=20) Adolescents (N=14) Adults (N=35)All (n=69)
*
Fig. 3. The CoS and OTS are more than two times as deep as theMFS. Leftmost panel: Each bar (± std) represents data averaged across hemispheres and subjects. TheMFS is significantlymore shallow than either the OTS or CoS, *p b 10−38. Right panels: Boxplots ofMFS depth indicatingmedian, 25% and 75% percentiles, as well as range ofminimumandmaximum valuesseparately for each age group. In each pair, the right hemisphere measurements are presented on the right.
458 K.S. Weiner et al. / NeuroImage 84 (2014) 453–465
In contrast to the MFS depth, there was significant variability acrosssubjects in the length of the MFS, ranging from 2.0 mm to 56.3 mm.This variability is consistent with prior reports (8 mm to 54 mm in 17subjects; Nasr et al., 2011). Morphologically, this variability in length af-fected the posterior, but not anterior, limit of theMFS,where the anterior
Brain 6
Brain 3
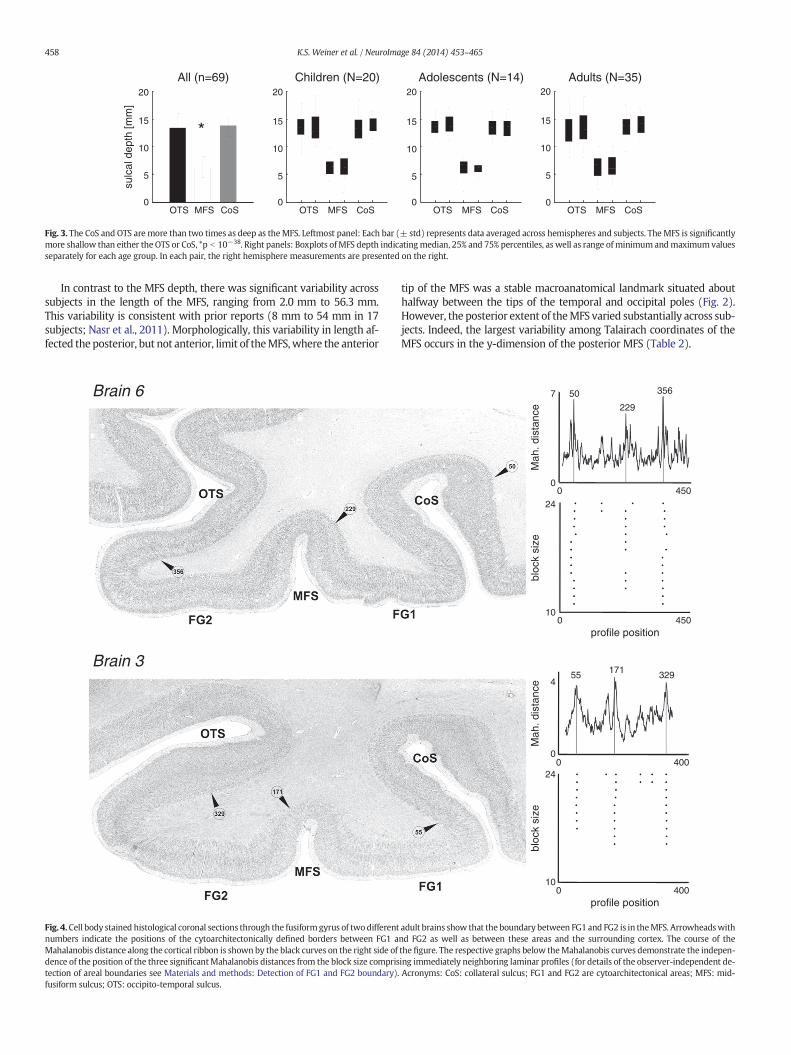
Fig. 4.Cell body stained histological coronal sections through the fusiformgyrus of twodifferentnumbers indicate the positions of the cytoarchitectonically defined borders between FG1 aMahalanobis distance along the cortical ribbon is shown by the black curves on the right side ofdence of the position of the three significantMahalanobis distances from the block size compristection of areal boundaries see Materials and methods: Detection of FG1 and FG2 boundary).fusiform sulcus; OTS: occipito-temporal sulcus.
tip of the MFS was a stable macroanatomical landmark situated abouthalfway between the tips of the temporal and occipital poles (Fig. 2).However, the posterior extent of theMFS varied substantially across sub-jects. Indeed, the largest variability among Talairach coordinates of theMFS occurs in the y-dimension of the posterior MFS (Table 2).
bloc
k si
ze
4000profile position
10
244000
Mah
. dis
tanc
e
0
455 171 329
24
4500profile position
10
bloc
k si
ze
4500
Mah
. dis
tanc
e
7
0
50
229
356
adult brains show that the boundary between FG1 and FG2 is in theMFS. Arrowheadswithnd FG2 as well as between these areas and the surrounding cortex. The course of thethe figure. The respective graphs below theMahalanobis curves demonstrate the indepen-ing immediately neighboring laminar profiles (for details of the observer-independent de-Acronyms: CoS: collateral sulcus; FG1 and FG2 are cytoarchitectonical areas; MFS: mid-
459K.S. Weiner et al. / NeuroImage 84 (2014) 453–465
Cytoarchitectonics
The boundary between cytoarchitectonic regions FG1 and FG2 occurswithin the MFS
We next examined the location of the MFS relative to twocytoarchitectonic divisions of the FG, FG1 and FG2, in 10 postmortem(PM) brains whose cytoarchitectonics were defined previously(Caspers et al., 2012). The border between FG1 and FG2was determinedbased on the cortical position of the greatest difference between neigh-boring GLI profiles quantified by the Mahalanobis distance and testedfor significance (Materials and methods; Fig. 4). It is important to notethat these cytoarchitectonic boundarieswere defined using observer in-dependentmethods, and weremade prior to characterizing the MFS, astheω pattern (Fig. 1) used to localize theMFS on single histological sec-tions was unknown at the time of the original FG1/FG2 identification(Caspers et al., 2012).
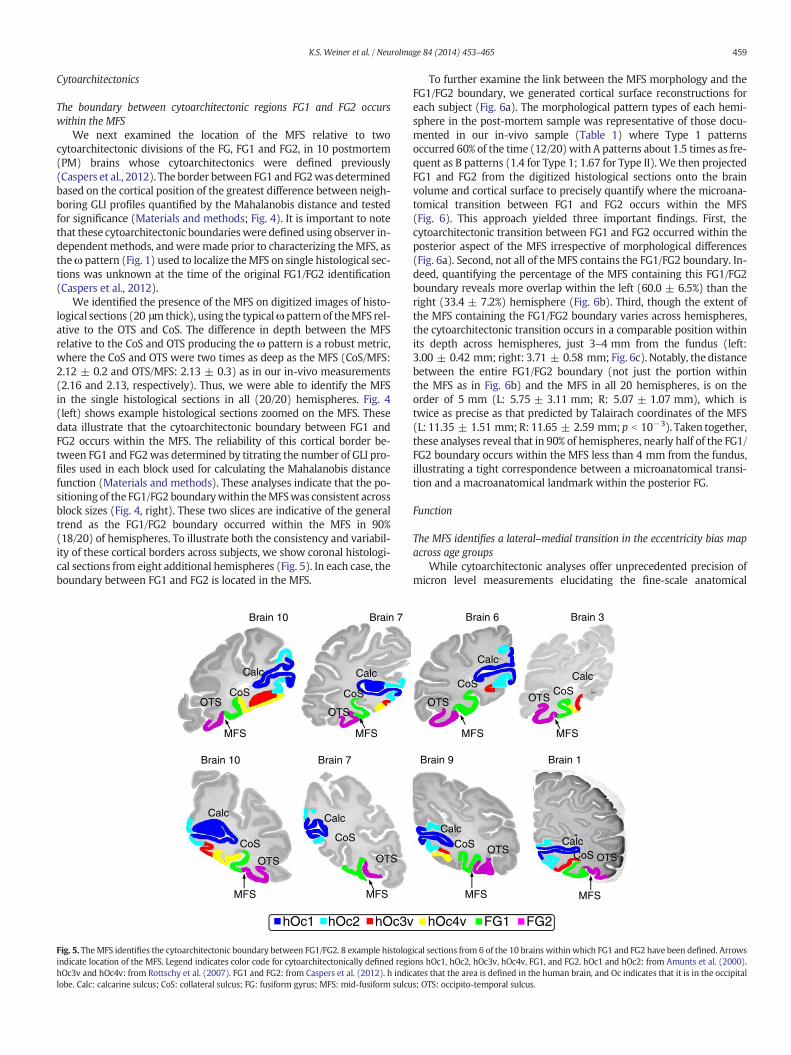
We identified the presence of the MFS on digitized images of histo-logical sections (20 μmthick), using the typicalωpattern of theMFS rel-ative to the OTS and CoS. The difference in depth between the MFSrelative to the CoS and OTS producing the ω pattern is a robust metric,where the CoS and OTS were two times as deep as the MFS (CoS/MFS:2.12 ± 0.2 and OTS/MFS: 2.13 ± 0.3) as in our in-vivo measurements(2.16 and 2.13, respectively). Thus, we were able to identify the MFSin the single histological sections in all (20/20) hemispheres. Fig. 4(left) shows example histological sections zoomed on the MFS. Thesedata illustrate that the cytoarchitectonic boundary between FG1 andFG2 occurs within the MFS. The reliability of this cortical border be-tween FG1 and FG2was determined by titrating the number of GLI pro-files used in each block used for calculating the Mahalanobis distancefunction (Materials and methods). These analyses indicate that the po-sitioning of the FG1/FG2 boundarywithin theMFSwas consistent acrossblock sizes (Fig. 4, right). These two slices are indicative of the generaltrend as the FG1/FG2 boundary occurred within the MFS in 90%(18/20) of hemispheres. To illustrate both the consistency and variabil-ity of these cortical borders across subjects, we show coronal histologi-cal sections from eight additional hemispheres (Fig. 5). In each case, theboundary between FG1 and FG2 is located in the MFS.
CoS
OTS
Brain 7Brain 10
CoSOTS
Brain 10
CoS
OTS
Brain 7
CoS
OTS
hOc3vhOc1 hOc2
MFS MFS
MFSMFS
Calc Calc
CalcCalc
Fig. 5. TheMFS identifies the cytoarchitectonic boundary between FG1/FG2. 8 example histologindicate location of the MFS. Legend indicates color code for cytoarchitectonically defined regihOc3v and hOc4v: from Rottschy et al. (2007). FG1 and FG2: from Caspers et al. (2012). h indiclobe. Calc: calcarine sulcus; CoS: collateral sulcus; FG: fusiform gyrus; MFS: mid-fusiform sulcu
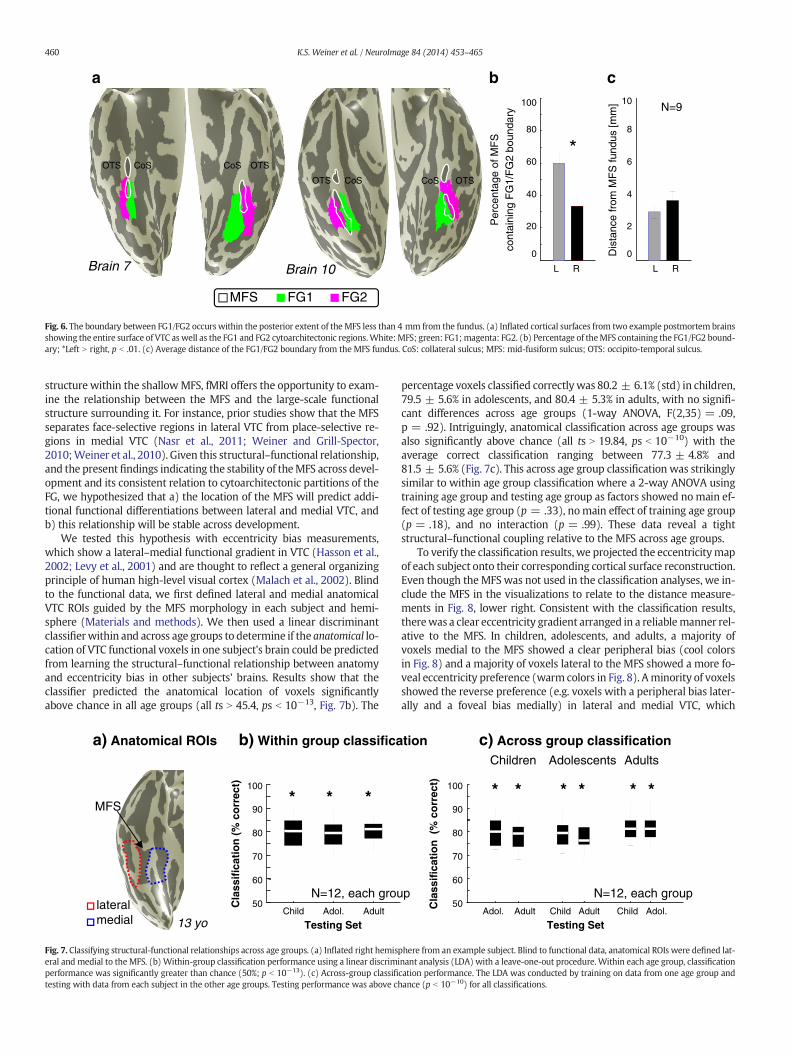
To further examine the link between the MFS morphology and theFG1/FG2 boundary, we generated cortical surface reconstructions foreach subject (Fig. 6a). The morphological pattern types of each hemi-sphere in the post-mortem sample was representative of those docu-mented in our in-vivo sample (Table 1) where Type 1 patternsoccurred 60% of the time (12/20) with A patterns about 1.5 times as fre-quent as B patterns (1.4 for Type 1; 1.67 for Type II). We then projectedFG1 and FG2 from the digitized histological sections onto the brainvolume and cortical surface to precisely quantify where the microana-tomical transition between FG1 and FG2 occurs within the MFS(Fig. 6). This approach yielded three important findings. First, thecytoarchitectonic transition between FG1 and FG2 occurred within theposterior aspect of the MFS irrespective of morphological differences(Fig. 6a). Second, not all of the MFS contains the FG1/FG2 boundary. In-deed, quantifying the percentage of the MFS containing this FG1/FG2boundary reveals more overlap within the left (60.0 ± 6.5%) than theright (33.4 ± 7.2%) hemisphere (Fig. 6b). Third, though the extent ofthe MFS containing the FG1/FG2 boundary varies across hemispheres,the cytoarchitectonic transition occurs in a comparable position withinits depth across hemispheres, just 3–4 mm from the fundus (left:3.00 ± 0.42 mm; right: 3.71 ± 0.58 mm; Fig. 6c). Notably, the distancebetween the entire FG1/FG2 boundary (not just the portion withinthe MFS as in Fig. 6b) and the MFS in all 20 hemispheres, is on theorder of 5 mm (L: 5.75 ± 3.11 mm; R: 5.07 ± 1.07 mm), which istwice as precise as that predicted by Talairach coordinates of the MFS(L: 11.35 ± 1.51 mm; R: 11.65 ± 2.59 mm; p b 10−3). Taken together,these analyses reveal that in 90% of hemispheres, nearly half of the FG1/FG2 boundary occurs within the MFS less than 4 mm from the fundus,illustrating a tight correspondence between a microanatomical transi-tion and a macroanatomical landmark within the posterior FG.
Function
The MFS identifies a lateral–medial transition in the eccentricity bias mapacross age groups
While cytoarchitectonic analyses offer unprecedented precision ofmicron level measurements elucidating the fine-scale anatomical
Brain 6
CoS
OTS
Brain 9
CoS OTS
FG1hOc4v FG2
Brain 1
OTS
MFS MFS
MFSMFS
CoS
CalcCalc
Brain 3
CoSOTS
Calc
Calc
ical sections from 6 of the 10 brains within which FG1 and FG2 have been defined. Arrowsons hOc1, hOc2, hOc3v, hOc4v, FG1, and FG2. hOc1 and hOc2: from Amunts et al. (2000).ates that the area is defined in the human brain, and Oc indicates that it is in the occipitals; OTS: occipito-temporal sulcus.
L R
0
20
40
60
80
100
Per
cent
age
of M
FS
cont
aini
ng F
G1/
FG
2 bo
unda
ry
0
2
4
6
8
10
Dis
tanc
e fr
om M
FS
fund
us [m
m]
*
N=9
a
FG1MFS FG2
Brain 7 L R
OTS CoS CoS OTS
OTS CoS CoS OTS
Brain 10
b c
Fig. 6. The boundary between FG1/FG2 occurs within the posterior extent of the MFS less than 4 mm from the fundus. (a) Inflated cortical surfaces from two example postmortem brainsshowing the entire surface of VTC as well as the FG1 and FG2 cytoarchitectonic regions.White:MFS; green: FG1; magenta: FG2. (b) Percentage of theMFS containing the FG1/FG2 bound-ary; *Left N right, p b .01. (c) Average distance of the FG1/FG2 boundary from the MFS fundus. CoS: collateral sulcus; MFS: mid-fusiform sulcus; OTS: occipito-temporal sulcus.
460 K.S. Weiner et al. / NeuroImage 84 (2014) 453–465
structure within the shallowMFS, fMRI offers the opportunity to exam-ine the relationship between the MFS and the large-scale functionalstructure surrounding it. For instance, prior studies show that the MFSseparates face-selective regions in lateral VTC from place-selective re-gions in medial VTC (Nasr et al., 2011; Weiner and Grill-Spector,2010;Weiner et al., 2010). Given this structural–functional relationship,and the present findings indicating the stability of theMFS across devel-opment and its consistent relation to cytoarchitectonic partitions of theFG, we hypothesized that a) the location of the MFS will predict addi-tional functional differentiations between lateral and medial VTC, andb) this relationship will be stable across development.
We tested this hypothesis with eccentricity bias measurements,which show a lateral–medial functional gradient in VTC (Hasson et al.,2002; Levy et al., 2001) and are thought to reflect a general organizingprinciple of human high-level visual cortex (Malach et al., 2002). Blindto the functional data, we first defined lateral and medial anatomicalVTC ROIs guided by the MFS morphology in each subject and hemi-sphere (Materials and methods). We then used a linear discriminantclassifierwithin and across age groups to determine if the anatomical lo-cation of VTC functional voxels in one subject's brain could be predictedfrom learning the structural–functional relationship between anatomyand eccentricity bias in other subjects' brains. Results show that theclassifier predicted the anatomical location of voxels significantlyabove chance in all age groups (all ts N 45.4, ps b 10−13, Fig. 7b). The
Child Adol. Adult50
60
70
80
90
100
Cla
ssif
icat
ion
(%
co
rrec
t)
Testing Set
b) Within group classifica
lateralmedial
a) Anatomical ROIs
MFS
13 yo
N=12, each grou
* * *
Fig. 7. Classifying structural-functional relationships across age groups. (a) Inflated right hemiseral and medial to the MFS. (b) Within-group classification performance using a linear discrimiperformance was significantly greater than chance (50%; p b 10−13). (c) Across-group classifitesting with data from each subject in the other age groups. Testing performance was above ch
percentage voxels classified correctlywas 80.2 ± 6.1% (std) in children,79.5 ± 5.6% in adolescents, and 80.4 ± 5.3% in adults, with no signifi-cant differences across age groups (1-way ANOVA, F(2,35) = .09,p = .92). Intriguingly, anatomical classification across age groups wasalso significantly above chance (all ts N 19.84, ps b 10−10) with theaverage correct classification ranging between 77.3 ± 4.8% and81.5 ± 5.6% (Fig. 7c). This across age group classification was strikinglysimilar to within age group classification where a 2-way ANOVA usingtraining age group and testing age group as factors showed nomain ef-fect of testing age group (p = .33), nomain effect of training age group(p = .18), and no interaction (p = .99). These data reveal a tightstructural–functional coupling relative to the MFS across age groups.
To verify the classification results, we projected the eccentricitymapof each subject onto their corresponding cortical surface reconstruction.Even though theMFS was not used in the classification analyses, we in-clude the MFS in the visualizations to relate to the distance measure-ments in Fig. 8, lower right. Consistent with the classification results,therewas a clear eccentricity gradient arranged in a reliablemanner rel-ative to the MFS. In children, adolescents, and adults, a majority ofvoxels medial to the MFS showed a clear peripheral bias (cool colorsin Fig. 8) and a majority of voxels lateral to the MFS showed a more fo-veal eccentricity preference (warm colors in Fig. 8). Aminority of voxelsshowed the reverse preference (e.g. voxels with a peripheral bias later-ally and a foveal bias medially) in lateral and medial VTC, which
tion
Adol. Adult
Children
Child Adult
Testing Set
Adolescents
Child Adol.
Adults
50
60
70
80
90
100
Cla
ssif
icat
ion
(%
co
rrec
t)
c) Across group classification
p N=12, each group
* * * * * *
phere from an example subject. Blind to functional data, anatomical ROIs were defined lat-nant analysis (LDA) with a leave-one-out procedure. Within each age group, classificationcation performance. The LDA was conducted by training on data from one age group andance (p b 10−10) for all classifications.
(t-v
alue
)
-3
3 foveal
peripheral
11 yo 13 yo 14 yo
37 yo25 yo
9 yoAdolescents
Adults
Children
OTS CoS CoS OTS
OTS CoS CoS OTS OTS CoS CoS OTS
Child Adol Adult0
2
4
6
8
10
Dis
tanc
e fr
om M
FS
fund
us [m
m]
N=12, each group
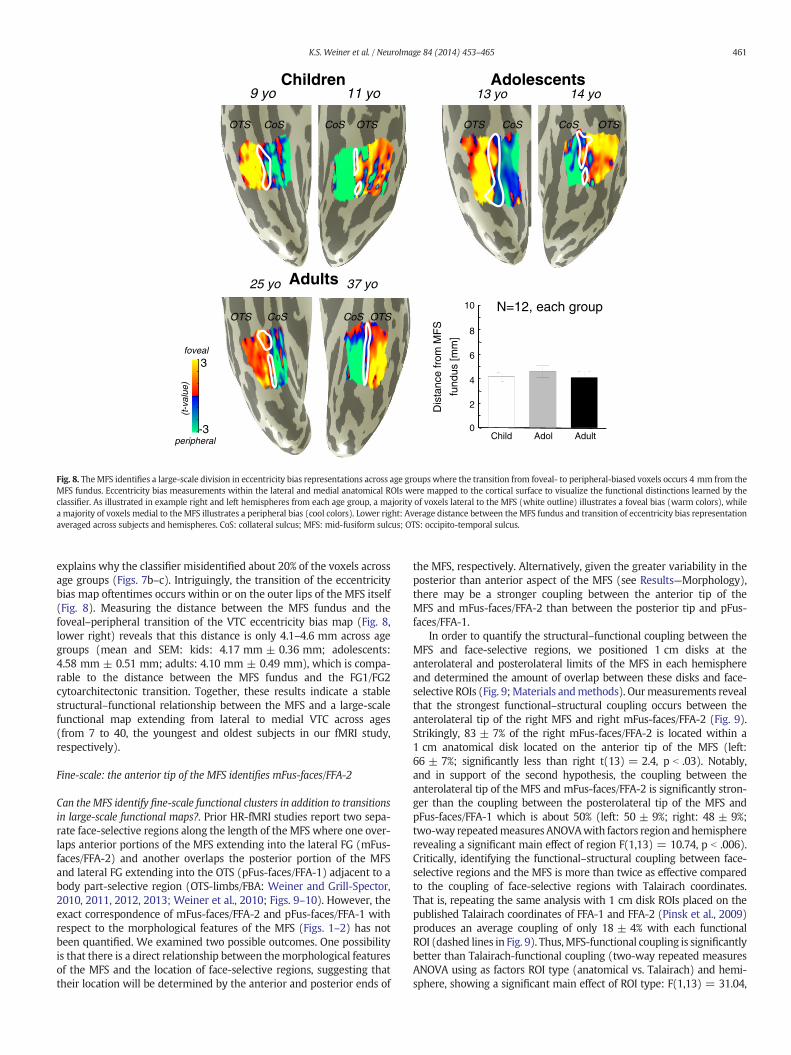
Fig. 8. TheMFS identifies a large-scale division in eccentricity bias representations across age groups where the transition from foveal- to peripheral-biased voxels occurs 4 mm from theMFS fundus. Eccentricity bias measurements within the lateral and medial anatomical ROIs were mapped to the cortical surface to visualize the functional distinctions learned by theclassifier. As illustrated in example right and left hemispheres from each age group, a majority of voxels lateral to the MFS (white outline) illustrates a foveal bias (warm colors), whilea majority of voxels medial to the MFS illustrates a peripheral bias (cool colors). Lower right: Average distance between the MFS fundus and transition of eccentricity bias representationaveraged across subjects and hemispheres. CoS: collateral sulcus; MFS: mid-fusiform sulcus; OTS: occipito-temporal sulcus.
461K.S. Weiner et al. / NeuroImage 84 (2014) 453–465
explains why the classifier misidentified about 20% of the voxels acrossage groups (Figs. 7b–c). Intriguingly, the transition of the eccentricitybias map oftentimes occurs within or on the outer lips of the MFS itself(Fig. 8). Measuring the distance between the MFS fundus and thefoveal–peripheral transition of the VTC eccentricity bias map (Fig. 8,lower right) reveals that this distance is only 4.1–4.6 mm across agegroups (mean and SEM: kids: 4.17 mm ± 0.36 mm; adolescents:4.58 mm ± 0.51 mm; adults: 4.10 mm ± 0.49 mm), which is compa-rable to the distance between the MFS fundus and the FG1/FG2cytoarchitectonic transition. Together, these results indicate a stablestructural–functional relationship between the MFS and a large-scalefunctional map extending from lateral to medial VTC across ages(from 7 to 40, the youngest and oldest subjects in our fMRI study,respectively).
Fine-scale: the anterior tip of the MFS identifies mFus-faces/FFA-2
Can the MFS identify fine-scale functional clusters in addition to transitionsin large-scale functional maps?. Prior HR-fMRI studies report two sepa-rate face-selective regions along the length of the MFS where one over-laps anterior portions of the MFS extending into the lateral FG (mFus-faces/FFA-2) and another overlaps the posterior portion of the MFSand lateral FG extending into the OTS (pFus-faces/FFA-1) adjacent to abody part-selective region (OTS-limbs/FBA: Weiner and Grill-Spector,2010, 2011, 2012, 2013; Weiner et al., 2010; Figs. 9–10). However, theexact correspondence of mFus-faces/FFA-2 and pFus-faces/FFA-1 withrespect to the morphological features of the MFS (Figs. 1–2) has notbeen quantified. We examined two possible outcomes. One possibilityis that there is a direct relationship between themorphological featuresof the MFS and the location of face-selective regions, suggesting thattheir location will be determined by the anterior and posterior ends of
the MFS, respectively. Alternatively, given the greater variability in theposterior than anterior aspect of the MFS (see Results—Morphology),there may be a stronger coupling between the anterior tip of theMFS and mFus-faces/FFA-2 than between the posterior tip and pFus-faces/FFA-1.
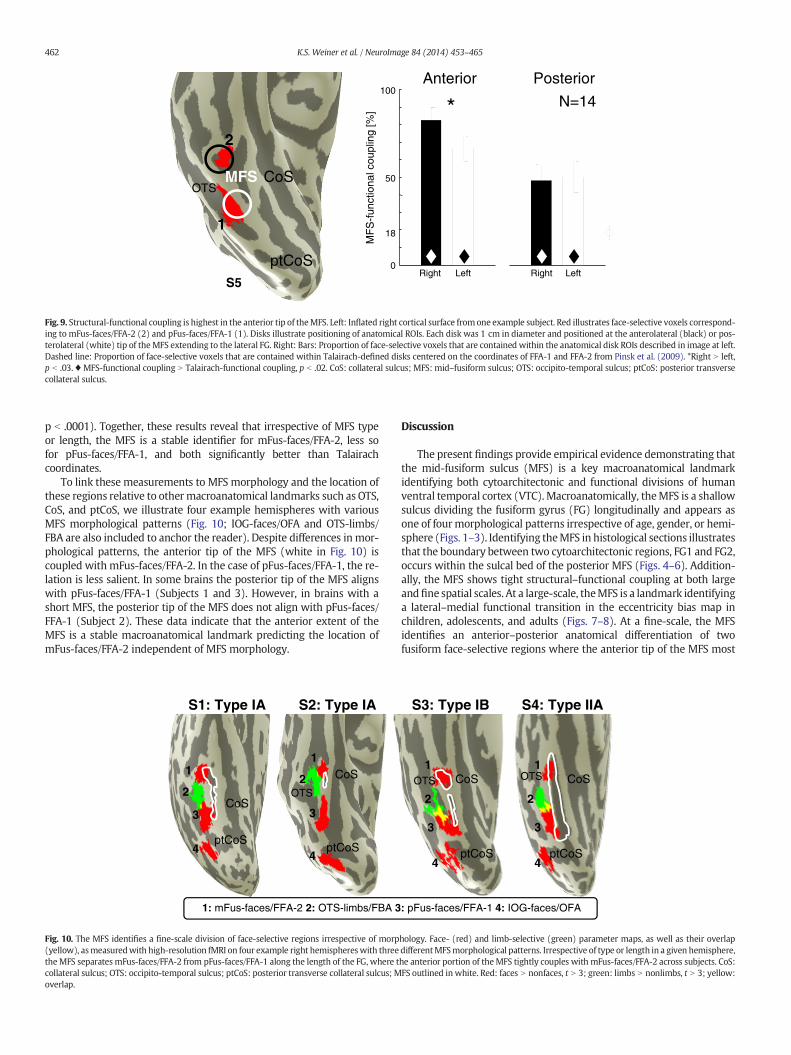
In order to quantify the structural–functional coupling between theMFS and face-selective regions, we positioned 1 cm disks at theanterolateral and posterolateral limits of the MFS in each hemisphereand determined the amount of overlap between these disks and face-selective ROIs (Fig. 9;Materials andmethods). Ourmeasurements revealthat the strongest functional–structural coupling occurs between theanterolateral tip of the right MFS and right mFus-faces/FFA-2 (Fig. 9).Strikingly, 83 ± 7% of the right mFus-faces/FFA-2 is located within a1 cm anatomical disk located on the anterior tip of the MFS (left:66 ± 7%; significantly less than right t(13) = 2.4, p b .03). Notably,and in support of the second hypothesis, the coupling between theanterolateral tip of the MFS and mFus-faces/FFA-2 is significantly stron-ger than the coupling between the posterolateral tip of the MFS andpFus-faces/FFA-1 which is about 50% (left: 50 ± 9%; right: 48 ± 9%;two-way repeatedmeasuresANOVAwith factors region andhemisphererevealing a significant main effect of region F(1,13) = 10.74, p b .006).Critically, identifying the functional–structural coupling between face-selective regions and the MFS is more than twice as effective comparedto the coupling of face-selective regions with Talairach coordinates.That is, repeating the same analysis with 1 cm disk ROIs placed on thepublished Talairach coordinates of FFA-1 and FFA-2 (Pinsk et al., 2009)produces an average coupling of only 18 ± 4% with each functionalROI (dashed lines in Fig. 9). Thus,MFS-functional coupling is significantlybetter than Talairach-functional coupling (two-way repeated measuresANOVA using as factors ROI type (anatomical vs. Talairach) and hemi-sphere, showing a significant main effect of ROI type: F(1,13) = 31.04,
0
18
50
100
Right Left
Anterior
Right Left
Posterior
N=14*
MFS CoSOTS
ptCoS
2
1
MF
S-f
unct
iona
l cou
plin
g [%
]
S5
Fig. 9. Structural-functional coupling is highest in the anterior tip of theMFS. Left: Inflated right cortical surface fromone example subject. Red illustrates face-selective voxels correspond-ing to mFus-faces/FFA-2 (2) and pFus-faces/FFA-1 (1). Disks illustrate positioning of anatomical ROIs. Each disk was 1 cm in diameter and positioned at the anterolateral (black) or pos-terolateral (white) tip of theMFS extending to the lateral FG. Right: Bars: Proportion of face-selective voxels that are contained within the anatomical disk ROIs described in image at left.Dashed line: Proportion of face-selective voxels that are contained within Talairach-defined disks centered on the coordinates of FFA-1 and FFA-2 from Pinsk et al. (2009). *Right N left,p b .03. ♦ MFS-functional coupling N Talairach-functional coupling, p b .02. CoS: collateral sulcus; MFS: mid–fusiform sulcus; OTS: occipito-temporal sulcus; ptCoS: posterior transversecollateral sulcus.
462 K.S. Weiner et al. / NeuroImage 84 (2014) 453–465
p b .0001). Together, these results reveal that irrespective of MFS typeor length, the MFS is a stable identifier for mFus-faces/FFA-2, less sofor pFus-faces/FFA-1, and both significantly better than Talairachcoordinates.
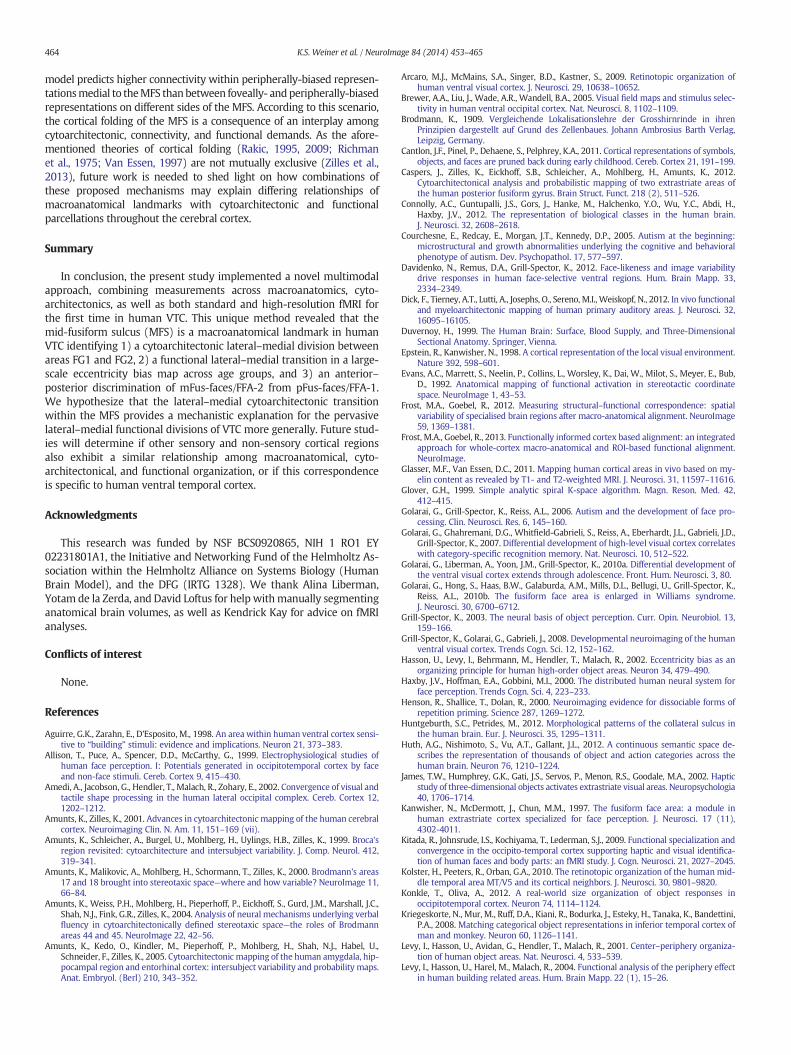
To link these measurements to MFS morphology and the location ofthese regions relative to othermacroanatomical landmarks such as OTS,CoS, and ptCoS, we illustrate four example hemispheres with variousMFS morphological patterns (Fig. 10; IOG-faces/OFA and OTS-limbs/FBA are also included to anchor the reader). Despite differences in mor-phological patterns, the anterior tip of the MFS (white in Fig. 10) iscoupled with mFus-faces/FFA-2. In the case of pFus-faces/FFA-1, the re-lation is less salient. In some brains the posterior tip of the MFS alignswith pFus-faces/FFA-1 (Subjects 1 and 3). However, in brains with ashort MFS, the posterior tip of the MFS does not align with pFus-faces/FFA-1 (Subject 2). These data indicate that the anterior extent of theMFS is a stable macroanatomical landmark predicting the location ofmFus-faces/FFA-2 independent of MFS morphology.
CoS
ptCoS
OTS
CoS
ptCoS
S1: Type IA S2: Type IA
1
2
3
4
1
2
3
4
1: mFus-faces/FFA-2 2: OTS-limbs/FBA 3
Fig. 10. The MFS identifies a fine-scale division of face-selective regions irrespective of morp(yellow), asmeasuredwith high-resolution fMRI on four example right hemisphereswith threetheMFS separates mFus-faces/FFA-2 from pFus-faces/FFA-1 along the length of the FG, where tcollateral sulcus; OTS: occipito-temporal sulcus; ptCoS: posterior transverse collateral sulcus; Moverlap.
Discussion
The present findings provide empirical evidence demonstrating thatthe mid-fusiform sulcus (MFS) is a key macroanatomical landmarkidentifying both cytoarchitectonic and functional divisions of humanventral temporal cortex (VTC). Macroanatomically, theMFS is a shallowsulcus dividing the fusiform gyrus (FG) longitudinally and appears asone of fourmorphological patterns irrespective of age, gender, or hemi-sphere (Figs. 1–3). Identifying theMFS in histological sections illustratesthat the boundary between two cytoarchitectonic regions, FG1 and FG2,occurs within the sulcal bed of the posterior MFS (Figs. 4–6). Addition-ally, the MFS shows tight structural–functional coupling at both largeandfine spatial scales. At a large-scale, theMFS is a landmark identifyinga lateral–medial functional transition in the eccentricity bias map inchildren, adolescents, and adults (Figs. 7–8). At a fine-scale, the MFSidentifies an anterior–posterior anatomical differentiation of twofusiform face-selective regions where the anterior tip of the MFS most
CoS
ptCoS
OTS CoS
ptCoS
S3: Type IB S4: Type IIA
1
2
3
4
1
2
3
4
: pFus-faces/FFA-1 4: IOG-faces/OFA
OTS
hology. Face- (red) and limb-selective (green) parameter maps, as well as their overlapdifferentMFSmorphological patterns. Irrespective of type or length in a given hemisphere,he anterior portion of theMFS tightly couples with mFus-faces/FFA-2 across subjects. CoS:FS outlined in white. Red: faces N nonfaces, t N 3; green: limbs N nonlimbs, t N 3; yellow:
463K.S. Weiner et al. / NeuroImage 84 (2014) 453–465
tightly couples with mFus-faces/FFA-2 (Figs. 9–10). In the sectionsbelow, we discuss how the correspondence of a macroanatomical land-mark with both cytoarchitectonic and functional parcellations may de-velop in high-level sensory cortex and the implications of thiscorrespondence for future research.
Stable morphological features of the MFS across children, adolescents,and adults
In the original observation of the MFS in modern writing, Puce et al.(1996) reported, “The fusiform gyrus often is divided by a longitudinalsulcus that can be confusedwith the collateral sulcus in isolated coronalslices” (p. 5207). Seventeen years later, ourfindings clarify themorphol-ogy of the MFS, identifying its shallowness as its hallmark morphologi-cal feature which discriminates it from the surrounding OTS and CoS.The difference in depth among these three sulci generates a distinctive“ω” pattern on coronal slices, which is identifiable from age 7 to 85(the youngest and oldest subjects of our four studies, respectively).The stability of theMFSmorphology across developmentmakes it a par-ticularly useful landmark to incorporate into studies examining thefunctional properties of the FG across age groups and populations(Cantlon et al., 2011; Golarai et al., 2006, 2007, 2010a, 2010b; Grill-Spector et al., 2008; Peelen et al., 2009; Scherf et al., 2007), as well ashistological studies across typical (Caspers et al., 2012) and atypical(Courchesne et al., 2005; van Kooten et al., 2008) populations. Itwould be particularly interesting to investigate if the MFS is present innewborns and if the structural–functional coupling we report here isalready evident at birth. Importantly, identifying the MFS may (1) in-crease the precision of anatomical registration across subjects by in-creasing the inter-rater reliability of manual identification of sulci,which is lowest in VTC (Sowell et al., 2002), (2) improve the alignmentamong brains in atlasing projects using large cohorts of subjects (VanEssen et al., 2012a, 2012b), and (3) aid investigations of functional–structural correspondences using cortex based alignment methods(CBA; Frost and Goebel, 2012, 2013). While present studies applyingCBA report substantial variability in the cortical positioning of functionalregions along the length of the lateral FG (Frost andGoebel, 2012, 2013),inclusion of the MFS in future CBA techniques may substantially reducethis variability.
The MFS is a landmark identifying cytoarchitectonic and functionaldivisions of VTC
Understanding themorphology of theMFS allowed us to link corticalfoldingpatterns to both cytoarchitectonic and functional divisions of theFG. Interestingly, both the cytoarchitectonic division between FG1 andFG2 and the functional division among peripheral and foveal represen-tations occur along amedial–lateral axis relative to theMFS. That is, FG1and peripherally–biased voxels are located within the medial aspect ofthe MFS extending into the medial FG and CoS, whereas FG2 andfoveally–biased voxels are located within the lateral aspect of the MFSextending into the lateral FG and OTS. Given that cytoarchitectonic(FG1/FG2) and functional representations (peripheral-bias/foveal-bias) occupy the same macroanatomical expanse on either side of theMFS, and both within comparable distances from the MFS fundus onthe order of 4 mmwithin the MFS itself, our results suggest that differ-ential neural hardware may implement differential computations onmedial and lateral aspects of VTC. Our findings also raise new questionsregarding the relationship between the underlying neural architecturewith the functional properties of these regions. For instance: Is theperipheral bias in medial VTC an outcome of the defining features of FG1,such as its columnar organization? How is the foveal bias in lateral VTCassociated with the defining features of FG2, such as its lack of a columnarorganization and increased neuronal density compared to FG1?
From structure to function: implications for cytoarchitectonic–functionalcoupling in VTC
Linking between cytoarchitectonic and functional divisions of VTCthrough their correspondence to theMFS is not limited to foveal and pe-ripheral biases, butmay extend to other large-scale maps and fine-scaleclusters identified in VTC. For instance, recent fMRI studies in adultsshow that face- and place-selective regions are also reliably separatedby the MFS (Nasr et al., 2011; Weiner and Grill-Spector, 2010; Weineret al., 2010) indicating the generality of the MFS as a functional land-mark in VTC. In addition to eccentricity bias and category selectivity,lateral–medial functional gradients have also been found for animacy(Connolly et al., 2012; Kriegeskorte et al., 2008; Mahon et al., 2009;Martin, 2007), real-world object size (Konkle and Oliva, 2012), seman-tics (Huth et al., 2012), and retinotopy (Arcaro et al., 2009; Brewer et al.,2005; Kolster et al., 2010). Since the boundary of FG1 and FG2 occurswithin the MFS, we predict that a functional component of each ofthese maps will align with respect to the MFS, which can be directlytested in future studies.
While our data suggest differential neural architectures on separatesides of the MFS, we caution that the correspondence betweencytoarchitectonic and functional divisions are likely not one-to-one.First, while all of the maps mentioned above display a similar lateral–medial gradient, these maps are not identical in their spatial organiza-tion across the cortical sheet. For example, though the cortical represen-tations differentiating faces from scenes and foveal from peripheralbiases both illustrate a lateral–medial gradient, respectively, they donot overlap entirely (Hasson et al., 2002; Levy et al., 2001, 2004;Malach et al., 2002). Second, within these large-scale maps, the MFS-functional coupling may be different for fine-scale clusters. In the pres-ent study,we illustrated thiswith face-selective regionswhere there is atighter correspondence between the MFS and mFus-faces/FFA-2 thanfor pFus-faces/FFA-1 (Fig. 9). However, there are additional fine-scaleclusters in both lateral VTC (e.g. for limbs, words, and objects: Grill-Spector, 2003; Peelen and Downing, 2007; Weiner and Grill-Spector,2013; Yeatman et al., 2012) and medial VTC (e.g. several retinotopicmaps: Arcaro et al., 2009; Brewer et al., 2005),making it highly probablethat FG1 and FG2 each contain several fine-scale functional regions.Future research will determine how these many large-scale maps andfine-scale clusters tile cytoarchitectonic regions, as well as directly re-late their overlapping and non-overlapping portions to the specific neu-ral hardware of FG1 or FG2. Recent methodological advancements innon-invasive quantitative measurements of cortical anatomy, such asmyeloarchitecture (Dick et al., 2012; Glasser and Van Essen, 2011;Mezer et al., in press; Sereno et al., 2013), and subvoxel fMRI acquisi-tions (Zimmermann et al., 2011), might make this possible and mayallow researchers to directly relate microarchitectural and functionalboundaries within the same subjects.
What mechanisms may generate the cortical folding of the MFS and itscorrespondence with cytoarchitechtonic and functional parcellationsof VTC?
Several hypotheses (Zilles et al., 2013) have been proposed to explainthe formation of cortical folding, including cell migration (Rakic, 1995,2009), inhomogeneous cell growth across cortical layers (Richmanet al., 1975), and tension generated by axonal connectivity in whitematter (Van Essen, 1997). Interestingly, the tension-based hypothesis(Van Essen, 1997) suggests that strongly connected regions will belocated on different sides of a gyrus and that sulci may form fromregion-specific tensions pulling in opposite directions. Since bothcytoarchitectonic regions FG1 and FG2 (as well as peripherally- andfoveally-biased representations as measured in the present study) wraparound separate gyral components flanking the MFS, the tension-basedhypothesis predicts higher connectivity within than between FG1 andFG2, which in turn generates a pull forming the MFS. Likewise, the
464 K.S. Weiner et al. / NeuroImage 84 (2014) 453–465
model predicts higher connectivity within peripherally-biased represen-tationsmedial to theMFS thanbetween foveally- andperipherally-biasedrepresentations on different sides of the MFS. According to this scenario,the cortical folding of the MFS is a consequence of an interplay amongcytoarchitectonic, connectivity, and functional demands. As the afore-mentioned theories of cortical folding (Rakic, 1995, 2009; Richmanet al., 1975; Van Essen, 1997) are not mutually exclusive (Zilles et al.,2013), future work is needed to shed light on how combinations ofthese proposed mechanisms may explain differing relationships ofmacroanatomical landmarks with cytoarchitectonic and functionalparcellations throughout the cerebral cortex.
Summary
In conclusion, the present study implemented a novel multimodalapproach, combining measurements across macroanatomics, cyto-architectonics, as well as both standard and high-resolution fMRI forthe first time in human VTC. This unique method revealed that themid-fusiform sulcus (MFS) is a macroanatomical landmark in humanVTC identifying 1) a cytoarchitectonic lateral–medial division betweenareas FG1 and FG2, 2) a functional lateral–medial transition in a large-scale eccentricity bias map across age groups, and 3) an anterior–posterior discrimination of mFus-faces/FFA-2 from pFus-faces/FFA-1.We hypothesize that the lateral–medial cytoarchitectonic transitionwithin the MFS provides a mechanistic explanation for the pervasivelateral–medial functional divisions of VTC more generally. Future stud-ies will determine if other sensory and non-sensory cortical regionsalso exhibit a similar relationship among macroanatomical, cyto-architectonical, and functional organization, or if this correspondenceis specific to human ventral temporal cortex.
Acknowledgments
This research was funded by NSF BCS0920865, NIH 1 RO1 EY02231801A1, the Initiative and Networking Fund of the Helmholtz As-sociation within the Helmholtz Alliance on Systems Biology (HumanBrain Model), and the DFG (IRTG 1328). We thank Alina Liberman,Yotam de la Zerda, and David Loftus for help withmanually segmentinganatomical brain volumes, as well as Kendrick Kay for advice on fMRIanalyses.
Conflicts of interest
None.
References
Aguirre, G.K., Zarahn, E., D'Esposito, M., 1998. An area within human ventral cortex sensi-tive to “building” stimuli: evidence and implications. Neuron 21, 373–383.
Allison, T., Puce, A., Spencer, D.D., McCarthy, G., 1999. Electrophysiological studies ofhuman face perception. I: Potentials generated in occipitotemporal cortex by faceand non-face stimuli. Cereb. Cortex 9, 415–430.
Amedi, A., Jacobson, G., Hendler, T., Malach, R., Zohary, E., 2002. Convergence of visual andtactile shape processing in the human lateral occipital complex. Cereb. Cortex 12,1202–1212.
Amunts, K., Zilles, K., 2001. Advances in cytoarchitectonic mapping of the human cerebralcortex. Neuroimaging Clin. N. Am. 11, 151–169 (vii).
Amunts, K., Schleicher, A., Burgel, U., Mohlberg, H., Uylings, H.B., Zilles, K., 1999. Broca'sregion revisited: cytoarchitecture and intersubject variability. J. Comp. Neurol. 412,319–341.
Amunts, K., Malikovic, A., Mohlberg, H., Schormann, T., Zilles, K., 2000. Brodmann's areas17 and 18 brought into stereotaxic space—where and how variable? NeuroImage 11,66–84.
Amunts, K., Weiss, P.H., Mohlberg, H., Pieperhoff, P., Eickhoff, S., Gurd, J.M., Marshall, J.C.,Shah, N.J., Fink, G.R., Zilles, K., 2004. Analysis of neural mechanisms underlying verbalfluency in cytoarchitectonically defined stereotaxic space—the roles of Brodmannareas 44 and 45. NeuroImage 22, 42–56.
Amunts, K., Kedo, O., Kindler, M., Pieperhoff, P., Mohlberg, H., Shah, N.J., Habel, U.,Schneider, F., Zilles, K., 2005. Cytoarchitectonic mapping of the human amygdala, hip-pocampal region and entorhinal cortex: intersubject variability and probability maps.Anat. Embryol. (Berl) 210, 343–352.
Arcaro, M.J., McMains, S.A., Singer, B.D., Kastner, S., 2009. Retinotopic organization ofhuman ventral visual cortex. J. Neurosci. 29, 10638–10652.
Brewer, A.A., Liu, J., Wade, A.R., Wandell, B.A., 2005. Visual field maps and stimulus selec-tivity in human ventral occipital cortex. Nat. Neurosci. 8, 1102–1109.
Brodmann, K., 1909. Vergleichende Lokalisationslehre der Grosshirnrinde in ihrenPrinzipien dargestellt auf Grund des Zellenbaues. Johann Ambrosius Barth Verlag,Leipzig, Germany.
Cantlon, J.F., Pinel, P., Dehaene, S., Pelphrey, K.A., 2011. Cortical representations of symbols,objects, and faces are pruned back during early childhood. Cereb. Cortex 21, 191–199.
Caspers, J., Zilles, K., Eickhoff, S.B., Schleicher, A., Mohlberg, H., Amunts, K., 2012.Cytoarchitectonical analysis and probabilistic mapping of two extrastriate areas ofthe human posterior fusiform gyrus. Brain Struct. Funct. 218 (2), 511–526.
Connolly, A.C., Guntupalli, J.S., Gors, J., Hanke, M., Halchenko, Y.O., Wu, Y.C., Abdi, H.,Haxby, J.V., 2012. The representation of biological classes in the human brain.J. Neurosci. 32, 2608–2618.
Courchesne, E., Redcay, E., Morgan, J.T., Kennedy, D.P., 2005. Autism at the beginning:microstructural and growth abnormalities underlying the cognitive and behavioralphenotype of autism. Dev. Psychopathol. 17, 577–597.
Davidenko, N., Remus, D.A., Grill-Spector, K., 2012. Face-likeness and image variabilitydrive responses in human face-selective ventral regions. Hum. Brain Mapp. 33,2334–2349.
Dick, F., Tierney, A.T., Lutti, A., Josephs, O., Sereno, M.I., Weiskopf, N., 2012. In vivo functionaland myeloarchitectonic mapping of human primary auditory areas. J. Neurosci. 32,16095–16105.
Duvernoy, H., 1999. The Human Brain: Surface, Blood Supply, and Three-DimensionalSectional Anatomy. Springer, Vienna.
Epstein, R., Kanwisher, N., 1998. A cortical representation of the local visual environment.Nature 392, 598–601.
Evans, A.C., Marrett, S., Neelin, P., Collins, L., Worsley, K., Dai, W., Milot, S., Meyer, E., Bub,D., 1992. Anatomical mapping of functional activation in stereotactic coordinatespace. NeuroImage 1, 43–53.
Frost, M.A., Goebel, R., 2012. Measuring structural–functional correspondence: spatialvariability of specialised brain regions after macro-anatomical alignment. NeuroImage59, 1369–1381.
Frost, M.A., Goebel, R., 2013. Functionally informed cortex based alignment: an integratedapproach for whole-cortex macro-anatomical and ROI-based functional alignment.NeuroImage.
Glasser, M.F., Van Essen, D.C., 2011. Mapping human cortical areas in vivo based on my-elin content as revealed by T1- and T2-weighted MRI. J. Neurosci. 31, 11597–11616.
Glover, G.H., 1999. Simple analytic spiral K-space algorithm. Magn. Reson. Med. 42,412–415.
Golarai, G., Grill-Spector, K., Reiss, A.L., 2006. Autism and the development of face pro-cessing. Clin. Neurosci. Res. 6, 145–160.
Golarai, G., Ghahremani, D.G., Whitfield-Gabrieli, S., Reiss, A., Eberhardt, J.L., Gabrieli, J.D.,Grill-Spector, K., 2007. Differential development of high-level visual cortex correlateswith category-specific recognition memory. Nat. Neurosci. 10, 512–522.
Golarai, G., Liberman, A., Yoon, J.M., Grill-Spector, K., 2010a. Differential development ofthe ventral visual cortex extends through adolescence. Front. Hum. Neurosci. 3, 80.
Golarai, G., Hong, S., Haas, B.W., Galaburda, A.M., Mills, D.L., Bellugi, U., Grill-Spector, K.,Reiss, A.L., 2010b. The fusiform face area is enlarged in Williams syndrome.J. Neurosci. 30, 6700–6712.
Grill-Spector, K., 2003. The neural basis of object perception. Curr. Opin. Neurobiol. 13,159–166.
Grill-Spector, K., Golarai, G., Gabrieli, J., 2008. Developmental neuroimaging of the humanventral visual cortex. Trends Cogn. Sci. 12, 152–162.
Hasson, U., Levy, I., Behrmann, M., Hendler, T., Malach, R., 2002. Eccentricity bias as anorganizing principle for human high-order object areas. Neuron 34, 479–490.
Haxby, J.V., Hoffman, E.A., Gobbini, M.I., 2000. The distributed human neural system forface perception. Trends Cogn. Sci. 4, 223–233.
Henson, R., Shallice, T., Dolan, R., 2000. Neuroimaging evidence for dissociable forms ofrepetition priming. Science 287, 1269–1272.
Huntgeburth, S.C., Petrides, M., 2012. Morphological patterns of the collateral sulcus inthe human brain. Eur. J. Neurosci. 35, 1295–1311.
Huth, A.G., Nishimoto, S., Vu, A.T., Gallant, J.L., 2012. A continuous semantic space de-scribes the representation of thousands of object and action categories across thehuman brain. Neuron 76, 1210–1224.
James, T.W., Humphrey, G.K., Gati, J.S., Servos, P., Menon, R.S., Goodale, M.A., 2002. Hapticstudy of three-dimensional objects activates extrastriate visual areas. Neuropsychologia40, 1706–1714.
Kanwisher, N., McDermott, J., Chun, M.M., 1997. The fusiform face area: a module inhuman extrastriate cortex specialized for face perception. J. Neurosci. 17 (11),4302-4011.
Kitada, R., Johnsrude, I.S., Kochiyama, T., Lederman, S.J., 2009. Functional specialization andconvergence in the occipito-temporal cortex supporting haptic and visual identifica-tion of human faces and body parts: an fMRI study. J. Cogn. Neurosci. 21, 2027–2045.
Kolster, H., Peeters, R., Orban, G.A., 2010. The retinotopic organization of the human mid-dle temporal area MT/V5 and its cortical neighbors. J. Neurosci. 30, 9801–9820.
Konkle, T., Oliva, A., 2012. A real-world size organization of object responses inoccipitotemporal cortex. Neuron 74, 1114–1124.
Kriegeskorte, N., Mur, M., Ruff, D.A., Kiani, R., Bodurka, J., Esteky, H., Tanaka, K., Bandettini,P.A., 2008. Matching categorical object representations in inferior temporal cortex ofman and monkey. Neuron 60, 1126–1141.
Levy, I., Hasson, U., Avidan, G., Hendler, T., Malach, R., 2001. Center–periphery organiza-tion of human object areas. Nat. Neurosci. 4, 533–539.
Levy, I., Hasson, U., Harel, M., Malach, R., 2004. Functional analysis of the periphery effectin human building related areas. Hum. Brain Mapp. 22 (1), 15–26.

465K.S. Weiner et al. / NeuroImage 84 (2014) 453–465
Mahon, B.Z., Caramazza, A., 2009. Concepts and categories: a cognitive neuropsychologi-cal perspective. Annu. Rev. Psychol. 60, 27–51.
Mahon, B.Z., Anzellotti, S., Schwarzbach, J., Zampini, M., Caramazza, A., 2009. Category-specific organization in the human brain does not require visual experience. Neuron63, 397–405.
Malach, R., Levy, I., Hasson, U., 2002. The topography of high-order human object areas.Trends Cogn. Sci. 6, 176–184.
Martin, A., 2007. The representation of object concepts in the brain. Annu. Rev. Psychol.58, 25–45.
Merker, B., 1983. Silver staining of cell bodies by means of physical development.J. Neurosci. Methods 9, 235–241.
Mezer, A., Yeatman, J.D., Wandell, B.A., 2013. Quantifying the local tissue volume andcomposition in individual brains with MRI. Nat. Med. (in press).
Nasr, S., Liu, N., Devaney, K.J., Yue, X., Rajimehr, R., Ungerleider, L.G., Tootell, R.B., 2011.Scene-selective cortical regions in human and nonhuman primates. J. Neurosci. 31,13771–13785.
Nestares, O., Heeger, D.J., 2000. Robust multiresolution alignment of MRI brain volumes.Magn. Reson. Med. 43, 705–715.
Nobre, A.C., Allison, T., McCarthy, G., 1998. Modulation of human extrastriate visualprocessing by selective attention to colours and words. Brain 121 (Pt 7), 1357–1368.
Ono, M., Kubik, S., Abernathey, C., 1990. Atlas of the Cerebral Sulci. Thieme, Stuttgart.Op de Beeck, H.P., Haushofer, J., Kanwisher, N.G., 2008. Interpreting fMRI data: maps,
modules and dimensions. Nat. Rev. Neurosci. 9, 123–135.Parvizi, J., Jacques, C., Foster, B.L., Withoft, N., Rangarajan, V., Weiner, K.S., Grill-Spector, K.,
2012. Electrical stimulation of human fusiform face-selective regions distorts faceperception. J. Neurosci. 32, 14915–14920.
Peelen, M.V., Downing, P.E., 2007. The neural basis of visual body perception. Nat. Rev.Neurosci. 8, 636–648.
Peelen, M.V., Glaser, B., Vuilleumier, P., Eliez, S., 2009. Differential development of selec-tivity for faces and bodies in the fusiform gyrus. Dev. Sci. 12, F16–F25.
Pinsk, M.A., Arcaro, M., Weiner, K.S., Kalkus, J.F., Inati, S.J., Gross, C.G., Kastner, S., 2009.Neural representations of faces and body parts inmacaque and human cortex: a com-parative FMRI study. J. Neurophysiol. 101, 2581–2600.
Puce, A., Allison, T., Asgari, M., Gore, J.C., McCarthy, G., 1996. Differential sensitivity ofhuman visual cortex to faces, letterstrings, and textures: a functional magnetic reso-nance imaging study. J. Neurosci. 16, 5205–5215.
Rakic, P., 1995. A small step for the cell, a giant leap for mankind: a hypothesis of neocor-tical expansion during evolution. Trends Neurosci. 18, 383–388.
Rakic, P., 2009. Evolution of the neocortex: a perspective from developmental biology.Nat. Rev. Neurosci. 10, 724–735.
Richman, D.P., Stewart, R.M., Hutchinson, J.W., Caviness, V.S., 1975. Mechanical model ofbrain convolutional development. Science 189, 18–21.
Rottschy, C., Eickhoff, S.B., Schleicher, A., Mohlberg, H., Kujovic, M., Zilles, K., Amunts, K.,2007. Ventral visual cortex in humans: cytoarchitectonic mapping of two extrastriateareas. Hum. Brain Mapp. 28, 1045–1059.
Scherf, K.S., Behrmann, M., Humphreys, K., Luna, B., 2007. Visual category-selectivity forfaces, places and objects emerges along different developmental trajectories. Dev.Sci. 10, F15–F30.
Schleicher, A., Amunts, K., Geyer, S., Morosan, P., Zilles, K., 1999. Observer-independentmethod for microstructural parcellation of cerebral cortex: a quantitative approachto cytoarchitectonics. NeuroImage 9, 165–177.
Schleicher, A., Palomero-Gallagher, N., Morosan, P., Eickhoff, S.B., Kowalski, T., de Vos, K.,Amunts, K., Zilles, K., 2005. Quantitative architectural analysis: a new approach tocortical mapping. Anat. Embryol. (Berl) 210, 373–386.
Schultz, R.T., Grelotti, D.J., Klin, A., Kleinman, J., Van der Gaag, C., Marois, R., Skudlarski, P.,2003. The role of the fusiform face area in social cognition: implications for the patho-biology of autism. Philos. Trans. R. Soc. Lond. B Biol. Sci. 358, 415–427.
Sereno, M.I., Lutti, A., Weiskopf, N., Dick, F., 2013. Mapping the human corticalsurface by combining quantitative T1 with retinotopy. Cereb. Cortex 23 (9),2261–2268.
Sowell, E.R., Thompson, P.M., Rex, D., Kornsand, D., Tessner, K.D., Jernigan, T.L., Toga,A.W., 2002. Mapping sulcal pattern asymmetry and local cortical surface graymatter distribution in vivo: maturation in perisylvian cortices. Cereb. Cortex12, 17–26.
Talairach, J., Tournoux, P., 1988. Co-planar stereotaxic atlas of the human brain:3-dimensional proportional system—an approach to cerebral imaging. Thieme,New York.
Tarr, M.J., Gauthier, I., 2000. FFA: a flexible fusiform area for subordinate-level visual pro-cessing automatized by expertise. Nat. Neurosci. 3, 764–769.
Van Essen, D.C., 1997. A tension-based theory of morphogenesis and compact wiring inthe central nervous system. Nature 385, 313–318.
Van Essen, D.C., Glasser, M.F., Dierker, D.L., Harwell, J., Coalson, T., 2012a. Parcellations andhemispheric asymmetries of human cerebral cortex analyzed on surface-basedatlases. Cereb. Cortex 22, 2241–2262.
Van Essen, D.C., Ugurbil, K., Auerbach, E., Barch, D., Behrens, T.E., Bucholz, R., Chang, A.,Chen, L., Corbetta, M., Curtiss, S.W., Della Penna, S., Feinberg, D., Glasser, M.F., Harel,N., Heath, A.C., Larson-Prior, L., Marcus, D., Michalareas, G., Moeller, S., Oostenveld,R., Petersen, S.E., Prior, F., Schlaggar, B.L., Smith, S.M., Snyder, A.Z., Xu, J., Yacoub, E.,2012b. The Human Connectome Project: a data acquisition perspective. NeuroImage62, 2222–2231.
van Kooten, I.A., Palmen, S.J., von Cappeln, P., Steinbusch, H.W., Korr, H., Heinsen, H., Hof,P.R., van Engeland, H., Schmitz, C., 2008. Neurons in the fusiform gyrus are fewer andsmaller in autism. Brain 131, 987–999.
Wagner, A.D., Koutstaal, W., Schacter, D.L., 1999. When encoding yields remembering: in-sights from event-related neuroimaging. Philos. Trans. R. Soc. Lond. B Biol. Sci. 354,1307–1324.
Wandell, B.A., Chial, S., Backus, B.T., 2000. Visualization and measurement of the corticalsurface. J. Cogn. Neurosci. 12, 739–752.
Weiner, K.S., Grill-Spector, K., 2010. Sparsely-distributed organization of face and limbactivations in human ventral temporal cortex. NeuroImage 52, 1559–1573.
Weiner, K.S., Grill-Spector, K., 2011. Not one extrastriate body area: using anatomicallandmarks, hMT+, and visual field maps to parcellate limb-selective activations inhuman lateral occipitotemporal cortex. NeuroImage 56, 2183–2199.
Weiner, K.S., Grill-Spector, K., 2012. The improbable simplicity of the fusiform face area.Trends Cogn. Sci. 16, 251–254.
Weiner, K.S., Grill-Spector, K., 2013. Neural representations of faces and limbs neighbor inhuman high-level visual cortex: evidence for a new organization principle. Psychol.Res. 77, 74–97.
Weiner, K.S., Sayres, R., Vinberg, J., Grill-Spector, K., 2010. fMRI-adaptation and categoryselectivity in human ventral temporal cortex: regional differences across time scales.J. Neurophysiol. 103, 3349–3365.
Yeatman, J.D., Rauschecker, A.M., Wandell, B.A., 2012. Anatomy of the visual word formarea: adjacent cortical circuits and long-range white matter connections. BrainLang. 125 (2), 146–155.
Zilles, K., Schleicher, A., Palomero-Gallagher, N., Amunts, K., 2002. Quantitative anal-ysis of cyto- and receptor architecture of the human brain. In: Toga, A.W.,Mazziotta, J.C. (Eds.), Brain Mapping: The Methods. Academic Press, San Diego,pp. 573–602.
Zilles, K., Palomero-Gallagher, N., Amunts, K., 2013. Development of cortical folding dur-ing evolution and ontogeny. Trends Neurosci. 36, 275–284.
Zimmermann, J., Goebel, R., De Martino, F., van de Moortele, P.F., Feinberg, D., Adriany, G.,Chaimow, D., Shmuel, A., Ugurbil, K., Yacoub, E., 2011. Mapping the organization ofaxis of motion selective features in human area MT using high-field fMRI. PLoS One6, e28716.