The method of fluorescence recovery after photobleaching (FRAP) utilizes the phenomenon of...
28
to measure parameters related to molecule mobility. It was initially designed by Axelrod and coworkers to measure two- dimensional diffusion of membrane-bound molecules (see applications of photobleaching techniques for further application details ). Frequently photobleaching interferes with image acquisition in fluorescence microscopy by fading the fluorescent probes, resulting in a lower signal/noise ratio. However in FRAP experiments, it is used to selectively photobleach a specific area by high intensity laser pulses. Subsequently the kinetics of fluorescence recovery are recorded by sampling images at regular time intervals with low intensity illumination. Closely related to FRAP is f luorescence l oss i n p hotobleaching (FLIP). In FLIP experiments a specified region of the cell is repetitively photobleached and the loss of fluorescence in non- bleached parts of the cell is measured. Another variant of photobleaching techniques is iFRAP (inverse FRAP) where all the fluorescent molecules in a cell except for a small region are bleached . The loss of fluorescence from the unbleached region in the postbleach images is then analyzed. With this technique qualitative information about mobility and equilibration time can be gained. Because of the time needed to bleach large areas, this method is especially suited to analyze the dissociation parameters of molecules which are bound to an immobile structure for several seconds.
-
date post
18-Dec-2015 -
Category
Documents
-
view
230 -
download
0
Transcript of The method of fluorescence recovery after photobleaching (FRAP) utilizes the phenomenon of...

The method of fluorescence recovery after photobleaching (FRAP) utilizes the phenomenon of photobleaching of fluorescent probes to measure parameters related to molecule mobility. It was initially designed by Axelrod and coworkers to measure
two-dimensional diffusion of membrane-bound molecules (see applications of photobleaching techniques for further application details ).
Frequently photobleaching interferes with image acquisition in fluorescence microscopy by fading the fluorescent probes, resulting in a lower
signal/noise ratio. However in FRAP experiments, it is used to selectively photobleach a specific area by high intensity laser pulses. Subsequently the
kinetics of fluorescence recovery are recorded by sampling images at regular time intervals with low intensity illumination.
Closely related to FRAP is fluorescence loss in photobleaching (FLIP). In FLIP experiments a specified region of the cell is repetitively photobleached and the
loss of fluorescence in non-bleached parts of the cell is measured. Another variant of photobleaching techniques is iFRAP (inverse FRAP) where all the fluorescent molecules in a cell except for a small region are bleached . The loss
of fluorescence from the unbleached region in the postbleach images is then analyzed. With this technique qualitative information about mobility and equilibration
time can be gained. Because of the time needed to bleach large areas, this method is especially suited to analyze the dissociation parameters of molecules which are
bound to an immobile structure for several seconds.

How FRAP worksIn unbleached cells fluorescent molecules are in equilibrium. Bleaching a fraction of the total fluorescent molecules in a region of interest (ROI) disturbs this equilibrium. Under optimal conditions the recovery kinetics are dependent only on the mobility (effective diffusion coefficient and binding kinetics to macromolecular structures) of the investigated molecule.Thus by measuring the recovery kinetics, following properties of the molecule can be characterized:•the ratio between mobile and immobile fraction •the effective diffusion coefficient Deff
•the binding time (as well as assembly/disassembly) of proteins to macromolecular structures •continuity of intracellular organelles (FLIP) •formation of protein complexes (resulting in lower Deff)

PhotobleachingAbsorbtion of light by a fluorophore elevates electrons from the ground state to an excited singlet state. Fluorescence arises from the emission of a photon during relaxation to the ground state.The exact mechanism of photobleaching is not known, but it is assumed to be linked to a transition from the excited singlet state to the excited triplet state. The excited triplet state is relatively long-lived and is chemically more reactive. Each fluorophore has different photobleaching-characteristics. For FRAP experiments it is important to choose a dye which bleaches minimally at low illumination power (to prevent photobleaching during image acquisition) but bleaches fast and irreversibly at high illumination power.

According to the Stokes-Einstein equation
the diffusion coefficient D for a particle in a free volume depends on the Boltzmann constant (k), the absolute temperature (T), the viscosity of the solution (), and the hydrodynamic radius (R) of the particle. The mobility of a molecule in the cellular environment is affected by the following parameters:•The size of the molecule:an eightfold increase of the size of a soluble sperical protein decreases D by factor 2. •the viscosity of the cellular environment: e.g. membranes have a much higher viscosity than cytoplasm •protein-protein-interactions and binding to macromolecules can also slow down the diffusion •if flow or active transport is involved in the movement of the probed molecule, the measured movement rate can become significantly higher than the theoretical diffusion rate The diffusion coefficient D of the probed molecule can be measured via the halftime of the recovery (thalf). This coefficient is influenced by the above stated parameters. Therefore this value is often termed as the effective diffusion coefficient (or apparent diffusion coefficient) Deff (in µm2 s-1) and reflects the mean squared displacement explored by the proteins through a random walk over time.Changes of the effective diffusion coefficient, e.g. due to binding to a larger molecule, can be exploited to study the function of the protein of interest. For instance the endonuclease ERCC1/XPF is binding to DNA when damages are induced by UV light resulting in a decreased Deff (Houtsmuller et al. 1999).By performing the FRAP experiment at different temperatures (e.g. 27 and 37 °C) it is possible to determine if energy-dependent processes are involved in the mobility of the investigated molecule. While the difference in molecular diffusion due to a 10 K change in absolute temperature is too small to be resolved by FRAP (D decreases only ~3%, Phair & Misteli 2000), energy-dependent processes are more sensitive to temperature (Hoogstraten et al. 2002).

For qualitative determination of the recovery dynamics, e.g. to compare differences of one molecule at different conditions, a simple exponential equation can be used as a first approximation:
After determination of by fitting the above equation to the recovery curve the corresponding halftime of the recovery can be calculated with the following formula:
If the molecule binds to a slow or immobile macromolecular structure it is very likely that the recovery curve does not fit a single exponential equation. To overcome this problem, a biexponential equation can be used.Depending on the investigated molecule the amount of interaction with other molecules will be variable. For example proteins which associate with relatively immobile cellular structures such as the cytoskeleton have a significantly reduced recovery compared to a freely mobile molecule. Using kinetic modeling the binding characteristics of the examined molecule can determined by the ratio between mobile and immobile fraction.

An idealized plot of a FRAP recovery curve. II: initial intensityI0: intensity at timepoint t0 (first postbleach intensity)I1/2: half recovered intensity (I1/2 = (IE - I0) / 2)IE: endvalue of the recovered intensitythalf: Halftime of recovery corresponding to I1/2 (t1/2 - t0) Mobile fraction Fm = (IE - I0) / (II - I0)Immobile fraction Fi = 1 - Fm

The optimal fluorophore should be bright and stable under low intensity illumination during image acquisition (pre- and postbleach). Under high intensity illumination it should bleach fast and irriversibly. Another prerequisite is that the used fluorophore must not inhibit the function of the investigated molecule.
Regardless of fluorophore, it is important to test it´s photobleaching characteristics under the imaging condition used.
Fluorophores for FRAP-experiments (according to Ellenberg and Rabut):
fluorophore comment
fluorescein and derivatives
probably the most used chemical fluorophore, tends to bleach too easily and photoleaching is partly reversible (Periasamy 1996)
fluorescent proteinsmostly irreversible photobleachingEGFP tends to multimerize at high concentrations

The “classical approach” for FRAP measurements utilizes a widefield epi-fluorescence microscope to monitor the fluorescence intensity during pre- and
postbleach acquisition. For bleaching a laser beam is focused onto a small diffraction limited spot (~1µm) in the region of interest. These systems are not
‘of the shelf’ and have to be custom-build.In principal the standard commercially available confocal laser-scanning microscope (CLSM) equipped with acousto-optical tuneable filter (AOTF) is
suitable for FRAP, iFRAP and FLIP experiments. The AOTF is needed to switch the laser power rapidly between the low intensity imaging and the high
intensity bleaching modes.The higher the diffusion constant of the investigated molecule, the more
imaging speed and laser power is required. Read more about useful confocal equipment for FRAP experiments.

Standard features of typical CLSM necessary for FRAP experiments:AOTF to attenuate the laser power between high intensity illumination for bleaching and low intensity for imaging mode Interactive definition of the bleaching area by regions of interest (ROI) or spots including saving parameters of the ROI(s) or spot(s) for evaluation The software should be as flexible as possible to define prebleach-, bleach- and postbleach-settings either by special routines or by macro-programming, e.g.:
number and frequency of frames scan speed and zoom factor laser intensity (AOTF settings)
Depending on the required resolution and the desired depth of bleaching, different objectives are suitable for FRAP experiments. For homogenous bleaching in z-direction objectives with a lower magnification like a 20x 0.7 NA lens are suitable, but result in a lower resolution. Higher resolution with increased light intensity in the focal plane but incomplete bleaching in z-direction can be achieved using lenses with a high numerical aperture like a 63x 1,4NA objective. The thinner the structure subjected to bleaching the higher the NA should be.

If molecules with rapid kinetics are investigated, advanced features can be necessary for FRAP experiments :higher laser power to bleach faster (to minimize diffusion during bleaching) time optimized FRAP modules (switching delays between bleach and postbleach image aquisition should be minimized) small formats and fast acquisition speed Long-term FRAP-experiments which explore molecules with very slow recovery characteristics also requires additional properties of the imaging system:To correct for laser-fluctuations the laser intensity can be quantified by ‘monitor diodes’ or transmission images. Tracking of the mobile photobleached cells using autofocus routines

There is no universal protocol for FRAP experiments since the design of a FRAP experiment always has to take into account the bleaching and recovery characteristics of the molecule under investigation. The visualized cells should not be affected by high illumination conditions.Therefore the optimal conditions have to be empirically tested for each biological system.The information in this section intends to provide general rules and hints applicable to most photobleaching experiments.One general consideration in FRAP experiments is to minimize the bleaching during acquisition instead of acquiring “nice” images. The data has to be averaged over the selected area anyway to diminish statistical distributed noise.

PreconditionsBefore meaningful FRAP data can be measured the following experiments should be carried out: First when using fluorescent protein constructs the cells should be checked for physiological and morphological alterations compared to control cells. Only cells which are ‘normal’ should be used for further analysis by FRAP.Bleaching characteristics have to be checked in fixed cells to determine bleach rates without movement of the probed molecule
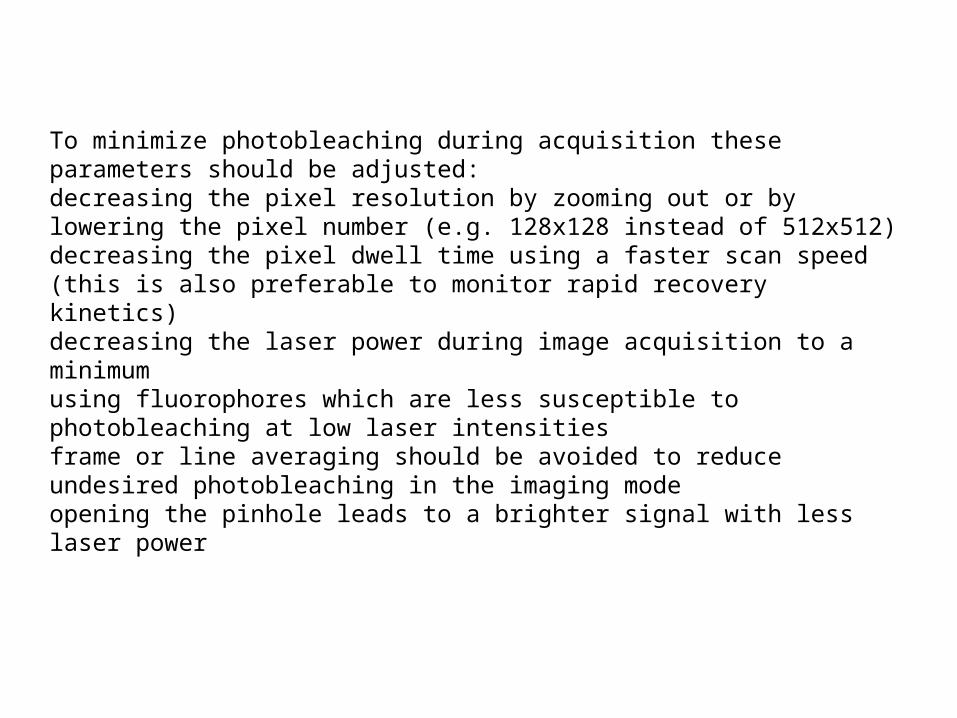
To minimize photobleaching during acquisition these parameters should be adjusted: decreasing the pixel resolution by zooming out or by lowering the pixel number (e.g. 128x128 instead of 512x512) decreasing the pixel dwell time using a faster scan speed (this is also preferable to monitor rapid recovery kinetics) decreasing the laser power during image acquisition to a minimum using fluorophores which are less susceptible to photobleaching at low laser intensities frame or line averaging should be avoided to reduce undesired photobleaching in the imaging mode opening the pinhole leads to a brighter signal with less laser power
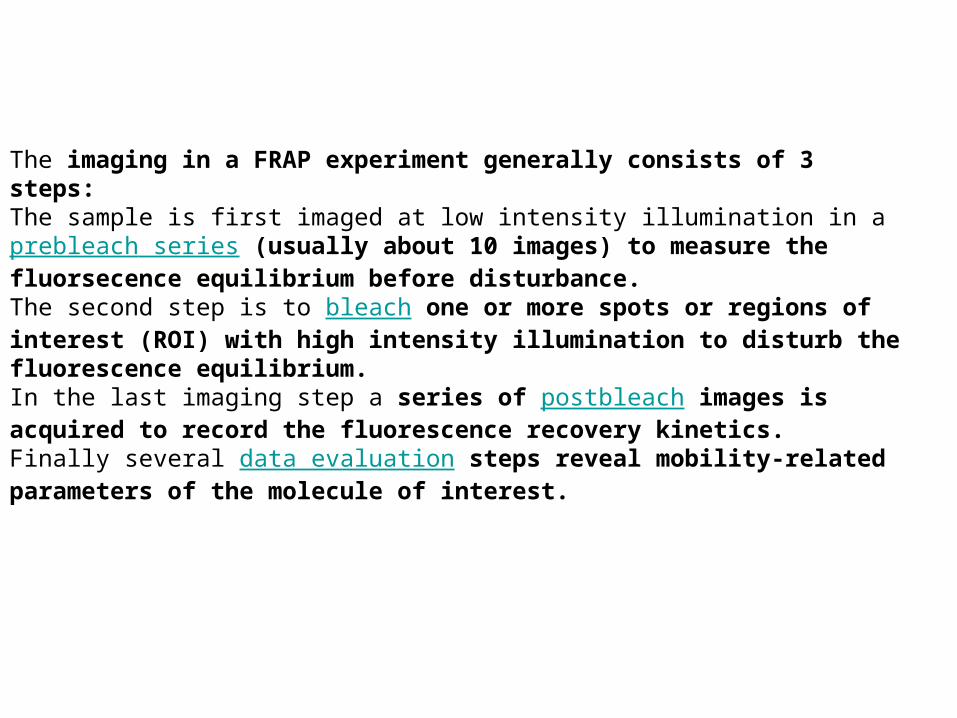
The imaging in a FRAP experiment generally consists of 3 steps:The sample is first imaged at low intensity illumination in a prebleach series (usually about 10 images) to measure the fluorsecence equilibrium before disturbance. The second step is to bleach one or more spots or regions of interest (ROI) with high intensity illumination to disturb the fluorescence equilibrium. In the last imaging step a series of postbleach images is acquired to record the fluorescence recovery kinetics. Finally several data evaluation steps reveal mobility-related parameters of the molecule of interest.

The prebleach series is used to:determine the (total) fluorescence intensity at low intensity illumination prior to bleaching to provide a reference point for fluorescence recovery; typically 3-10 images.(If fluorescent proteins (FP) are imaged with more than 1 image/s a prebleach series of 50-100 images is needed to reach a steady state of FPs in dark states (Weber et al. 1999)).
calculate the fluorescence loss due to acquisition photobleaching
To prevent artefacts from pixel saturation, the maximum intensity (255 in 8-bit images) should be reached only in very few pixels. The offset should be adjusted that the background pixels show grayvalues slightly above zero (otherwise information can be lost). To increase the dynamic range it can be advantageous to employ the 12-bit mode.
In the pre- and postbleach-series laser intensity should be attenuated as low as possible to get a sufficient signal - for FRAP experiments
minimized acquisition photobleaching is more important than ‘nice images’. In the data evaluation step the fluorescence intensity during recovery will be
normalized with the prebleach values.

In the bleaching step one or more spot(s) or region(s) of interest (ROI) are irradiated with high intensity illumination.Ideally the bleaching event should be instantaneous, in practice it should not exceed a tenth of the half time of the recovery. Therefore for analysing rapid kinetics, more powerful lasers as well as time optimized acquisition routines are essential. Parameters that influence the bleaching process:•Laser power: More laser power enables faster bleaching but also can harm the cells. •Zoom: Zooming in increases the effective irradiation of the scanned area. Thus zooming in speeds up the bleaching, but the response time for switching back to the unzoomed imaging mode can delay the acquisition of the postbleach series. Which is especially undesirable when analysing rapid kinetics. •Scan speed: The slower the scan speed the more energy is radiated (longer pixel dwell time) It is important to calibrate the bleached volume for each set of parameters (laser power, objective, zoom, speed, etc.) which is best done using fixed samples. A more precise definition of the bleached volume along the optical axis can be achieved using two-photon excitation.

The postbleach series monitors the dynamics and extent of the fluorescence recovery. The following hints help to improve the accuracy of the recovery detection:•The acquisition frequency should be adjusted to resolve the dynamic range of the recovery with good temporal resolution (rule of thumb: at least 20 data points during the time required for the half of the recovery). •Acquisition photobleaching should be minimized to record the recovery dynamics as precisly as possible. •The ideal postbleach acquisition duration is 10 to 50 times longer than the halftime (Axelrod 1976). In practice initial experiments should be conducted until no noticeable further increase in fluorescence intensity is detected. •When using FPs the imaging frequency should not be altered during an experiment because the fraction of FPs driven into dark states could be altered complicating the analysis of the data.

Depending on the experiment there are several data evaluation steps which have to be carried out before meaningful results can be achieved:1.Alignment of the images (only necessary if the regions of interest moved over time). 2.Fluorescence intensity quantification (obtaining the raw data) 3.Background subtraction 4.Correct for laser fluctuations, photobleaching during acquisition (postbleach) and total fluorescence loss caused by the bleaching step 5.Normalization 6.Mobile/immobile fraction 7.T½ halftime of the equilibration of bleached and unbleached molecules 8.Theoretical models to additionally determine binding characteristics of the analysed molecule

Image AlignmentDuring longer FRAP experiments, e.g. analyzing very slow molecules or molecules
which bind to immobile structures, the bleached ROI can move over time. In order to obtain the right data in these cases it is essential to correct for this
movement by alignment prior to the intensity quantification. Image Alignment can be done with ImageJ TurboReg (freeware) or the commercial tool Autoaligner
(Bitplane AG, Switzerland).

Obtaining the ‘raw data’To determine the “raw FRAP data” the total or average pixel values in the
bleached ROI has to be determined for each timepoint. This can be done with the most confocal operating software (e.g. Zeiss LSM, Leica LCS) or with other image processing software which can handle time series (e.g.
the freeware ImageJ).
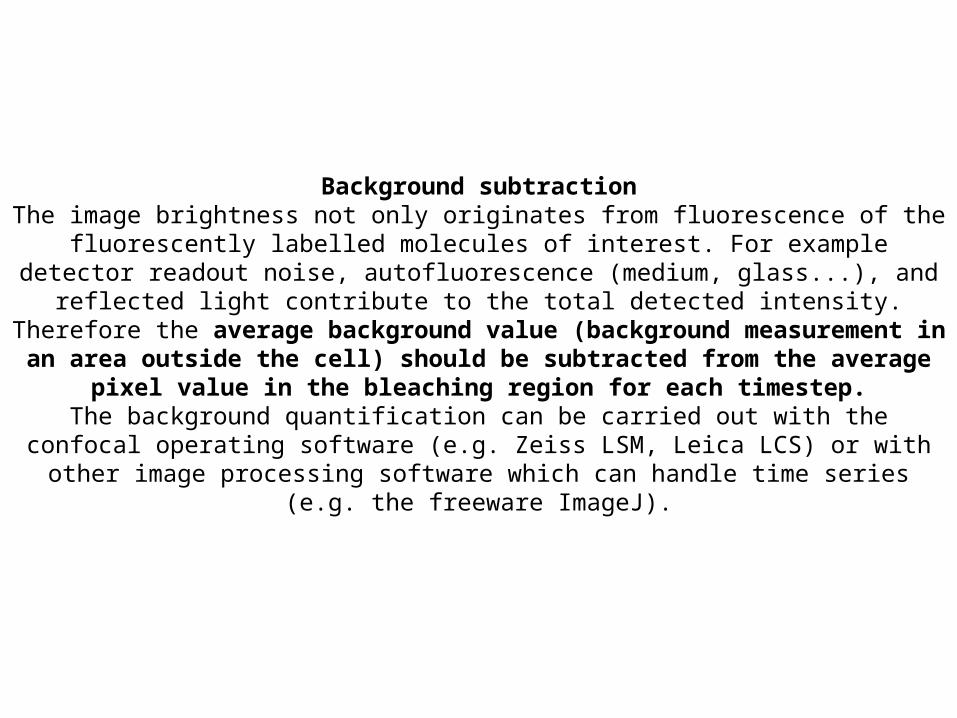
Background subtractionThe image brightness not only originates from fluorescence of the fluorescently labelled molecules of interest. For example detector readout noise, autofluorescence (medium,
glass...), and reflected light contribute to the total detected intensity. Therefore the average background value (background measurement in an area outside the cell)
should be subtracted from the average pixel value in the bleaching region for each timestep.
The background quantification can be carried out with the confocal operating software (e.g. Zeiss LSM, Leica LCS) or with other image processing software which can handle
time series (e.g. the freeware ImageJ).

Further necessary correctionsLaser fluctuations, acquisition photobleaching, and fluorescence loss during
photobleaching leads to intensity changes during image acquisition. In order to obtain data with a linear relationship between the measured fluorescence
intensity and the concentration of fluorescent molecules, the raw data has to be corrected for these changes. One straightforward possibility to do so is to
divide the background subtracted fluorescent measurement by the total cell intensity at each time point.
If this is not possible, e.g. when only a part of the cell can be imaged, alternative correction methods are available:
Acquisition photobleaching can be corrected for by measurement of the fluorescence intensity of neighboring cells, in control experiments or the
prebleach series. The fluorescence measurement at each timepoint can be divided by a function representing the acquisition photobleaching: y(n) = exp(-n/x) with n = image number can be easily determined by measuring the total
fluorescence intensity of an unbleached neighboring cell or the gradual fluorescence decrease in the prebleach or postbleach images.
Laser intensity fluctuations can be compensated for by dividing the fluorescence measurement at each timepoint by the corresponding value of the
laser monitor diode or the averaged intensity of the transmission channel outside the cell (corrected for the nonzero offset of the diode or transmission
detector, respectively).

NormalizationTo compare different experiments usually the fluorescence intensity of the average prebleach intensity is normalized to one by dividing the intensity of all timepoints by the average prebleach intensity. This can be easily done with common spreadsheet
programs.It is also possible to normalize to numbers of fluorophores by using fluorophore
calibration standards (Ellenberg and Rabut).
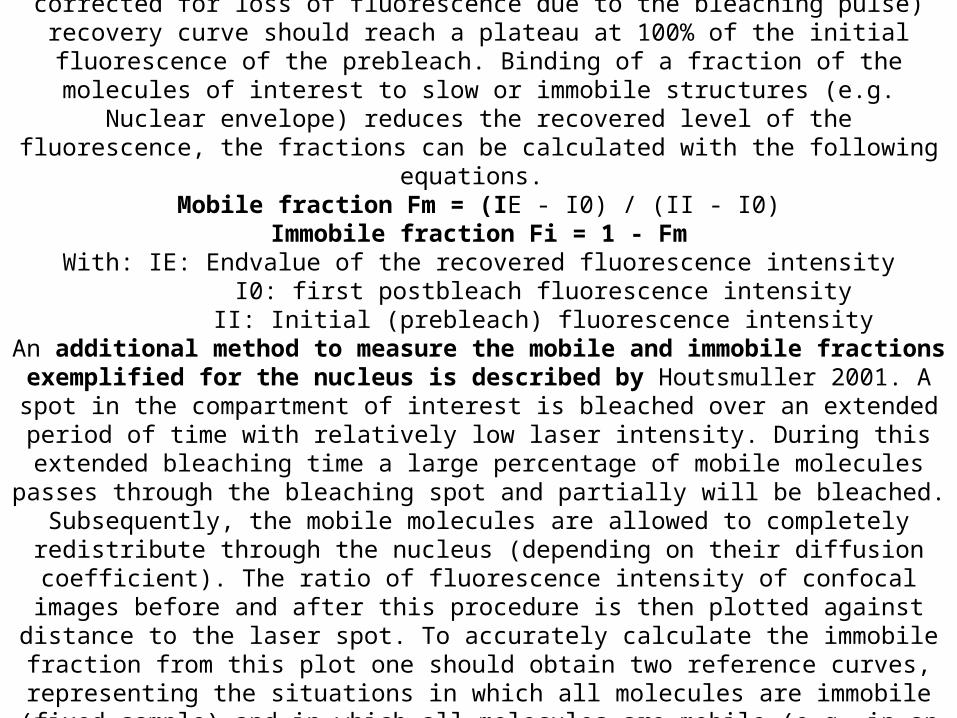
Determination of the Mobile / Immobile FractionIf the whole population of the investigated molecule is freely mobile the fluorescence intensity (background subtracted and corrected for loss of fluorescence due to the
bleaching pulse) recovery curve should reach a plateau at 100% of the initial fluorescence of the prebleach. Binding of a fraction of the molecules of interest to slow
or immobile structures (e.g. Nuclear envelope) reduces the recovered level of the fluorescence, the fractions can be calculated with the following equations.
Mobile fraction Fm = (IE - I0) / (II - I0)Immobile fraction Fi = 1 - Fm
With: IE: Endvalue of the recovered fluorescence intensity I0: first postbleach fluorescence intensity
II: Initial (prebleach) fluorescence intensityAn additional method to measure the mobile and immobile fractions exemplified
for the nucleus is described by Houtsmuller 2001. A spot in the compartment of interest is bleached over an extended period of time with relatively low laser intensity. During this extended bleaching time a large percentage of mobile molecules passes through the bleaching spot and partially will be bleached. Subsequently, the mobile
molecules are allowed to completely redistribute through the nucleus (depending on their diffusion coefficient). The ratio of fluorescence intensity of confocal images before and
after this procedure is then plotted against distance to the laser spot. To accurately calculate the immobile fraction from this plot one should obtain two reference curves, representing the situations in which all molecules are immobile (fixed sample) and in
which all molecules are mobile (e.g. in an inducible system).

Determination of the halftime of the recovery (thalf)
The halftime (thalf) of recovery is the time from the bleach to the timepoint where the fluorescence intensity reaches the half (I1/2) of the final recovered intensity (IE). Fitting the recovery data to an exponential equation can be used to determine thalf:
If the investigated molecule freely diffuses in the cell or compartment a simple exponential formula should be used:
Where A is the endvalue of the recovered intensity (IE), is the fitted parameter and t is the time after the bleaching pulse. After determination of t by fitting the above equation to the recovery curve the corresponding halftime of the recovery can be calculated with the following formula:

If the molecule binds to slow or immobile macromolecular structures or the diffusion is partially hindered it is very likely that the recovery curve cannot fit properly by a single exponential equation. The use of a biexponential equation can often overcome this problem.To compare the halftimes of a molecule under different experimental conditions (e.g. during interphase and mitosis) it is essential to use bleaching regions with the same size, relative position in the cell and scanning parameters.
An idealized plot of a FRAP recovery curve. II: initial intensityI0: intensity at timepoint t0 (first postbleach intensity)I1/2: half recovered intensity corresponding to t1/2 (I1/2 = (IE - I0) / 2)IE: endvalue of the recovered intensitythalf: Halftime of recovery (t1/2 - t0)Mobile fraction Fm = (IE - I0) / (II - I0)Immobile fraction Fi = 1 - Fm

Kinetic modellingFRAP experiments contain information about the diffusional properties of the studied
molecule, but also about it’s binding characteristics. Using kinetic modeling and computer simulation, this information can be extracted and hypotheses can be evaluated
in comparison with experimental data (Phair 2001).The lifetime of different molecular states (e.g. freely diffusing or bound) can be simulated by calculating their rates of formation and decay (e.g. kon and koff). Two kinds of kinetic
models are used by cell biologists for this purpose:Compartmental model:
Biological processes are described by a finite number of compartments that contain a chemical species at a cellular location. Each compartment is defined as “well mixed” (the dynamics are not diffusion limited). The crossover of molecules between compartments represents exchange processes between different places
(e.g. cytoplasm and ER), chemical states (e.g. phosphorylation) or chemical interactions (e.g. binding to receptormolecules).
The transfer rates can be determined by fitting to best match the experimental data. Time is the only variable in a compartmental model.
Spatial model:The cell is divided into a number of spatial elements. In each element the
investigated molecule can transfer between different molecular states. Additionally these different molecular states can exchange with neighboring
elements by diffusion.

Programs for kinetic modelling
Program Link Comment
SAAM II www.saam.com Easy compartmental model setup
Berkeley Madonna
www.berkeleymadonna.com
compartmental model
Mathlab www.mathworks.com
Good graphic output possibilities
Gepasi www.gepasi.org Spatial modelFreeware
Virtual Cell www.nrcam.uchc.edu
Easy way to write spatial modelsfreeware (academical use)
WinSAAM www.winsaam.com freeware