
The mechanisms of plaster drying -...
20
1 The mechanisms of plaster drying M. D. Seck a,b , M. Van Landeghem b , P. Faure a , S. Rodts a , R. Combes c , P. Cavalie b , E. Keita a , P. Coussot a a Université Paris-Est, Laboratoire Navier, ENPC-IFSTTAR-CNRS, Champs-sur-Marne, France b Saint-Gobain Recherche, Aubervilliers, France c Laboratoire des Géomatériaux, Université de Marne La Vallée, Marne la Vallée, France Abstract: We show that the drying rate of plaster pastes is significantly lower than that expected for a pure liquid evaporating from a simple homogeneous porous medium. This effect is enhanced by the air flow velocity and the initial solid/water ratio. Further tests under various conditions and with the help of additional techniques (MRI, ESEM, Microtomography) for measuring the drying rate and local characteristics (water content, porosity) prove that this effect is due to the crystallization of gypsum ions below the sample free surface, which creates a dry region and decreases the drying rate by increasing the length of the path the vapor has to follow before reaching the free surface. 1. Introduction To obtain the plasterboards so useful for modern constructions, there are two important phenomena that must take place: hydration, through which plaster paste passes from a pasty state to a solid state, and drying, through which the excess of the mixing water is removed. The solid plaster is obtained from the hydration of the hemihydrate (CaSO4,1/2H2O) [1-4], which can be briefly described as the dissolution of the hemihydrate followed by the precipitation of gypsum crystals. This chemical reaction basically takes about 40 min without accelerators [5]. Since the stoichiometric water-to- plaster ratio is 0.186 whereas the ratio generally used in gypsum industry lies between 0.6 and 1, i.e. it is much higher than 0.186, there is a significant excess of water at the end of the reaction. This excess of water must be removed from the material, an operation which requires a lot of energy. Understanding the drying processes in plaster pastes should contribute to develop more efficient drying techniques or procedures. In manufacture, the residual water is removed by heating in a dry oven, by exposure to a convective air flow [6] or by the combination of both of these technics. Here we will focus on the case of convective air flow. The drying characteristics of plasters is not very much documented. Existing knowledge essentially concerns materials already in solid state which are imbibed then dried and tends to suggest [7] that as long as pure water is used such materials exhibit drying properties close to usual simple homogeneous porous media. Let us here recall the general scheme concerning drying of simple homogeneous porous media [8-9] can serve as a reference in order to appreciate and even understand the origins of the possible differences observed with real materials. During drying simple materials exhibit a first regime, called the CRP (Constant Rate Period), during which the drying rate is approximately constant. This period may last until the saturation has reached values as low as 20 or 10 %. During this period the saturation remains uniform in the material and the evaporation occurs from the upper liquid films very close to the free surface of the sample, while the liquid is drained by capillary effects
Transcript of The mechanisms of plaster drying -...
1
The mechanisms of plaster drying
M. D. Secka,b, M. Van Landeghemb, P. Faurea, S. Rodtsa, R. Combesc, P. Cavalieb, E. Keitaa, P.
Coussota
a Université Paris-Est, Laboratoire Navier, ENPC-IFSTTAR-CNRS, Champs-sur-Marne, France
bSaint-Gobain Recherche, Aubervilliers, France
c Laboratoire des Géomatériaux, Université de Marne La Vallée, Marne la Vallée, France
Abstract: We show that the drying rate of plaster pastes is significantly lower than that expected for
a pure liquid evaporating from a simple homogeneous porous medium. This effect is enhanced by the
air flow velocity and the initial solid/water ratio. Further tests under various conditions and with the
help of additional techniques (MRI, ESEM, Microtomography) for measuring the drying rate and
local characteristics (water content, porosity) prove that this effect is due to the crystallization of
gypsum ions below the sample free surface, which creates a dry region and decreases the drying rate
by increasing the length of the path the vapor has to follow before reaching the free surface.
1. Introduction
To obtain the plasterboards so useful for modern constructions, there are two important phenomena
that must take place: hydration, through which plaster paste passes from a pasty state to a solid state,
and drying, through which the excess of the mixing water is removed. The solid plaster is obtained
from the hydration of the hemihydrate (CaSO4,1/2H2O) [1-4], which can be briefly described as the
dissolution of the hemihydrate followed by the precipitation of gypsum crystals. This chemical
reaction basically takes about 40 min without accelerators [5]. Since the stoichiometric water-to-
plaster ratio is 0.186 whereas the ratio generally used in gypsum industry lies between 0.6 and 1, i.e.
it is much higher than 0.186, there is a significant excess of water at the end of the reaction. This
excess of water must be removed from the material, an operation which requires a lot of energy.
Understanding the drying processes in plaster pastes should contribute to develop more efficient
drying techniques or procedures. In manufacture, the residual water is removed by heating in a dry
oven, by exposure to a convective air flow [6] or by the combination of both of these technics. Here
we will focus on the case of convective air flow.
The drying characteristics of plasters is not very much documented. Existing knowledge essentially
concerns materials already in solid state which are imbibed then dried and tends to suggest [7] that as
long as pure water is used such materials exhibit drying properties close to usual simple homogeneous
porous media. Let us here recall the general scheme concerning drying of simple homogeneous
porous media [8-9] can serve as a reference in order to appreciate and even understand the origins of
the possible differences observed with real materials. During drying simple materials exhibit a first
regime, called the CRP (Constant Rate Period), during which the drying rate is approximately
constant. This period may last until the saturation has reached values as low as 20 or 10 %. During
this period the saturation remains uniform in the material and the evaporation occurs from the upper
liquid films very close to the free surface of the sample, while the liquid is drained by capillary effects

2
through the film network throughout the sample. Then the drying rate starts to decrease significantly,
this is the Falling Rate Period (FRP). In that regime the liquid flow driven by basic capillary effects
is unable to provide liquid at a sufficient rate at the sample free surface, so that a thin dry region forms
in this region which lowers the drying rate (since now the vapor has to diffuse through this region
before reaching the sample free surface). The size of this dry region slightly increases during this
regime. Finally a last regime takes place when the dry region now increases widely because there is
no longer any possibility for the liquid to be drained towards the sample free surface. Besides the
evolutions of the moisture and temperature distribution in a heated plaster have been studied in details
with the help of NMR technique [10] but it is not clear how these results can help understanding the
drying of plaster under a convective flow at ambient temperature.
A specific aspect has been studied in more details in recent years, namely the transport of salts during
drying of solid plaster samples. It has been shown that salts are transported towards the free surface
and then can either crystallize inside the plaster or move to the substrate [7]. It was also suggested
that this salt crystallisation leads to the formation of a structure inside the plaster, whose
characteristics depends on the drying rate and in turn impacts the drying rate [11]. The impact of
transport and crystallization of salts (sometimes leading to efflorescence) on the drying rate has also
been observed with various other porous media: glass beads [12], fired-clay [13], stones [14], .
As far as we know the drying characteristics of plaster pastes just after their preparation has not been
studied so far whereas it is a critical step of the process of plasterboard production. Previous studies
concerning plaster properties during its preparation focused on the structure evolution in time, in
particular with the help of NMR, showing that the pore distribution evolves as a result of hydration
[15-17]. It is likely that some of the above mentioned effects play a role on the evolution in time of
the drying rate and the water distribution, but the relative importance of these effects has still to be
explored.
Here we focus on the drying characteristics (i.e. the drying rate evolution in time) just after the
material preparation. We first describe our materials and methods (Section 2). Then we look at the
specific characteristics of the drying curves as a function of different experimental conditions or
material properties (see Section 3). Considering the original trends exhibited by these curves with
regards to simple porous systems we then look at the evolution of the local characteristics (water
content, structure) inside the materials with the help of Magnetic Resonance Imaging, Electron
Microscopy and X-Ray Micro-tomography (see Section 4). We finally conclude on the physical
processes explaining the specific drying characteristics of such materials (see Section 5).
2. Materials and methods
2.1 Materials
We used a commercial α-plaster (Saint-Gobain Recherche, France) with a purity higher than 95%
wt, a specific surface of 7500 g/m² (measured with the Blaine air permeability test), and a grain
size between 10 and 20 m. The impurities are mainly clay (colloidal) particles.

3
Our plaster paste samples are prepared according to a well-defined mixing protocol [17]. The plaster
powder is sprinkled on water for 30 seconds. The mixture is then left at rest for 1 minute to get a good
contact between water and solid particles, and hand-mixed for 30 s by helical movements (in order
to ensure a homogeneous mixing, in particular avoid any stagnation points), then left at rest and
mixed again for 30 s. Note that the exact mixing process may have an impact on the final
structure but this aspect is out of the scope of this study which focuses on a given mixing process.
The initial water to powder ratio (w/p), i.e. the ratio of the mass of water to the mass of powder was
varied in the range [0.5-0.9] in order to show up an eventual impact of the initial water content. We
also tested the case w/p=1 but a significant sedimentation was observed at the end of preparation so
that we cannot consider that we effectively have this concentration in the sample. The plaster pastes
were finally poured into a cylindrical container (diameter and height either equal to 54 and 12 mm
(cylinder A) or 35 and 40 mm (cylinder B)) just at the end of the mixing protocol just before (i.e.
initial time) and immediately submitted to air flow.
We also carried out drying tests with bead packings filled with distilled water. Glass beads were
purchased from CVP Abrasif & Broyage (France) with a diameter in the range: 45-90 µm. These glass
beads were used without specific cleaning. Their grain size distribution in this range was shown to be
essentially a peak around a mean value ( 65 µm). The water was mixed in a container with a certain
amount of beads until obtaining a saturated viscous paste. Then this paste was poured in the vessel as
above, with a slight vibration until filling the vessel. The sample was then vibrated in order to further
compact the beads and remove air bubbles.
2.2 Drying tests
To dry the samples a stream of dehydrated air (relative humidity < 1%) at ambient temperature (
1 C 23 ) was blown through a long channel to get a homogeneous velocity before reaching the
sample. The air flux was imposed through this rectangular conduit of 60 x 3 mm² section and the
sample free surface was set up through a hole of one large channel side in the continuity of the channel
wall. Thus only the top free surface of the sample was exposed to air flow, and evaporation
could not take place from the container walls. The velocity could be changed by varying the
pressure drop and measured with a flowmeter. At the same time the sample is set up on a balance and
its mass is followed in time and recorded on a computer. The time interval between each measurement
is 5 min.
To analyse properly such experiments it is critical to take into account that just after sample
preparation both hydration and drying processes start to occur. This implies that a part of water is lost
through chemical reaction and the solid porous structure evolves in time. In order to follow strictly
the evaporated mass of water we consider the current mass (at a time t after the experiment start up)
loss from the initial time: )(tM . Moreover we computed the apparent current saturation )(t as
MtMM )( where M is the maximum mass loss obtained after complete drying, which
was measured after an additional drying, following the end of each test, during one day at 45°C. In
the absence of hydration effects would be the usual effective saturation, i.e. the ratio of water to
pore volumes. We will see below that this is the case at a relatively short time after the beginning of
drying. As a consequence in the following we will simply describe this as the saturation.

4
In the present work we will particularly study the rate of drying, which can be related to the time
derivative of the saturation [8]. In practice, computing dttd )( from mass vs time data is not so
straightforward because of the data scattering at different time scales. In order to solve this problem
we first smoothed the saturation data by mean of a moving time average [18] on three data points
(corresponding to fifteen minutes of measurements). This gives us results with an uncertainty around
15%. The finite derivative of these data with respect to time provides the current drying rate but the
resulting scattering is again smoothed by a moving time average on three data.
In fact all our data will be represented in terms of the saturation as a function of the “rescaled time”,
i.e. the time divided by the evaporable water mass ( M ). This representation allows a relevant
comparison of different drying procedures, in particular two different systems drying at the same
constant rate would exhibit the same saturation vs rescaled time curve whatever their evaporable
water mass. Moreover it makes it possible to remove, for two a priori similar tests, the additional
fluctuation due to slight differences in the effective water volume. The differences we observe
nevertheless after this rescaling can finally be regarded as reflecting a change in the drying process.
As a consequence we will define the drying rate as dttdM )( .
2.3 NMR measurements
The NMR experiments were performed using a Bruker MINISPEC spectrometer, operating at a
proton resonance frequency of 20 MHz at 0.5 T. The temperature within the NMR apparatus was set
to 25 °C. The transverse relaxation T2 decays were performed thanks to the Carr-Purcell-Meiboom-
Gill (CPMG) sequence. Measurements are done with a recycle delay of 2 s, with 8 scans, with 2000
Pi pulses and pulse separation TE/2 = 250 µs. The acquisition time is about 5 minutes. The relaxation
time distributions were extracted using a home-made numerical Laplace inversion algorithm [19].
For these tests the plaster paste was poured into a 10 x10 mm (diameter x height) glass tube just at
the end of the mixing protocol, then NMR acquisition starts. Each NMR acquisition gives direct
information on the quantity of mobile water inside the sample and the T2 distribution. Thus
this is a straightforward to follow the progress of a chemical reaction in a sample.
2.4 MRI measurements
MRI measurements are a set of non-destructive measurements in order to follow in time the spatial
distribution of moisture in our drying plaster. To induce drying inside the MRI coil a home-built
installation was inserted in the magnet, allowing a dry air (relative humidity < 1%) at ambient
temperature (25°C) to be blown upon the 35 x 40 mm cylindrical sample, while MRI measurements
were performed. The whole set-up is inserted vertically in the channel of a vertical proton MRI
(Magnetic Resonance Imaging) system (Avance 24/80 DBX by Bruker, 0.5T superconducting
magnet by Oxford, 20cm inner diameter). The distribution of apparent water along the sample axis
was measured using a one-dimensional double spin-echo sequence (two first echoes of the so-called
Carr-Purcell-Meibom-Gill sequence [20-21] with exponential extrapolation to compensate spin-spin
relaxation). Each measured value of this distribution corresponds to the total amount of water in a
thin cross-sectional layer situated at a given position along the sample vertical axis.

5
2.5 SEM imaging
For SEM imaging, we used an environmental scanning electron microscope (Electroscan E3) which
provides an image of high spatial resolution. The advantage of ESEM with respect to conventional
SEM is the possibility to analyse our samples without any prior preparation possibly altering some
properties of the material and without high vacuum. It consists, briefly, of generating an electron
beam by an electron cathode and electromagnetic lenses and finally swept it across the surface of the
observed sample. Then the electronic signal generated from the sample is collected with the help of
a pole piece (5 cm diameter) and a conical detector situated above the sample. The amplification of
the electronic signal is done by the presence of water molecules in between the sample and the conical
detector. The detected signal is principally constituted of the secondary electrons which gives a good
topographic contrast. From now on we are able to visualize or to record the images. The resolution
we can get from this type of measurement is less than 5 nm.
2.6 X-ray microtography imaging
The X-ray micro-tomography is a nondestructive technique to characterize material microstructure in
three dimensions. It is suited for non-destructively imaging structures with features ranging from few
microns to few millimiters thanks to the large penetration depth of x-ray. X-ray absorption varies
between materials and provides contrast on images between elements. The grey levels of each
projection are linked up to the absorption coefficient and to the thickness of the object. The 3D
volumes of objects are reconstructed, via a reconstruction algorithm, from a serie of 2D projections
collected at various angular position. Interior of the object can then be sliced numerically. This 3D
imaging gives us a great understanding of the 3D structure and morphology of our material. For our
measurements we used an easyTom from RxSolutions. It is equipped with an X-ray microfocus
source with a spot size of 5 µm. The samples are reshaped on a 10 mm diameter cylinder and 5 to 10
millimeters are imaged in the z-direction. The volume element is a cube of 5.75 µm edge.
3. Results and discussion
3.1 General drying characteristics
A typical drying curve, i.e. saturation vs time data, obtained for a plaster paste under our experimental
conditions is shown in Figure 1, along with the drying rate (see inset of Figure 1). The saturation
decrease is fast at the beginning then it progressively slows down, as illustrated by the computed
drying rate which continuously decreases. The data obtained from different samples prepared then
dried under the same conditions are reproducible within 20% on the water mass loss. The uncertainty
on the drying rate is finally also around 20% (see inset of Figure 1).
Note that direct inspection of our samples at the end of the drying tests showed that the free surface
did not evolve in time, i.e. no efflorescence could be observed.
In the following paragraphs we will review the impact of several parameters on which the drying rate
may depend, according to what we know from ideal porous media [8].

6
0.0 0.5 1.0
0.2
0.4
0.6
0.8
1.0
10-2
10-1
100
10-1
100
101
Dry
ing r
ate
(g.h
-1)
Saturation
Rescaled time (h.g-1)
Satu
ratio
n
Figure 1: Drying tests with plaster paste samples with the same powder ratio (w/p=0.8) (air flow
velocity: 6.1 m/s; cylinder A): water saturation as a function of rescaled time (from to bottom:
squares, circles and crosses). The inset shows the corresponding drying rate as a function of
saturation.
Impact of hydration effects
Since we are dealing with materials in which a hydration reaction occurs it is natural to first suspect
this reaction to play a role in the delaying drying effect. To test this assumption we performed NMR
measurements from which we get the NMR signal and the T2 distribution in time (see Figure 2), on a
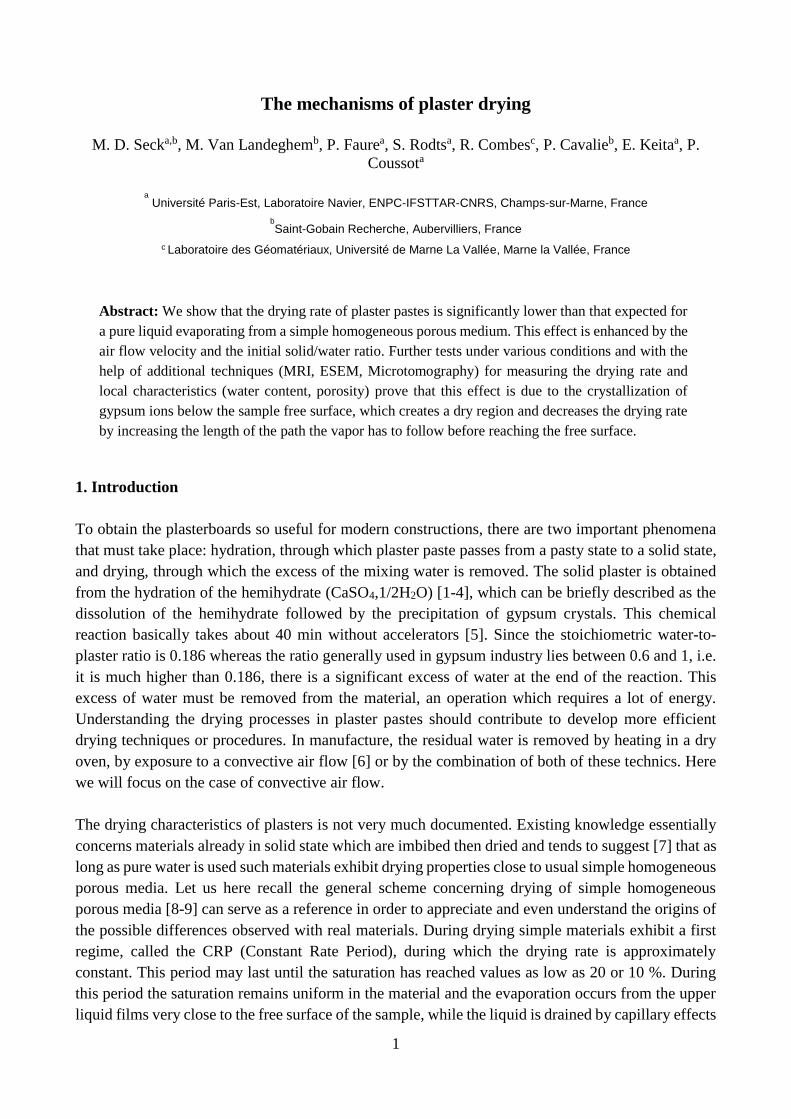
plaster paste sample set up in a close container so that only hydration effects can take place. We can
see that the NMR signal (see Figure 2a) decreases to about 20% of its initial value during the first
forty minutes of a test and then remains constant. Since this signal is directly proportional to the
quantity of mobile water [5] this result means that the hydration reaction consumes about 20% of
water (which is consistent with the stoichiometric ratio), which then behaves as a solid, and this
process lasts about 40 min. Since in our tests the evaporation of most of the water contained in the
samples generally takes tens of hours hydration effects cannot play a major role in the liquid water
variations during this process.
7
0 50 1000,7
0,8
0,9
1,0
No
rma
lize
d N
MR
Sig
na
l
Time (min)
50
60
70
80
90
Tra
nsve
rse
re
laxa
tio
n t
ime
T2(m
s)
Figure 2: NMR signal (normalized by its first value) (squares) and relaxation time (T2) (circles)
as a function of time in a plaster paste (w/p=0.8) during hydration.
Moreover the T2 distribution initially exhibits a main peak situated around 60 ms which evolves
towards about 85 ms and remains fixed at this value after 30 min. This relaxation time depends on
the ratio of the volume of free liquid water to the area of the water-solid interface with a factor
depending on the surface relaxivity [22-23]. For example this volume to surface ratio is proportional
to radius in the case of uniform spherical pores. Thus the T2 values can be considered as reflecting
characteristic pore sizes in the material. Our data show that the pore structure is fixed after about 30
min.
Impact of admixtures
In order to go further in the analysis of a possible interplay between drying characteristics and
hydration reaction, we carried out tests with two types of accelerator added to the mixture. We can
see that these admixtures have no impact on the drying curve (see Figure 3).
We can conclude that there is no direct impact of hydration on the water loss measurement in time
and the porous structure is fixed after a relatively short time of drying, which means that our drying
data essentially reflects the evaporation from a porous medium of given structure.

8
0 1 20.0
0.2
0.4
0.6
0.8
1.0
10-2
10-1
100
10-1
100
Dry
ing
ra
te (
g.h
-1)
Saturation
Figure 3: Water saturation as a function of rescaled time during drying tests of a plaster paste
(w/p=0.8, cylinder A, air flow velocity: -1m.s 9.7 ) prepared without admixtures (squares), or with
admixtures: (crosses) ground gypsum, (stars) potassium sulfate. The inset shows the
corresponding drying rate.
Impact of initial water content
The impact of the initial water concentration may be seen in Figure 4. The drying curves and the
drying rate curves superimpose down to a saturation around 80%. Then we have a different evolution
of the curves which tend to separate as the saturation decreases down to a few tenths of percent and
finally they seem to tend to a plateau (in fact a slowly decreasing curve) whose level increases when
w/p decreases, meaning that the rescaled time for complete drying increases dramatically at low w/p.
On the contrary there seems to be a kind a saturation of this effect at high w/p, since the distance
between the drying curves decreases when w/p increases and finally the curves obtained for w/p equal
to 0.8 and to 0.9 superimpose. The fact that at such w/p values we approach the drying curve of a
simple bead packing suggests that when the effect observed above tends to disappear for sufficiently
large pore sizes.
9
0.0 0.5 1.0 1.5
0.0
0.5
1.0
10-1
100
10-1
100
Dry
ing r
ate
(g.h
-1)
Saturation
Regime 1
Regime 2
Sa
tura
tio
n
Normalised time (h.g-1)
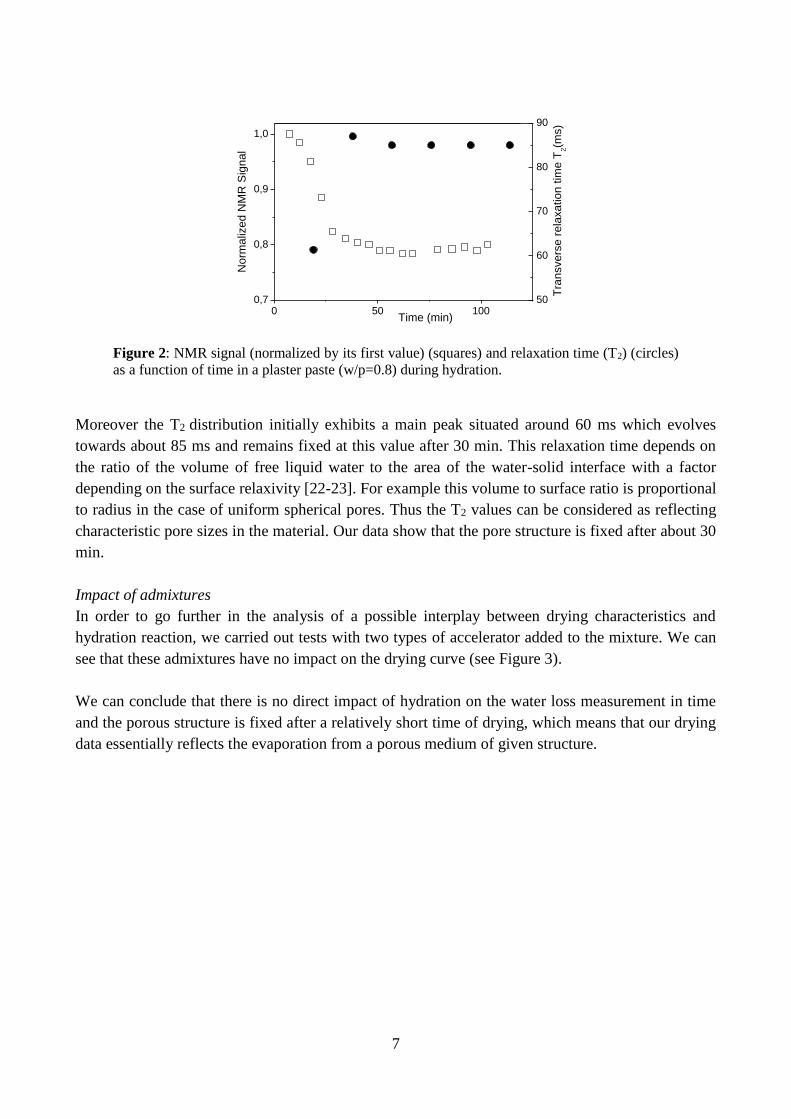
Figure 4: Water saturation as a function of rescaled time during drying tests with plaster pastes
for different water to powder ratios (w/p) and a bead packing (diamonds) (air flow velocity: 6.1
m/s; cylinder A): 0.5 (crosses), 0.6 (triangles), 0.7 (circles), 0.8 (squares), 0.9 (stars). The inset
shows the corresponding drying rates. The two main regimes of drying (see text) are identified
by dotted lines.
Looking at the drying rate curves we get a deeper insight in the processes. First we can observe a
systematic drop in drying rate in a first stage (until a saturation of about 80%) while the drying rate
for a simple bead packing remains almost constant until a saturation of about 15%. On the contrary,
for plaster pastes, for a saturation between about 80 and 15% the drying rate significantly decreases
and this phenomenon is more marked for smaller w/p. After this period we enter another regime
where the drying rate more strongly decreases. However this decrease is similar for the different
concentrations: the drying rate curves follow curve of similar shape starting at different points
corresponding to the end of the previous regime.
These results show that there is an effect occurring during plaster drying which tends to lower the
drying rate below that observed for a simple porous medium. This effect is more marked for smaller
initial water content, i.e. when the permeability is smaller. However this effect apparently does not
play any role in the regime 2 of drying where it is generally assumed that the drying rate is controlled
by the flow in the thin liquid films through the material, and thus by the permeability in the bulk.
Impact of sample height
We carried out experiments with samples of different heights and the same boundary conditions (air
flow). It appears that the resulting drying curves (see Figure 5), after a short period at the same rate,
then significantly separate from each other. Even after rescaling the time by the water amount the
saturation decreases more slowly for higher sample height. The drying rate curves have similar
relative evolutions. The most unexpected effect is the dramatic decrease of the drying rate which

10
occurs when the saturation is between 0.9 and 0.6 for the largest heights. This shows that the effect
of slowing down drying increases when the amount of water to be evaporated increases.
0 1 2 3 4 5 60.0
0.5
1.0
10-1
100
10-1
100
Dry
ing r
ate
(g.h
-1)
Saturation
Satu
ratio
n
Rescaled time (h.g-1)
Figure 5: Water saturation as a function of rescaled time during drying tests with a plaster paste
(w/p=0.9, air flow velocity: 6.1 m/s) for different cylinder heights: (crosses) 1.2 cm, (stars) 2.2
cm, (circles) 4 cm. The inset shows the corresponding drying rates.
Impact of the air flow velocity
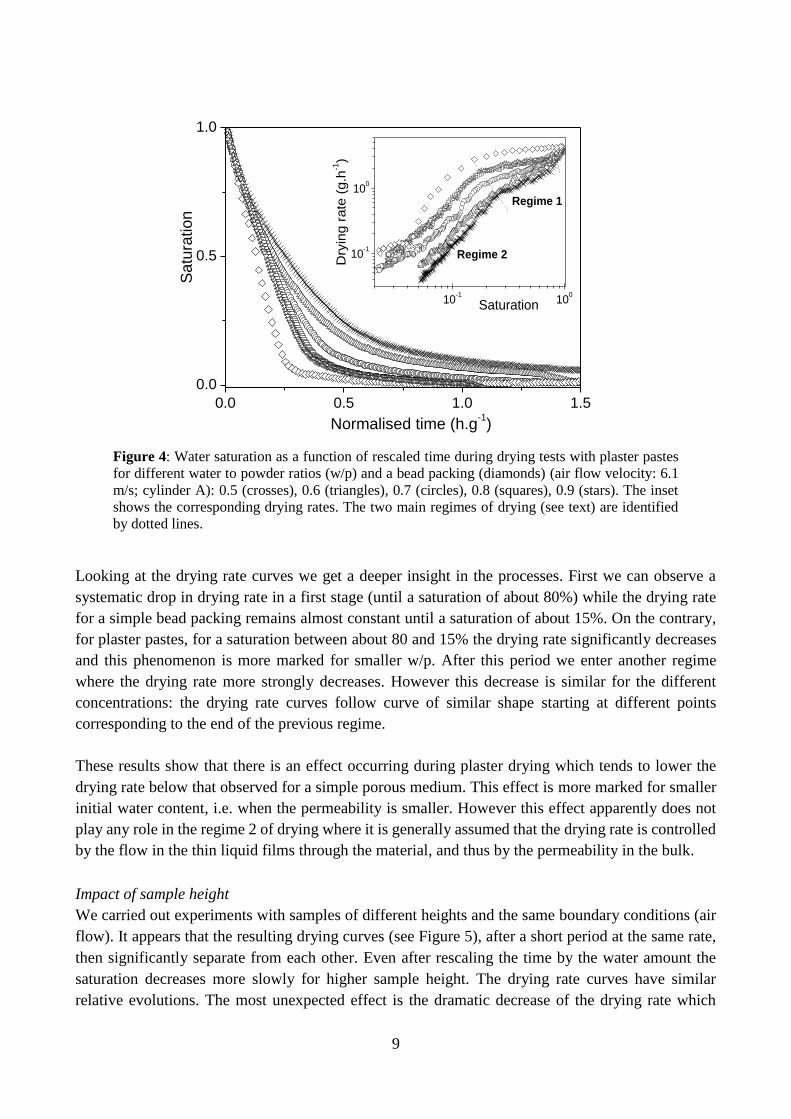
The drying curves obtained for different velocities of the air flux are shown in Figure 6a. Obviously
the drying rate increases for increasing velocities. This is clear during the first regime of drying (see
Figure 6b). Actually, as the velocity decreases the shape of the drying curve turns from the typical
aspect discussed above, i.e. with a significant decrease of the drying rate in the first regime, to a very
different shape in which the drying rate is almost constant in the first regime. Thus, apparently the
slowing drying effect is increased by the air flow velocity.
Then the drying rate curves all follow the same curve in regime 2 whatever the velocity. This confirms
our previous observation that in the regime for which the drying is a priori governed by internal liquid
flow through the bulk the drying rate is independent of the effects occurring during the first regime.
Note that for some curves there is a kind of step in the last period of drying (see Figure 6a), i.e. a
rapid decrease of the mass in a short time. This effect is even clearer in the drying rate curves (see
Figure 6b) since it takes the form of a jump in a limited range of time. It is worth emphasizing that
this new effect is not clearly related to the drying conditions, it seems to occur in a random way, and
sometimes does not even occur. Such an effect is likely related to some local breakage of the structure.
11
0 1 2 3 40.0
0.5
1.0
10-2
10-1
100
10-1
100
Dry
ing r
ate
(g/h
)
Saturation
Regime 1
Regime 2
Sa
tura
tio
n
Rescaled time (h.g-1)
Figure 6: Water saturation as a function of rescaled time during drying tests of a plaster paste
(w/p=0.6, cylinder A) for different air flow velocities: (diamonds) no air flow, (circles) -1m.s 2.1
, (squares) -1m.s 5.2 , (stars) -1m.s .44 , (triangles) -1m.s .16 , (crosses) -1m.s .37 . The inset shows
the corresponding drying rates. The two main regimes of drying (see text) are identified by dotted
lines.
4. Analysis of the slowing down drying effect
We have seen that there is an effect of delaying of the drying process with a plaster paste which occurs
essentially during the regime 1 of drying. In this regime it is generally assumed for simple porous
media that drying is controlled by the evaporation in a region close to the free surface while the liquid
is drained by capillary effects towards the free surface. We also observed above that this delaying
effect does not seem to affect the regime 2 of drying which is generally assumed to be controlled by
the liquid flow throughout the sample bulk. These observations suggest that the delaying effect is due
to a physical phenomenon occurring around the free surface of the sample, which would thus affects
regime 1 but not regime 2. In this section we attempt to further analyze the origin of this effect with
the help of tests providing information on some physical characteristics at a local scale.
4.1 Impact of the liquid solution
The water solution inside the drying plaster is far from being pure. In particular the hydration reaction
occurs because the suspension of plaster is saturated in gypsum. This means that just at the end of the
reaction the solution is still saturated otherwise the reaction would not occur. Thus the remaining
solution, which will then evaporate during sample drying, is initially saturated with gypsum.

12
To test the impact of the presence of gypsum in water it would be necessary to remove the remaining
gypsum at the end of the hydration phase, which does not seem possible. Instead we consider a dry
solid plaster sample that we fill again either with a saturated gypsum water solution or with distilled
water. We can then compare the drying characteristics of such materials (see Figure 7). First we can
remark that the slowing down effect in drying still occurs for a re-imbibed plaster: the drying curve
has an aspect similar to that observed for the same type of sample for drying after sample preparation.
Moreover the plaster sample filled with distilled water dries faster than the one filled with saturated
gypsum solution. Note however that both samples exhibit the same drop in drying rate (see inset
of Figure 7) at the very beginning of drying. Therefore the slowing down drying effect likely comes
from the nature of the liquid solution, and in particular from the presence of gypsum ions. The exact
physical effect which occurs is still unclear at this stage. To have more information we carried out
tests intended to provide a view of the structure evolution at a local scale.
0.0 0.5 1.00.0
0.5
1.0
10-1
100
10-1
100
Dry
ing r
ate
(g.h
-1)
Saturation
Sa
tura
tio
n
Rescaled time (h.g-1)
Figure 7: Water saturation as a function of rescaled time during drying tests of a plaster paste
(w/p=0.8, cylinder A, air flow velocity: -1m.s 9.7 ) filled with gypsum solution (crosses) or with
distilled water (circles). The inset shows the corresponding drying rate.
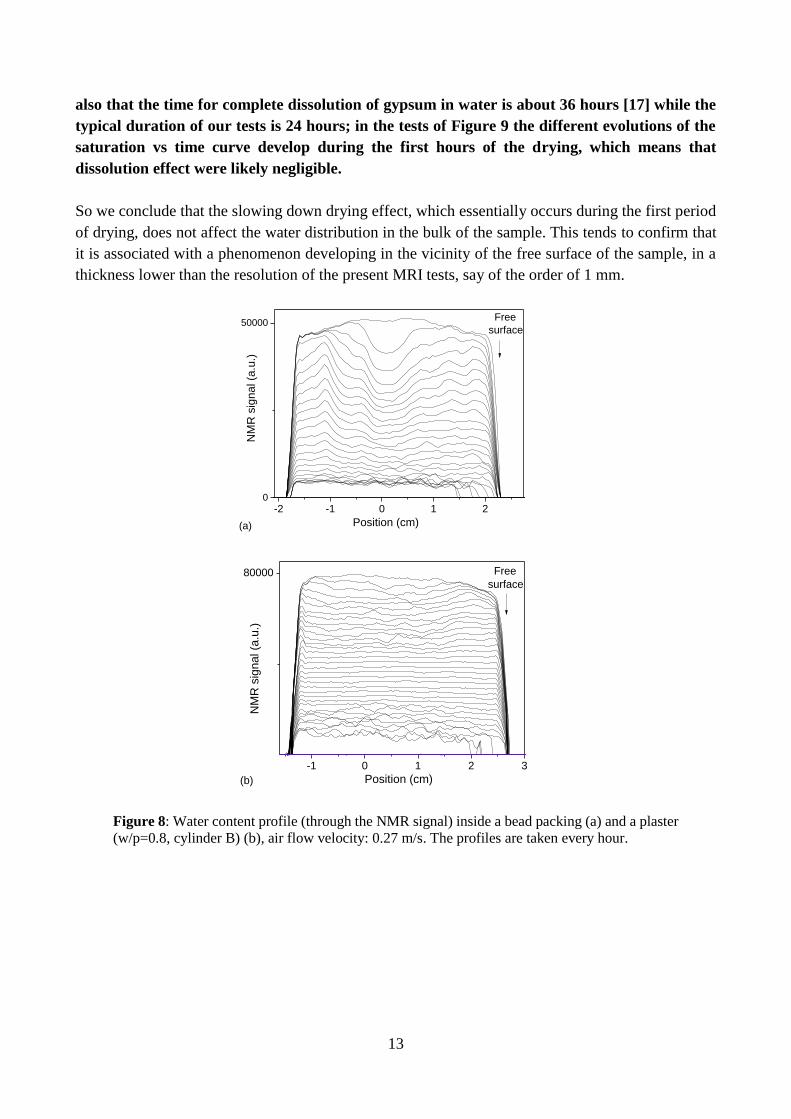
4.2 Water distribution in the sample
We carried out MRI tests making it possible to have the water distribution in time along the height of
the sample. During a first phase the saturation remains homogeneous in the sample (see Figure 8a).
Note that local fluctuations of the signal level are likely due to heterogeneities of the sample structure
resulting from the preparation process, but they play a negligible role in the effects here discussed.
The initial period (with uniform profiles) lasts until the saturation reaches about 15-20 %. In a second
phase there is a dry front which progresses towards the interior of the sample. These characteristics
are quite similar to those usually observed with simple porous media, and here again illustrated with
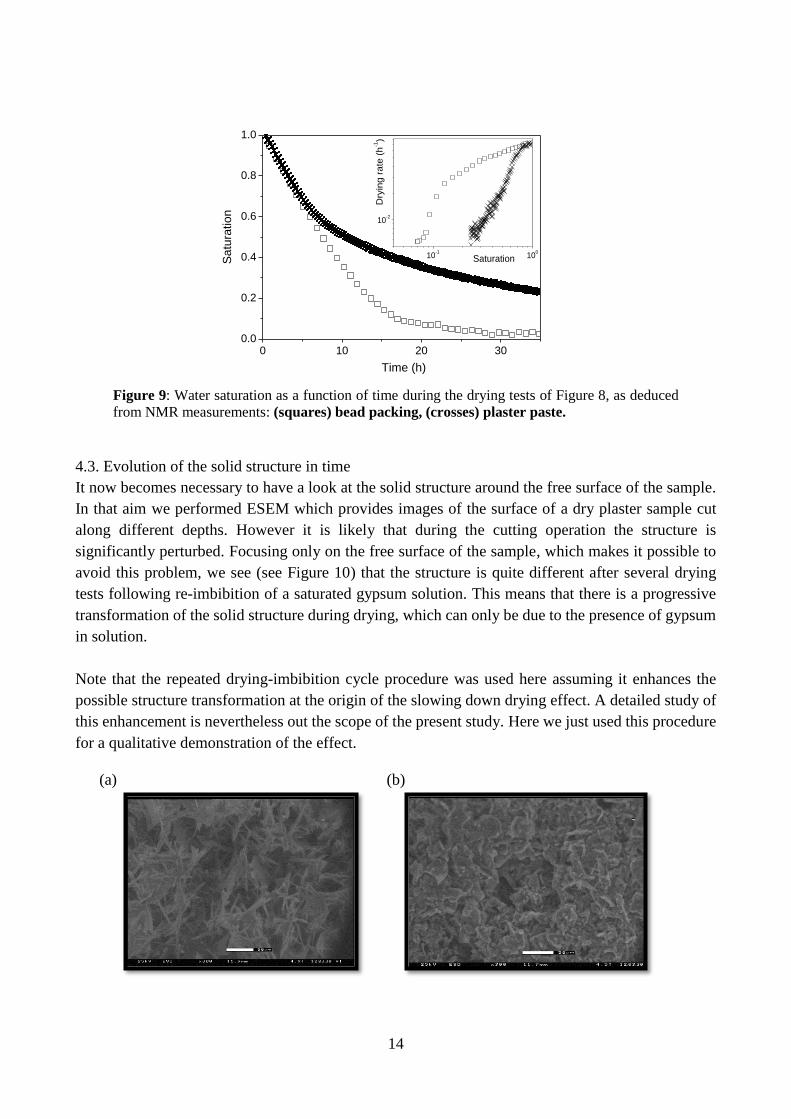
a bead packing (see Figure 8b). Nevertheless the corresponding drying curves and drying rate (here
computed from integration of the water content profiles obtained by NMR) significantly differ (see
Figure 9), in a way which is consistent with above results. Note that here even if we used a relatively
high w/p the slowing down effect is very significant due to the large thickness of the sample. Note
13
also that the time for complete dissolution of gypsum in water is about 36 hours [17] while the
typical duration of our tests is 24 hours; in the tests of Figure 9 the different evolutions of the
saturation vs time curve develop during the first hours of the drying, which means that
dissolution effect were likely negligible.
So we conclude that the slowing down drying effect, which essentially occurs during the first period
of drying, does not affect the water distribution in the bulk of the sample. This tends to confirm that
it is associated with a phenomenon developing in the vicinity of the free surface of the sample, in a
thickness lower than the resolution of the present MRI tests, say of the order of 1 mm.
-2 -1 0 1 20
50000
NM
R s
igna
l (a
.u.)
Position (cm)
Free
surface
(a)
-1 0 1 2 3
80000
(b)
NM
R s
ign
al (a
.u.)
Position (cm)
Free
surface
Figure 8: Water content profile (through the NMR signal) inside a bead packing (a) and a plaster
(w/p=0.8, cylinder B) (b), air flow velocity: 0.27 m/s. The profiles are taken every hour.
14
0 10 20 300.0
0.2
0.4
0.6
0.8
1.0
10-1
100
10-2
Dry
ing r
ate
(h
-1)
Saturation
Sa
tura
tio
n
Time (h)
Figure 9: Water saturation as a function of time during the drying tests of Figure 8, as deduced
from NMR measurements: (squares) bead packing, (crosses) plaster paste.
4.3. Evolution of the solid structure in time
It now becomes necessary to have a look at the solid structure around the free surface of the sample.
In that aim we performed ESEM which provides images of the surface of a dry plaster sample cut
along different depths. However it is likely that during the cutting operation the structure is
significantly perturbed. Focusing only on the free surface of the sample, which makes it possible to
avoid this problem, we see (see Figure 10) that the structure is quite different after several drying
tests following re-imbibition of a saturated gypsum solution. This means that there is a progressive
transformation of the solid structure during drying, which can only be due to the presence of gypsum
in solution.
Note that the repeated drying-imbibition cycle procedure was used here assuming it enhances the
possible structure transformation at the origin of the slowing down drying effect. A detailed study of
this enhancement is nevertheless out the scope of the present study. Here we just used this procedure
for a qualitative demonstration of the effect.
(a) (b)

15
Figure 10: ESEM images of the free surface of dry plaster samples (e/p = 0.8, cylinder A): (a)
after preparation and drying, (b) after four cycles of drying-imbibition
To get more information on the structure evolution inside the sample we observed the same samples
by X-Ray microtomography (see Figure 11) along a section perpendicular to the free surface of the
sample. In the case of a plaster obtained after the first drying there is no clear heterogeneity in the
sample structure, except in a thin layer at the top surface where there is no pores (black areas) of
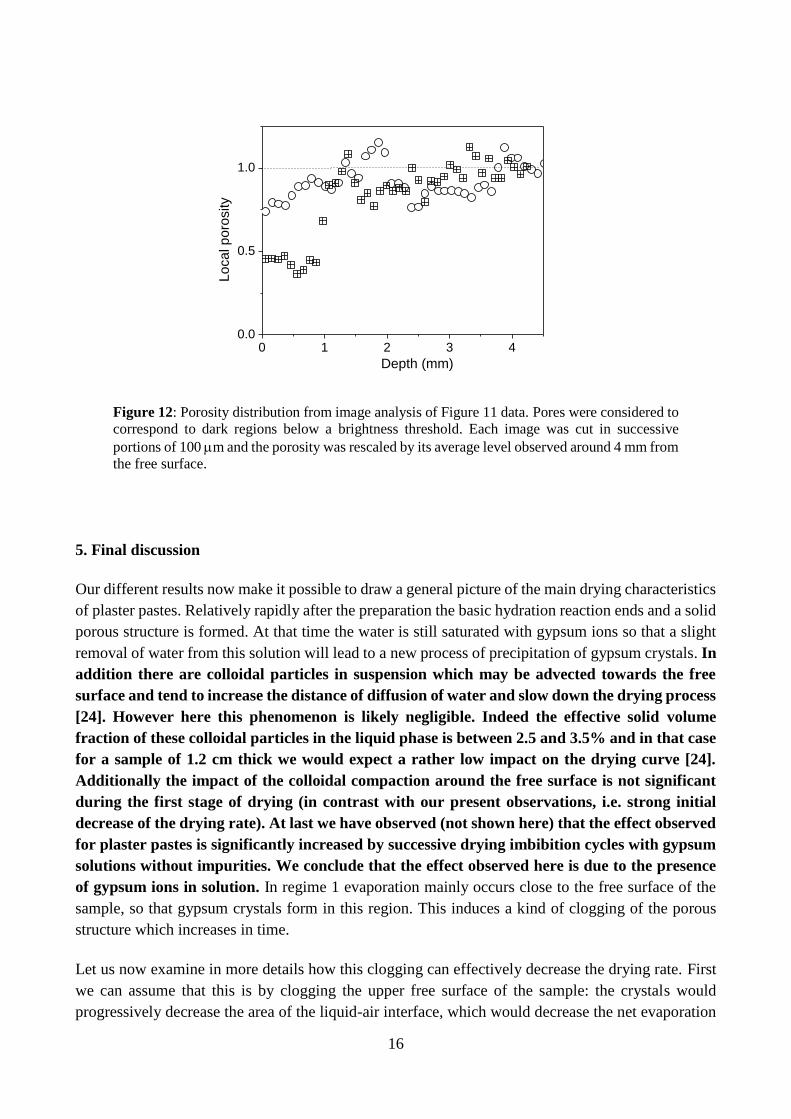
intermediate size. In the present study we just analyzed the images by estimating the porosity
distribution (see Figure 12). A slight decrease in porosity is apparently effectively observed at the
approach of the free surface, but fluctuations of similar amplitude are also observed at larger depth
so that it is hard to be reach a definitive conclusion on that point. For the plaster subjected to three
cycles of drying-imbibition the thickness of this layer has clearly increased: it now reaches about 1
mm. Now we observe a significant step in the porosity distribution (see Figure 12). This means that
there is a kind of clogging effect which takes place in an area very close to surface exposed to drying,
and which likely increases with the number of imbibition-drying cycles.
Figure 11: µ-tomography imaging of a cross-section perpendicular to the free surface of dry
plaster samples (e/p = 0.8, cylinder B): (left) after preparation and drying, (right) after three cycles
of drying-imbibition. The height of each picture is 4 mm, the width 6 mm. Volume element of
5.75 µm – X-ray source of 64 W and 80 keV. Dark areas correspond to pores.
16
0 1 2 3 40.0
0.5
1.0
Lo
ca
l p
oro
sity
Depth (mm)
Figure 12: Porosity distribution from image analysis of Figure 11 data. Pores were considered to
correspond to dark regions below a brightness threshold. Each image was cut in successive
portions of 100 m and the porosity was rescaled by its average level observed around 4 mm from
the free surface.
5. Final discussion
Our different results now make it possible to draw a general picture of the main drying characteristics
of plaster pastes. Relatively rapidly after the preparation the basic hydration reaction ends and a solid
porous structure is formed. At that time the water is still saturated with gypsum ions so that a slight
removal of water from this solution will lead to a new process of precipitation of gypsum crystals. In
addition there are colloidal particles in suspension which may be advected towards the free
surface and tend to increase the distance of diffusion of water and slow down the drying process
[24]. However here this phenomenon is likely negligible. Indeed the effective solid volume
fraction of these colloidal particles in the liquid phase is between 2.5 and 3.5% and in that case
for a sample of 1.2 cm thick we would expect a rather low impact on the drying curve [24].
Additionally the impact of the colloidal compaction around the free surface is not significant
during the first stage of drying (in contrast with our present observations, i.e. strong initial
decrease of the drying rate). At last we have observed (not shown here) that the effect observed
for plaster pastes is significantly increased by successive drying imbibition cycles with gypsum
solutions without impurities. We conclude that the effect observed here is due to the presence
of gypsum ions in solution. In regime 1 evaporation mainly occurs close to the free surface of the
sample, so that gypsum crystals form in this region. This induces a kind of clogging of the porous
structure which increases in time.
Let us now examine in more details how this clogging can effectively decrease the drying rate. First
we can assume that this is by clogging the upper free surface of the sample: the crystals would
progressively decrease the area of the liquid-air interface, which would decrease the net evaporation

17
rate. Such a process would tend to make the drying rate tend to zero, and is anyway in contradiction
with the observations of a clogging taking place in some significant thickness inside the material from
its free surface. Anyway it seems very difficult to get a strictly impermeable zone via the
accumulation of crystals which due to their complex form will never perfectly fill the volume.
Another possibility for explaining the decrease in drying rate is the decrease in permeability the
clogging effect induces. This is the process suggested in [14]. Such a process would result from the
accumulation of crystals in pores, as finally described in the previous paragraphs. However a
permeability decrease does not in general affect the rate of drying of a porous medium in regime 1.
For example, for a bead packing, under given conditions of air flow the drying rate is independent of
the bead size in the first regime [8]. More generally a homogeneous decrease of the porosity in a
sample will not affect the rate of drying in regime 1 but will tend to reduce the duration of the CRP,
since internal liquid flow will be more difficult and will lead to reach regime 2 sooner. However a
decrease of the pore size in a thin sample layer at the free surface of the sample will tend to
maintain a high constant drying rate for a longer time since this region will remain saturated
while the largest pores situated below progressively empty (see [25]). Finally the impact of the
clogging on the porous structure does not seem to be a possible explanation for the decrease of the
drying rate in regime 1. An effect with a more significant, sooner impact, is required.
A last possibility for explaining the decrease in drying rate is that the clogging implies the existence
of a dry region below the free surface. This would affect the drying rate by increasing the distance of
diffusion between the liquid-air interface and the air flow region. A similar effect occurs in regime 2
for a simple porous medium. In that case the dry region keeps a small thickness before the last regime
of drying is reached where it now significantly increases. Here such a process suggests that as soon
as some crystals are formed just below the sample free surface the liquid does not wet anymore this
region and will now evaporate from the layer situated just below these new crystals and so on at the
next step, thus leading to the formation of a dry region of increasing thickness as drying progresses.
A scheme of this process is presented in Figure 12, along with a comparison with the drying
characteristics of pure water in a simple homogeneous porous medium (i.e. a solid porous system).
During Regime 1 we have a homogeneous desaturation in both cases but due to the crystallization of
salts below the free surface of the sample the air-liquid interface is situated at some distance from the
free surface. This distance slowly increases during all regime 1. Then the liquid transfer from the
interior of the sample under the action of capillary pressure does not allow to replace sufficiently
rapidly the evaporated liquid, and we enter Regime 2. For the simple system this leads to a decrease
of the level of the air-liquid interface inside the sample. For a plaster sample this regime starts when
the liquid transfer is not sufficient to replace the liquid evaporated just below the crystallized region,
so that the air-liquid interface moves away from the bottom of the crystallized region, which now has
no more impact on the drying rate. This explains why the effect of slowing down drying does not
seem to have any impact on the drying in this regime even when the air flow velocity or the solid
fraction are varied (see Figures 2 and 4).

18
Figure 13: Scheme of the drying regimes (see text) in a simple system (pure liquid in a
homogeneous porous material) (left) and in a plaster (right). Dark grey (S) = solid part, Light grey
(L) = liquid, white = air.
We can finally check in more details the consistency of this scheme with regards to the trends
observed above. When the solid fraction is increased (i.e. w/p decreased) it is likely that the
crystallization region increases in thickness more rapidly. The reason for that remains to be
elucidated, we can suggest that the critical concentration of salt is reached more rapidly in smaller
pores. When the air flow velocity is increased the crystallization region increases again more rapidly.
In that case this should be due to the fact that the initial surface of evaporation needs to be at a slightly
larger depth than for a smaller velocity, so that the crystallization would start to grow at a larger depth
too. Finally the origin of the impact of the sample height is simple: for the same saturation we have
provided more liquid towards the sample free surface, which leads to a larger crystallization region.
A more complete confirmation of the validity of this scheme requires theoretical modelling.
6. Conclusion
We have shown how that the drying rate of plaster pastes is significantly lower than that expected for
a pure liquid evaporating from a simple homogeneous porous medium. This effect results from the
progressive formation of a crystallization region (due to the presence of gypsum salts in the liquid)

19
below the free surface of the sample. This creates a dry region and decreases the drying rate by
increasing the path the vapor has to follow before reaching the free surface. This scheme seems
globally consistent with our various observations, in particular from the pictures obtained with
microscopic techniques, and from a series of tests varying the experimental conditions (velocity, solid
fraction, sample height). However a complete validation of the assumed mechanisms of this
phenomenon requires a full modelling of the process.
Acknowledgements: We thank David Hautemayou for his technical support.
7. References
1. Neville HA (1926) Adsorption and Reaction I., Journal of Physical Chemistry 30: 1037-1042
2. Ridge MJ and Beretka J (1969) Calcium Sulphate Hemihydrate and Its Hydration, Rev
Pure and Appl Chem., 19: 17-44
3. Hansen WC (1963) Setting and hardening of gypsum plaster, Materials Research and
Standards, 3: 359-363.
4. Vignes JL, and Essaddam H (1997) Une vie de plâtre, Bulletin de l’union des physiciens, 790 :
145-164
5. Jaffel H, and Korb JP (2006) Probing Microstructure Evolution during the Hardening of Gypsum
by Proton NMR Relaxometry, J. Phys. Chem. B, 110: 7385-7391
6. Frederiksen R, and Marchand E (Eds.) (2010) Plaster casts: making, collecting
and displaying from classical antiquity to the present, De Gruyter, Berlin
7. Petkovic J, Huinink HP, Pel L, Kopinga K, van Hees RPJ (2007), Salt transport in
plaster/substrate layers, Materials and Structures, 40: 475-490
8.
9.
10.
11.
12.
13.
14.
Coussot P (2000) Scaling approach of the convective drying of a porous medium, Eur. Phys. J. B,
15, 557-566
Van Brakel J (1980) Mass transfer in convective drying, “Advances in drying”, Vol. 1,
Hemisphere, Washington
Van der Heijden GHA, Pel L, Huinink HP, Kopinga K (2011) Moisture transport and
dehydration in heated gypsum, an NMR study, Chem. Eng. Sci., 66: 4241-4250
Vosten B, Hersfeld B (1976) The drying of crust-forming materials as exemplified by the drying
of gypsum wallboard, Zement-Kalk-Gips, 5:213-222 (in German)
Schultz P, Schlünder EU (1990) Influence of additives on crust formation during drying, Chem.
Eng. Process, 28: 133-142
Gupta S, Huinink HP, Prat M, Pel L, Kopinga K (2014) Paradoxical drying of a fired-clay brick
due to salt crystallization, Chem. Eng. Sci., 109: 204-211
Espinosa-Marzal RM, Scherer GW (2013) Impact of in-pore salt crystallization on transport
properties, Environ. Earth Sci., 69: 2657-2669
15.
Song KM, Mitchell J, Gladden LF (2009), Magnetic resonance studies of hydration kinetics
and microstructural evolution in plaster pastes, J Mater. Sci., 44: 5004–5012
20
16. Song KM, Mitchell J, Jaffel H, Gladden LF (2010) Simultaneous monitoring of hydration
kinetics, microstructural evolution, and surface interactions in hydrating gypsum plaster in the
presence of additives, J Mater. Sci., 45: 5282–5290
17. Jaffel H (2006) Multi-scale characterization of evolving porous media, Ph.D. thesis, Ecole
Polytechnique, Palaiseau (in French)
18. Chou YL (1975) Statistical analysis, Holt, Rinehart & Winston of Canada Ltd; 2nd edition
19. Faure P, Rodts S (2008) Proton NMR relaxation as a probe for setting cement pastes, Magnetic
Resonance Imaging, 26: 1183-1196
20. Carr H, and Purcell E (1954) Effects of diffusion on free precession in Nuclear Magnetic
Resonance Experiments, Physical Review, 94, 630-638
21.
22.
23.
24.
25.
McDonald PJ, Korb JP, Mitchell J, and Monteilhet L (2005), Surface relaxation and chemical exchange in
hydrating cement pastes: a two-dimensional NMR relaxation study, Phys. Rev. E 72, 011409
Zimmerman JR, and Brittin WE (1957), Nuclear Magnetic Resonance Studies in Multiple Phase Systems:
Lifetime of a Water Molecule in an Adsorbing Phase on Silica Gel, J. Phys. Chem., 61: 1328-1333
Browstein KR and Tarr CE (1979) Importance of classical diffusion in NMR studies of water in biological
cells, Phys. Rev. A, 19: 2446-2453
Keita E, Faure P, Rodts S, Coussot P (2014) MRI evidence for a receding-front effect in drying porous
media, Phys. Rev., 87 : 062303
Coussot P, Gauthier C, Nadji D, Borgotti JC, Vié P, and Bertrand F (1999) Capillary motions during the
drying of a granular pastes. C.R. Acad. Sci. Paris, 327:1101-1106.