Extrusion of nickel–titanium alloys Nitinol to hollow shapes
The Mechanical Effects of Flaming Nickel-Titanium
Orthodontic Archwires
by
David Matthew MacLeod
A thesis submitted in conformity with the requirements for the degree of Master of Science
Faculty of Dentistry University of Toronto
© Copyright by David Matthew MacLeod, 2011
ii
The Mechanical Effects of Flaming Nickel-Titanium Orthodontic
Archwires
David Matthew MacLeod
Master of Science
Faculty of Dentistry
University of Toronto
2011
Abstract
Objective: To assess the mechanical effects of nickel-titanium orthodontic archwire flaming and their
distribution along the wire. Methodology: Two sizes of pre-formed austenitic nickel-titanium archwires
were tested (n=10). The terminal 5mm of each wire was heated for five seconds using a butane lighter.
Micro-hardness testing was used to determine the heat-affected zone for all wires. Cantilever bending was
performed to assess the mechanical properties of heated wires. Results: The heat-affected zone was found
to extend less than 2 mm past the flame boundary for all wires. For each wire gauge, the flamed zone was
characterized by a lower and flatter super-elastic plateau and an increased tendency for plastic
deformation when compared to controls. Conclusions: The limited ability of austenitic nickel-titanium
orthodontic archwires to conduct heat past the boundary of the flamed region suggests no need to alter
current clinical practice.
iii
Acknowledgments
I would like to thank Dr. John Daskalogiannakis, for his tireless help with manuscript revisions,
Dr. Tom North, for his patience and good humor in dealing with his first dental grad student, Dr.
Bryan Tompson, for his guidance, and Dr. Ibraheem Khan for his interest in helping a non-
engineer understand and appreciate biomaterials. Many thanks to Jian Wang and Nancy
Valiquette for helping with sample preparation and laboratory analyses. Lastly, I would like to
thank my wife, Marla, for her support, understanding and love while making our way through
this adventure called graduate school together.
iv
Table of Contents
ABSTRACT ii
ACKNOWLEDGEMENTS iii
TABLE OF CONTENTS iv
LIST OF TABLES vi
LIST OF FIGURES vii
CHAPTER 1: Literature Review 1
1.1 DEVELOPMENT AND PROPERTIES OF THE NICKEL-TITANIUM ALLOY 1
1.2 USE OF NICKEL-TITANIUM IN ORTHODONTICS 6
1.3 EFECT OF HEAT TREATMENT ON NICKEL-TITANIUM 7
1.4 PREVALENCE OF WIRE FLAMING IN ORTHODONTIC PTACTICE 10
1.5 PURPOSE OF CURRENT INVESTIGATION 11
CHAPTER 2: Methodology 12
2.1 WIRE SELECTION 12
2.2 HEAT TREATMENT 13
2.3 MICRO-HARDNESS TESTING 14
2.4 CANTILEVER BEND TESTING 16
2.5 STATISTICAL ANALYSIS 19
CHAPTER 3: Results 22
3.1 MICRO-HARDNESS TESTING 22
3.1.1 Testing of 0.014” wires 22
3.1.2 Testing of 0.019” x 0.025” wires 24
3.2 CANTILEVER BEND TESTING 26
3.2.1 Testing of 0.014” wires 26
v
3.2.2 Testing of 0.019” x 0.025” wires 30
3.3 STATISTICAL ANALYSIS 34
3.3.1 Micro-hardness testing 34
3.3.2 Cantilever bend testing 38
CHAPTER 4: Discussion and Conclusions 43
4.1 MICRO-HARDNESS DATA 43
4.2 CANTILEVER BEND DATA 45
4.3 RECOMMENDATION FOR FUTURE STUDY 47
CHAPTER 5: Conclusions 49
REFERENCES 50
APPENDICIES 52
Appendix A: Results of 2007 survey on archwire flaming20 52
Appendix B: Sample size calculation 53
Appendix C: Normal Q-Q plots of Knoop micro-hardness values for 0.014” wires 54 in the heat-affected zone, heat-unaffected zone and control wire
Appendix D: Post hoc test results for comparison of means for 0.014” micro-hardness data 55
Appendix E: Normal Q-Q plots of Knoop micro-hardness values for 0.019” x 0.025” 56 wires in the heat-affected zone, heat unaffected zone and control wire
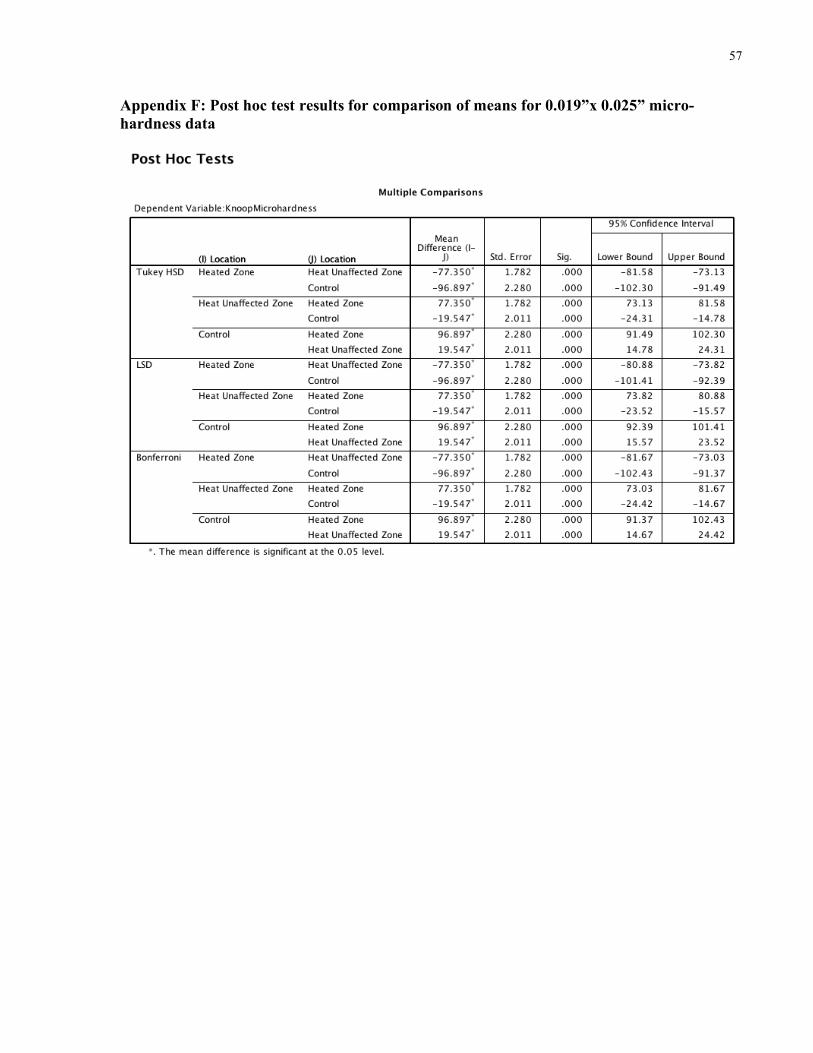
Appendix F: Post hoc test results for comparison of means for 0.019”x 0.025” 57 micro-hardness data
Appendix G: Post hoc test results for comparison of means for 0.014” change-point data 58
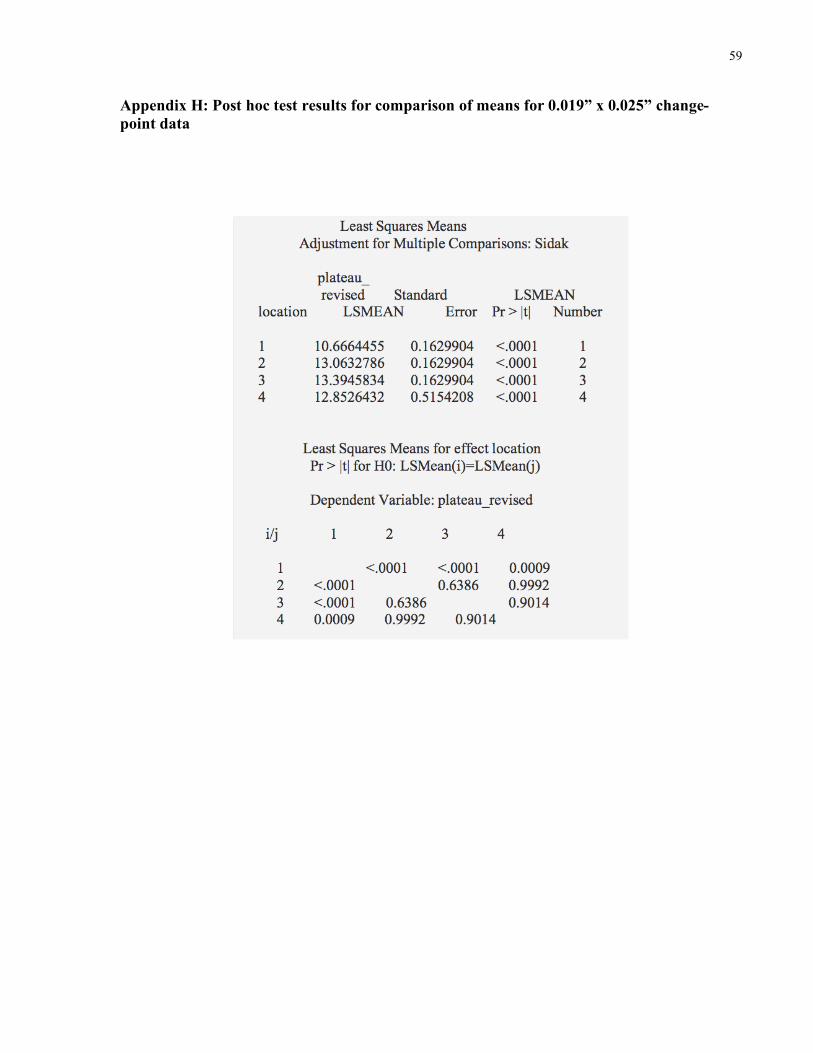
Appendix H: Post hoc test results for comparison of means for 0.019” x 0.025” 59 change-point data
vi
List of Tables
CHAPTER 3
Table 1: ANOVA test results for Knoop micro-hardness data from 0.014” wires 36
Table 2: ANOVA test results for Knoop micro-hardness data from 0.019” x 0.025” wires 38
Table 3: ANOVA test results for mean change-point data from 0.014” wires 40
Table 4: ANOVA test results for mean change-point data from 0.019” x 0.025” wires 42
vii
List of Figures
CHAPTER 1
Figure 1: Martensitic transformation and hysteresis for nickel-titanium due to temperature 3 change. As = Austenite start, Af = Austenite finish, Ms = Martensite start, Mf = Martensite finish, H = Hysteresis
Figure 2: Martensitic transformation and shape memory effect of nickel-titanium 4 (from Thompson, 2000)4
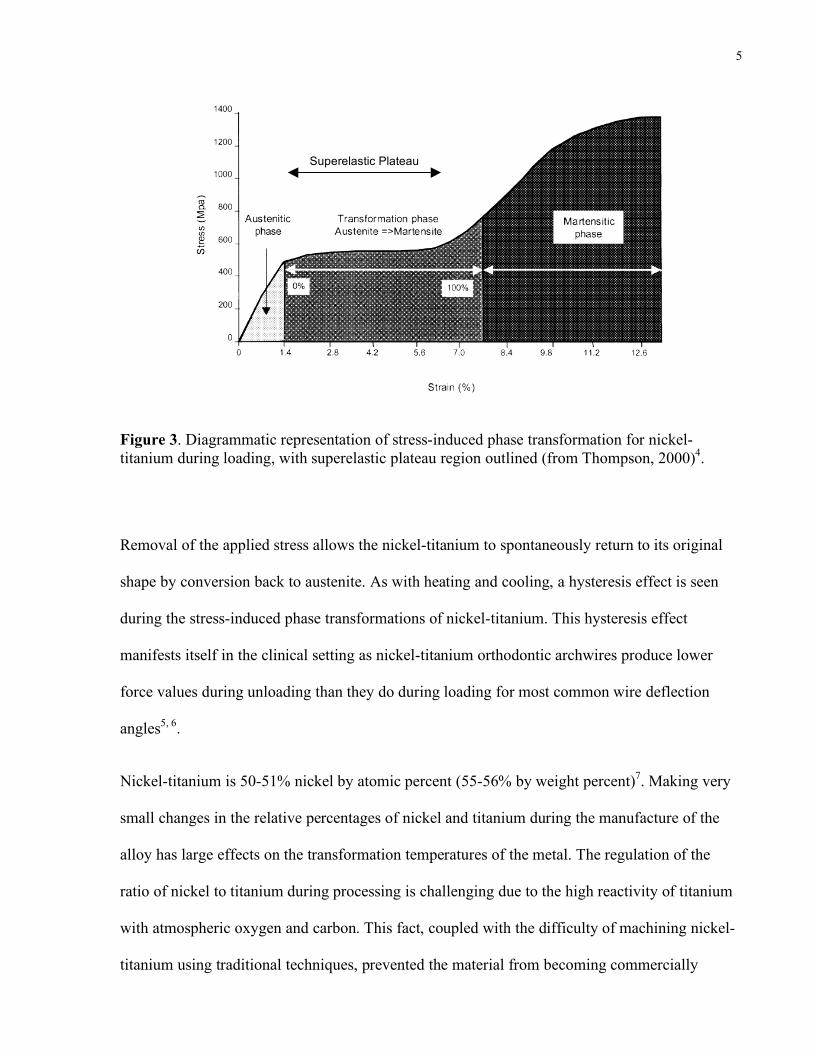
Figure 3: Diagrammatic representation of stress-induced phase transformation for 5 nickel-titanium during loading, with superelastic plateau region outlined (from Thompson, 2000)4
CHAPTER 2
Figure 4: Heat treatment apparatus for orthodontic archwires. A = Rope wax, 14 B = Insulating ceramic tube, C = Heated wire tip
Figure 5: Schematic representation of Knoop micro-hardness test protocol. A = Embedded 15 and polished wire specimen, B = Epoxy puck (Scale exaggerated for illustrative purposes)
Figure 6: Test apparatus for 3-point bending. Dashed area represents heated segment of wire 17 equivalent in length to that used in the current experiment
Figure 7: Cantilever bend apparatus for clamp point of 2.5 mm from flamed tip. Dashed area 18 represents flamed portion of wire. Scale is exaggerated for clarity (clamp points of 7 mm and 20 mm not shown)
Figure 8: Change-point analysis for 0.014” nickel-titanium wire bent 2.5mm from the flamed 21 tip showing load-deflection data (blue crosses) and regression lines (red crosses). Arrow indicates location of change-point between elastic and super-elastic regions of the loading curve
Figure 9: Knoop micro-hardness values for 0.014” austenitic nickel-titanium control wire 23
Figure 10: Knoop micro-hardness values for five flamed 0.014” austenitic nickel-titanium wires 24
Figure 11: Knoop micro-hardness values for 0.019” x 0.025” austenitic nickel-titanium 25 control wire
Figure 12: Knoop micro-hardness values for five flamed 0.019” x 0.025” austenitic 26 nickel-titanium wires
Figure 13: Sample load/deflection plot for 0.014” austenitic nickel-titanium control archwire 27
Figure 14: Sample load/deflection plot for 0.014” nickel-titanium wire bent within the flamed 28 portion of the wire at a location 2.5 mm from the wire tip
Figure 15: Sample load/deflection plot for 0.014” nickel-titanium wire bent 7 mm from the 29 flamed end
Figure 16: Sample load/deflection plot for 0.014” nickel-titanium wire bent 20 mm from the 30 flamed end
viii
Figure 17: Sample load/deflection plot for 0.019” x 0.025” austenitic nickel-titanium control 31 archwire
Figure 18: Sample load/deflection plot for 0.019” x 0.025” nickel-titanium archwire bent within 32 the flamed portion of the archwire at a location 2.5 mm from the wire tip
Figure 19: Sample load/deflection plot for 0.019” x 0.025” nickel-titanium wire bent 7 mm 33 from the flamed end
Figure 20: Sample load/deflection plot for 0.019” x 0.025” nickel-titanium wire bent 20 mm 34 from the flamed end
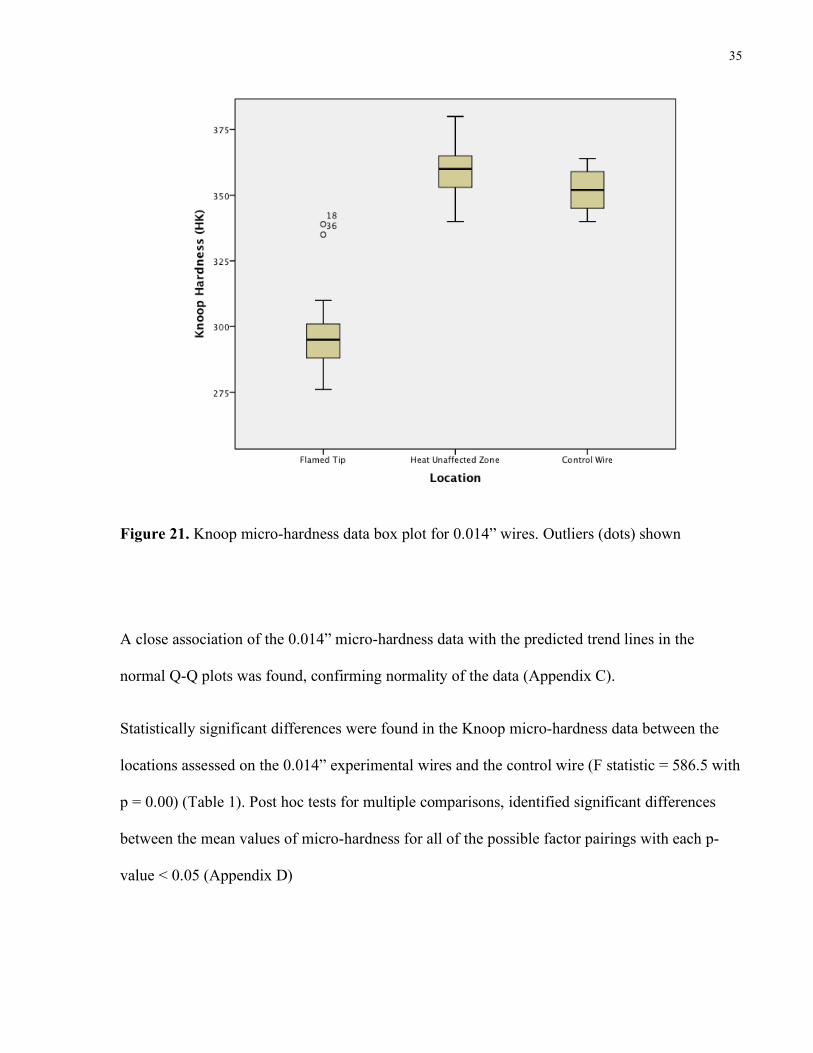
Figure 21: Knoop micro-hardness data box plot for 0.014” wires. Outliers (dots) shown 35
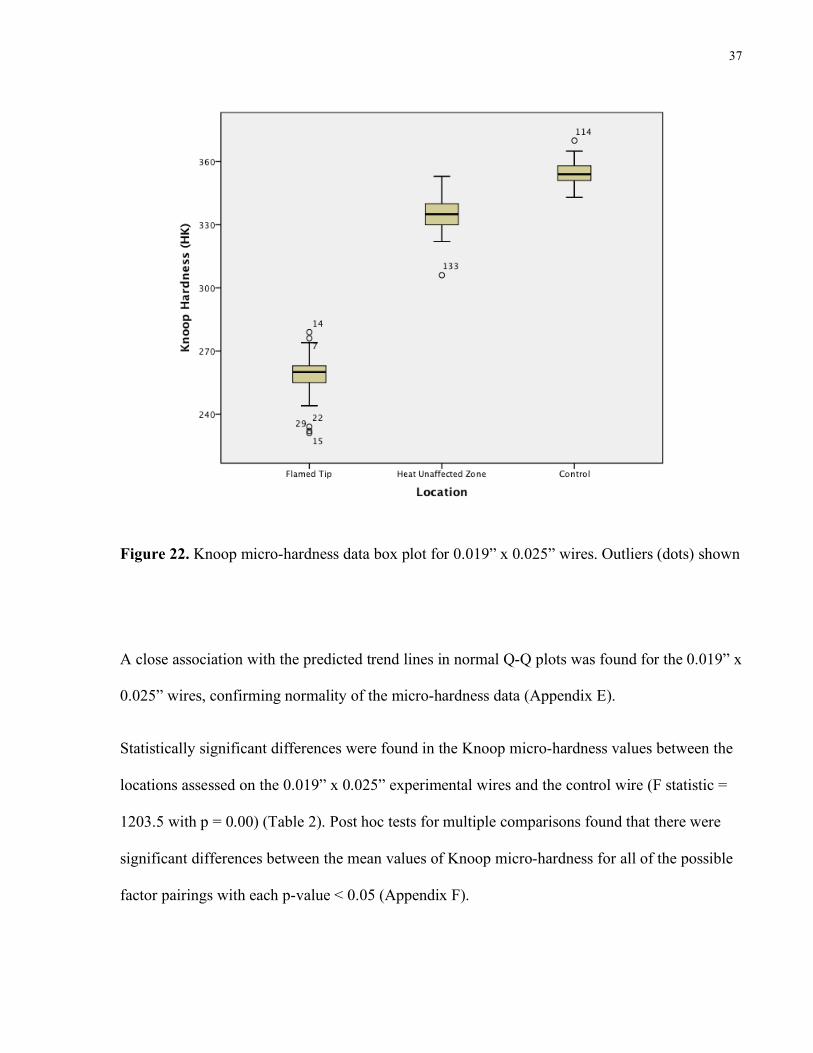
Figure 22: Knoop micro-hardness data box plot for 0.019” x 0.025” wires. Outliers (dots) shown 37
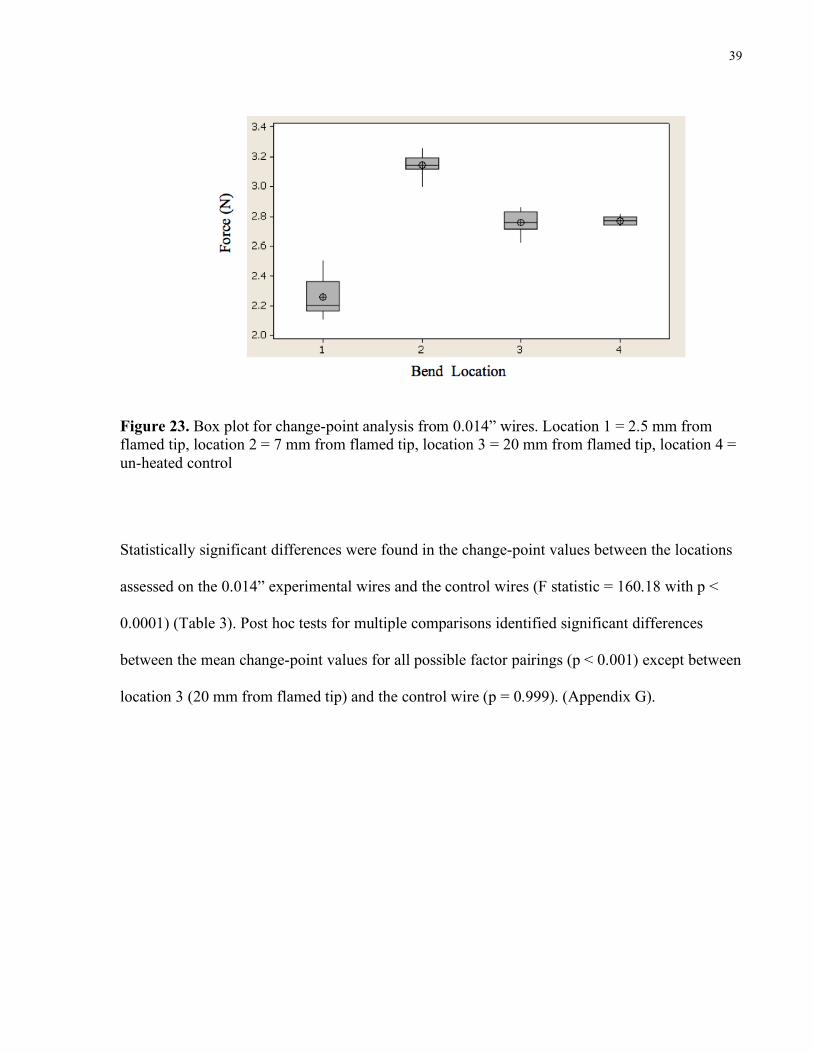
Figure 23: Box plot for change-point analysis from 0.014” wires. Location 1 = 2.5 mm from 39 flamed tip, location 2 = 7 mm from flamed tip, location 3 = 20 mm from flamed tip, location 4 = un-heated control
Figure 24: Box plot for change-point analysis from 0.019” x 0.025” wires. Location 1 = 2.5 mm 41 from flamed tip, location 2 = 7 mm from flamed tip, location 3 = 20 mm from flamed tip, location 4 = un-heated control. Outlier (asterisk) shown
1
Chapter 1
Literature Review
1.1 Development and properties of the nickel-titanium alloy
Nickel-titanium is a nearly equi-atomic alloy first developed in 1962 by Buehler at the U.S.
Naval Ordnance Laboratory in White Oak, Maryland1. Nickel-titanium is known as an
intermetallic compound. Intermetallics are compounds of metals whose crystal structures are
different from those of the constituent metals. They are formed when the bonding strength
between unlike atoms (e.g. Ti-Ni) is larger than that between like atoms (Ti-Ti, Ni-Ni). They
possess crystal structures with an ordered atomic arrangement, and due to their properties they
occupy an intermediate position between metals and ceramics. The intensive research into
intermetallics in the mid 1900s started with the expectation that they may become prime
candidates for high temperature structural applications in such things as jet engines in order to
increase service temperature and reduce weight2. The best-known representatives of
intermetallics are the alloys NiTi, Cu-Al-Ni and Cu-Zn-Sn.
Nickel-titanium alloys exhibit two related and unique properties: shape memory and
superelasticity. Shape memory refers to the ability of alloys like nickel-titanium to undergo
deformation at one temperature, and then recover their original shape when heated above a
temperature known as their transformation temperature. Superelasticity is a similar phenomenon
that occurs when these alloys are placed under stress at temperatures above their transformation
temperature. When this deforming stress is removed, the material has the ability to return to its
original undeformed shape, resulting in an effective elastic range many times greater than that of
2
most metals. Both of these properties of nickel-titanium are related to a solid-state phase
transformation known as a martensitic transformation, which can be induced by exposing the
alloy to changes in temperature or changes in stress. At high temperatures, nickel-titanium
conforms to a simple cubic crystal structure known as austenite, which is also known as the
parent phase or high-temperature phase. At lower temperatures, nickel-titanium spontaneously
transforms to a monoclinic shaped crystal structure known as martensite, also known as the low-
temperature phase. The temperature at which the parent phase begins to transform into the low-
temperature phase is referred to as the transformation temperature. For metals like nickel-
titanium there are four unique transition temperatures. The martensite start (Ms) temperature
represents the temperature at which martensite first begins to form as austenite is cooled. The
temperature at which the transformation to martensite is complete is known as the martensite
finish (Mf) temperature. However, upon re-heating, the temperatures at which the austenite phase
begins (As) and finishes (Af) forming do not correspond to the Ms and Mf temperatures
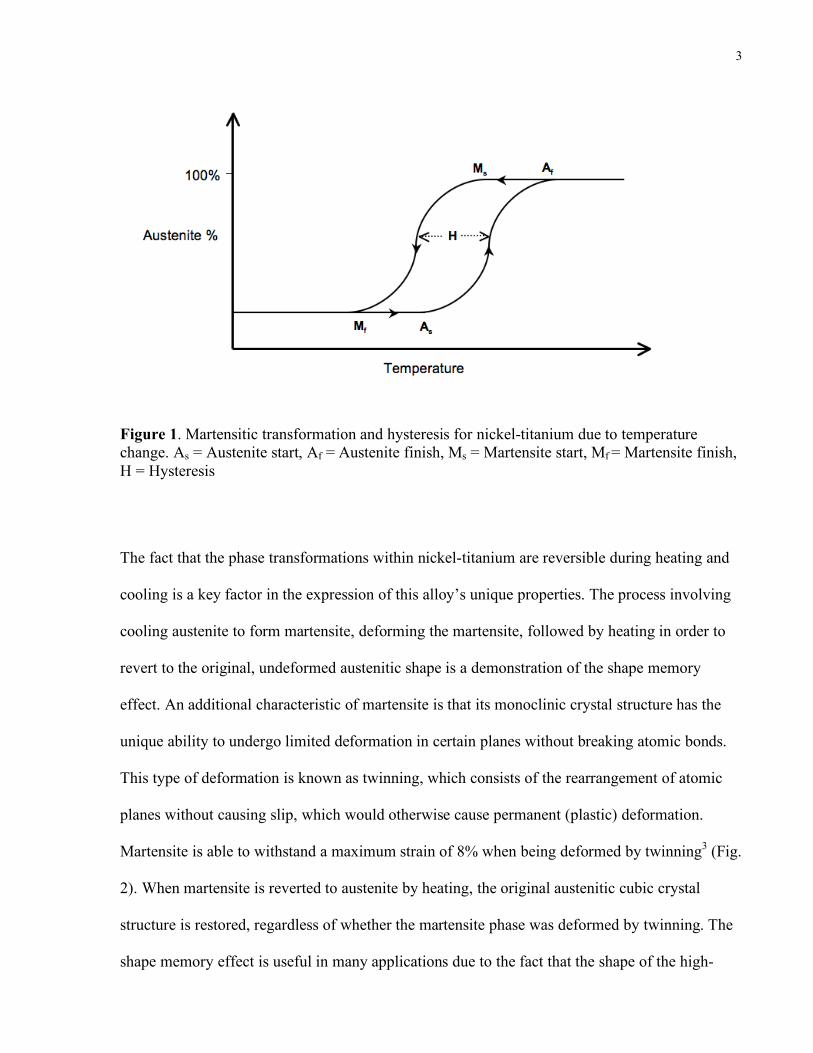
experienced during cooling. This difference in energy input required upon heating to pass
through the As and Af temperatures versus that released upon cooling to pass through the Ms and
Mf temperatures is known as hysteresis (Fig. 1).
3
Figure 1. Martensitic transformation and hysteresis for nickel-titanium due to temperature change. As = Austenite start, Af = Austenite finish, Ms = Martensite start, Mf = Martensite finish, H = Hysteresis
The fact that the phase transformations within nickel-titanium are reversible during heating and
cooling is a key factor in the expression of this alloy’s unique properties. The process involving
cooling austenite to form martensite, deforming the martensite, followed by heating in order to
revert to the original, undeformed austenitic shape is a demonstration of the shape memory
effect. An additional characteristic of martensite is that its monoclinic crystal structure has the
unique ability to undergo limited deformation in certain planes without breaking atomic bonds.
This type of deformation is known as twinning, which consists of the rearrangement of atomic
planes without causing slip, which would otherwise cause permanent (plastic) deformation.
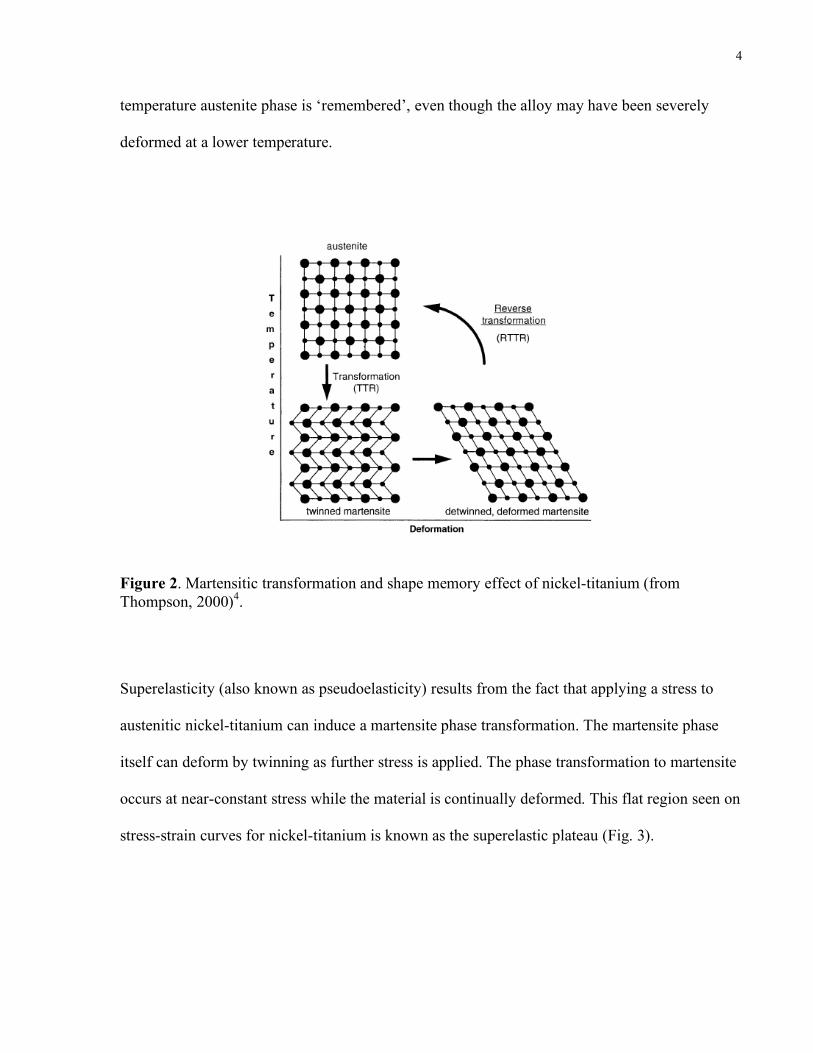
Martensite is able to withstand a maximum strain of 8% when being deformed by twinning3 (Fig.
2). When martensite is reverted to austenite by heating, the original austenitic cubic crystal
structure is restored, regardless of whether the martensite phase was deformed by twinning. The
shape memory effect is useful in many applications due to the fact that the shape of the high-
4
temperature austenite phase is ‘remembered’, even though the alloy may have been severely
deformed at a lower temperature.
Figure 2. Martensitic transformation and shape memory effect of nickel-titanium (from Thompson, 2000)4.
Superelasticity (also known as pseudoelasticity) results from the fact that applying a stress to
austenitic nickel-titanium can induce a martensite phase transformation. The martensite phase
itself can deform by twinning as further stress is applied. The phase transformation to martensite
occurs at near-constant stress while the material is continually deformed. This flat region seen on
stress-strain curves for nickel-titanium is known as the superelastic plateau (Fig. 3).
5
Figure 3. Diagrammatic representation of stress-induced phase transformation for nickel-titanium during loading, with superelastic plateau region outlined (from Thompson, 2000)4.
Removal of the applied stress allows the nickel-titanium to spontaneously return to its original
shape by conversion back to austenite. As with heating and cooling, a hysteresis effect is seen
during the stress-induced phase transformations of nickel-titanium. This hysteresis effect
manifests itself in the clinical setting as nickel-titanium orthodontic archwires produce lower
force values during unloading than they do during loading for most common wire deflection
angles5, 6.
Nickel-titanium is 50-51% nickel by atomic percent (55-56% by weight percent)7. Making very
small changes in the relative percentages of nickel and titanium during the manufacture of the
alloy has large effects on the transformation temperatures of the metal. The regulation of the
ratio of nickel to titanium during processing is challenging due to the high reactivity of titanium
with atmospheric oxygen and carbon. This fact, coupled with the difficulty of machining nickel-
titanium using traditional techniques, prevented the material from becoming commercially
Superelastic Plateau
6
available until a decade after its discovery2. Nickel-titanium must be manufactured in a near-
vacuum in order to keep atmospheric oxygen and carbon from reacting with the melt. Vacuum
arc re-melting, plasma arc melting and vacuum induction melting are three methods commonly
used to achieve this. Controlling the transformation temperatures of nickel-titanium is important
if the properties of superelasticity and the shape memory effect are to be taken advantage of
during use. In addition to controlling the relative percentages of nickel and titanium within the
crystal structure, other metals such as copper and chromium may be incorporated into the alloy
during manufacture to control the transition temperature ranges.
The high reactivity of titanium with oxygen renders the surface oxide layer of nickel-titanium
very stable, giving the material its biocompatibility. Coupled with the properties of
superelasticity and the shape-memory effect, this high level of biocompatibility has enabled the
alloy to be employed in the biomedical field for several unique applications such as
cardiovascular stents, wires used for fixation in the field of orthopedics, dental endodontic files,
and flexible surgical instruments, like scissors and endoscopes8.
1.2 Use of nickel-titanium in orthodontics
Nickel-titanium was first introduced as an orthodontic archwire material in 1971 by Andreason
and marketed under the name Nitinol by the Unitek Corporation9. The formulation of the alloy
used provided a higher spring-back and lower stiffness than other archwire materials available at
the time, such as stainless steel and cobalt-chromium alloys. However, the Nitinol alloy was
susceptible to plastic deformation within the deflection ranges commonly encountered in the
clinical setting with edgewise orthodontic appliances10. A different version of the nickel-titanium
alloy was developed in the 1980s, in Beijing, for orthodontic use, commonly known as ‘Chinese
7
Ni-Ti’5. This new formulation was the first to demonstrate the physical characteristics of
superelasticity and the shape-memory effect, which have become so important to its modern
application.
Currently there are commercially available forms of nickel-titanium archwires that are alloyed
with other metals to raise the As temperature closer to that found in the oral cavity. This allows
the archwires to be manipulated at room temperature in their more flexible mertensitic phase
during wire insertion, followed by transformation into the stiffer austenitic phase once they
equilibrate with the temperature of the mouth. Also known as ‘heat-activated’ nickel-titanium
wires, these unique alloy formulations have become very popular in clinical practice.
1.3 Effect of heat treatment on nickel-titanium
The effects of post-manufacture heating on nickel-titanium wires are often assessed within the
dental literature by focusing on temperatures found in the oral environment. In 1994, Tonner and
Waters conducted a study in which thirteen common varieties of nickel-titanium archwires were
subject to three-point bend testing at five distinct temperatures, ranging from 5 °C to 50 °C. For
all of the nickel-titanium formulations tested, the authors found a strong positive correlation
between temperature and the force generated at the super-elastic plateau, during both loading and
un-loading. In addition, for the austenitic wire tested in the experiment (Ormco® Ni-Ti, 0.016”),
the gradient (cN/mm) of the initial loading slope was shown to increase as temperatures
increased, however this correlation became weaker at higher temperatures11. In 1997, Filleul and
Jordan examined the torsional properties of nickel-titanium archwires under conditions of
controlled moment and temperature. The authors found a positive correlation between
temperature and bending moment for all of the wires tested. The most pronounced difference
8
between bending moments for the austenitic wire tested (Ormco® Ni-Ti, 0.017” x 0.025”) was
found between testing temperatures of 39 °C and 22 °C, whereas the bending moment plots for
39 °C and 44 °C were nearly identical12. A 2002 study by Iijima et al. examined the
load/deflection characteristics of austenitic nickel-titanium wires (Ormco® austenitic Ni-Ti,
0.016” x 0.022”) under three-point bending as temperature conditions varied from 2 °C to 60 °C.
In all cases they found that increased temperatures were associated with higher maximum
bending forces. For the highest temperature group (60 °C) this represented a clinically significant
difference in maximum bending force of 200g when compared with controls. In addition, the
wires exposed to more bend cycles exhibited higher maximum forces at a given temperature than
wires that had not been cycled13.
Other authors have looked at the effect of heat on nickel-titanium wires that is commonly
encountered during dental sterilization procedures. Kapila et al. in 1992 subjected 0.016”
austenitic nickel-titanium wires (Ormco® Ni-Ti) to both 1 and 2 rounds of dry-heat sterilization
at a temperature of 235 °C for 20 minutes and compared three-point bend data from these wires
to those of unheated controls. Their experiment showed that temperature and time exposure were
positively correlated with force levels generated during three-point bending, with the wires
exposed to heat for 20 minutes showing the highest force threshold to reach the super-elastic
plateau. Although statistically significant, the authors concluded that the differences (+/- 15 g)
would be clinically unimportant14. In 2009, Alavi et al. compared the effects of dry-heat and
steam sterilization on the mechanical properties of 0.016” pre-formed austenitic nickel-titanium
archwires (G&H Company®). The mechanical properties of the heated wires were compared to
those of controls through three-point bending. The autoclave process involved heating the wires
to a temperature of 120 °C for 20 minutes and the dry-heat sterilization represented exposure to a
temperature of 160 °C for a period of 120 minutes. Both the autoclave and dry-heat procedures
9
produced wires that had a lower force threshold to reach the super-elastic plateau, with the higher
temperature group being the lowest of all15.
The temperatures used during dental sterilization procedures are much lower than the
temperature produced by the butane flame used in this experiment. The adiabatic flame
temperature for butane gas in air is 1970 °C16. Provided enough oxygen is present during
combustion, the by-products of complete butane combustion are carbon dioxide and water. In an
oxygen-depleted environment pure carbon (soot) and carbon monoxide may also form during
combustion, which occurs at a lower temperature. In a 2005 study looking at the ignition hazard
posed by different types of cigarette lighters, Williamson and Marshall determined that the
average flame height for commercially available diffusion-type butane lighters was 2 cm. The
maximum flame temperature was measured at 1657 °C at a position 12 mm above the gas release
port in the middle of the flame plume17. The only time such high temperatures are described in
the literature relating to nickel-titanium is in relation to metal processing and refinement
techniques, such as induction melting and industrial heat treatments, or during annealing and
tempering7. Few authors have studied the effects of such post-manufacture heat treatment on the
properties of nickel-titanium orthodontic wires. Those that have investigated this sort of heat
treatment have used temperature ranges that were nearly 1000 °C less than the combustion
temperature of butane in air, however the time exposure to such temperatures was considerably
longer than is commonly seen in the clinical practice of archwire flaming. Khier et al., in 1991,
investigated the mechanical effects of heat-treating 0.016” austenitic nickel-titanium wires
(Ormco® Ni-Ti) at temperatures of 500 °C and 600 °C for time periods of 10 minutes and 2
hours. Their cantilever bend testing data demonstrated a consistent negative correlation between
force generation and the variables of temperature and exposure time, with the 600 °C/ 2 hour
group showing the lowest forces during loading, unloading and at the super-elastic plateau for all
10
four groups18. Miura et al., in 1986 performed a study on the newly developed ‘Japanese NiTi
Alloy’ (Furukawa Electric Co., Ltd) in which they heat-treated samples of 0.016” diameter wire
for 5, 10, 60 and 120 minutes at temperatures of 400 °C, 500 °C and 600 °C. All samples were
subject to three-point bend testing to determine the effects of the heat treatment. A consistent
negative correlation was seen between the force generation upon bending and the variables of
temperature and time exposure, with the 600 °C / 120 minute group demonstrating the lowest
forces during the bending cycle19.
1.4 Prevalence of wire flaming in orthodontic practice
The fact that Nickel-Titanium can be deflected through a large angle and still recover elastically
has created a challenge for orthodontic practitioners, in that a permanent bend is difficult to place
at the end of the wire. Among the reasons for placing such a bend are controlling the length of
the dental arch, avoiding soft-tissue trauma caused by excess length of wire and reducing the
incidence of unwanted wire escape from molar bands and brackets. Specialized pliers have
entered the market, which are able to permanently bend superelastic wires such as nickel-
titanium. They achieve this by bending the wire through a sharp angle, which exceeds the elastic
limit of the stress-induced martensite phase. However, a recent survey of 133 Eastern Canadian
orthodontic practitioners revealed that 70% of survey respondents continue to flame the ends of
nickel-titanium archwires to facilitate the placement of a permanent bend at the end of the
archwire20. The average length of wire immersed in the flame was reported at 5 mm with an
average flaming duration of 3.5 seconds (see Appendix A).
11
1.5 Purpose of current investigation
The purpose of the current investigation was to investigate the mechanical effects of archwire
flaming on pre-formed austenitic nickel-titanium archwires. In addition to comparing the
mechanical effects of flamed wires to unheated controls, the experiment addressed the question
of whether heat conductance along the wire during flaming had the ability to alter its mechanical
properties in areas not directly exposed to flame. Large changes in the mechanical behavior of an
archwire along tooth-borne portions of its length could have unintended consequences on the
type and rate of tooth movement achieved. These complications could manifest themselves in
increased overall treatment times and diminished quality of care.
12
Chapter 2
Methodology
2.1 Wire selection
Austenitic nickel-titanium wires were chosen due to their prevalence in the orthodontic
marketplace, common use in the clinical setting and ease of use in the laboratory. With a phase
transformation temperature (Af) well below that of ambient room temperature, or that of the
human body, austenitic archwires already exist in the high-temperature phase and therefore do
not undergo any further phase changes upon heating. Due to the fact that the martensite-to-
austenite phase transformation for heat-activated nickel-titanium wires is designed to occur near
the temperature of the human body through alloying with other metals such as copper, the use of
such wires would require controlling ambient temperature, which is not representative of the
clinical practice of wire flaming.
The two sizes of experimental wires used for this study were pre-formed round maxillary
archwires with a diameter of 0.014” and pre-formed maxillary rectangular archwires with a cross
sectional dimension of 0.019” x 0.025”, supplied by Cerum® Ortho Organizers (Carlsbad
California). These two wire sizes closely approximate the upper and lower limits of the range of
wire sizes used in the initial alignment and leveling phase of orthodontic treatment with
edgewise appliances having a bracket slot size of 0.022” x 0.028”. The terminal 25 mm of wire
was cut from each end of every arch form for use in the experiment. Five (5) experimental and
one (1) control segment were prepared for hardness testing, whereas thirty (30) experimental and
five (5) control segments were prepared for bend testing in this manner for each wire size.

13
2.2 Heat treatment
For the experimental wires, the terminal 5mm of each was subjected to the heating protocol.
Care was taken to heat the former free end of the archwire (and not the end where the segment
was cut from the arch form) due to the potential for the wire cutting process to alter the
microstructure of the metal through plastic deformation and work hardening. The flame source
was a diffusion-type butane lighter, similar to that which would be used for archwire flaming in a
clinical setting (BIC®, Clichy Cedex, France). The maximum flame width of several store-
bought lighters was measured at 5 mm, indicating that 5 mm of wire could be entirely immersed
in flame at one time. In order to shield the remaining 20 mm of each wire segment from direct
flame exposure, while allowing for free conduction of heat along the majority of the wire, the
wire was partly immersed in a ceramic tube. One end of the tube’s lumen was plugged with
dental rope wax. Five millimeters of the non-heated wire end were embedded in this wax. This
allowed for 15 mm of wire to be freely suspended in air within the lumen of the ceramic tube,
with the last 5 mm of wire extending past the end of the tube for exposure to the flame. While
being held in a horizontal position, perpendicular to the rising flame, the exposed 5 mm of wire
was immersed in the widest portion of the butane flame for 5 seconds (as measured by a digital
stopwatch) (Fig. 4).
14
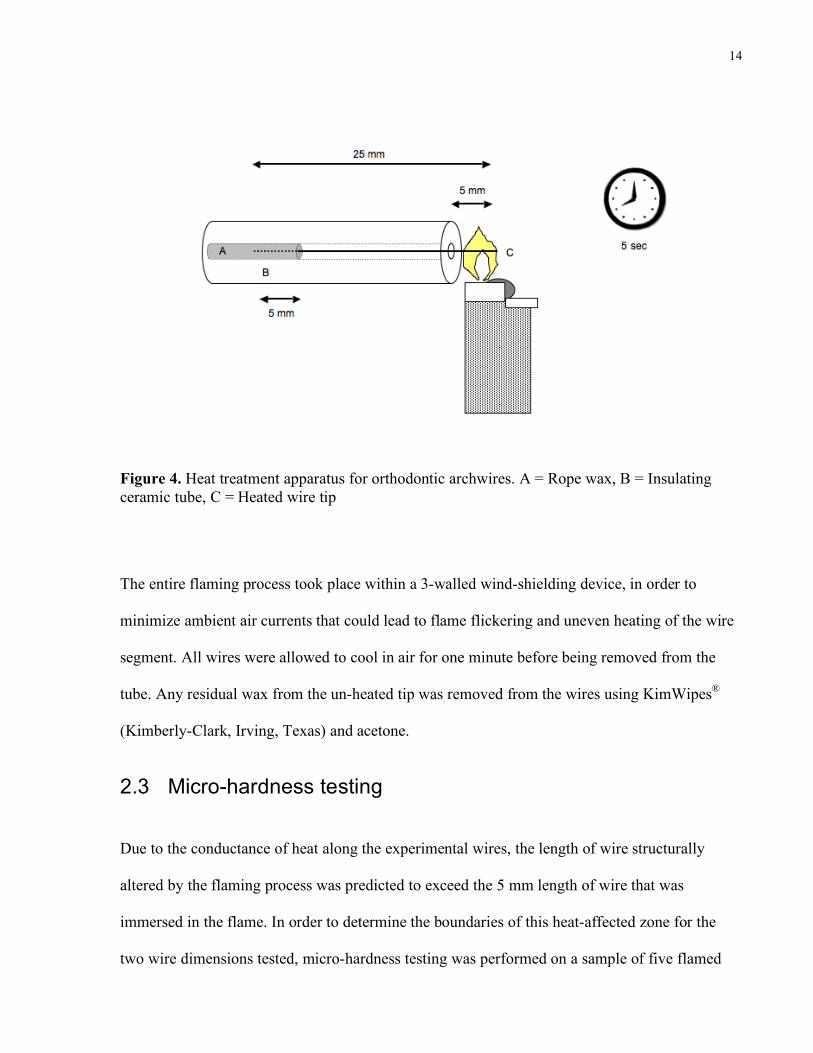
Figure 4. Heat treatment apparatus for orthodontic archwires. A = Rope wax, B = Insulating ceramic tube, C = Heated wire tip
The entire flaming process took place within a 3-walled wind-shielding device, in order to
minimize ambient air currents that could lead to flame flickering and uneven heating of the wire
segment. All wires were allowed to cool in air for one minute before being removed from the
tube. Any residual wax from the un-heated tip was removed from the wires using KimWipes®
(Kimberly-Clark, Irving, Texas) and acetone.
2.3 Micro-hardness testing
Due to the conductance of heat along the experimental wires, the length of wire structurally
altered by the flaming process was predicted to exceed the 5 mm length of wire that was
immersed in the flame. In order to determine the boundaries of this heat-affected zone for the
two wire dimensions tested, micro-hardness testing was performed on a sample of five flamed

15
wires from each size category and compared to that of an unheated control. A Tukon® micro-
hardness tester (Instron Corporation, Norwood, Massachusetts) was used to generate Knoop
micro-hardness values along a midline transect for each wire. Sample preparation included wire
sectioning and wire flaming following the protocols described above, followed by mounting and
polishing of samples. Each pre-heated wire length was placed in a 4 cm diameter puck and
encased in epoxy. All rectangular wires were placed so that their greatest dimension (0.025”)
was exposed on the surface of the epoxy. The epoxy-mounted samples were then sanded on a
wet wheel progressing through grits of 800 to 4000 and then polished with a 10µm oil-based
diamond paste on a felt wheel. A binocular microscope with a 100x objective was used to
confirm adequate sample preparation at each stage of the polishing process. During testing, a 50g
load was applied to the Knoop indenter with a dwell time of 30 seconds for each sample point. In
order to keep adjacent indentation points separated from each other by 2.5x their width, sampling
was performed at 125µm intervals along the midline transect for each of the wires tested (Fig. 5).
Figure 5. Schematic representation of Knoop micro-hardness test protocol. A = Embedded and polished wire specimen, B = Epoxy puck (Scale exaggerated for illustrative purposes)
16
Due to the apparent convexity of the surface of the prepared wires, only midline indentations
along the wire’s long axis produced symmetrical outlines, which allowed for only one data point
to be collected at each position along the midline transect for a given wire. Although the full 25
mm of wire was encased within each epoxy mount, interference between the Knoop indenter tip
and the mounting clamps on the stage of the micro-hardness tester dictated that only 15 mm of
the wire’s length was able to be tested per sample. In each case this was made to represent the 15
mm of wire closest to the flamed tip. Daily examiner reliability tests included measurement of 10
successive indentations in a test wire by two examiners. An average difference between
examiners less than 15% was considered acceptable. All micro-hardness data were entered into
Microsoft Excel® (Microsoft Corporation, Redmond, Washington) for graphical analysis and
SPSS® version 17 (IBM Corporation, Chicago, Il) for statistical analysis.
2.4 Cantilever bend testing
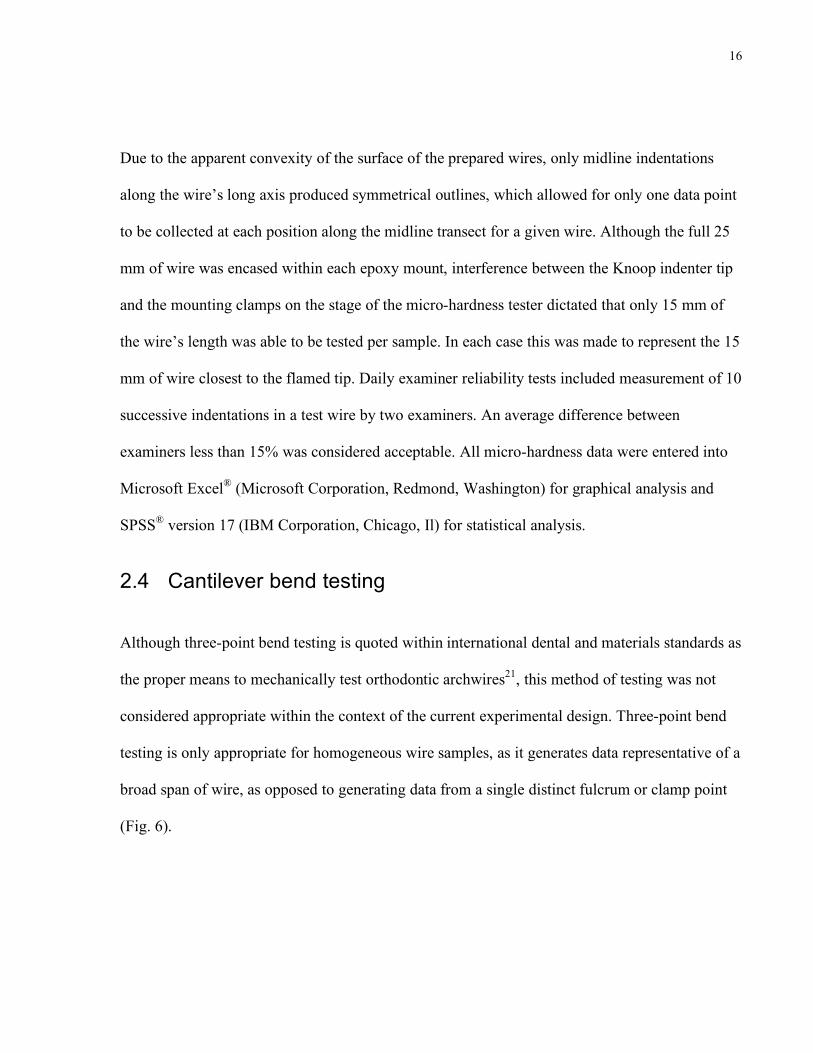
Although three-point bend testing is quoted within international dental and materials standards as
the proper means to mechanically test orthodontic archwires21, this method of testing was not
considered appropriate within the context of the current experimental design. Three-point bend
testing is only appropriate for homogeneous wire samples, as it generates data representative of a
broad span of wire, as opposed to generating data from a single distinct fulcrum or clamp point
(Fig. 6).
17
Figure 6. Test apparatus for 3-point bending. Dashed area represents heated segment of wire equivalent in length to that used in the current experiment.
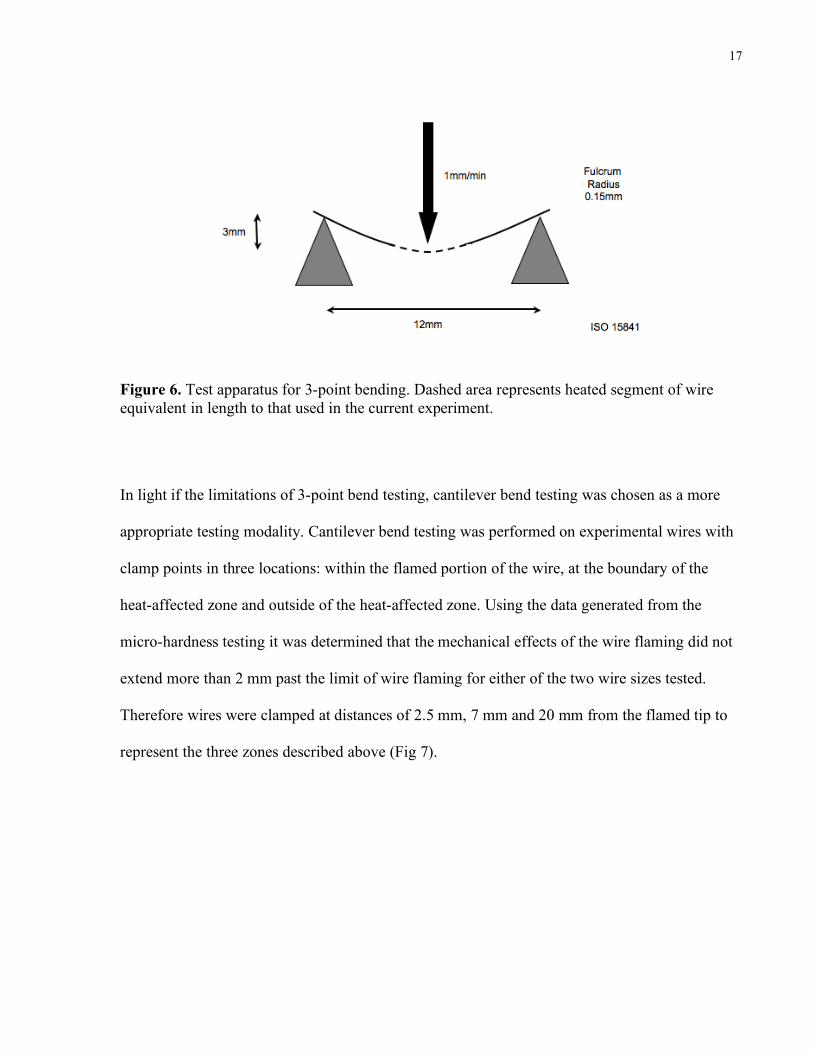
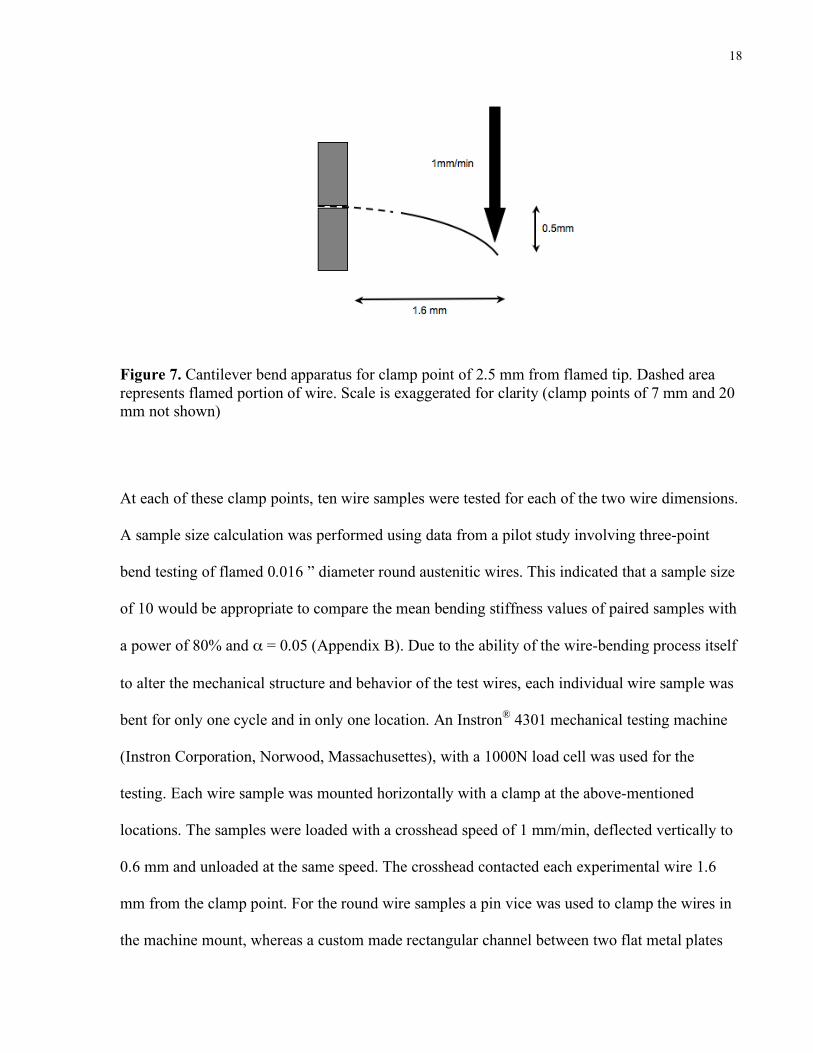
In light if the limitations of 3-point bend testing, cantilever bend testing was chosen as a more
appropriate testing modality. Cantilever bend testing was performed on experimental wires with
clamp points in three locations: within the flamed portion of the wire, at the boundary of the
heat-affected zone and outside of the heat-affected zone. Using the data generated from the
micro-hardness testing it was determined that the mechanical effects of the wire flaming did not
extend more than 2 mm past the limit of wire flaming for either of the two wire sizes tested.
Therefore wires were clamped at distances of 2.5 mm, 7 mm and 20 mm from the flamed tip to
represent the three zones described above (Fig 7).
18
Figure 7. Cantilever bend apparatus for clamp point of 2.5 mm from flamed tip. Dashed area represents flamed portion of wire. Scale is exaggerated for clarity (clamp points of 7 mm and 20 mm not shown)
At each of these clamp points, ten wire samples were tested for each of the two wire dimensions.
A sample size calculation was performed using data from a pilot study involving three-point
bend testing of flamed 0.016 ” diameter round austenitic wires. This indicated that a sample size
of 10 would be appropriate to compare the mean bending stiffness values of paired samples with
a power of 80% and α = 0.05 (Appendix B). Due to the ability of the wire-bending process itself
to alter the mechanical structure and behavior of the test wires, each individual wire sample was
bent for only one cycle and in only one location. An Instron® 4301 mechanical testing machine
(Instron Corporation, Norwood, Massachusettes), with a 1000N load cell was used for the
testing. Each wire sample was mounted horizontally with a clamp at the above-mentioned
locations. The samples were loaded with a crosshead speed of 1 mm/min, deflected vertically to
0.6 mm and unloaded at the same speed. The crosshead contacted each experimental wire 1.6
mm from the clamp point. For the round wire samples a pin vice was used to clamp the wires in
the machine mount, whereas a custom made rectangular channel between two flat metal plates
19
was used to secure the rectangular samples, ensuring that the flat face of the samples remained
perpendicular to the crosshead. The rectangular wires were all tested so that their greatest width
(0.025”) was subject to bending, in hopes of generating the greatest difference in bending
stiffness values when compared to the round wire samples due to the greater moment of inertia
associated with bending in this configuration. The crosshead itself was a rectangular iron rod
with cross sectional dimensions of 20 mm x 5 mm. In light of the fact that each wire sample was
cut from a preformed arch, there was a slight curvature to each of the samples. This made it
difficult to clamp each sample so that the crosshead contacted them all at the same instant during
its 0.6 mm cycle. However, as the data of interest from this testing included the slope of the
elastic portion of the curves during loading, and considering the magnitude of the force needed to
reach the super elastic plateau, we felt that it was not crucial to have a consistent end point
representing maximum deflection. Through an analysis of force/deflection plots generated from
several pilot samples, the data of interest was found to be available with wire defections of only
0.4 mm, allowing for considerable leeway in the total deflection needed for any given sample.
All load/deflection data were saved using Labview® software (National Instruments, Austin,
Texas) and later imported into Microsoft Excel® (Microsoft Corporation, Redmond,
Washington) for graphical analysis.
2.5 Statistical analysis
Upon confirmation of data normality, parametric testing using a one-way ANOVA test was
performed on the micro-hardness data to compare the means of the hardness values from outside
and inside the heated zone for each of the two wire sizes, to the values generated for the control
wires. Micro-hardness data from the transition zone separating heat-affected wire from
unaffected wire was not included in the analysis. For the 0.014” wires this zone extended from
20
5mm to 7mm and for the 0.019” x0.025” wires this zone extended from 4mm to 6mm from the
heated tip.
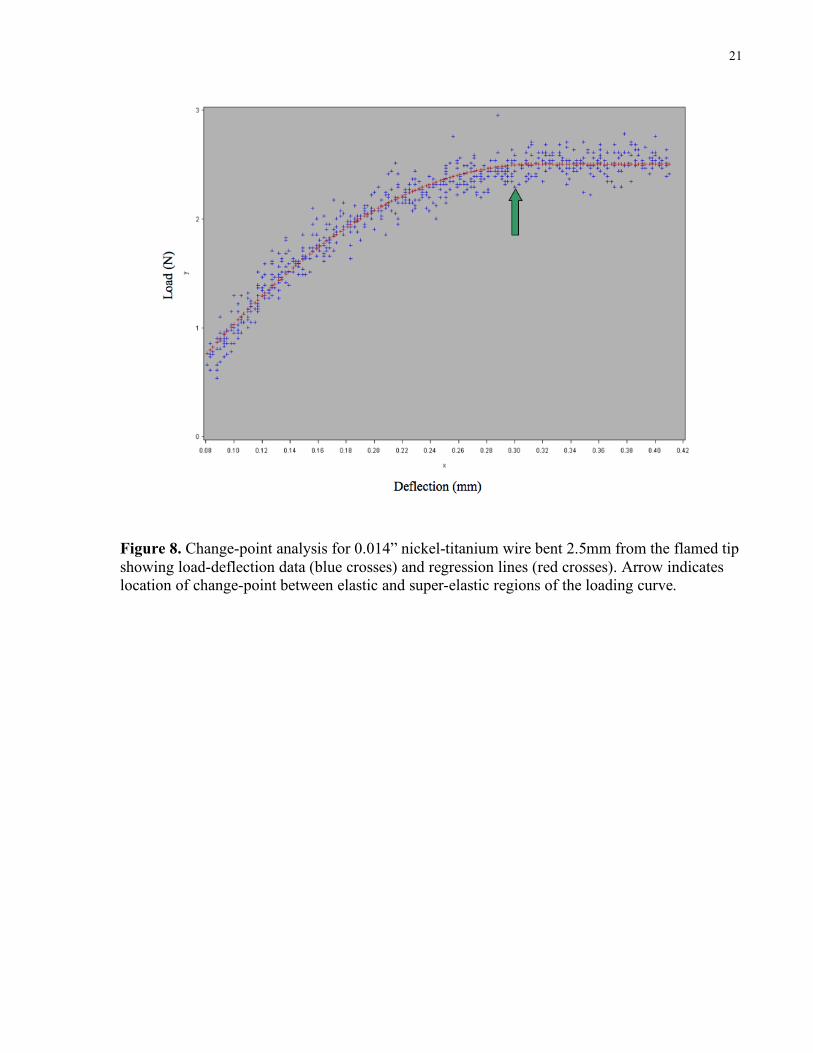
In order to calculate the force needed to reach the superelastic plateau from the load/deflection
data, it was necessary to perform a change-point analysis. Using SAS/STAT® software (SAS
Institute, Cary, North Carolina, USA), a non-linear regression model, using a quadratic line of
best fit, was applied to all test data that represented the initial loading slope. In addition, a linear
line of best fit was applied to the superelastic plateau regions of each load/deflection plot. The
force required to reach the super-elastic plateau was defined as the junction point of the quadratic
regression curve and the linear slope of the super-elastic plateau. The force value (N) associated
with this junction was recorded as the change-point value (Fig. 8). Upon confirmation of data
normality, an ANOVA test was used to compare the means of the change-point values between
the three bending locations and the respective control values, for each wire dimension. Post-hoc
adjustment for multiple comparisons of means was performed using the Sidak method.
21
Figure 8. Change-point analysis for 0.014” nickel-titanium wire bent 2.5mm from the flamed tip showing load-deflection data (blue crosses) and regression lines (red crosses). Arrow indicates location of change-point between elastic and super-elastic regions of the loading curve.
22
Chapter 3
Results
3.1 Micro-hardness testing
3.1.1 Testing of 0.014” wires
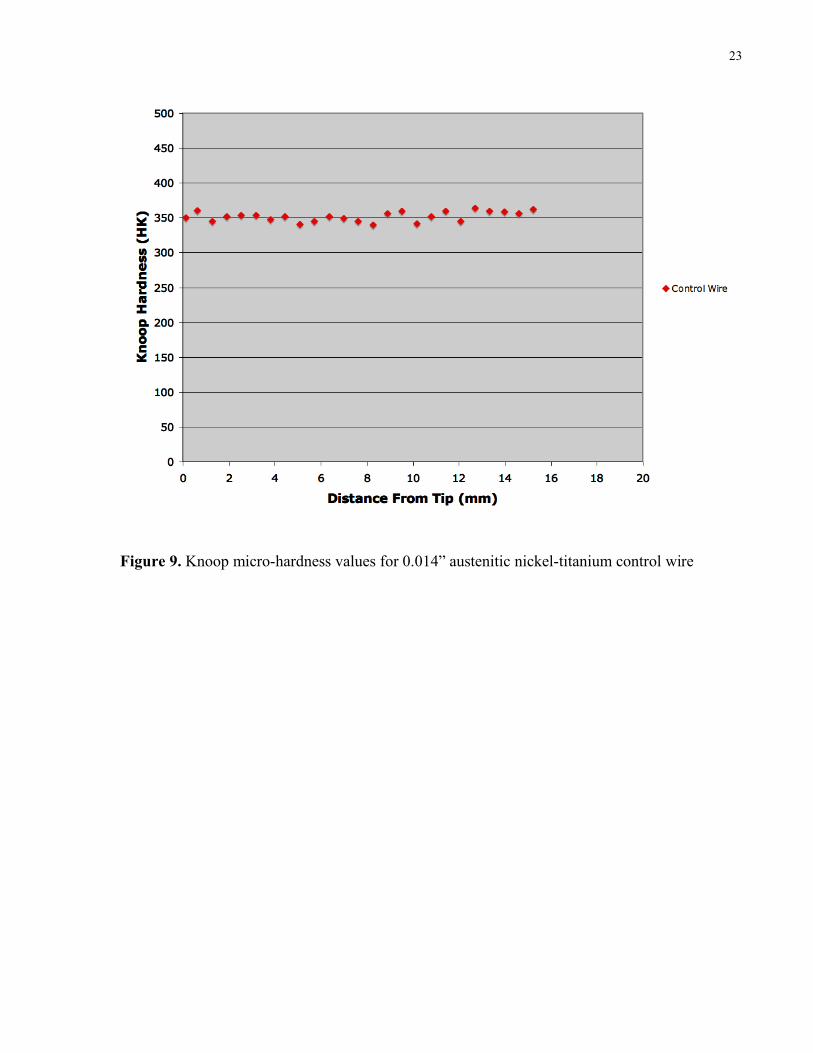
The control wire demonstrated an average Knoop Hardness value along its length of 352.16 HK
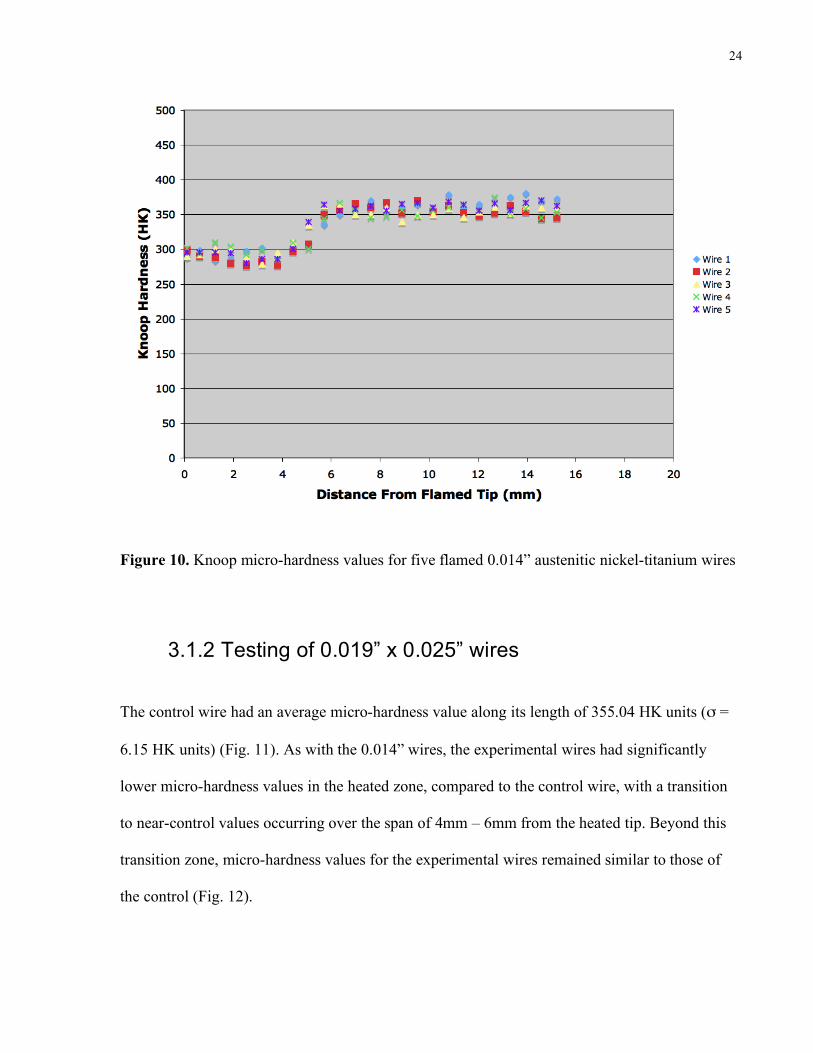
units (σ = 7.06 HK units) (Fig. 9). The experimental wires demonstrated significantly lower
micro-hardness values in the heated zone, compared to the control wire, with a transition to
higher values occurring over the span of 5 mm – 7 mm from the heated tip. Beyond this
transition zone, values remained similar to those of the control wire for the remainder of the
experimental wire’s length (Fig. 10).
23
Figure 9. Knoop micro-hardness values for 0.014” austenitic nickel-titanium control wire
24
Figure 10. Knoop micro-hardness values for five flamed 0.014” austenitic nickel-titanium wires
3.1.2 Testing of 0.019” x 0.025” wires
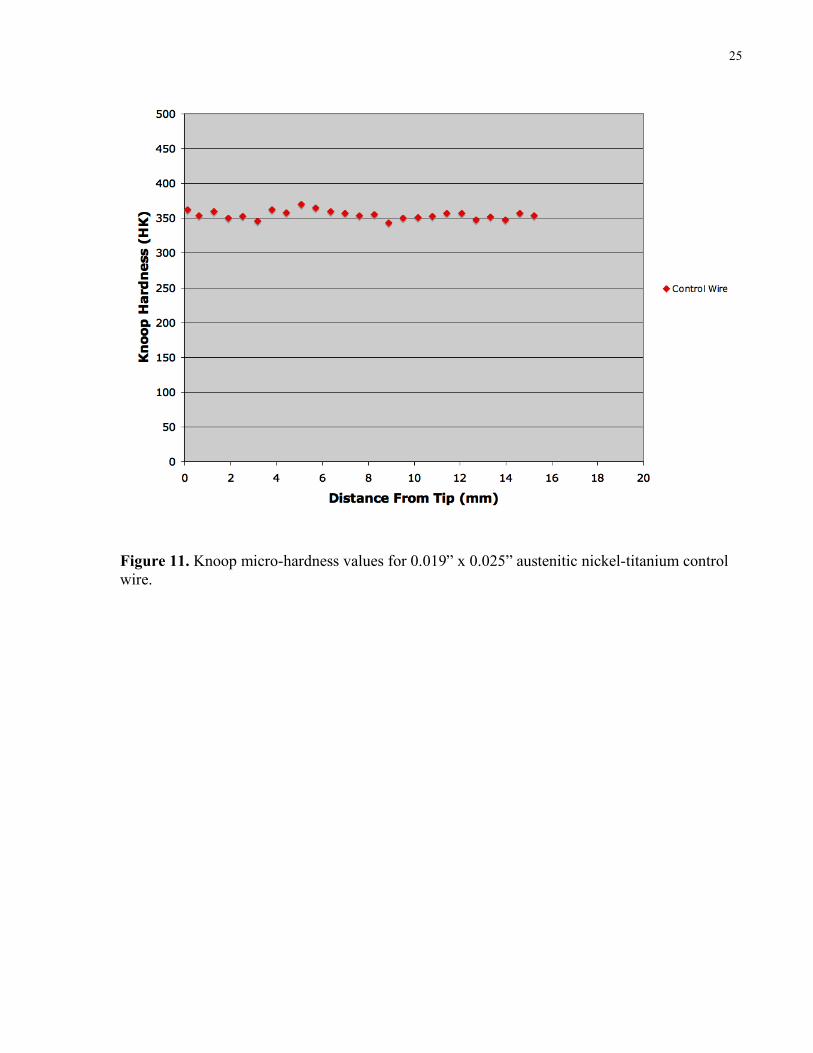
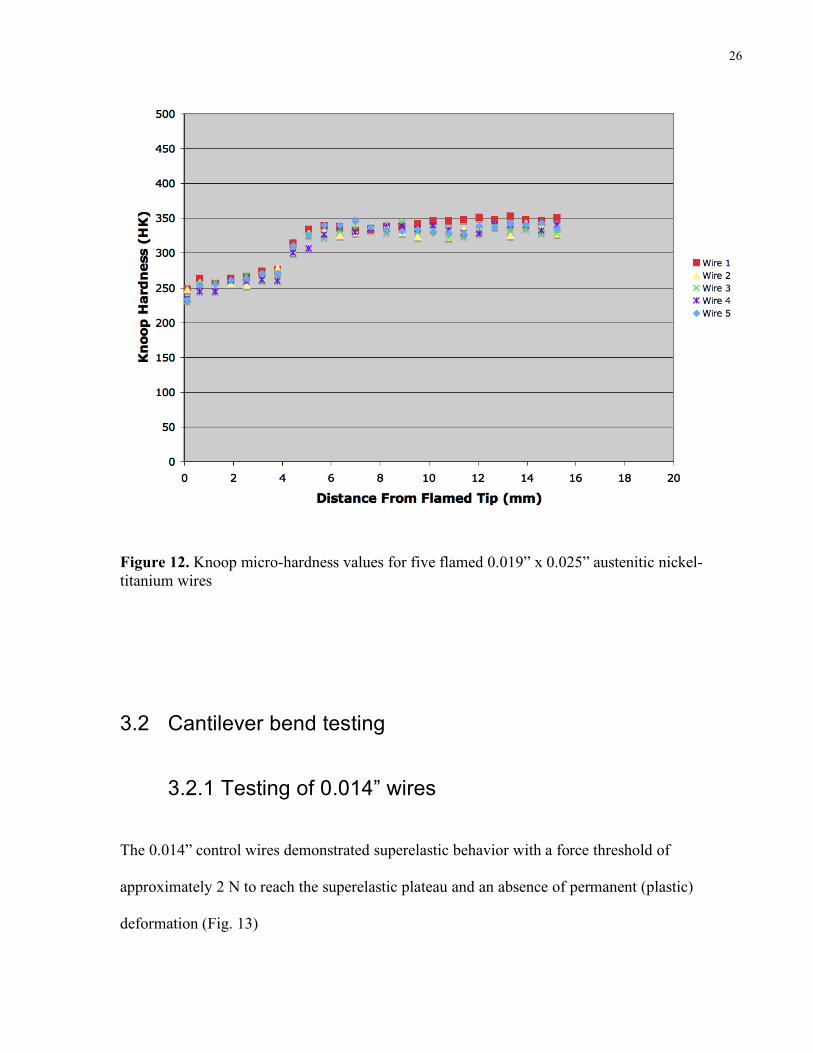
The control wire had an average micro-hardness value along its length of 355.04 HK units (σ =
6.15 HK units) (Fig. 11). As with the 0.014” wires, the experimental wires had significantly
lower micro-hardness values in the heated zone, compared to the control wire, with a transition
to near-control values occurring over the span of 4mm – 6mm from the heated tip. Beyond this
transition zone, micro-hardness values for the experimental wires remained similar to those of
the control (Fig. 12).
25
Figure 11. Knoop micro-hardness values for 0.019” x 0.025” austenitic nickel-titanium control wire.
26
Figure 12. Knoop micro-hardness values for five flamed 0.019” x 0.025” austenitic nickel-titanium wires
3.2 Cantilever bend testing
3.2.1 Testing of 0.014” wires
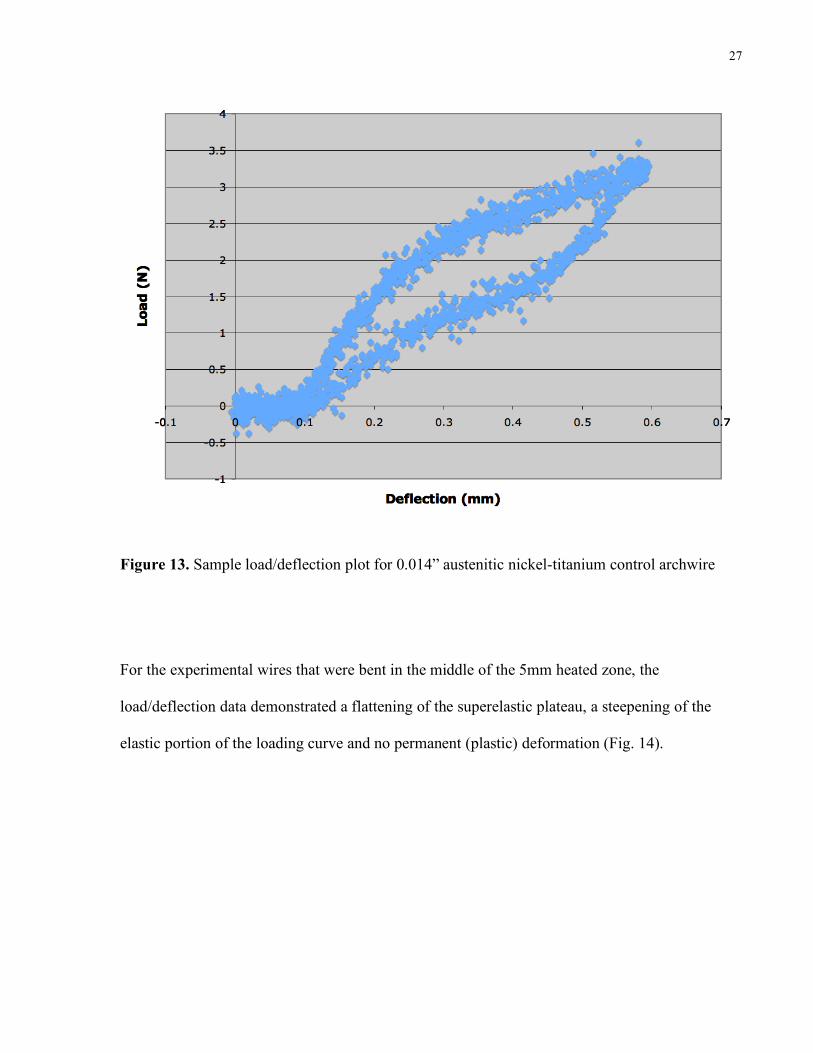
The 0.014” control wires demonstrated superelastic behavior with a force threshold of
approximately 2 N to reach the superelastic plateau and an absence of permanent (plastic)
deformation (Fig. 13)
27
Figure 13. Sample load/deflection plot for 0.014” austenitic nickel-titanium control archwire
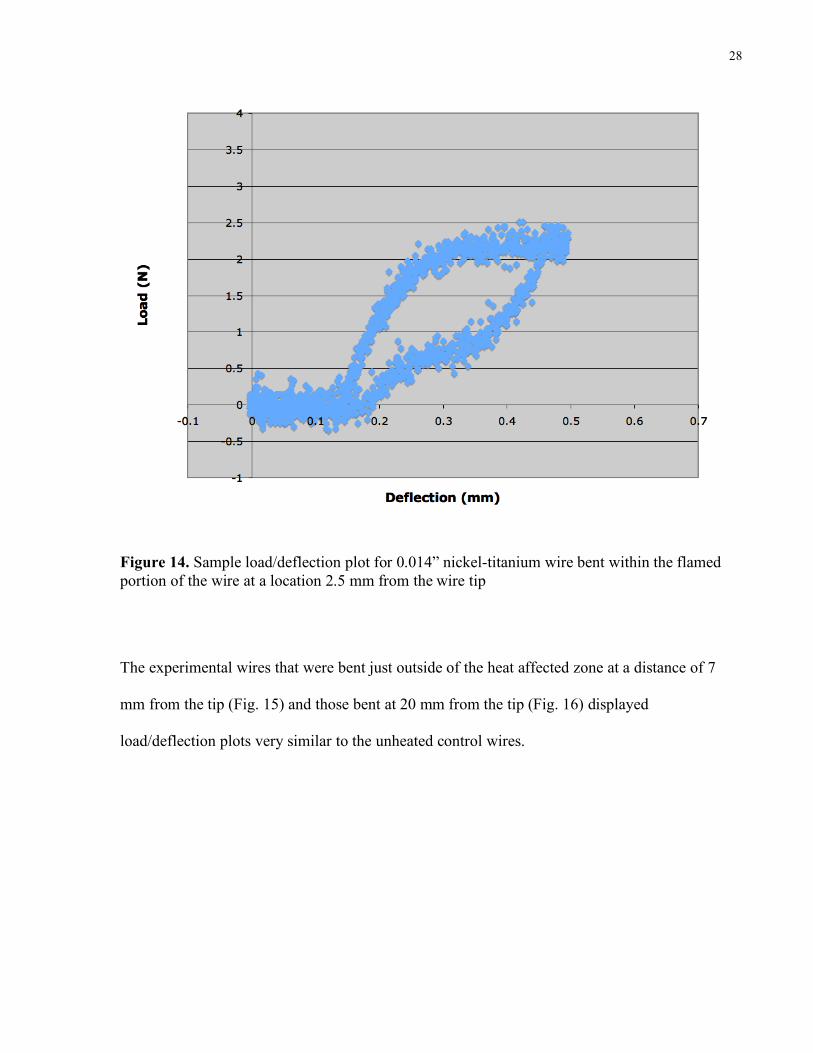
For the experimental wires that were bent in the middle of the 5mm heated zone, the
load/deflection data demonstrated a flattening of the superelastic plateau, a steepening of the
elastic portion of the loading curve and no permanent (plastic) deformation (Fig. 14).
28
Figure 14. Sample load/deflection plot for 0.014” nickel-titanium wire bent within the flamed portion of the wire at a location 2.5 mm from the wire tip
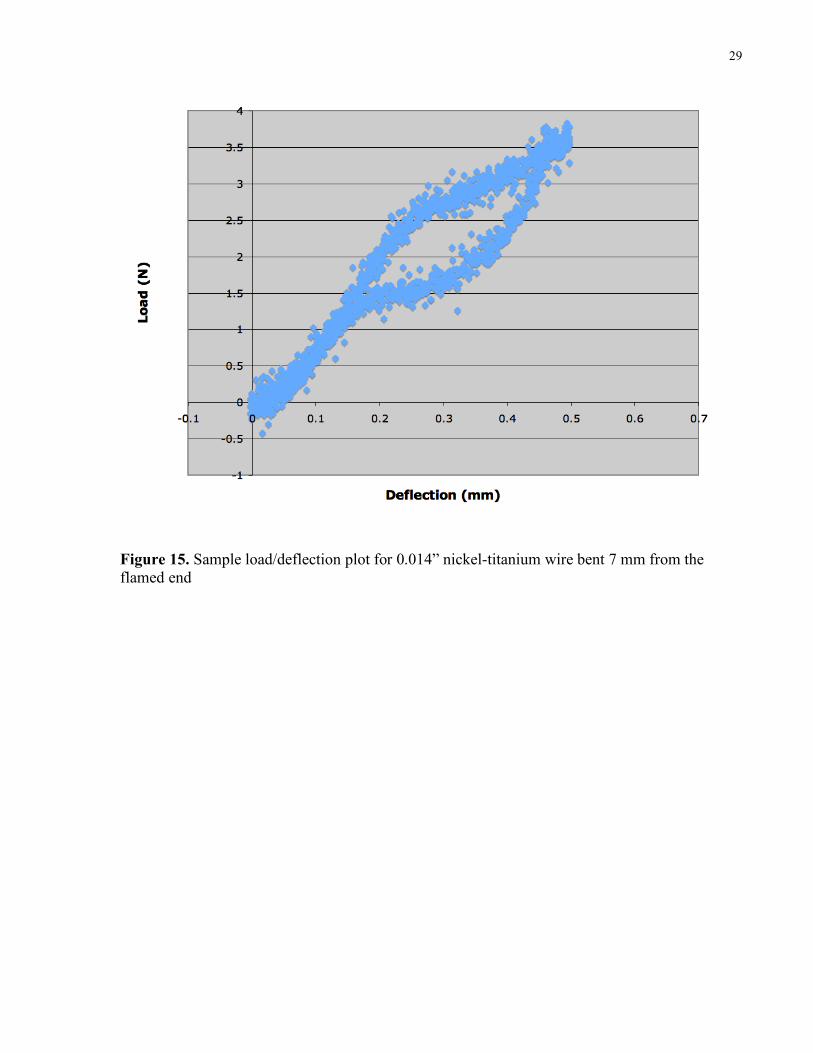
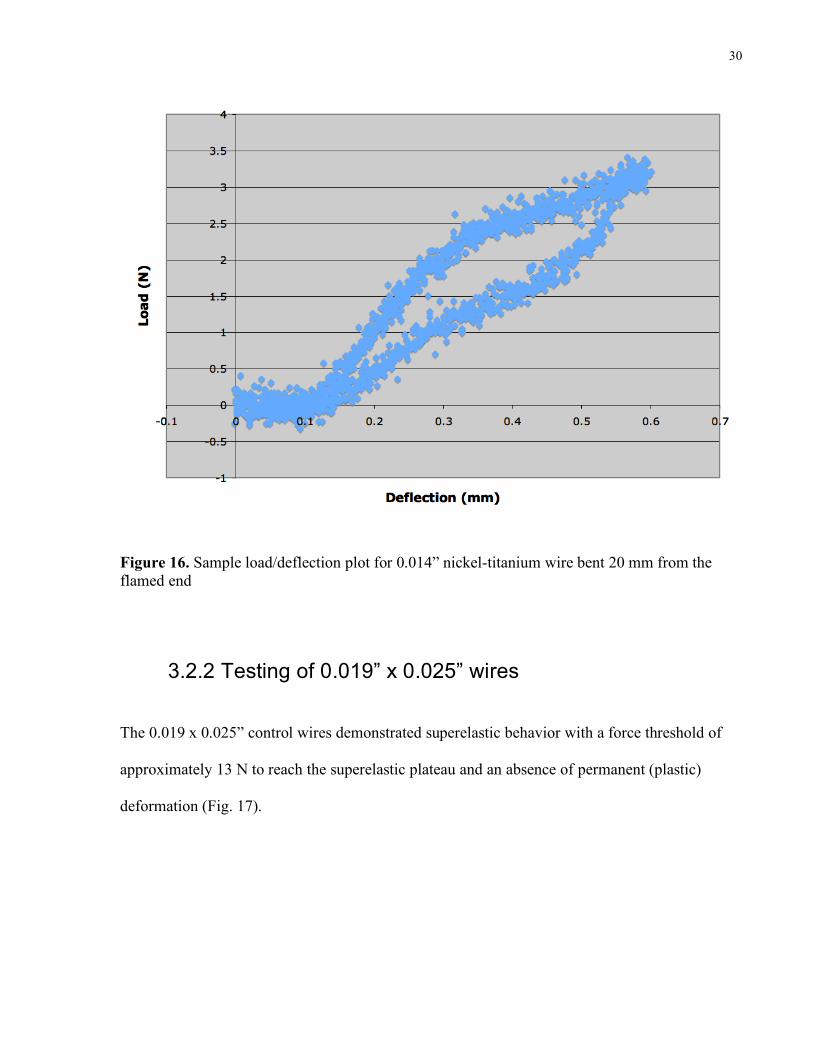
The experimental wires that were bent just outside of the heat affected zone at a distance of 7
mm from the tip (Fig. 15) and those bent at 20 mm from the tip (Fig. 16) displayed
load/deflection plots very similar to the unheated control wires.
29
Figure 15. Sample load/deflection plot for 0.014” nickel-titanium wire bent 7 mm from the flamed end
30
Figure 16. Sample load/deflection plot for 0.014” nickel-titanium wire bent 20 mm from the flamed end
3.2.2 Testing of 0.019” x 0.025” wires
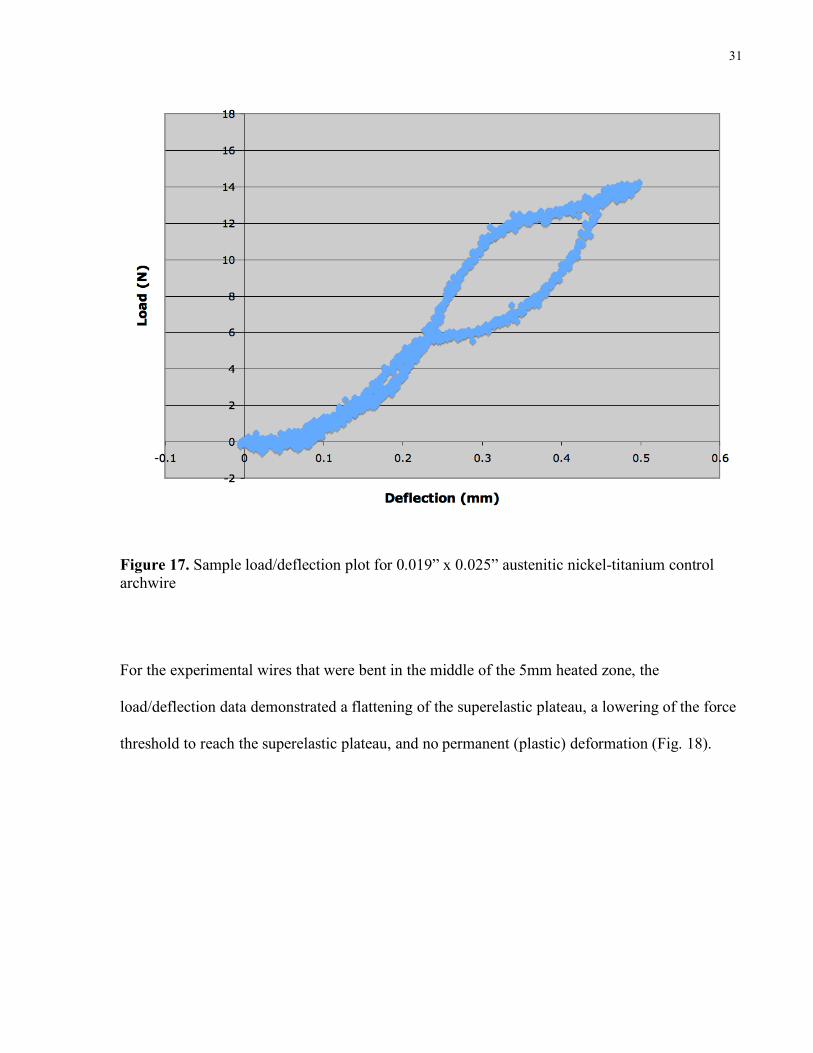
The 0.019 x 0.025” control wires demonstrated superelastic behavior with a force threshold of
approximately 13 N to reach the superelastic plateau and an absence of permanent (plastic)
deformation (Fig. 17).
31
Figure 17. Sample load/deflection plot for 0.019” x 0.025” austenitic nickel-titanium control archwire
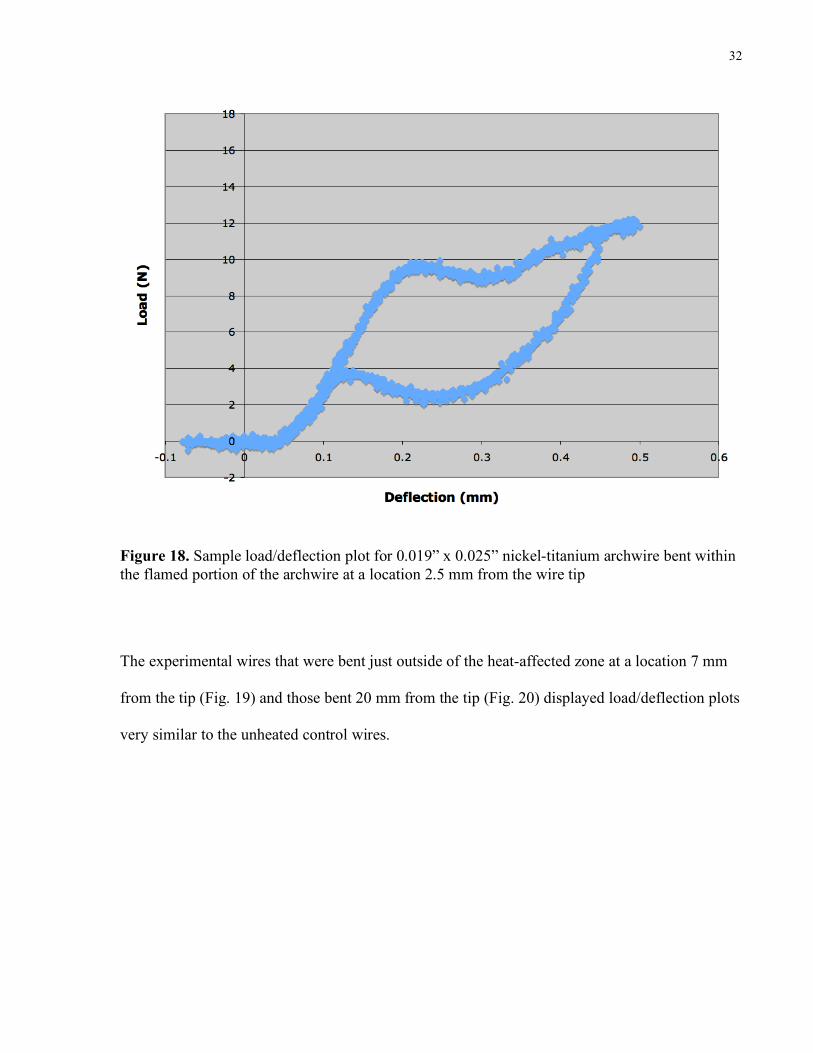
For the experimental wires that were bent in the middle of the 5mm heated zone, the
load/deflection data demonstrated a flattening of the superelastic plateau, a lowering of the force
threshold to reach the superelastic plateau, and no permanent (plastic) deformation (Fig. 18).
32
Figure 18. Sample load/deflection plot for 0.019” x 0.025” nickel-titanium archwire bent within the flamed portion of the archwire at a location 2.5 mm from the wire tip
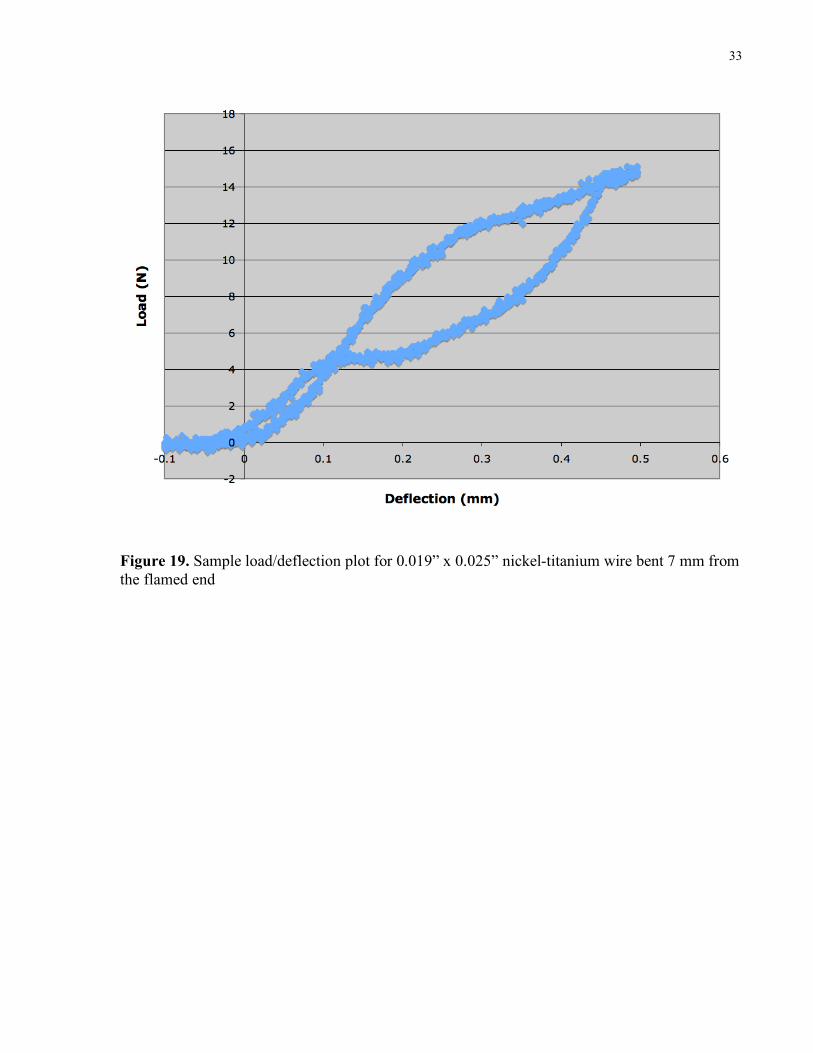
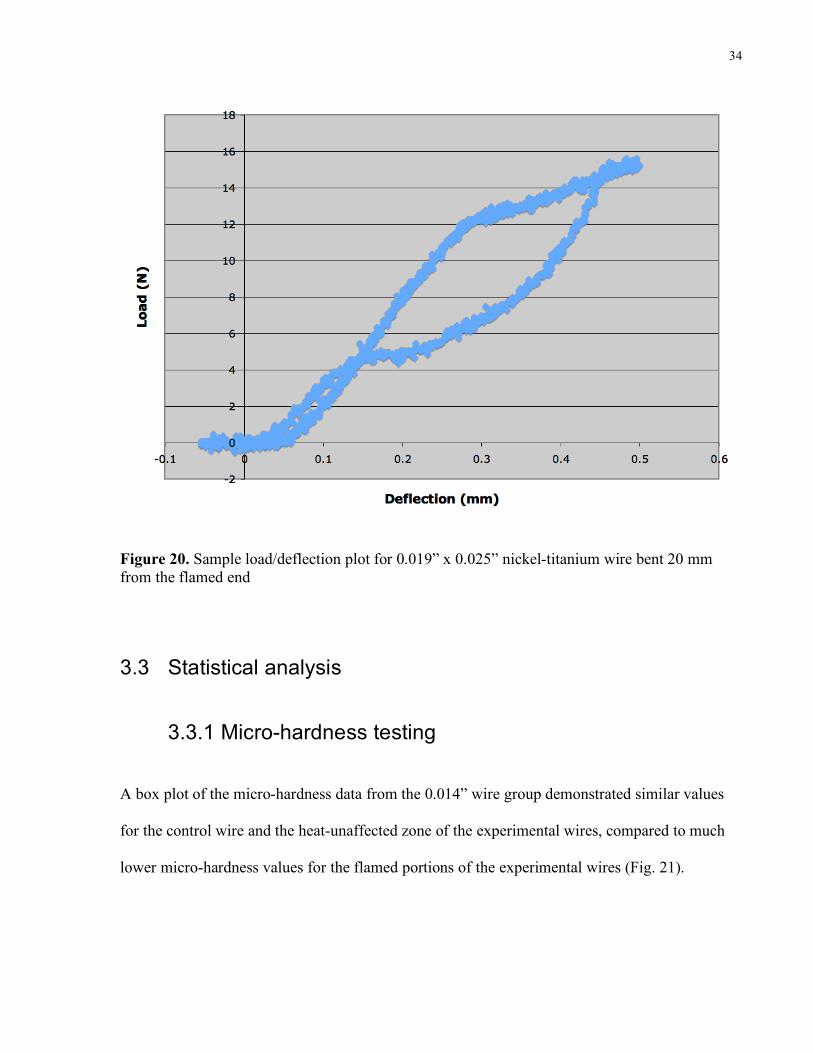
The experimental wires that were bent just outside of the heat-affected zone at a location 7 mm
from the tip (Fig. 19) and those bent 20 mm from the tip (Fig. 20) displayed load/deflection plots
very similar to the unheated control wires.
33
Figure 19. Sample load/deflection plot for 0.019” x 0.025” nickel-titanium wire bent 7 mm from the flamed end
34
Figure 20. Sample load/deflection plot for 0.019” x 0.025” nickel-titanium wire bent 20 mm from the flamed end
3.3 Statistical analysis
3.3.1 Micro-hardness testing
A box plot of the micro-hardness data from the 0.014” wire group demonstrated similar values
for the control wire and the heat-unaffected zone of the experimental wires, compared to much
lower micro-hardness values for the flamed portions of the experimental wires (Fig. 21).
35
Figure 21. Knoop micro-hardness data box plot for 0.014” wires. Outliers (dots) shown
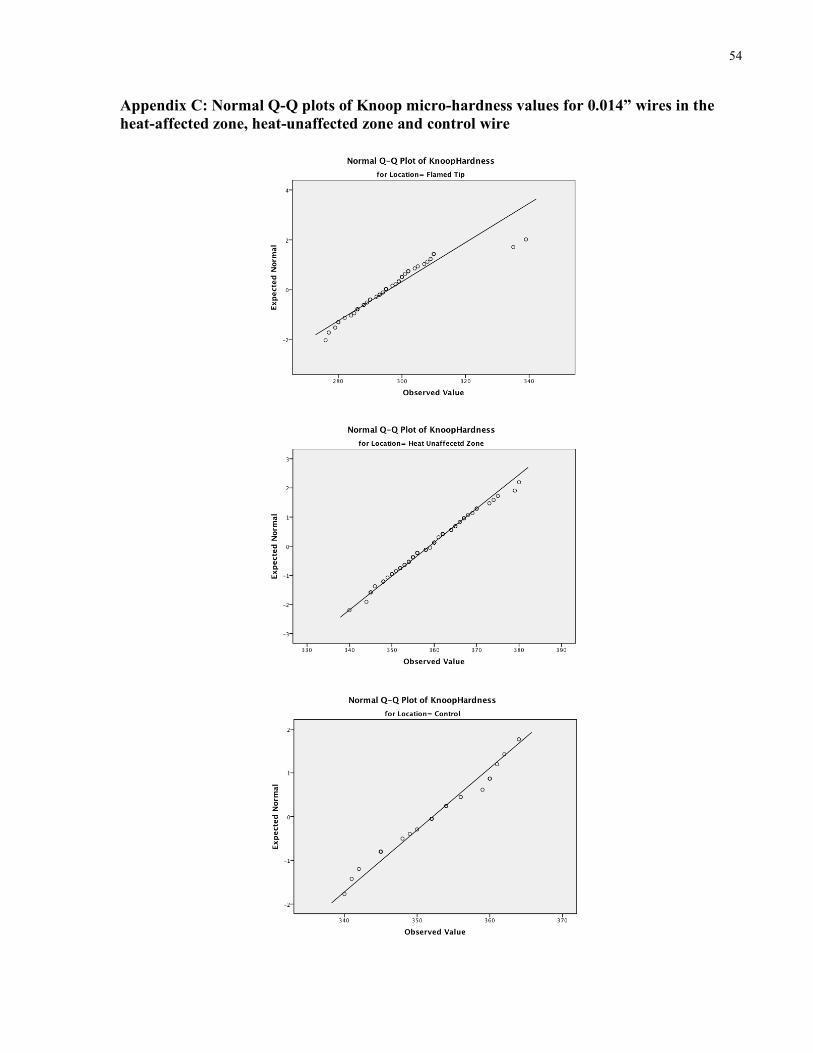
A close association of the 0.014” micro-hardness data with the predicted trend lines in the
normal Q-Q plots was found, confirming normality of the data (Appendix C).
Statistically significant differences were found in the Knoop micro-hardness data between the
locations assessed on the 0.014” experimental wires and the control wire (F statistic = 586.5 with
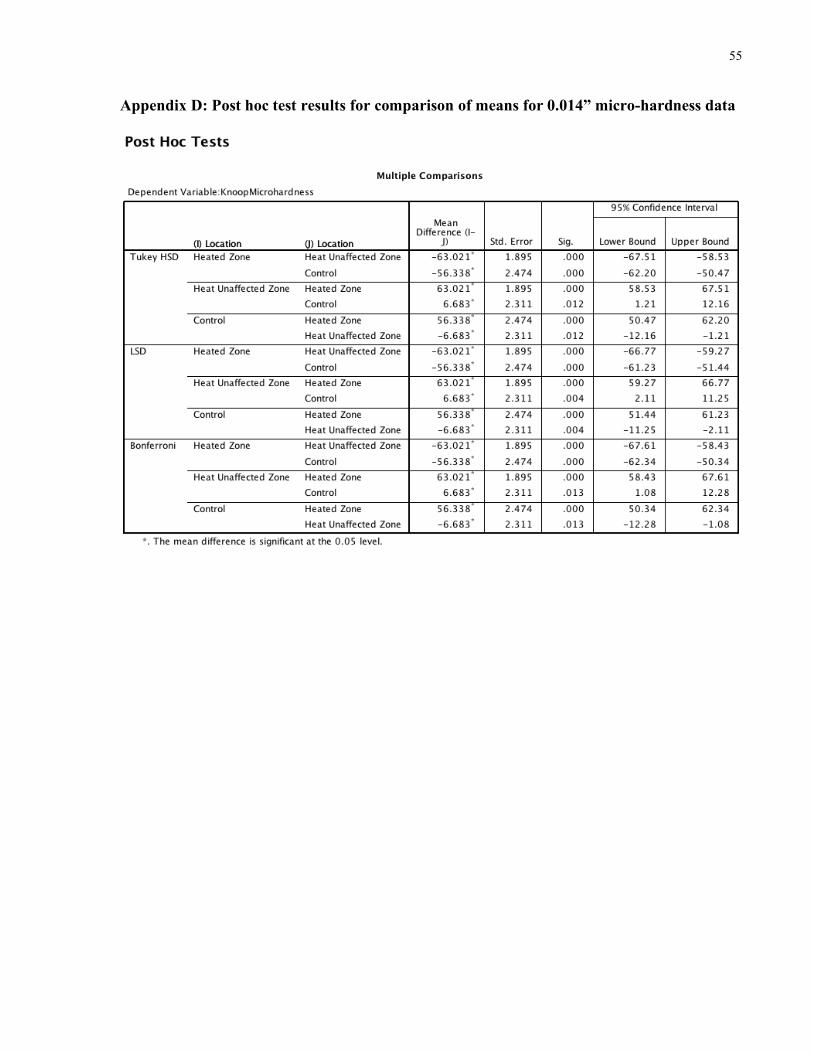
p = 0.00) (Table 1). Post hoc tests for multiple comparisons, identified significant differences
between the mean values of micro-hardness for all of the possible factor pairings with each p-
value < 0.05 (Appendix D)
36
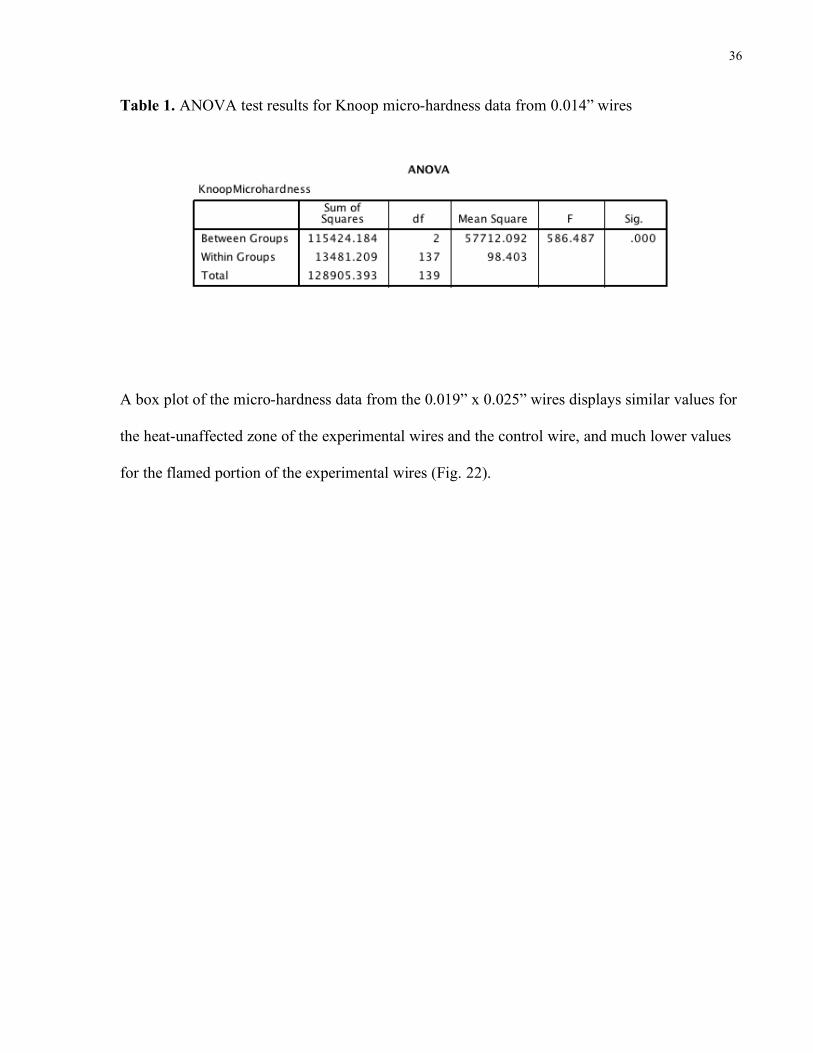
Table 1. ANOVA test results for Knoop micro-hardness data from 0.014” wires
A box plot of the micro-hardness data from the 0.019” x 0.025” wires displays similar values for
the heat-unaffected zone of the experimental wires and the control wire, and much lower values
for the flamed portion of the experimental wires (Fig. 22).
37
Figure 22. Knoop micro-hardness data box plot for 0.019” x 0.025” wires. Outliers (dots) shown
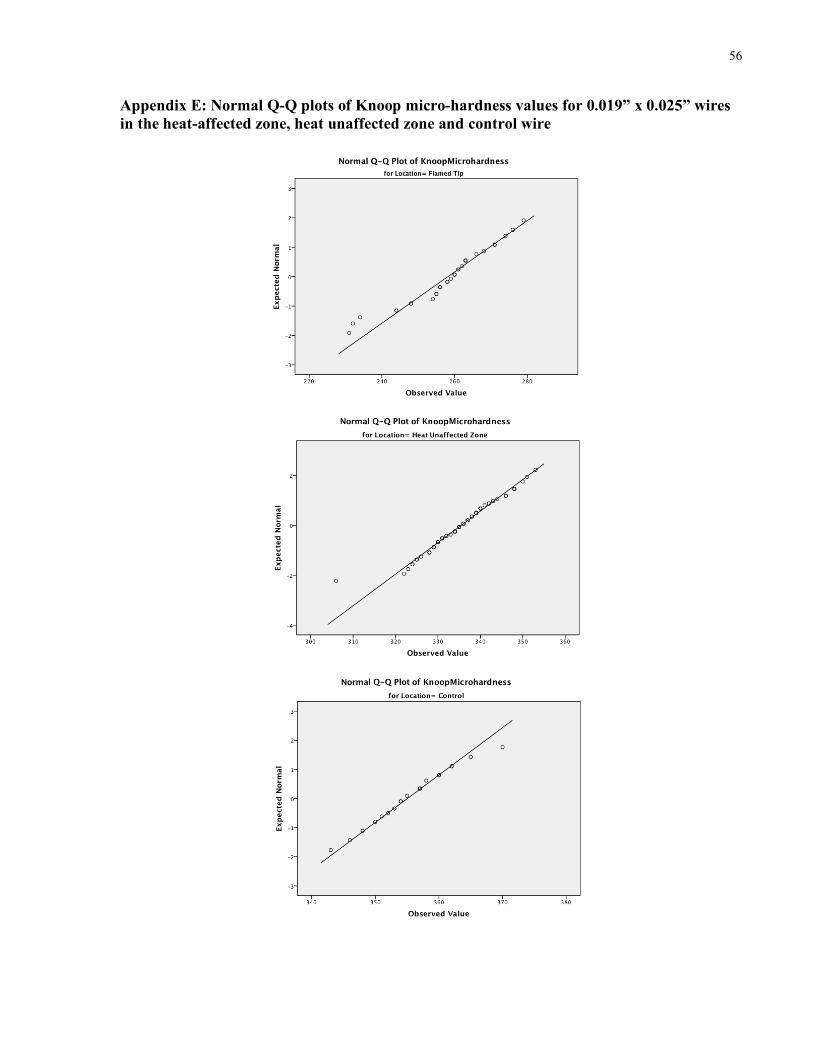
A close association with the predicted trend lines in normal Q-Q plots was found for the 0.019” x
0.025” wires, confirming normality of the micro-hardness data (Appendix E).
Statistically significant differences were found in the Knoop micro-hardness values between the
locations assessed on the 0.019” x 0.025” experimental wires and the control wire (F statistic =
1203.5 with p = 0.00) (Table 2). Post hoc tests for multiple comparisons found that there were
significant differences between the mean values of Knoop micro-hardness for all of the possible
factor pairings with each p-value < 0.05 (Appendix F).

38
Table 2. ANOVA test results for Knoop micro-hardness data from 0.019” x 0.025” wires
3.3.2 Cantilever bend testing
The box plot for the change-point data from the 0.014” wires displays similar values for
experimental wires bent 20 mm from the flamed tip and the control wires, with slightly higher
values for experimental wires bent 7 mm from the flamed tip and much lower values for wires
bent within the flamed region (Fig. 23).
39
Figure 23. Box plot for change-point analysis from 0.014” wires. Location 1 = 2.5 mm from flamed tip, location 2 = 7 mm from flamed tip, location 3 = 20 mm from flamed tip, location 4 = un-heated control
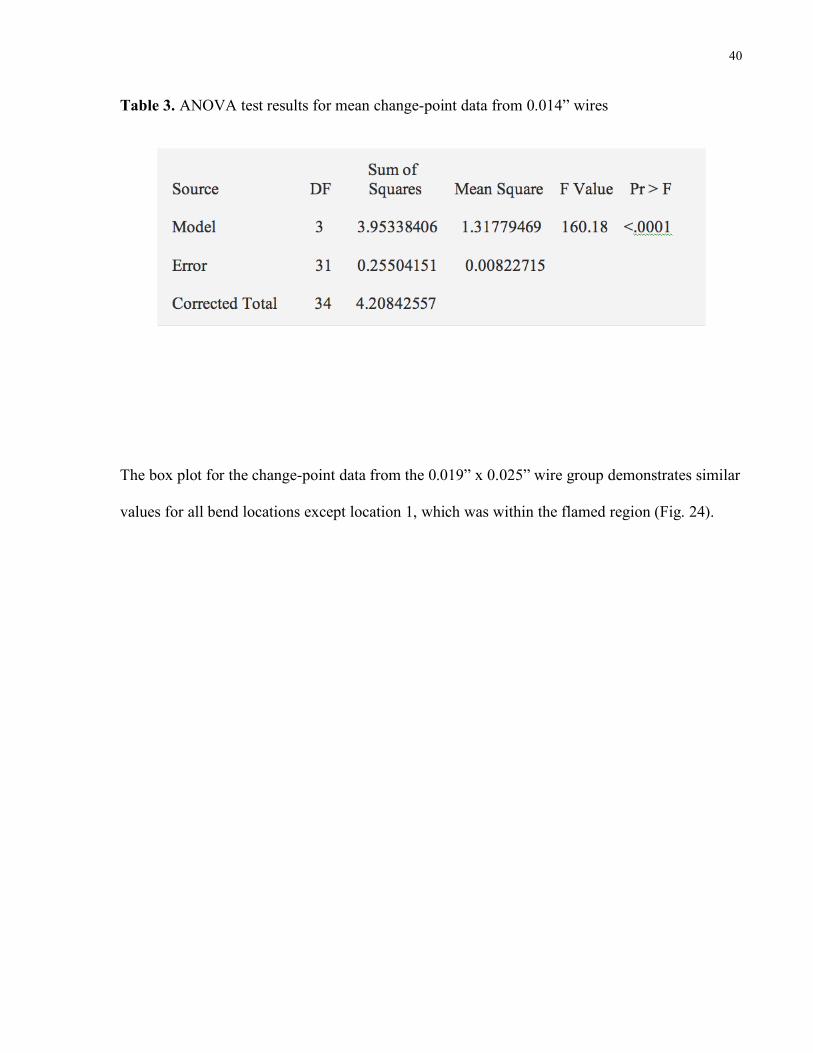
Statistically significant differences were found in the change-point values between the locations
assessed on the 0.014” experimental wires and the control wires (F statistic = 160.18 with p <
0.0001) (Table 3). Post hoc tests for multiple comparisons identified significant differences
between the mean change-point values for all possible factor pairings (p < 0.001) except between
location 3 (20 mm from flamed tip) and the control wire (p = 0.999). (Appendix G).
40
Table 3. ANOVA test results for mean change-point data from 0.014” wires
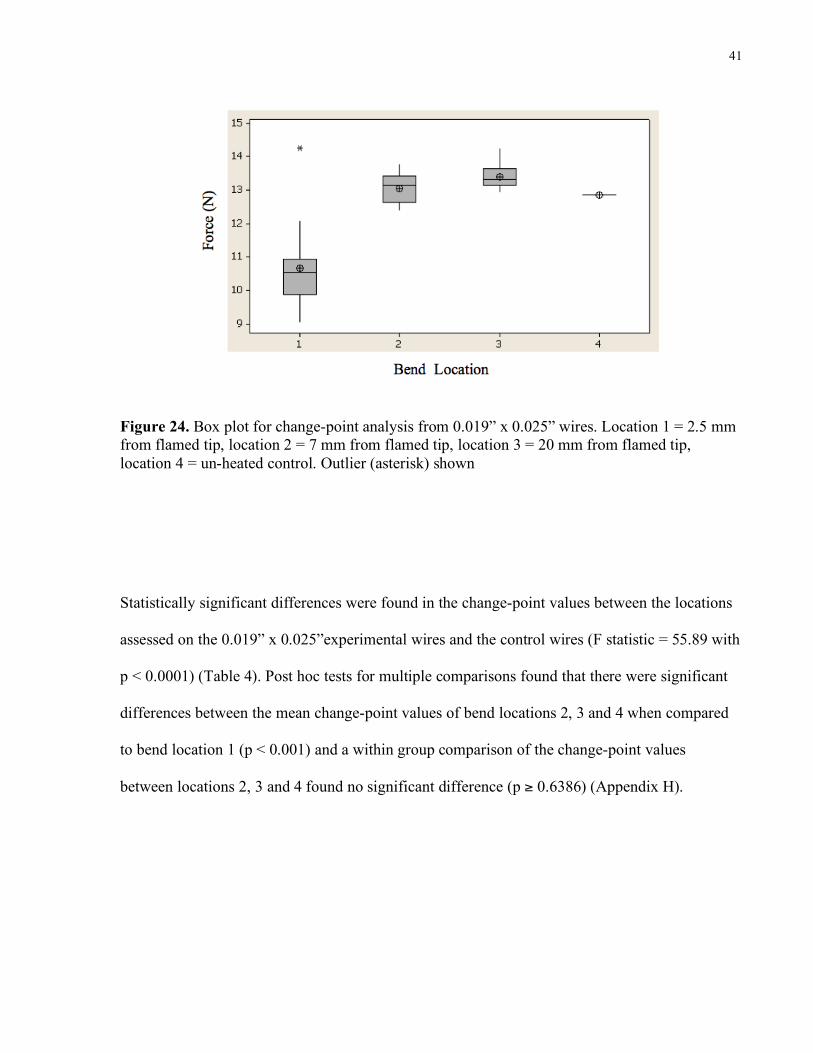
The box plot for the change-point data from the 0.019” x 0.025” wire group demonstrates similar
values for all bend locations except location 1, which was within the flamed region (Fig. 24).
41
Figure 24. Box plot for change-point analysis from 0.019” x 0.025” wires. Location 1 = 2.5 mm from flamed tip, location 2 = 7 mm from flamed tip, location 3 = 20 mm from flamed tip, location 4 = un-heated control. Outlier (asterisk) shown
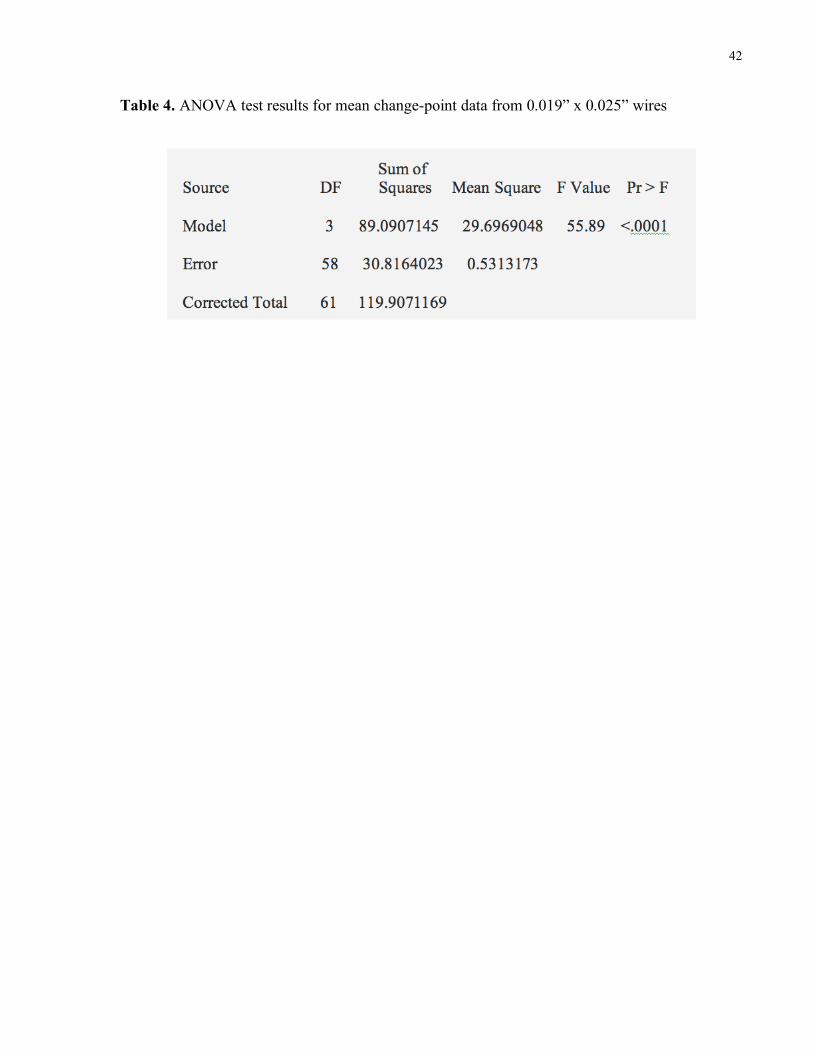
Statistically significant differences were found in the change-point values between the locations
assessed on the 0.019” x 0.025”experimental wires and the control wires (F statistic = 55.89 with
p < 0.0001) (Table 4). Post hoc tests for multiple comparisons found that there were significant
differences between the mean change-point values of bend locations 2, 3 and 4 when compared
to bend location 1 (p < 0.001) and a within group comparison of the change-point values
between locations 2, 3 and 4 found no significant difference (p ≥ 0.6386) (Appendix H).
42
Table 4. ANOVA test results for mean change-point data from 0.019” x 0.025” wires
43
Chapter 4
Discussion
4.1 Micro-hardness data
From the micro-hardness data it seems clear that the smaller gauge nickel-titanium wires used in
this study were able to conduct heat farther along their length than the larger rectangular wire
when exposed to flame for the same controlled period of time. The heat-affected zone for the
0.014” wires extended approximately 1 mm farther than the heat-affected zone for the 0.019” x
0.025” wires, which itself extended very little past the border of the 5 mm flamed region.
Knowing that the thermal conductance of a material is inversely proportional to its cross
sectional area (having units of W/K⋅m2)3, the larger cross section of the 0.019” x 0.025” wires
would require a higher input of heat energy (i.e. an increased exposure time to the butane flame)
to achieve the same transfer of heat observed in the smaller wires. With a cross sectional area
approximately 10x that of the 0.014” wires (1.1 mm2 versus 0.1 mm2), the 0.019” x 0.025” wires
might be expected to have a heat affected zone 1/10th as long as the 0.014” wires when using a
flaming protocol like the one outlined in this study. Although the resolution of the micro-
hardness data is insufficient to accurately quantify the absolute size difference between the heat-
affected zones for the two wire dimensions, the observable trend supports the theory that the
heat-affected zone of the 0.014” wires is significantly larger than that of the 0.019” x 0.025”
wires. This large difference in heat conductance between wire sizes would have significant
implications for clinical practice if the mode of archwire flaming by private practitioners was
known to be a timed exposure to flame. However, based on the 2007 survey results archwire
flaming in everyday clinical practice is based on a visual indicator (a red-hot wire) to signal the
44
end of flaming20. The increased time it takes for a thicker wire to get red-hot allows for a higher
input of heat energy from the flame, resulting in a larger heat-affected zone. Therefore, in private
practice the heat affected zone for all flamed nickel-titanium wires may be similar in extent,
based on the rationale that archwire flaming times are likely to vary between wire dimensions.
The analysis of the micro-hardness data showed a statistically significant difference between the
mean Knoop hardness values of the control wires to that of the heat-unaffected zone for each of
the wire dimensions tested, despite the observed overlap of the inter-quartile ranges from the box
plots. For the 0.014” group the control wire had a statistically significantly lower mean hardness
value than that of the heat-unaffected zone, while the 0.019” x 0.025” control wire demonstrated
higher mean hardness vales compared to the those of the heat unaffected zone. One possible
explanation for the differences between the means of the supposed ‘heat-unaffected’ zone in the
experimental wires to the controls is that the effects of wire flaming are transmitted the whole
length of the experimental wires. If this were the case we would expect that the direction of
change in mean micro-hardness compared to the controls (increased vs. decreased) would be the
same for both wire dimensions tested, which was not the case. It seems unlikely that the effect of
archwire flaming at a considerable distance from the flame would be an increase in micro-
hardness for one wire dimension and a decrease in micro-hardness for another. In addition, the
abrupt nature of the transition from heat-affected to ‘heat-unaffected’ wire, coupled with the fact
that the heat-unaffected values displayed little variation at all points farther than 7 mm from the
flamed tip, both support the hypothesis that the heat-unaffected micro-hardness values of the
experimental wires represent a true background ‘un-heated’ value. The reason why these heat-
unaffected zone values were not the exact same as the values obtained for the control wires may
be attributable to variations in the manufacturing process for the control wires compared to the
experimental wires used in the study.
45
4.2 Cantilever bending data
For the 0.019” x 0.025” wires, the change-point analysis indicated that the alterations in
mechanical behavior associated with wire flaming were largely isolated to the region of wire
immersed in the flame. With no statistically significant difference in the change-point values
between experimental wires bent 7 mm from the flamed tip and control wires, it seems clear that
the mechanical effects of archwire flaming extend very little past the region of wire immersed in
the flame itself for these larger wires. In contrast, the statistical analysis of the cantilever data
from the 0.014” wires showed that only those wires bent 20mm from the flamed tip had a mean
change-point that was statistically similar to that of the controls. This is consistent with the
observations from the micro-hardness data, which indicate that for smaller gauge wires the heat-
affected zone may be somewhat larger. This larger heat-affected zone may be related to the
increased thermal conductance of the 0.014” wires, as previously discussed. However, the fact
that the mean change-point values from the 7mm bend location were higher than that of the
controls for the 0.014” wires is not consistent with the conclusion that heating nickel-titanium
archwires lowers their super-elastic threshold. The increase in the mean change-point values
observed at the 7 mm bend location for the 0.014” wires may be related to the micro-structural
effects of partial wire heating, or may represent limitations of the regression analysis used to
calculate the change-point values in this study. It is evident from the literature that most authors
have demonstrated that archwire heating to high temperatures lowers the force needed to reach
the superelastic plateau15, 18, 19, although a slight increase in this force threshold was observed in
one study14. The ability of heating to either increase or decrease the super-elastic force threshold
may be related to complex interactions between temperature, exposure time and their effects on
phenomena such as grain growth, dislocation re-arrangement and grain re-crystallization.
46
Although the exact mechanism cannot be deduced from the data of this study, the lower energy
input experienced at the 7 mm bend location in the 0.014” wires (associated with conductance of
heat 2 mm past the zone of flame immersion) may result in a unique set of micro-structural
changes that increase the super-elastic force threshold. Further clarification of this hypothesis
could be achieved through a metallographic analysis of grain size and grain morphology changes
along the length of heated wires. The second possible explanation for the increase in mean
change-point values at the 7 mm bend location for the 0.014” wires is that the load-deflection
plots for the wires may be better represented by a cubic, rather than a quadratic regression line,
which may have resulted in a poor fit of the quadratic regression model to the experimental data.
However, as the model was applied to all of the bend-test data, and the fit was similar across all
data sets, it seems unlikely that this would have affected the inter-group comparisons of means
for only one wire size.
The mechanical behavior seen within the flamed sections of wire (i.e. those bent 2.5 mm from
the flamed tip) was similar for the two wire dimensions, including a lowering of the threshold to
reach the super-elastic plateau and a flattening of the super-elastic plateau itself. The ability of
archwire flaming to lower the force-threshold of the superelastic plateau and to flatten the slope
of plateau region itself may have important clinical consequences. If the flamed region of the
wire is actively engaged in a bracket or tube during orthodontic treatment, its mechanical
behavior may differ from that of un-heated wire, depending on the degree of activation. If the
wire is activated only enough to be in the elastic portion of its loading curve, its force delivery
per unit of deflection will be very similar to that of unheated wire, resulting in similar
mechanical behavior to unheated wires. However, if the heated wire is activated to the degree
that it enters the superelastic region, the lower superelastic threshold and flatter plateau will both
act to lower the force delivery per unit of wire activation. Even so, it remains unclear if this
47
magnitude of force change would result in a clinically appreciable difference in the nature of
orthodontic tooth movement achieved.
4.3 Recommendations for future study
The main purpose of archwire flaming in clinical practice is to enable the placement of a
permanent (plastic) bend in the wire. The current experimental design was limited in its ability to
absolutely quantify this change in two ways: 1) micro-hardness testing can only be used to
provide a relative measure of how easy it is to plastically deform a material using a particular
indenter tip under a given load; 2) the cantilever bend apparatus was only used to test the nickel-
titanium wires within the elastic and super-elastic portions of their effective range. The increased
tendency of the experimental wires to plastically deform within in the flamed zone, when
compared to non-flamed portions of the wire and to un-heated controls, was evident by the larger
indentations made by the Knoop indenter within the heated zone of both wire sizes. However,
because micro-hardness data is only a relative measure, it cannot be used to provide clinically
important information, such as the force threshold required to achieve plastic deformation for a
given wire dimension. In addition, it would have been difficult to modify the cantilever bend test
apparatus to measure the force threshold needed to achieve plastic deformation due to the
variable lag time between activation of the cross head and the time at which it made contact with
the curved wire samples. This variable lag time resulted in different amounts of total wire
deflection (i.e. differing maximum deflection angles) for each experimental wire. This would
have been a confounding variable in an attempt to quantify the degree of permanent (plastic)
strain introduced at a given deflection angle. An experimental design involving the use of
straight wire segments, as opposed to segments of pre-formed curved archwires, would help to
eliminate this problem in future studies. Quantifying permanent strain, or determining the force
48
threshold to achieve permanent strain, would aid orthodontic practitioners through an
understanding of what amount of wire activation is recoverable (i.e. will behave elastically) if a
flamed portion of nickel-titanium wire is used in a tooth borne portion of an active appliance.
The possibility that archwire flaming can change the surface properties and frictional
characteristics of nickel-titanium wires was not explored in the current study. The consequences
of archwire flaming, such as increases in grain size, the deposition of carbon, and the formation
of new intermetallic compounds, like Ti3Ni, all have the potential to alter the frictional
characteristics of nickel-titanium. Other investigations into the surface characteristics of post-
manufacture heat treatments (like autoclave sterilization) on nickel-titanium have demonstrated
that heating nickel-titanium increases its surface roughness22 and may increase its resistance to
sliding23. If this resistance to sliding is also increased by archwire flaming, than this could be
taken advantage of in clinical practice. For example, in a case where you do not want to lose the
mechanical anchorage afforded by a posterior tooth, such as a first permanent maxillary molar,
archwire flaming could be employed to increase the frictional resistance along the length of the
archwire that is engaged in that tooth. This would effectively increase the ‘anchorage value’ of
that tooth24, limiting its tendency to move forward along the archwire when traction forces are
applied. Due to the potential for flamed wires to deliver lower forces on bending, this technique
would best be employed on an anchor tooth that had already been brought onto good alignment,
possibly by a previous unheated wire. Further study into the frictional effects of archwire
flaming would help to determine if the magnitude of the predicted frictional change would have
a clinically observable impact on the biomechanical force system delivered to the tooth and
surrounding structures.
49
Chapter 5
Conclusions
Under the conditions of the current investigation the following conclusions can be drawn:
1) Flaming austenitic nickel-titanium orthodontic archwires with a butane lighter has the
ability to lower the force-threshold to reach the super-elastic plateau and to flatten the
super-elastic plateau within the portion of wire immersed in the flame, for both 0.014”
and 0.019” x 0.025” wires.
2) For a given flame exposure time, smaller diameter wires conduct heat further along their
length, slightly increasing the size of the heat-affected zone for these wires. The
transition from heat-affected wire to un-affected wire is relatively abrupt, spanning only
about 2 mm of wire for both wire dimensions tested.
3) The results of this study support the continued use of archwire flaming in clinical
orthodontic practice, as the mechanical effects of archwire flaming are largely isolated to
the portion of wire directly immersed in the flame.
50
References
1. Buehler W.J., J. V. Gilfrich, and R. C. Wiley. Effect of Low-Temperature Phase Changes on the Mechanical Properties of Alloys near Composition TiNi. J Appl Phys 1963; 34: 1475-1477.
2. Kauffman GB, Mayo I. The story of Nitinol: The Serendipitous Discovery of the Memory Metal and its Applications. Chedr 1996; 2(2): 1-22.
3. Smithells CJ. Smithells metals reference book. 8th ed. / edited by W.F. Gale, T.C. Totemeier., Boston: Elsevier Butterworth-Heinemann, 2004.
4. Thompson SA. An overview of nickel–titanium alloys used in dentistry. Int Endod J 2000; 33(4): 297-310.
5. Burstone CJ, Qin B, Morton JY. Chinese NiTi wire--a new orthodontic alloy. Am J Orthod 1985; 87(6): 445-452.
6. Gurgel JA, Kerr S, Powers JM, LeCrone V. Force-deflection properties of superelastic nickel-titanium archwires. American Journal of Orthodontics & Dentofacial Orthopedics 2001; 120(4): 378-382.
7. Otsuka K, Wayman CM. Shape memory materials. 1st, New York: Cambridge University Press, 1998.
8. Shabalovskaya SA[. Physicochemical and biological aspects of Nitinol as a biomaterial. International Materials Reviews 2001; 36: 233-250.
9. Andreasen GF, Hilleman TB. An evaluation of 55 cobalt substituted Nitinol wire for use in orthodontics. J Am Dent Assoc 1971; 82(6): 1373-1375.
10. Kusy RP. A review of contemporary archwires: their properties and characteristics. Angle Orthod 1997; 67(3): 197-207.
11. Tonner RI, Waters NE. The characteristics of super-elastic Ni-Ti wires in three-point bending. Part I: The effect of temperature. Eur J Orthod 1994; 16(5): 409-419.
12. Filleul MP, Jordan L. Torsional properties of Ni-Ti and copper Ni-Ti wires: the effect of temperature on physical properties. Eur J Orthod 1997; 19(6): 637-646.
13. Iijima M, Ohno H, Kawashima I, Endo K, Mizoguchi I. Mechanical behavior at different temperatures and stresses for superelastic nickel-titanium orthodontic wires having different transformation temperatures. Dental Materials 2002; 18(1): 88-93.
14. Kapila S, Haugen JW, Watanabe LG. Load-deflection characteristics of nickel-titanium alloy wires after clinical recycling and dry heat sterilization. American Journal of Orthodontics & Dentofacial Orthopedics 1992; 102(2): 120-126.
51
15. Alavi S, Raji SH, Ghorbani AA. Effects of steam and dry-heat sterilization on bending properties of NiTi wires. Orthodontic Waves 2009; 68(3): 123-128.
16. Reed RJ. North American combustion handbook : a basic reference on the art and science of industrial heating with gaseous and liquid fuels. 3rd ed. --, Cleveland, OH, USA: North American Mfg. Co., 1986.
17. Williamson JW, Marshall AW. Characterizing the ignition hazard from cigarette lighter flames. Fire Saf J 2005; 40(1): 29-41.
18. Khier SE, Brantley WA, Fournelle RA. Bending properties of superelastic and nonsuperelastic nickel-titanium orthodontic wires. American Journal of Orthodontics & Dentofacial Orthopedics 1991; 99(4): 310-318.
19. Miura F, Mogi M, Ohura Y, Hamanaka H. The super-elastic property of the Japanese NiTi alloy wire for use in orthodontics. American Journal of Orthodontics and Dentofacial Orthopedics 1986; 90(1): 1-10.
20. MacLeod DM, Filiaggi M, Hall G. The mechanical and microstructural effects of flaming nickel titanium orthodontic archwires - a pilot study. 2007.
21. International Standard ISO 15841: 2006 Dentistry - Wires for use in Orthodontics.
22. Alexandrou G, Chrissafis K, Vasiliadis L, Pavlidou E, Polychroniadis EK. Effect of heat sterilization on surface characteristics and microstructure of Mani NRT rotary nickel-titanium instruments. Int Endod J 2006; 39(10): 770-778.
23. Lee SH, Chang YI. Effects of recycling on the mechanical properties and the surface topography of nickel-titanium alloy wires. American Journal of Orthodontics and Dentofacial Orthopedics 2001; 120(6): 654-663.
24. Proffit WR. Contemporary orthodontics. 4th ed., St. Louis, Mo.: Mosby Elsevier, 2007.
52
Appendices
Appendix A: Results of 2007 survey on archwire flaming20
The response rate for the mail survey was 77.4 % (103 responses out of 133 surveys mailed).
Two surveys were returned due to un-deliverable addresses and the remaining 28 surveys were
unaccounted for after 2 months. Of the 103 respondents, 102 (or 99%) reported using NiTi
archwires in their orthodontic practice, with 70% (71 practitioners) admitting to flaming the
archwires in order to facilitate placing a permanent (plastic) bend at the end of the wire. For this
group, 68% reported using a conventional cigarette lighter, 32% routinely used a hand-held
torch, while 8% used matches. Some practitioners reported using more than one of the above
methods of wire flaming in their practice. All 71 practitioners used a change in color (i.e. to red)
as a means to determine if the wire had been adequately heated during flaming. The average
duration for wire flaming was calculated at 3.44 seconds, with a maximum reported flaming time
of 15 seconds and a minimum reported flaming time of 0.5 seconds. The average length of wire
placed in the flame was calculated as 4.54 mm, with a maximum reported length of 20 mm and a
minimum reported length of 0.2 mm.

53
Appendix B: Sample size calculation
Based on bending stiffness values from a pilot study of 0.016” Austenitic nickel-titanium wires
(n=10) flamed for 2 sec and tested in 3-point bending apparatus
For comparison of two population means from paired samples:
n = 0.1642 x (1.96 + 0.84)2 / 1.3972
n = 10.8
(power = 80%, α = 0.05)
54
Appendix C: Normal Q-Q plots of Knoop micro-hardness values for 0.014” wires in the heat-affected zone, heat-unaffected zone and control wire
55
Appendix D: Post hoc test results for comparison of means for 0.014” micro-hardness data
56
Appendix E: Normal Q-Q plots of Knoop micro-hardness values for 0.019” x 0.025” wires in the heat-affected zone, heat unaffected zone and control wire
57
Appendix F: Post hoc test results for comparison of means for 0.019”x 0.025” micro-hardness data

58
Appendix G: Post hoc test results for comparison of means for 0.014” change-point data
59
Appendix H: Post hoc test results for comparison of means for 0.019” x 0.025” change-point data