The McGraw-Hill Companies, Inc. 2006McGraw-Hill/Irwin Chapter Nine Accounting for Long-Term...
43
The McGraw-Hill Companies, Inc. 2006 McGraw-Hill/Irwin Chapter Nine Accounting for Long-Term Operational Assets
-
Upload
kevin-perkins -
Category
Documents
-
view
219 -
download
0
Transcript of The McGraw-Hill Companies, Inc. 2006McGraw-Hill/Irwin Chapter Nine Accounting for Long-Term...

The McGraw-Hill Companies, Inc. 2006McGraw-Hill/Irwin
Chapter Nine
Accounting for Long-Term Operational Assets

Tangible versus Intangible Assets
Tangible assets have a physical presence; they can be seen and
touched. Intangible assets are rights or privileges. They cannot be seen or
touched.

Tangible Long-Term Assets
1.1. Property, Plant, and EquipmentProperty, Plant, and Equipment – Sometimes called plant assets or fixed assets. We depreciate these assets over their useful life.
2.2. Natural ResourcesNatural Resources – Mineral deposits, oil and gas reserves, timber stands, coal mines, and stone quarries are some examples of natural resources. We deplete these assets over their useful life.
3.3. LandLand – Has an infinite life and is not subject to depreciation.

Intangible Assets
1.1. Intangible Assets with Identifiable Useful LivesIntangible Assets with Identifiable Useful Lives – These intangibles include patents and copyrights. We amortize the cost of each over its useful life.
2.2. Intangible Assets with Indefinite Useful LivesIntangible Assets with Indefinite Useful Lives - These intangibles include renewable franchises, trademarks, and goodwill. The cost of these assets is not expensed unless it can be shown that there has been an impairment in value.

Cost of Long-Term Assets
Buildings –Buildings –•Purchase price,Purchase price,•Sales taxes,Sales taxes,•Title search and transfer document Title search and transfer document costs,costs,•Realtor’s and attorney’s fees, andRealtor’s and attorney’s fees, and•Remodeling costs.Remodeling costs.
Buildings –Buildings –•Purchase price,Purchase price,•Sales taxes,Sales taxes,•Title search and transfer document Title search and transfer document costs,costs,•Realtor’s and attorney’s fees, andRealtor’s and attorney’s fees, and•Remodeling costs.Remodeling costs.
Equipment –Equipment –•Purchase price (less Purchase price (less discounts),discounts),•Sales taxes,Sales taxes,•Delivery costs,Delivery costs,•Installation costs, andInstallation costs, and•Costs to adapt to intended Costs to adapt to intended use.use.
Equipment –Equipment –•Purchase price (less Purchase price (less discounts),discounts),•Sales taxes,Sales taxes,•Delivery costs,Delivery costs,•Installation costs, andInstallation costs, and•Costs to adapt to intended Costs to adapt to intended use.use.

Cost of Long-Term Assets
Land –Land –•Purchase price,Purchase price,•Sales taxes,Sales taxes,•Title search and transfer document Title search and transfer document costs,costs,•Realtor’s and attorney’s fees, Realtor’s and attorney’s fees, •Costs of removal of old buildings, Costs of removal of old buildings, andand•Grading costs.Grading costs.
Land –Land –•Purchase price,Purchase price,•Sales taxes,Sales taxes,•Title search and transfer document Title search and transfer document costs,costs,•Realtor’s and attorney’s fees, Realtor’s and attorney’s fees, •Costs of removal of old buildings, Costs of removal of old buildings, andand•Grading costs.Grading costs.

Basket Purchase AllocationMatrix, Inc. purchased land and a building for $5,000,000 cash. An independent appraiser
estimated that the land has a fair market value of $2,000,000, and the building has a fair market
value of $6,000,000. How will we assign the $5,000,000 cost between the land and building?
Amount %Fair market value of building 6,000,000$ 75%Fair market value of land 2,000,000 25%Total fair market value 8,000,000$ 100%
Cost % AllocationAssign to building 5,000,000$ 75% 3,750,000$ Assign to land 5,000,000 25% 1,250,000
100% 5,000,000$

Life Cycle of Operational Assets
AcquireFunding
BuyAsset
UseAsset
RetireAsset

Depreciation Method1.1. Straight-line methodStraight-line method - the same amount - the same amount
of depreciation is taken each accounting of depreciation is taken each accounting period.period.
2.2. Double-declining-balance Double-declining-balance – produces – produces more depreciation expense in the early more depreciation expense in the early years of an asset’s life, with a declining years of an asset’s life, with a declining amount of expense in later years.amount of expense in later years.
3.3. Units-of-ProductionUnits-of-Production – produces varying – produces varying amounts of depreciation in different amounts of depreciation in different accounting periods depending upon the accounting periods depending upon the number of units produced.number of units produced.
1.1. Straight-line methodStraight-line method - the same amount - the same amount of depreciation is taken each accounting of depreciation is taken each accounting period.period.
2.2. Double-declining-balance Double-declining-balance – produces – produces more depreciation expense in the early more depreciation expense in the early years of an asset’s life, with a declining years of an asset’s life, with a declining amount of expense in later years.amount of expense in later years.
3.3. Units-of-ProductionUnits-of-Production – produces varying – produces varying amounts of depreciation in different amounts of depreciation in different accounting periods depending upon the accounting periods depending upon the number of units produced.number of units produced.

Asset to be DepreciatedList price of truck 23,500$ Cash discount (2,350) Transportation cost 250 Cost of customization 2,600 Cost of truck 24,000$
The truck has a salvage value of $4,000, and an estimated useful life of four years.

Straight-Line Depreciation
Life Cycle Phase 1Acquire $25,000 cash from the sale of common stock to purchase the truck.
= Liab. + Rev. – Exp. = Net Inc. Cash Flow
Cash + Truck A. Depr.+ Com. Stk. Ret. Earn.25,000 NA = NA + 25,000 NA NA – NA = NA 25.000 FA
EquityAssets

Straight-Line Depreciation
Life Cycle Phase 2Purchase the truck on January 1, 2006, for a
net cost of $24,000.= Liab. + Rev. – Exp. = Net Inc. Cash Flow
Cash + Truck A. Depr.+ Com. Stk. Ret. Earn.(24,000) 24,000 = NA + NA NA NA – NA = NA (24,000) IA
EquityAssets

Straight-Line Depreciation
Life Cycle Phase 3Use the truck to generate $10,000 revenue
for the period. Depreciation expense calculated under straight-line is determined
as followed:(Asset Cost – Salvage Value) (Asset Cost – Salvage Value) ÷ Useful Life÷ Useful Life(Asset Cost – Salvage Value) (Asset Cost – Salvage Value) ÷ Useful Life÷ Useful Life
($24,000 – $4,000) ($24,000 – $4,000) ÷ 4 = $5,000 depreciation÷ 4 = $5,000 depreciation($24,000 – $4,000) ($24,000 – $4,000) ÷ 4 = $5,000 depreciation÷ 4 = $5,000 depreciation
= Liab. + Equity Rev. – Exp. = Net Inc. Cash Flow
Cash + Truck - A. Dep.10,000 NA NA = NA + 10,000 10,000 – NA = 10,000 10,000 OANA NA 5,000 NA (5,000) NA – 5,000 (5,000) NA
Assets

Straight-Line Depreciation
= Liab. + Equity Gain – Exp. = Net Inc. Cash Flow
Cash + Truck - A. Depr Ret. Earn.4,500 (24,000) (20,000) = NA + 500 500 – - = 500 4,500 IA
Assets
Life Cycle Phase 4On January 1, 2010, the truck is sold for $4,500
cash.Cost of Asset 24,000$ Accumulated Depreciation 20,000 ($5,000 × 4 years)Book Value 4,000 Cash Proceeds 4,500 Gain on retirement 500$

Double-Declining-Balance Method
The double-declining-balance method is called an accelerated depreciation method because more
depreciation expense is recorded in the early years than in later years. Determining the amount of depreciation
expense in any year is the result of a three-step process.
1. Determine the straight-line rate of depreciation.
2. Multiply the straight-line rate times two.
3. Multiply the double-declining rate by the book value of the asset at the beginning of the period.
1. Determine the straight-line rate of depreciation.
2. Multiply the straight-line rate times two.
3. Multiply the double-declining rate by the book value of the asset at the beginning of the period.

Double-Declining-Balance Method
Let’s see how double-declining-balance depreciation works on our truck.
YearBook Value at
Beginning of Year
Double the Straight-Line
Rate
Annual Depreciation
Expense2006 ($24,000 – $ 0) 50% 12,000$ 2007 ($24,000 – $12,000) 50% 6,000 2008 ($24,000 – $18,000) 50% 3,000 2009 ($24.000 - $21,000) 50% 1,500
22,500$
(1 ÷ 4) = (25% straight-line rate × 2) = 50%(1 ÷ 4) = (25% straight-line rate × 2) = 50%
YearBook Value at
Beginning of Year
Double the Straight-Line
Rate
Annual Depreciation
Expense2006 ($24,000 – $ 0) 50% 12,000$ 2007 ($24,000 – $12,000) 50% 6,000 2008 ($24,000 – $18,000) 50% 2,000 2009 ($24,000 - $20,000) 50% -
20,000$

Straight-Line Depreciation Journal Entries
Account Title Debit CreditCash 25,000 Common Stock 25,000
Truck 24,000 Cash 24,000
Cash 10,000 Revenue 10,000
Depreciation Expense 5,000 Accumulated Depreciation 5,000
Cash 45,000 Accumulated Depreciation 20,000 Truck 24,000 Gain on Sale of Truck 500
Account Title Debit CreditCash 25,000 Common Stock 25,000
Truck 24,000 Cash 24,000
Cash 10,000 Revenue 10,000
Depreciation Expense 5,000 Accumulated Depreciation 5,000
Cash 45,000 Accumulated Depreciation 20,000 Truck 24,000 Gain on Sale of Truck 500
Account Title Debit CreditCash 25,000 Common Stock 25,000
Truck 24,000 Cash 24,000
Cash 10,000 Revenue 10,000
Depreciation Expense 5,000 Accumulated Depreciation 5,000
Cash 45,000 Accumulated Depreciation 20,000 Truck 24,000 Gain on Sale of Truck 500
Account Title Debit CreditCash 25,000 Common Stock 25,000
Truck 24,000 Cash 24,000
Cash 10,000 Revenue 10,000
Depreciation Expense 5,000 Accumulated Depreciation 5,000
Cash 45,000 Accumulated Depreciation 20,000 Truck 24,000 Gain on Sale of Truck 500
Account Title Debit CreditCash 25,000 Common Stock 25,000
Truck 24,000 Cash 24,000
Cash 10,000 Revenue 10,000
Depreciation Expense 5,000 Accumulated Depreciation 5,000
Cash 4,500 Accumulated Depreciation 20,000 Truck 24,000 Gain on Sale of Truck 500

2006 2007 2008 2009 2010
Revenue 10,000$ 10,000$ 10,000$ 10,000$ -$ Depreciation Expense (5,000) (5,000) (5,000) (5,000) Operating Income 5,000 5,000 5,000 5,000 - Gain on Sale of Truck - - - - 500 Net Income 5,000$ 5,000$ 5,000$ 5,000$ 500$
Assets Cash 11,000$ 21,000$ 31,000$ 41,000$ 45,500$ Truck 24,000 24,000 24,000 24,000 - Accumulated Depreciation (5,000) (10,000) (15,000) (20,000) - Total Assets 30,000$ 35,000$ 40,000$ 45,000$ 45,500$
Stockholder's Equity Common Stock 25,000$ 25,000$ 25,000$ 25,000$ 25,000$ Retained Earnings 5,000 10,000 15,000 20,000 20,500 Total Stockholder's Equity 30,000$ 35,000$ 40,000$ 45,000$ 45,500$
Operating Activities Inflow from Customers 10,000$ 10,000$ 10,000$ 10,000$ -$ Investing Activities Outflow to Purchase Truck (24,000) Inflow from Sale of Truck 4,500 Financing Activities Inflow from Stock Issue 25000Net Change in Cash 11,000 10,000 10,000 10,000 4,500 Beginning Cash Balance - 11,000 21,000 31,000 41,000 Ending Cash Balance 11,000$ 21,000$ 31,000$ 41,000$ 45,500$
Balance Sheet
Statement of Cash Flows
Income Statement
Dorey CompanyFinancial Statements
2006 2007 2008 2009 2010
Revenue 10,000$ 10,000$ 10,000$ 10,000$ -$ Depreciation Expense (5,000) (5,000) (5,000) (5,000) Operating Income 5,000 5,000 5,000 5,000 - Gain on Sale of Truck - - - - 500 Net Income 5,000$ 5,000$ 5,000$ 5,000$ 500$
Assets Cash 11,000$ 21,000$ 31,000$ 41,000$ 45,500$ Truck 24,000 24,000 24,000 24,000 - Accumulated Depreciation (5,000) (10,000) (15,000) (20,000) - Total Assets 30,000$ 35,000$ 40,000$ 45,000$ 45,500$
Stockholder's Equity Common Stock 25,000$ 25,000$ 25,000$ 25,000$ 25,000$ Retained Earnings 5,000 10,000 15,000 20,000 20,500 Total Stockholder's Equity 30,000$ 35,000$ 40,000$ 45,000$ 45,500$
Operating Activities Inflow from Customers 10,000$ 10,000$ 10,000$ 10,000$ -$ Investing Activities Outflow to Purchase Truck (24,000) Inflow from Sale of Truck 4,500 Financing Activities Inflow from Stock Issue 25,000 Net Change in Cash 11,000 10,000 10,000 10,000 4,500 Beginning Cash Balance - 11,000 21,000 31,000 41,000 Ending Cash Balance 11,000$ 21,000$ 31,000$ 41,000$ 45,500$
Balance Sheet
Statement of Cash Flows
Income Statement
Dorey CompanyFinancial Statements

Units-of-Production Depreciation
Cost – Salvage valueTotal estimated units of production
=Depreciation charge per unitof production
Depreciation charge per unitof production
×Units of production in current accounting period
=PeriodicDepreciation Expense

Units-of-Production Depreciation
Here is the depreciation charge per mile drive in our truck:
$24,000 – $4,000100,000 miles
= $0.20 per mile
Here is the calculation of depreciation expense based on miles driven:
Year
Depreciation Charge Per
MileMiles
DrivenDepreciation
Expense2006 0.20$ × 31,000 = 6,200$ 2007 0.20 × 27,000 = 5,400 2008 0.20 × 24,000 = 4,800 2009 0.20 × 18,000 = 3,600
100,000 20,000$

Graph of Depreciation Expense
Depreciation Expense Under Three Methods
-
2,000
4,000
6,000
8,000
10,000
12,000
1 2 3 4
Year
Do
llars
= Units-of-Production= Straight-Line= Double-Declining-Balance
▲♦■

Income Tax ConsiderationsThe maximum depreciation currently allowed
by tax law is computed using the modified modified accelerated cost recovery systemaccelerated cost recovery system (MACRS).
The rate of depreciation depends on the class life of the asset and the period in which we are calculating depreciation. There are currently
six categories for property, excluding real estate. They are 3-year, 5-year, 7-year, 10-
year, 15-year, and 20-year property.

Income Tax Considerations
Here are the tax rates for 5-year and 7-year property:
Year5-Year
Property %7-Year
Property %1 20.00% 14.29%2 32.00% 24.49%3 19.20% 17.49%
4 11.52% 12.49%5 11.52% 8.93%6 5.76% 8.92%7 8.93%8 4.46%
100.00% 100.00%
Let’s assume our truck is classified as 5-year property and calculate depreciation for our tax return.

Income Tax Considerations
Year5-Year
Property %Cost of Truck
Depreciation Expense
1 20.00% 24,000$ 4,800$ 2 32.00% 24,000 7,680 3 19.20% 24,000 4,608
4 11.52% 24,000 2,765 5 11.52% 24,000 2,765 6 5.76% 24,000 1,382
100.00% 24,000$
Let’s assume our truck is classified as 5-year property and calculate depreciation for our tax return.

Revision of EstimatesEstimates are frequently revised when new information surfaces. Assume we purchased equipment on January 1, 2006, for $24,000 cash and estimated salvage value was $3,000. The equipment has an estimated useful life
of seven years, and the company uses straight-line depreciation.
($24,000 – $3,000) ($24,000 – $3,000) ÷ 7 = $3,000 depreciation per year÷ 7 = $3,000 depreciation per year($24,000 – $3,000) ($24,000 – $3,000) ÷ 7 = $3,000 depreciation per year÷ 7 = $3,000 depreciation per year
On January 1, 2009, after three years of depreciation, it was determined that the machine has a remaining
useful life of only two more years for a total estimated useful life of five years.

Revision of EstimatesYear
Annual Depreciation
Accumulated Depreciation Book Value
2006 3,000$ 3,000$ 21,000$ 2007 3,000 6,000 18,000 2008 3,000 9,000 15,000
2009201020112012
We determine the remaining annual depreciation like this:
$15,000 $15,000 – $3,000 = $12,000 ÷ 2 years = $6,000 per year– $3,000 = $12,000 ÷ 2 years = $6,000 per year
YearAnnual
DepreciationAccumulated Depreciation Book Value
2006 3,000$ 3,000$ 21,000$ 2007 3,000 6,000 18,000 2008 3,000 9,000 15,000
2009 6,000 15,000 9,000 2010 6,000 21,000 3,000

Continuing Expenditures for Plant Assets
Costs that Are ExpensedCosts that Are ExpensedThe cost of routine maintenance and minor repairs that are incurred to keep an asset in good working order are
expensed as incurred.
Assume Matrix, Inc. spent $200 cash for routine maintenance on machinery.
Account Title Debit CreditMaintenance Expense 200 Cash 200
Assets = Liab. + Equity Rev. – Exp. = Net Inc. Cash Flow
Cash Ret. Earn.(200) = NA + (200) NA – 200 = (200) (200) OA

Continuing Expenditures for Plant Assets
Costs that Are CapitalizedCosts that Are CapitalizedExpenditures that improve the quality of an asset are
capitalized as part of the cost of that asset.
Assume Matrix, Inc. spent $5,000 cash for a major overall of equipment to improve efficiency.
= Liab. + Equity Rev. – Exp. = Net Inc. Cash Flow
Cash + Equip. - A. Depr(5,000) 5,000 NA = NA + NA NA – NA = NA (5,000) IA
Assets
Account Title Debit CreditEquipment 5,000 Cash 5,000

Continuing Expenditures for Plant Assets
Costs that Extend the Life of an AssetCosts that Extend the Life of an AssetThe amount of the expenditure should reduce the balance in the accumulated depreciation account.
Assume Matrix, Inc. spent $8,000 cash for improvements that extended the life of equipment four years.
= Liab. + Equity Rev. – Exp. = Net Inc. Cash Flow
Cash + Equip. - A. Depr(8,000) NA (8,000) = NA + NA NA – NA = NA (8,000) IA
Assets
Account Title Debit CreditAccumulated Depreciation - Equipment 8,000 Cash 8,000

Natural Resources
Cost – Salvage valueTotal estimated units recoverable
=Depletion charge per unitof resource
Depletion charge per unitof resource
×Number of units extracted and sold this period
=PeriodicDepletion Expense

Natural ResourcesMartin Mining Company paid $10,000,000 cash to
purchase land that is expected to yield 5,000,000 tons of coal. After all coal is extracted the land is not expected to
have any salvage value. During 2006, the company extracted and sold 500,000 tons of coal.
$10,000,000 – $05,000,000 tons
= $2.00 per ton extracted and sold

Natural Resources
= Liab. + Equity Rev. – Exp. = Net Inc. Cash Flow
Cash + Coal Mine(10,000,000) 10,000,000 = NA + NA NA – NA = NA (10,000,000) IA
NA (1,000,000) NA (1,000,000) NA – 1,000,000 (1,000,000) NA
Assets
Martin Mining Company paid $10,000,000 cash to purchase land that is expected to yield 5,000,000 tons of coal. After all coal is extracted the land is not expected to
have any salvage value. During 2006, the company extracted and sold 500,000 tons of coal.
Account Title Debit CreditCoal Mine 10,000,000 Cash 10,000,000
Depletion Expense 1,000,000 Coal Mine 1,000,000
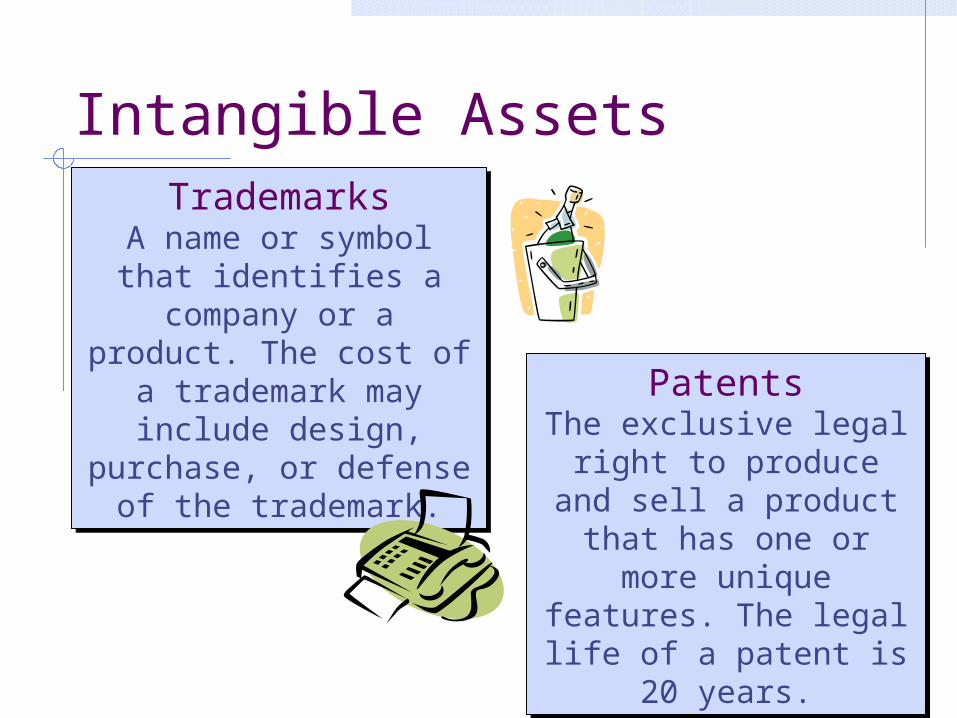
Intangible AssetsTrademarks
A name or symbol that identifies a company or a
product. The cost of a trademark may include design, purchase, or
defense of the trademark.
TrademarksA name or symbol that
identifies a company or a product. The cost of a trademark may include design, purchase, or
defense of the trademark.Patents
The exclusive legal right to produce and sell a product
that has one or more unique features. The legal life of a patent is 20 years.
PatentsThe exclusive legal right to produce and sell a product
that has one or more unique features. The legal life of a patent is 20 years.

Intangible Assets
CopyrightsCopyrightsProtection of writings, Protection of writings,
musical composition, work musical composition, work of art, or other intellectual of art, or other intellectual property. The protection property. The protection extends for the life of the extends for the life of the
creator plus 70 years.creator plus 70 years.
FranchiseThe exclusive right to sell
products or perform services in certain geographic areas.
FranchiseThe exclusive right to sell
products or perform services in certain geographic areas.

Intangible Assets
GoodwillGoodwillThe excess of cost over fair The excess of cost over fair value of net tangible assets value of net tangible assets
acquired in a business acquired in a business acquisition.acquisition.
GoodwillGoodwillThe excess of cost over fair The excess of cost over fair value of net tangible assets value of net tangible assets
acquired in a business acquired in a business acquisition.acquisition.
Assets 500,000$
Liabilities 100,000$ Stockholders' Equity 400,000
Total 500,000$
Seller CompanyBalance Sheet
At December 31, 2006
Assume that your company is willing to pay $450,000 cash to acquire
Seller Company. Let’s look at the accounting.

Goodwill
= Liab. + Equity Rev. – Exp. = Net Inc. Cash Flow
Cash + Seller Assets Goodwill Seller Liab.(450,000) 500,000 50,000 = 100,000 + NA NA – NA = NA (450,000) IA
Assets
Assets 500,000$
Liabilities 100,000$ Stockholders' Equity 400,000
Total 500,000$
Seller CompanyBalance Sheet
At December 31, 2006
Assume that your company is willing to pay $450,000 cash to acquire Seller Company. Let’s look at the accounting.

Goodwill
Assets 500,000$
Liabilities 100,000$ Stockholders' Equity 400,000
Total 500,000$
Seller CompanyBalance Sheet
At December 31, 2006
Assume that your company is willing to pay $450,000 cash to acquire Seller Company. Let’s look at the accounting.
Account Title Debit CreditSeller Assets 500,000 Goodwill 50,000 Seller Liabilities 100,000 Cash 450,000

Account Title Debit CreditPatent 17,000 Cash 17,000
Amortization Expense - Patent 1,000 Patent 1,000
Expensing Intangible AssetsAn asset with an identifiable useful life is amortized using the straight-line method over the intangible’s legal life or
its useful life.
Assume we purchased a patent that has a 20-year legal and useful life for $20,000 cash.
= Liab. + Equity Rev. – Exp. = Net Inc. Cash Flow
Cash + Patent(20,000) 20,000 = NA + NA NA – NA = NA (20,000) IA
NA (1,000) NA (1,000) NA – 1,000 (1,000) NA
Assets
Account Title Debit CreditPatent 20,000 Cash 20,000
Amortization Expense - Patent 1,000 Patent 1,000

Impairment of Intangible Asset
Intangible assets with indefinite useful lives must be tested for Intangible assets with indefinite useful lives must be tested for impairment annually. If the fair value of the intangible asset is impairment annually. If the fair value of the intangible asset is
less than its book value, an impairment loss is recognized.less than its book value, an impairment loss is recognized.
Assume that at the end of 2006, we determine that goodwill has suffered a $10,000 impairment in value.
Assets = Liab. + Equity Rev. – Exp. = Net Inc. Cash Flow
Goodwill(10,000) = NA + (10,000) NA – 10,000 = (10,000) NA
Account Title Debit CreditImpairment Loss 10,000 Goodwill 10,000

Balance Sheet Presentation
Long-Term AssetsPlant and Equipment Building 4,000,000$ Accumulated Depreciation (2,500,000) 1,500,000$ Equipment 1,750,000 Accumulated Depreciation (1,200,000) 550,000 Total Plant and Equipment 2,050,000$ Land 850,000 Natural Resources Mineral Deposits (Less: Depletion) 2,100,000 Oil Reserves (Less: Depletion) 890,000 Total Natural Resources 2,990,000 Intangibles Patents (Less: Amortization) 38,000 Goodwill 175,000 Total Intangibles 213,000 Total Long-Term Assets 6,103,000$
At December 31, 2006
Dorey CompanyPartial Balance Sheet

Effect of Judgment and Estimates
Assume that Alpha Company uses straight-line depreciation and Zeta Company uses double-declining-
balance method. Let’s look at their partial financial statements.
Alpha Zeta Alpha ZetaSales 50,000$ 50,000$ 50,000$ 50,000$ Cost of Good Sold (30,000) (30,000) (30,000) (30,000) Gross Margin 20,000 20,000 20,000 20,000 Depreciation Expense (4,000) (8,000) (4,000) (4,800) Net income 16,000$ 12,000$ 16,000$ 15,200$
2005 2006Income Statement

Effect of Judgment and Estimates
Assume that Alpha Company uses straight-line depreciation and Zeta Company uses double-declining-
balance method. Let’s look at their partial financial statements.
Alpha Zeta Alpha ZetaAssets 20,000$ 20,000$ 20,000$ 20,000$ Accumulated Depreciation (4,000) (8,000) (8,000) (12,800) Book Value 16,000 12,000 12,000 7,200
2005 2006Plant Assets

End of Chapter Nine