The Maryland Patient Safety Center Perinatal Collaborative: Background Information Maryland...
27
The Maryland Patient Safety Center Perinatal Collaborative: Background Information Maryland Department of Health and Mental Hygiene Family Health Administration January 25, 2007
-
Upload
edith-phillips -
Category
Documents
-
view
216 -
download
0
Transcript of The Maryland Patient Safety Center Perinatal Collaborative: Background Information Maryland...

The Maryland Patient Safety Center Perinatal
Collaborative:Background Information
Maryland Department of Health and Mental Hygiene
Family Health AdministrationJanuary 25, 2007

2
Infant mortality prevention in Maryland
What is Maryland’s infant mortality rate?
Is there a racial disparity in infant mortality rates?
What factors are associated with infant mortality?
What strategies for preventing infant mortality are cited in the literature?

3
Infant Mortality Rate, Maryland & U.S., 1996-2005
6
7
8
9
Year
Rat
e P
er 1
000
Liv
e B
irth
s
Maryland United States
Maryland 8.4 8.6 8.6 8.3 7.4 8 7.6 8.1 8.5 7.3
United States 7.3 7.2 7.2 7.1 6.9 6.8 7 6.9
1996 1997 1998 1999 2000 2001 2002 2003 2004 2005
Source: Maryland Vital Statistics 2005 Report

4
Infant Mortality Rate by Race, Maryland, 1996-2005
0
10
20
Year
Rat
e P
er 1
000
Liv
e B
irth
s
All Races White Black
All Races 8.4 8.6 8.6 8.3 7.4 8 7.6 8.1 8.5 7.3
White 5.9 5.3 5.5 5.1 4.7 5.5 5.4 5.4 5.6 4.7
Black 14.5 16.1 15.4 14.7 13 13.6 12.7 14.7 14.9 12.7
1996 1997 1998 1999 2000 2001 2002 2003 2004 2005
Source: Maryland Vital Statistics 2005 Report

5
% LBW Infants,Maryland & U.S., 1996-2005
6
7
8
9
10
Year
Per
cent
Maryland United States
Maryland 8.6 8.8 8.7 9.1 8.7 9 9 9.1 9.4 9.2
United States 7.4 7.5 7.6 7.6 7.6 7.6 7.8 7.9 8.1
1996 1997 1998 1999 2000 2001 2002 2003 2004 2005
Source: Maryland Vital Statistics 2005 Report

6
% No Prenatal Care,Maryland & U.S., 1996-2005
2
3
4
5
6
Year
Per
cent
Maryland United States
Maryland 2.6 2.6 2.9 3.1 3.1 3.7 3.6 3.8 3.9 4.3
United States 4 3.9 3.9 3.8 3.9 3.7 3.6 3.5 3.6
1996 1997 1998 1999 2000 2001 2002 2003 2004 2005
Source: Maryland Vital Statistics 2005 Report

7
Prenatal care as early as desired
Source: Maryland PRAMS Report, 2001-2003 Births
Began early enough, 47.7%
Did not begin early enough,
49.4%
Did not want care, 2.9%
8
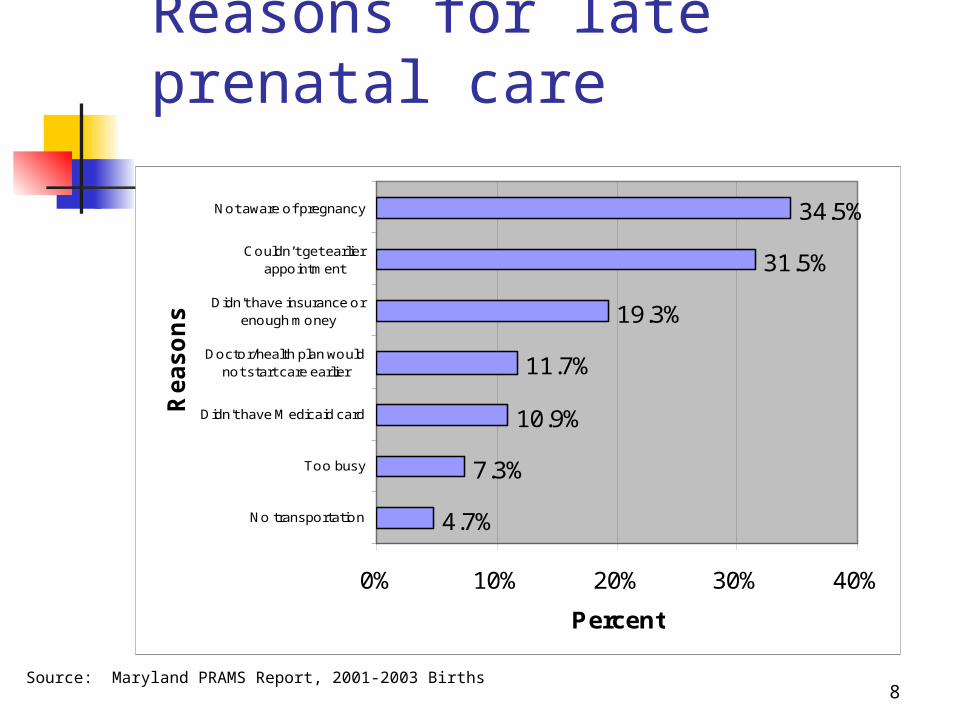
Reasons for late prenatal care
4.7%
7.3%
10.9%
11.7%
19.3%
31.5%
34.5%
0% 10% 20% 30% 40%
No transportation
Too busy
Didn't have Medicaid card
Doctor/health plan wouldnot start care earlier
Didn't have insurance orenough money
Couldn’t get earlierappointment
Not aware of pregnancy
Re
as
on
s
Percent
Source: Maryland PRAMS Report, 2001-2003 Births

9
Infant Mortality Prevention: Leading Causes in Maryland
Pre-term/low birthweight births (24%) Congenital anomalies (14%) Sudden infant death syndrome/SIDS (10%) Problems related to maternal complications
of pregnancy (8%) Respiratory distress syndrome (4%) Bacterial sepsis of newborn (3%) Newborn affected by complications of
placenta, cord and membranes (3%)
Source: Maryland Vital Statistics 2005 Report

10
Infant Mortality Prevention: Strategies
Family Planning/Preconception Care Prenatal Care Healthy Behaviors
Good nutrition/WIC Smoking cessation Avoidance of alcohol and illicit drugs
Perinatal Regionalization Approach for centralizing specialty care for critically ill
neonates – first designed in the 1970’s Studies showed a twofold improvement in outcome for
LBW infants when born in Level III vs Level I facilities

11
Infant Mortality Prevention: History 1900-1950: Rates declined from
100/1,000 to 29/1,000 (due to improved nutrition, sanitation, public health measures)
1950-1970: Rates plateaued at 20/1,000 1971: AMA House of Delegates laid
groundwork for perinatal regionalization 1972: March of Dimes formed the
Committee on Perinatal Health (COPH)

12
Infant Mortality Prevention: History
1976: COPH issued Toward Improving the Outcome of Pregnancy (TIOP I) that defined perinatal regionalization
1985: RWJ Foundation Report on Perinatal Regionalization (McCormick et al) showed Neonatal mortality rates declined by 18% Developmental delay rates declined by 15% Process of regionalization works: risk
assessment, referral/transport systems, high risk consultation, outreach education

13
Infant Mortality Prevention: History
1993: COPH reconvened and issued Toward Improving the Outcome of Pregnancy (TIOP II) Focus on preconception/prenatal care,
intrapartum/neonatal care, data, financing 2002: Guidelines for Perinatal Care, 5th
Edition issued by ACOG/AAP “Focus on reproductive awareness,
regionally based prenatal care services, and the philosophy of the March Dimes publication (TIOP II).”

14
Infant Mortality Prevention: Maryland’s History 1984: “The Maryland Advisory
Committee on Perinatal Care rejected the tri-level of care concept of regionalization for Maryland. Since this system is not used, there is no information on which hospitals would be placed in each level; further there is no agency authorized to make such designations. Regionalization of OB services should occur, however, and further attempts are necessary.” Maryland State Health Plan, 1984

15
Infant Mortality Prevention:Maryland’s History 1989: Fetus and Newborn
Committee of MD AAP developed guidelines, “A New Classification Scheme for Nurseries in Maryland” Only 61% of VLBW births occurred at
Level III facilities Only 11 of 39 hospitals met their
designated requirements

16
Infant Mortality Prevention: Maryland’s History 1994: Maryland’s Proposal for a
Regionalized Perinatal System of Care 1995: Partnership formed - DHMH, MHA, &
Commission on Infant Mortality Prevention 1995: Secretary’s Perinatal Clinical Advisory
Committee issued, “Maryland Guidelines for Perinatal Care”
1995: Birth and death certificates linked for the 1st time in Maryland and hospital-specific, birthweight-specific neonatal mortality rates issued

17
Infant Mortality Prevention: Maryland’s History 1995: Goals of the Maryland Perinatal
Health Initiative set forth: Level I, II, III, & IV hospitals should adhere to
the perinatal standards – and designations should be verified through on-site visits
# of VLBW births in Level I & II hospitals must be reduced
VLBW-specific neonatal mortality rates in Level III & IV hospitals must be reduced

18
Infant Mortality Prevention:Maryland’s History 1995: Crenshaw Perinatal Health Initiative
established that provided community-based funding for high risk perinatal consultation, referral/transport protocols, FIMR, data collection/analysis, provider/public education
1995-1998: Voluntary site visits of Level I & II perinatal facilities completed
1997-Present: MIEMSS incorporates Level III & IV Standards into regulations, for maternal-neonatal transport purposes

19
Infant Mortality Prevention: Maryland’s History 1998-Present: MHCC incorporates
Standards into State Health Plan NICU Services & Obstetric Services
2004: Maryland Perinatal System Standards revised
2006: Babies Born Healthy initiative focuses on prevention, quality improvement and perinatal data surveillance (including funding for the MPSC Perinatal Collaborative)

20
Perinatal Health Efforts: Summary of Component Parts
High Touch Approach Regional grants for community organizations Provider education (e.g., high risk consultation) Community awareness (e.g., fetal and infant
mortality reviews) High Tech Approach
Perinatal standards setting/hospital site visits Maternal-neonatal transport Perinatal data surveillance/quality
improvement

21
Perinatal Health Efforts:Maryland Outcomes
Infant mortality rate declined by 13% Over the past 10 years – 8.4/1000 in 1996 vs.
7.3/1000 in 2005 Neonatal mortality rate declined by 8%
Over the past 10 years – 5.8/1000 in 1996 vs. 5.3/1000 in 2005
Postneonatal mortality rate declined by 23% Over the past 10 years – 2.6/1000 in 1996 vs.
2.0/1000 in 2005

22
Perinatal Health Efforts: Maryland Outcomes
Hospital-specific, VLBW-specific neonatal mortality rates have also improved: 16% improvement for all hospitals
148/1000 in 1994-1995 vs. 124/1000 in 2003-2004 15% improvement for Level III hospitals
(adjusted): 142/1000 in 1994-1995 vs. 120/1000 in 2003-2004
Fewer Level III/IV hospitals now have adjusted NMR’s greater than 200/1000
4 in 1994-1995 vs. 1 in 2003-2004

23
Birth Weight-AdjustedNeonatal Mortality RatesBy Maryland Level III/IV Hospital
1994-1995 2003-2004Birthweight-adjusted neonatal mortality rates by hospital
of birth for Maryland resident infants with birth weights of 500-1499 grams born in Maryland III/IV hospitals, 2003-2004
83.684.987.587.888.1
103117117.9122.1129.3133.3
151.9153.7
185.8231.5
120.3
0 50 100 150 200 250 300
H1
Z
X
D1
F1
V
A1
W
E1
J 1
B1
K1
G1
C1
Y
ALL
Hos
pita
l of b
irth
Neonatal mortality rate per 1000 live births
Birthweight-adjusted neonatal mortality rates by hospital of birth for Maryland resident infants with birth weights of 500-1499 grams born in Maryland III/IV hospitals, 1994-1995
63.5
89.6
117.7
121.3
130.2
134.3
147
178.6
209.3
241.1
249.8
257.5
142.2
0 50 100 150 200 250 300
E1
B1
A1
C1
H1
G1
D1
F1
X
T
K1
Z
ALL
Hos
pita
l of b
irth
Neonatal mortality rate per 1000 live births

24
What are the lessons learned? The process works
Processes associated with the Maryland Perinatal System Standards effort work:
sharing of information and expertise consensus building focus on risk
assessment/referral/transport systems heightened community awareness

25
What are the lessons learned? Standards currently focus more on
organizational and process issues Policies and protocols Obstetric, nursery & other unit capabilities Professional staffing Equipment and medications Continuing education processes
Rather than outcome issues Mortality rates Intermediate outcome data Service volume

26
What are the next steps? Maryland Perinatal Standards specify
3 levels of care – for 33 Maryland hospitals Levels I –9 hospitals Level II – 9 hospitals Level III A,B,C – 15 hospitals
13 categories of interest (1) organization, (2) OB unit, (3) nursery unit, (4) OB personnel, (5)
pediatric personnel, (6) other personnel, (7) lab, (8) diagnostic imaging, (9) equipment, (10) medications, (11) education programs, (12) performance improvement, (13) polices/protocols
The Next Step – Performance Improvement Standard 12.5 – The hospital shall participate in the collaborative
collection and assessment of data with DHMH and MIEMSS for the purpose of improving perinatal outcomes.

27
Possible perinatal data elements to be followed for performance improvement purposes
Maternal death Neonatal death > 2500
grams Uterine rupture Maternal admission to ICU Birth trauma Return to O.R./L&D Admission to NICU > 2500
grams Apgar < 7 at 5 minutes Blood transfusion 3rd/4th degree perineal tear
Admission temperature to the NICU
Nosocomial infections – blood stream infections
Immunization documentation in the discharge/transfer summary
Pneumothoraces Intra-ventricular
hemorrhage