The making of a manager - ifau.se · PDF fileperformance of organizations. ... a...
89
The making of a manager: evidence from military officer training Erik Grönqvist Erik Lindqvist WORKING PAPER 2015:7
Transcript of The making of a manager - ifau.se · PDF fileperformance of organizations. ... a...

The making of a manager: evidence from military officer training
Erik Grönqvist Erik Lindqvist
WORKING PAPER 2015:7
The Institute for Evaluation of Labour Market and Education Policy (IFAU) is a research institute under the Swedish Ministry of Employment, situated in Uppsala. IFAU’s objective is to promote, support and carry out scientific evaluations. The assignment includes: the effects of labour market and educational policies, studies of the functioning of the labour market and the labour market effects of social insurance policies. IFAU shall also disseminate its results so that they become accessible to different interested parties in Sweden and abroad. IFAU also provides funding for research projects within its areas of interest. The deadline for applications is October 1 each year. Since the researchers at IFAU are mainly economists, researchers from other disciplines are encouraged to apply for funding. IFAU is run by a Director-General. The institute has a scientific council, consisting of a chairman, the Director-General and five other members. Among other things, the scientific council proposes a decision for the allocation of research grants. A reference group including representatives for employer organizations and trade unions, as well as the ministries and authorities concerned is also connected to the institute. Postal address: P.O. Box 513, 751 20 Uppsala Visiting address: Kyrkogårdsgatan 6, Uppsala Phone: +46 18 471 70 70 Fax: +46 18 471 70 71 [email protected] www.ifau.se Papers published in the Working Paper Series should, according to the IFAU policy, have been discussed at seminars held at IFAU and at least one other academic forum, and have been read by one external and one internal referee. They need not, however, have undergone the standard scrutiny for publication in a scientific journal. The purpose of the Working Paper Series is to provide a factual basis for public policy and the public policy discussion. ISSN 1651-1166

IFAU - The making of a manager 1
The making of a manager: evidence from military officer training a
by
Erik Grönqvistb and Erik Lindqvistc
April 22, 2015
Abstract
We show that officer training during the Swedish military service has a strong positive effect on the probability to attain a managerial position later in life. The most intense type of officer training increases the probability of becoming a civilian manager by about 5 percentage points, or 75 percent. Officer training also increases educational attainment post-military service. We argue that the effect on civilian leadership could be due to acquisition of leadership specific skills during the military service, and present suggestive evidence related to alternative mechanisms, such as signalling, networks, and training unrelated to leadership.
Keywords: Leadership; management; CEOs; non-cognitive skills; regression-discontinuity; program evaluation; conscription; military service; military officers; military leadership JEL-codes: J24, J31, I20, M51
a Previous versions of this paper have been circulated under the title “Does Leadership Training Promote Leadership?” We would like to thank Ingvar Ahlstrand for providing information regarding the Swedish military enlistment; Björn Öckert for help with the data retrieval; Selva Baziki, Era Krasniq and Nina Öhrn for excellent research assistance; and Richard Friberg, Rita Ginja, Lena Hensvik, Mikael Lindahl, Matthew Lindquist, Magne Mogstad, Björn Öckert, Roope Uusitalo, Jonas Vlachos, as well as seminar participants at the EEA Annual Meeting 2011, IFAU, IFAU Conference on Human Capital Formation in Childhood and Adolescence 2011, IIES, the National Conference of Swedish Economists in Lund 2010, NBER Summer Institute in Personnel Economics 2012, Nordic Summer Institute in Labor Economics in Bergen 2012, RES Meeting 2011, SOLE Meeting 2011, Stockholm School of Economics, Stockholm University, Swedish National Defence College (Karlstad), University of Mannheim, Uppsala University, VATT (Helsinki) and Linnaeus University (Växjö) for valuable comments. Financial support from IFAU (Project grant 136/09) and the Jan Wallander and Tom Hedelius Research Foundation is gratefully acknowledged. b Institute for Evaluation of Labour Market and Education Policy (IFAU), Box 513, S-750 20 Uppsala, Sweden. E-mail: [email protected]. c Stockholm School of Economics and Research Institute of Industrial Economics (IFN). Address: Department of Economics, Stockholm School of Economics, P.O Box 6501, SE–113 83 Stockholm, Sweden. E-mail: [email protected].
2 IFAU - The making of a manager
Table of contents
1 Introduction ......................................................................................................... 3
2 Military service in Sweden .................................................................................. 5 2.1 Background to the Swedish military service ....................................................... 5 2.2 Enlistment ............................................................................................................ 6 2.3 Training ............................................................................................................... 7
3 Data ..................................................................................................................... 8
4 Empirical strategy.............................................................................................. 10
5 Results ............................................................................................................... 18 5.1 Leadership ......................................................................................................... 18 5.2 Education and other labor market outcomes ..................................................... 23
6 Mechanisms ....................................................................................................... 24
7 Conclusions ....................................................................................................... 26
References ....................................................................................................................... 27
Appendix A. Descriptive statistics .................................................................................. 33
Appendix B. Additional empirical results ....................................................................... 34
Appendix C. Coding of data ............................................................................................ 81

IFAU - The making of a manager 3
1 Introduction A recent literature has documented that the quality of leadership matters for the
performance of organizations.1 A related strand of research has shown that managers
are selected based on distinct abilities and traits.2 However, there are few studies on
what kinds of experiences are conducive to leadership.3 That is, we know little about the
extent to which leaders are “made”, or whether becoming a leader in some capacity is
mainly a function of innate ability. In this paper, we address this question by testing
whether a specific intervention – military officer training – affects the probability of
becoming a manager in the civilian labor market.
For over a century, the mandatory military service constituted the most
comprehensive intervention by society in the lives of young Swedish men. From its
inception in 1901 until the end of the Cold War, almost all physically and mentally fit
men in every cohort were conscripted to serve in the armed forces for a period of 7 to 18
months. With a relatively small cadre of professional officers, about 30 percent of all
conscripts in each cohort were trained as officers in command of a squad or platoon.
Conscripted officers were exposed to a training involving both leadership theory and
practical experience of leadership in the field under the supervisory guidance of
professional officers. Since Swedish men entered the military service between the age
of 19 and 21, this training typically took place before they entered the labor market.
We build our identification strategy on discontinuities in the selection of conscripts
to officer training based on a test of cognitive ability at the military enlistment. To be
eligible for service as squad or platoon officer, a conscript’s cognitive ability score had
to be above certain thresholds. As a consequence, the proportion of men assigned to
different types of officer training exhibits discrete jumps at these thresholds, enabling us
1 The bulk of the economics literature on the importance of leadership focuses on how CEOs and managers influence firm performance. Studies in this vein include Bertrand and Schoar (2003); Huson, Malatesta and Parrino (2004); Adams, Almeida and Ferreira (2005); Pérez-Gonzáles (2006); Bennedsen, Pérez-Gonzáles and Wolfenzon (2006); Bennedsen et al. (2007); Malmendier and Tate (2009); Giroud and Mueller (2010); Lazear, Shaw and Stanton (2012), and Böhlmark, Grönqvist and Vlachos (2012). Jones and Olken (2005) study the importance of national leaders and Bloom and Van Reenen (2007) discuss management practices more generally. 2 See, for example, Kuhn and Weinberger (2005), Lazear (2012), Lindqvist and Vestman (2011) and Lindqvist (2012). The psychology literature on the personality traits and leadership is voluminous; see Hogan, Curphy and Hogan (1994) for a review. Further studies on the characteristics of managers include Malmendier and Tate (2005) and Kaplan, Klebanov and Sorensen (2012). 3 We are aware of a small set of studies using natural or randomized experiments to estimate the effect of experiences or training on subsequent leadership. Dhuey and Lipscomb (2008) show that relatively older students are more likely to be high school leaders. Dvir et al. (2002) and Barling, Weber and Kelloway (1996) use randomized trials with small samples to evaluate the effect of "transformational" leadership training.

4 IFAU - The making of a manager
to use a regression-discontinuity design to estimate the causal effect of training as squad
or platoon officer compared to training as a private.
We find that platoon officer training has a strong positive effect on civilian
leadership. Compared to military service as a regular soldier, military service as a
platoon officer increases the probability of attaining a civilian managerial position at the
age 30 to 40 by approximately 5 percentage points. Since the baseline proportion of
managers in the relevant subset of the population is 6.7 percent, platoon officer training
increases the probability of becoming a manager by about 75 percent. Squad officer
training does not affect the probability to attain a managerial position.
We also find that officer training increases educational attainment post-military
service. The effect is concentrated at lower tertiary degrees for squad officers and higher
tertiary degrees for platoon officers. Platoon officer training also delays labor market
entry by approximately 1 year while there is no such effect for squad officers. Given the
later entry into the labor market, we might expect a negative return to platoon officer
training in line with previous research on the economic consequences of military
service.4 In fact, we estimate positive but statistically insignificant wage premiums for
platoon officers of 0.6-3.1 percent depending on the exact specification.
Why does platoon officer training have such a large effect on civilian leadership?
While our identification strategy does not provide direct evidence with respect to the
underlying mechanism, we provide suggestive evidence that the effect is not due to
signaling, networks or a direct effect of selection into higher education. Our results are
thus consistent with officer training improving leadership-specific human capital,
although other explanations cannot be ruled out. Since conscripted officers spend their
military service in a peer group with higher cognitive skills and educational aspirations
at a point in time when they are likely to decide whether or not to enter into higher
education, peer group effects offer a plausible explanation for the effect of officer
training on educational attainment.5
4 Previous literature has studied the evolution of earnings for US veterans from WWII (Angrist and Krueger 1994) and Vietnam (Angrist, 1990; Angrist, Chen and Song 2011), and military service in Germany (Bauer et al 2012), the Netherlands (Imbens and van der Klaauw, 1995), Portugal (Card and Cardoso 2012), the UK (Grenet, Hart and Roberts, 2011) and the US (Angrist, 1998). 5 Except for the study by Cipollone and Rosolia (2007) on Italy, previous literature has found that the military service increases educational attainment. However, this effect has been ascribed to either draft-avoidance behavior (Card and Lemieux 2001; Maurin and Xenogiani 2007; Bauer et al 2014) or subsidies to veterans (Angrist 1993; Angrist and Chen, 2011; Bound and Turner, 2002) rather than the military service per se.
IFAU - The making of a manager 5
Our paper is related to a small but expanding literature on the formation of
managerial skills.6 In particular, Benmelech and Frydman (2010) show that CEOs with
military experience differ in management style, in the sense that they invest less in
capital and R&D and perform better than non-military CEOs during economic
downturns. Our paper differ from these papers primarily in that we focus on how a
specific intervention – officer training – affects the probability to attain a managerial
position.
Our paper is also related to the literature on the effect of the military service on labor
market outcomes initiated by Angrist (1990).7 Apart from our focus on leadership, the
main difference between our paper and this literature is that we estimate the differential
effect of military service as an officer or a regular soldier rather than the effect of the
military service per se.8
We begin our study with a background to the military service in Sweden and a
description of the training received by conscripts enlisted as officers. We then turn to
our sources of data, empirical strategy and results. Appendix B. Additional empirical
results and Appendix C. Coding of data are only provided online.
2 Military service in Sweden
2.1 Background to the Swedish military service Between 1901 and 2010, Sweden relied on conscription to supply the majority of
soldiers to the armed forces (Ericsson 1999). During the period we consider in this
paper (1970-1988), all physically and mentally fit men were required to do the military
service. The share of men in each cohort enlisted to the military service was above 90 %
6 Lazear (2012) argues that leaders need a broader range of skills than specialists as they encounter a wider range of problems. Using a data set with employment histories of Stanford MBA graduates, Lazear shows that students who become managers acquire experience from a broader set of occupational roles. Lazear (2004, 2005) provide a similar argument in the case of entrepreneurship. Using data on the career histories of the entire Danish population, Frederiksen and Kato (2011) also document that experience from a broad set of occupations, in particular within the same firm, increases the probability to attain a managerial position. 7 See the papers listed in footnote in 4 and 5 for references to this literature. 8 We are aware of one previous study on the economic consequences of the military service in Sweden. Hanes, Norlin and Sjöström (2010) use selection on observables to estimate the effect of military service on civilian earnings for men born in 1973, a cohort for which a large proportion of initially enlisted men were not conscripted due to cutbacks in the armed forces. They find that military service as a private is associated with an earnings premium of about 2 percent while the results for officers are positive but not statistically significant. Since we focus on men born between 1952 and 1970, the cohort analyzed in their paper is not included in our sample.
6 IFAU - The making of a manager
between 1970 and 1987 when it fell to about 80 % (see Figure B1. 1). Conscripted men
typically entered the military service between the age of 19 and 21.
The objective of the military service was to train military units to be deployed on a
short notice in case of war. After leaving the military service, conscripts were assigned a
position in the wartime organization of the armed forces. In case of war, all men
between the age of 18 and 47 were obliged to take part in the territorial defense of
Sweden. The professional officer corps functioned as instructors of the recruits in
peacetime and as higher commanders in case of war. While the objective of the wartime
organization was to defend the territorial integrity of Sweden, the main task of the
peacetime organization was to train new cohorts of conscripted recruits. Since the cadre
of professional officers was small relative to the size of the fully mobilized army,
Sweden relied on conscripts to fill about 90 percent of commanding positions in the
wartime organization (SOU 1984:71). Conscripted commanders were commissioned as
corporals, sergeants or second lieutenants. Corporals were typically trained as squad
leaders while the majority of sergeants and second lieutenants were trained as leaders or
deputy leaders of a platoon (SOU 1965:68; SOU 1984:71). In order to gain statistical
power, we merge sergeants and second lieutenants into a single conscript category
which we henceforth denote “platoon officers”. Corporals are denoted “squad officers”.
About 20 percent of conscripted soldiers were enlisted as squad officers and slightly
below 10 percent as platoon officers (see Figure B1.2). A small proportion of men
enlisted as officers served as specialists in some capacity and did not exert command
over a military unit.
2.2 Enlistment Enlistment into the military service was based on an extensive drafting procedure all
Swedish male citizens went through, most often shortly after their 18th birthday. The
draft was extended over two days with tests of cognitive ability, physical endurance,
muscular strength and health status. Each potential conscript was also interviewed by a
psychologist who assessed the draftee’s ability to fulfill the psychological requirements
of the military service.9 All tests of physical and mental abilities were graded on a
discrete 1-9 (”stanine”) scale that approximates a normal distribution. In addition, the
9 See Lindqvist and Vestman (2011) for a more comprehensive discussion of the test of cognitive ability and the psychologist interview.

IFAU - The making of a manager 7
psychologists assessed the leadership ability of men with a cognitive test score equal to
5 or higher. While exemption from the military service was exclusively determined by
health status; mental and physical abilities determined the type of position to which
conscripts were enlisted. Enlistment as squad officer required a cognitive test score of at
least 5. To be eligible to serve as platoon officer, conscripts had to have a cognitive test
score of 6 or higher, and a score of at least 6 (sergeant) or 7 (second lieutenant) in
leadership ability. The ultimate decision of which type of service to assign a draftee laid
with an enlistment officer who met with the draftee at the end of the draft. Enlisted
draftees generally started their military service 1-2 years after the draft.
2.3 Training Military rank is closely connected to duration of service. Except for the Navy, where
service is about three months longer, regular soldiers served 7-10 months, squad
officers 10 months, sergeants 12 months and second lieutenants 15 months (SOU
1984:71). The military service was typically divided into three stages with some overlap
(SOU 1965:68; SOU 1984:71). The first two stages were devoted to general soldiering
skills and individual skills specific for each line of service. For conscripted commanders
this included the basics in military theory and leadership, as well as the military theory
applicable to their specific type of service. The third stage focused on field training for
the squads, platoons, companies and battalions that were to be deployed in case of war.
During this stage, conscripted commanders lead their fellow conscripts in field
exercises under the supervision of professional officers, allowing squad and platoon
officers to obtain a first-hand experience of leadership practice in the military.
The intensity of leadership varied depending on the exact type of position. On
average, there were 3.5 conscripted privates for each enlisted squad officer and 9
enlisted privates and squad officers for each conscripted platoon officer. As there were
typically two commanders for each unit (a leader and a deputy), these figures imply that
the average squad officer was trained to lead a group of 7 or 8 fellow conscripts while
the average platoon officer was trained to lead a group of about 20 privates and
corporals.10
10 For 88 % of the men in our sample, we can observe the exact position to which each conscript was enlisted, enabling us to obtain a more precise measure of the intensity of leadership. (We impute exact position for six percent of our sample, bringing the total figure to 94 %.) As shown in the upper panel of Table B1. 1, 77 % of squad officers were trained as commanders compared to 93 % of platoon officers. The lower panel shows the proportion of

8 IFAU - The making of a manager
What kind of leaders do the Swedish Armed Forces seek to foster? According to the
manual for the training of conscript commanders (The Supreme Commander, 1986), a
distinguishing feature of the Swedish Armed Forces’ leadership philosophy is the
importance attached to commanders earning the trust and loyalty of their subordinates.
Relatedly, an open form of communication is encouraged as commanders are expected
to benefit from the exchange of information and knowledge with subordinates. The
Armed Forces also seek to foster a leadership style that facilitates coordination between
and within military units. To save on time, orders should be clear, concise and focus on
objectives rather than prescribing the means by which the objectives are to be reached.
Commanders are encouraged to focus on the big picture and not get lost in details.
While a democratic and listening leadership style is encouraged, the Supreme
Commander (1986) emphasizes that stressful situations require more direct orders with
limited or no scope for discussion.11
After the military service, well-performing conscripted officers had the opportunity
to enter the armed forces for a career as professional officers. This has two implications
for our study. First, it implies that the actual exposure to leadership received by some
officers exceeds that of the mandatory military service. Second, enlistment as an officer
extends the choice set with respect to education (military college) and career
(professional officer). We return to these issues in Section 5.
3 Data We combine data from the Swedish military enlistment with register data on labor
market outcomes and socioeconomic background characteristics. The underlying
population is all male Swedish citizens who went through the enlistment between 1970
conscripts in each category for whom the position code indicates that they received training other than leadership which can be expected to be valuable in the civilian labor market. Twenty-three percent of privates received such training compared to 14 % of squad officers and 6 % of platoon officers. The figures in Table 1 are based on both imputed and directly observed positions. 11 The leadership training received by conscripted officers embodies several features discussed in the literature on leadership and management practices. First, evidence from both interviews in the field (Bewley, 1999) and lab experiments (e.g., Fehr, Gächter and Kirchsteiger, 1997) suggest that employees reciprocate the actions of their superiors. Relatedly, Hermalin (1998) develops a model of “leadership by example” where leaders signal that the return to team effort is high by exerting effort or by making a symbolic sacrifice to the group. Second, the role of leadership in achieving coordination has been emphasized by several authors, e.g., Myerson (2004). Notably, Dewan and Myatt (2008) develop a model where leaders differ both by their “sense of direction”, i.e., their ability to make optimal decisions, and their ability to communicate clearly. If coordination is sufficiently important, clarity of communication is more important than sense of direction. This view resonates well with the strong emphasis the Swedish Armed Forces place on simple and clear communication.

IFAU - The making of a manager 9
and 1988.12 As young men were typically enlisted the year they turned 18 or 19, the
men in our sample are born between 1951 and 1970. This gives us a basic sample of
831,711 men. From the enlistment data we retrieve information on cognitive ability
from the test administered to all draftees (described above) and the type of service to
which each draftee was enlisted. In most analyses we further restrict the sample to men
with a cognitive score between 3 and 7 (on the 1-9 scale) leaving us with a sample of
665,150 men. Summary statistics for the men in this subsample for whom we observe
educational attainment (649,501) is available in Table A1.
We match the enlistment data to register data with annual information on occupation
and monthly full-time wages from Statistics Sweden. This data set covers everyone
working in the public sector and about 50 percent of workers in the private sector. In
particular, the private sector data cover all firms with more than 500 employees whereas
information for smaller firms comes from a stratified random sample by industry. Data
on occupations is available for the years 1996-2009 while wages are available for 1990-
2009. Occupation is coded according to a Swedish modification of the International
Standard for Classifications of Occupations 1988 (SSYK). We characterize individuals
as managers if they belong to the category “Managerial work”. This category—defined
on first digit information—contains a range of managerial positions from top level
managers to middle and lower level management. Since the sample for which we
observe occupations and wages is not perfectly representative, we conduct robustness
tests where we impute occupation and wages using information from adjacent years
and, in the case of wages, wage earnings. For occupations, we also calculate weights for
each individual based on the number of years an individual is in the labor market but
has missing information on (actual or imputed) occupation. The details behind our
strategy for imputing and weighting observations are available in Appendix C2. We find
no evidence that our instruments affect selection into under-sampled industries (see
Table B2. 1).
We also merge the enlistment data with matched employer-employee data for the
years 1985-2009. This data set contains information on the identity of employers and 12 Data on the Swedish enlistment is available already from the last four months of 1969, but since this information is not representative for whole draft cohort we have excluded 1969 from the population. For similar reasons we have also excluded men enlisting from 1989 and onward; from the late 1980’s the share of enlisted men started to fall significantly (see Figure B1. 1). We further exclude men drafted in 1978 due to missing draft records for a large share of draftees in this cohort. (The main results with the 1978 cohort included are reported in Appendix B14.) Finally, we impose an age restriction of 23 for draftees to be included in our data, thereby excluding 0.4 percent of the sample.
10 IFAU - The making of a manager
taxable wage earnings for all workers in Sweden (but not monthly wages), and enables
us to determine when an individual enters the labor market. Specifically, we calculate
the age of entering the labor market as the age when an individual’s wage earnings first
exceed 50 percent of average wage earnings for 30-year old men. We further match the
enlistment data to register data on highest educational attainment and country of birth.
In addition, we match the enlistment data to information on high school GPA from the
Swedish Agency for Education for draft cohorts 1985-1988. Finally, we use the
Multigenerational register, which contains a key to biological (and adoptive) parents for
individuals born after 1932, to obtain information on the educational attainment of the
mothers and fathers of the men in our sample.
4 Empirical strategy As explained in Section 2, men chosen for officer training were positively selected on
their cognitive, non-cognitive and physical skills. Our strategy for handling this
selection problem and identify causal effects of officer training hinges on the fact that
the 1-9 cognitive test score was based on the results on four subtests of logic, spatial,
verbal and technical ability. Each subtest was graded on a 1-9 scale and the sum of
subscores (i.e., 4-36) determined the “final” 1-9 cognitive score. Since conscription as
squad or platoon officer depended upon the final, coarser, score of cognitive ability, we
can use the discontinuities in the proportion of squad and platoon officers induced by
passing the thresholds to a higher final score to identify the effect of officer training on
subsequent outcomes. There are two reasons for why passing the threshold to a higher
final cognitive score increased the probability of enlistment as squad or platoon officer.
First, as described in Section 2, conscripts with final cognitive scores below 5 (squad
officers) and 6 (platoon officers) were not eligible for officer training. Second, higher
final scores provided a positive signal about a conscript’s ability to the enlistment
officer, implying that the share of officers increase discontinuously also at thresholds
above the eligibility cutoffs.
Figure 1 shows how the proportion of men assigned to officer training depends on
the cognitive test score.13 The figure is separated into two different panels since the
13 We exclude men with a cognitive score of 9 from Figure 11 since the share of enlisted officers does not change appreciably at the threshold between 8 and 9.

IFAU - The making of a manager 11
mapping from the sum of subscores to the final score changed in 1980. For the 1980-
1988 period, the proportion of squad officers (denoted by white dots) jumps from about
2 % to 28 % when the sum of subscores increases from 17 (and a final score of 4) to 18
(and a final score of 5). Similarly, the proportion of platoon officers (denoted by black
dots) jumps from about 1 % to about 11 % when the sum of subscores increases from 21
(final score 5) to 22 (final score 6).14 There are also smaller jumps in the proportion
platoon officers when the sum of subscores passes the thresholds to final scores 7 and 8.
The patterns are similar for 1970-1979, but the jumps in the share of platoon officers at
a final score of 7 and 8 are stronger for 1970-1979 than for the latter period.
Figure 1. Share commanders by cognitive ability Note: The figure displays the share of squad officers (non-filled circles) and platoon officers (filled circles) by the sum of cognitive subscores. The sample is restricted to men enlisted 1970-1988 (excluding 1978) with a standardized cognitive subscore between 12 and 30. The vertical lines indicate the thresholds for final scores of 4, 5, 6, 7 and 8.
The discontinuous jumps displayed in Figure 1 imply that we can use a “fuzzy”
regression-discontinuity design (RDD) to overcome the selection problem. In essence,
this approach implies that we compare labor market outcomes for men just below and
just above the cognitive score thresholds, and relate this difference to the difference in
the share of officers. Even if officers are positively selected on a wide range of physical
and mental skills, our RDD gives an unbiased estimate of the causal effect as long as
these factors do not change discontinuously at the thresholds.
More formally, let 𝑦𝑖𝑡 denote some labor market outcome of interest for individual i
at time t; 𝑥𝑖 individual i’s sum of subscores (4-36) and 𝑥𝑗 the cutoff to final cognitive 14 The reason the share of squad- and platoon officers below the thresholds to 5 and 6, respectively, is not exactly zero is that a small share of conscripts (0.8%) take a retake test of cognitive skill, implying that they may end up with a score above 5 or 6 despite scoring lower on the first test. Since the decision to take a re-test is potentially correlated with personal characteristics, we base our RDD-strategy solely on the result on the first test.
4 5 6 7 8
0
0.1
0.2
0.3
0.4
0.5
Shar
e of
ficer
s
12 14 16 18 20 22 24 26 28 30
Sum of cognitive subscores
Draft cohort 1970-1979 (excl. 1978)4 5 6 7 8
0
0.1
0.2
0.3
0.4
0.5Sh
are
offic
ers
12 14 16 18 20 22 24 26 28 30
Sum of cognitive subscores
Draft cohort 1980-1988

12 IFAU - The making of a manager
score 𝑗 while 𝑰𝒊 is a vector of indicator variables for draft cohort. Further, let 𝑑𝑖,𝑗 be an
indicator variable equal to 1 in case 𝑥𝑖 ≥ 𝑥𝑗, and let 𝑉𝑆𝑞𝑢𝑎𝑑,𝑖 and 𝑉𝑃𝑙𝑎𝑡𝑜𝑜𝑛,𝑖 denote
dummy variables equal to 1 in case individual i was enlisted as squad or platoon officer,
respectively. In our main case we restrict the sample to men with a final cognitive score
between 3 and 7. Our RDD implies that we use 2SLS to estimate regressions of the type
𝑦𝑖𝑡 = 𝛼𝑆𝑉𝑆𝑞𝑢𝑎𝑑 + 𝛼𝑃𝑉𝑝𝑙𝑎𝑡𝑜𝑜𝑛 + 𝑰𝒊�𝜸0 + 𝜸1𝑥𝑖 + 𝜸2𝑑𝑖,5(𝑥𝑖 − 𝑥5) + 𝜸3𝑑𝑖,6(𝑥𝑖 − 𝑥6)
+ 𝜸4𝑑𝑖,7(𝑥𝑖 − 𝑥7) + 𝜸5𝑥𝑖2 + 𝜸6𝑑𝑖,5(𝑥𝑖 − 𝑥5)2 + 𝜸7𝑑𝑖,6(𝑥𝑖 − 𝑥6)2
+ 𝜸8𝑑𝑖,7(𝑥𝑖 − 𝑥7)2� + 𝜀𝑖𝑡
instrumenting 𝑉𝑆𝑞𝑢𝑎𝑑,𝑖 and 𝑉𝑃𝑙𝑎𝑡𝑜𝑜𝑛,𝑖 using the first stages
𝑉𝑘,𝑖 = 𝑰𝒊�𝜷0 + 𝜹1𝑑𝑖,5 + 𝜹2𝑑𝑖,6 + 𝜹3𝑑𝑖,7 + 𝜷1𝑥𝑖 + 𝜷2𝑑𝑖,5(𝑥𝑖 − 𝑥5) + 𝜷3𝑑𝑖,6(𝑥𝑖 − 𝑥6)
+ 𝜷4𝑑𝑖,7(𝑥𝑖 − 𝑥7) + 𝜷5𝑥𝑖2 + 𝜷6𝑑5(𝑥𝑖 − 𝑥5)2 + 𝜷7𝑑6(𝑥𝑖 − 𝑥6)2
+ 𝜷8𝑑7(𝑥𝑖 − 𝑥7)2� + 𝑣𝑖𝑡
where 𝑘 = {𝑠𝑞𝑢𝑎𝑑, 𝑝𝑙𝑎𝑡𝑜𝑜𝑛}. Our set of instruments for officer training are thus the
indicator variables for final cognitive scores 5, 6 and 7 (𝑑𝑖,5, 𝑑𝑖,6 and 𝑑𝑖,7). The
parameters 𝛽 and 𝛾 reflect the “control function” which controls for the underlying
relationship between cognitive skills and the dependent variables in the first and second
stage. We interact both the control functions and the instruments by draft year (which is
why we use vector notation) since the underlying relationship between cognitive skills
and outcomes may vary across cohorts. Because we interact the control function with
draft year, we do not estimate the first stage directly on the data as shown in Figure 1.
We vary the flexibility of the control function by imposing five different restrictions on
the coefficients for the second-order terms. In the least flexible specification, we set
𝜷6 = 𝜷7 = 𝜷8 = 𝟎 (and, similarly, 𝜸6 = 𝜸7 = 𝜸8 = 𝟎), implying that there are
separate linear terms for cognitive scores groups 3-4, 5, 6 and 7 and a common second-
order polynomial across the entire support of cognitive skill. In the most flexible
specification, we impose no restrictions on the parameters of the control function,
implying that there are separate quadratic terms for final cognitive scores 3-4, 5, 6 and
7. Due to space constraints, we sometimes restrict attention to a “main specification” of
the control function in the paper, and report the complete set of results in Appendix B.
The main specification includes separate second-order terms for final cognitive scores

IFAU - The making of a manager 13
3-4 and 5-7 and is thus an intermediate case in between the least and most flexible
specification.
As pointed out by Lee and Card (2008), a discrete forcing variable may introduce a
grouped error component for each value of the forcing variable. We therefore cluster
standard errors by each unique combination of draft year and sum of subscores in all
specifications.
Since we restrict the sample to men who were enlisted, the parameters 𝛼𝑃 and 𝛼𝑆
capture the effect of military service as squad or platoon officer relative to military
service as a regular soldier. Relatedly, our use of RDD implies that we estimate the
effect of officer training only for the men whose type of military service is affected by
the instruments. Hence, we estimate the causal effect of officer training for men who are
considered suitable for leadership based on their non-cognitive and physical skills.
The sharp increases in the share of conscripted officers at the cognitive score
thresholds shown in Figure 1 suggest that our instruments are relevant. This is
confirmed by Table 1 which shows the results from the first-stage of regression (1),
using the least and most flexible specifications of the control function. For expositional
clarity, we do not interact the instruments with draft year in Table 1 (since this would
require us to report estimates for 57 different instruments). Table 1 shows that the
specification of the control function has almost no effect on how well we fit the first
stage (the 𝑅2 is similar across specifications). We now turn to a discussion of the
exogeneity assumption.

Table 1. First stage regressions (1) (2) (3) (4) (5) (6) (7) (8) 1970-1979 (excluding 1978) 1980-1988 VARIABLES Squad Platoon Squad Platoon Squad Platoon Squad Platoon Final score = 5 0.2130*** 0.0016 0.2141*** 0.0023*** 0.2574*** 0.0042* 0.2587*** 0.0051*** (0.008) (0.002) (0.006) (0.001) (0.008) (0.002) (0.005) (0.001) Final score = 6 0.0171 0.0601*** 0.0233* 0.0591*** -0.0459*** 0.0994*** -0.0484*** 0.0975*** (0.013) (0.005) (0.014) (0.004) (0.009) (0.004) (0.008) (0.004) Final score = 7 0.0425*** 0.0594*** 0.0043 0.0521*** -0.0038 0.0372*** -0.0081 0.0333*** (0.009) (0.006) (0.014) (0.009) (0.005) (0.005) (0.007) (0.004) 1st order term 3-4,5,6,7 3-4,5,6,7 3-4,5,6,7 3-4,5,6,7 3-4,5,6,7 3-4,5,6,7 3-4,5,6,7 3-4,5,6,7 2nd order term 3-7 3-7 3-4,5,6,7 3-4,5,6,7 3-7 3-7 3-4,5,6,7 3-4,5,6,7 F-statistic 238.1 80.10 409.4 80.16 516.1 284.1 1016 240.9 p-value joint significance <0.001 <0.001 <0.001 <0.001 <0.001 <0.001 <0.001 <0.001 N 325,198 325,198 325,198 325,198 324,303 324,303 324,303 324,303 𝑅2 0.134 0.095 0.135 0.096 0.127 0.118 0.128 0.118
Note. All models are OLS-estimates of the final cognitive score thresholds 5-7 on the probability of doing military services as Squad and Platoon officer and include dummies for birth cohort. The sample is restricted to men enlisted 1970-1988 (except 1978) with a sum of cognitive subscore between 12 and 27. The control function is interacted with draft year. One star denotes statistical significance at the 10%-level in a two sided test, two stars significance at the 5%-level and three stars at the 1%-level. Standard errors are clustered at the Sum of cognitive subscores × enlistment year. The F-statistic (3;143 df) tests for joint significance of the final cognitive score thresholds 5-7.
IFAU - The making of a manager 15
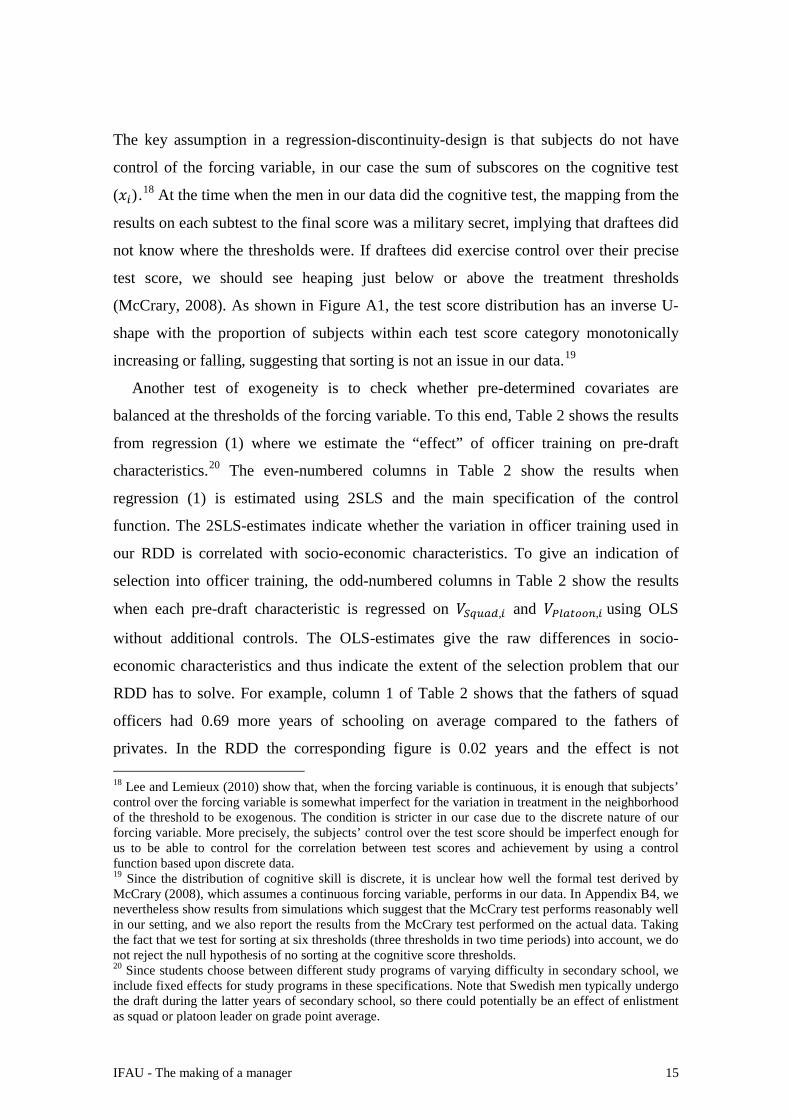
The key assumption in a regression-discontinuity-design is that subjects do not have
control of the forcing variable, in our case the sum of subscores on the cognitive test
(𝑥𝑖).18 At the time when the men in our data did the cognitive test, the mapping from the
results on each subtest to the final score was a military secret, implying that draftees did
not know where the thresholds were. If draftees did exercise control over their precise
test score, we should see heaping just below or above the treatment thresholds
(McCrary, 2008). As shown in Figure A1, the test score distribution has an inverse U-
shape with the proportion of subjects within each test score category monotonically
increasing or falling, suggesting that sorting is not an issue in our data.19
Another test of exogeneity is to check whether pre-determined covariates are
balanced at the thresholds of the forcing variable. To this end, Table 2 shows the results
from regression (1) where we estimate the “effect” of officer training on pre-draft
characteristics.20 The even-numbered columns in Table 2 show the results when
regression (1) is estimated using 2SLS and the main specification of the control
function. The 2SLS-estimates indicate whether the variation in officer training used in
our RDD is correlated with socio-economic characteristics. To give an indication of
selection into officer training, the odd-numbered columns in Table 2 show the results
when each pre-draft characteristic is regressed on 𝑉𝑆𝑞𝑢𝑎𝑑,𝑖 and 𝑉𝑃𝑙𝑎𝑡𝑜𝑜𝑛,𝑖 using OLS
without additional controls. The OLS-estimates give the raw differences in socio-
economic characteristics and thus indicate the extent of the selection problem that our
RDD has to solve. For example, column 1 of Table 2 shows that the fathers of squad
officers had 0.69 more years of schooling on average compared to the fathers of
privates. In the RDD the corresponding figure is 0.02 years and the effect is not 18 Lee and Lemieux (2010) show that, when the forcing variable is continuous, it is enough that subjects’ control over the forcing variable is somewhat imperfect for the variation in treatment in the neighborhood of the threshold to be exogenous. The condition is stricter in our case due to the discrete nature of our forcing variable. More precisely, the subjects’ control over the test score should be imperfect enough for us to be able to control for the correlation between test scores and achievement by using a control function based upon discrete data. 19 Since the distribution of cognitive skill is discrete, it is unclear how well the formal test derived by McCrary (2008), which assumes a continuous forcing variable, performs in our data. In Appendix B4, we nevertheless show results from simulations which suggest that the McCrary test performs reasonably well in our setting, and we also report the results from the McCrary test performed on the actual data. Taking the fact that we test for sorting at six thresholds (three thresholds in two time periods) into account, we do not reject the null hypothesis of no sorting at the cognitive score thresholds. 20 Since students choose between different study programs of varying difficulty in secondary school, we include fixed effects for study programs in these specifications. Note that Swedish men typically undergo the draft during the latter years of secondary school, so there could potentially be an effect of enlistment as squad or platoon leader on grade point average.

16 IFAU - The making of a manager
statistically significant. The results are similar for mother’s years of schooling and
conscripts own performance in school: while officers are positively selected based on
their socioeconomic background, the variation in officer training induced by our
instruments is not significantly correlated with socioeconomic status.21
Interpreting 𝛼𝑃 and 𝛼𝑆 in (1) as the causal effect of doing the military service as an
officer instead of a regular soldier depends upon four additional assumptions. First, an
implicit assumption in our empirical approach is that the effect of officer training does
not depend on cognitive skills. For example, we assume that men who become squad
officers because they get a final cognitive score of 5 have the same treatment effect as
squad officers with a final score of 6. We provide suggestive evidence in support of this
assumption in Appendix B5. Since the assumption of homogeneous treatment effects is
stronger the larger is the support of the cognitive skill distribution, we limit attention to
the 3-7 range of final cognitive scores in our main analysis.
Second, since we restrict the sample to enlisted men, we in effect assume that the
instruments do not affect the probability of being enlisted. We need to impose this
restriction since we lack a valid instrument for enlistment. There is some indications in
the data that the enlistment probability changes at some of the cognitive score
thresholds (see Appendix B6), but the effect is an order of magnitude smaller than the
corresponding estimates for officer training in Table 1.22 Unless men at the margin of
being selected in or out of enlistment at the thresholds have extreme labor market
outcomes, restricting the sample to enlisted men is unlikely to have a significant effect
on the estimated effect of officer training.
Third, we assume that no aspect of the military service except military rank changes
at the cognitive score thresholds. We discuss this assumption at length in Appendix B7.
In short, we find little evidence that other observable dimensions of the military service
change at the cognitive score thresholds where the probability of officer training is
affected.
21 The results for the full set of control functions are available in Appendix B3, along with graphical evidence. In total, we estimate 40 coefficients (2 types of officer training in 5 specifications for 4 different outcomes) for the “effect” of officer training on pre-draft characteristics, out of which 5 are statistically significant at the 10-percent level (4 of which are negative) and 1 at the 5-percent level. 22 Another way to see that the effect on enlistment probability is small is that the F-statistic is at most 5.2, while the F-statistic for officer training in Table 1 varies from 80 to 1016.

Table 2. Officer training and pre-draft characteristics Outcome Father’s years of schooling Mother’s years of schooling High School graduate High school GPA (1) (2) (3) (4) (5) (6) (7) (8) Estimator OLS 2SLS OLS 2SLS OLS 2SLS OLS 2SLS Squad 0.6905*** 0.0193 0.6478*** -0.1324* 0.1085*** -0.0009 0.1935*** -0.0142 (0.0099) (0.0878) (0.0092) (0.0726) (0.0009) (0.0119) (0.0042) (0.0242) Platoon 1.4574*** 0.2591 1.3319*** -0.1006 0.1448*** 0.0123 0.3452*** 0.1564 (0.0198) (0.3066) (0.0176) (0.2488) (0.0010) (0.0250) (0.0070) (0.1686) N 570,669 570,669 588,743 588,743 649,501 649,501 109,499 109,499 𝑅2 0.1598 0.1690 0.1648 0.1705 0.0521 0.0781 0.0812 0.1481
Note. All models include controls for birth cohort. The regressions for GPA also include fixed effects for type of study program. GPA is set on a scale from 0.0 to 5.0 where 5.0 is the highest. The sample in specification (1)-(6) is restricted to men enlisted 1970-1988 (except 1978) with a sum of cognitive score between 12 and 27. In specification (7) and (8) the sample is restricted to men who graduated from high school between 1985 and 1988 and were enlisted in 1984 or later. For the 2SLS estimates, the control function includes a quadratic in the sum of cognitive scores with separate first (second) order terms for final scores of 3-4, 5, 6 and 7 (3-4 and 5-7), interacted with draft year. Robust standard errors which are clustered at the Sum of cognitive subscores × enlistment year for the 2SLS-estimates. One star denotes statistical significance at the 10%-level in a two sided test, two stars significance at the 5%-level and three stars at the 1%-level
18 IFAU - The making of a manager
Fourth, interpreting the results as an effect of the military service hinges on the
assumption that the instruments do not affect attrition from the military service, in the
sense of not beginning military training (despite being enlisted at the military draft) or
leaving the military service prematurely. As we lack comprehensive data over actual
service, we cannot observe attrition for each individual in the data. From 1983 to 1988
we do, however, observe financial compensation while in the military service for a 3
percent (representative) sample of the population available in the data base LINDA. As
shown in Appendix B8, our analysis of this data does not support the conclusion that
attrition in between the draft and the onset of the military service is related to enlistment
as an officer.23
5 Results We now turn to our results with respect to the effect of officer training on labor market
outcomes. We concentrate on labor market outcomes between age 30 and 40, typically
between 10 and 20 years after leaving the military service. Graphical evidence not
reported in the paper is available along with reduced-form estimates in Appendix B9 for
all main outcomes.
5.1 Leadership Panel A of Figure 2 shows how the proportion of managers depends on cognitive skill.
There are indications in the data that the share of managers exhibits discrete jumps at
the thresholds associated with the largest changes in the share of conscripted platoon
officers shown in Figure 1.
23 Because there is variation in the duration of the military service within a given rank, and variation in the total compensation for a given level of duration, we are not able to use the LINDA data to make inference regarding attrition conditional of starting the military service.

IFAU - The making of a manager 19
Figure 2. Probability of holding a managerial position Note: The figure shows the share of managers between age 30 and 40 by the sum of standardized cognitive subscores, residualized for birth year and observation year. The sample is restricted to men enlisted 1974-1988 (excluding 1978) with a standardized cognitive subscore between 12 and 27. The control function includes a quadratic in the sum of cognitive scores with separate first (second) order terms for final scores of 3-4, 5, 6 and 7 (3-4 and 5-7). The vertical lines indicate the thresholds for final scores of 5, 6, and 7.
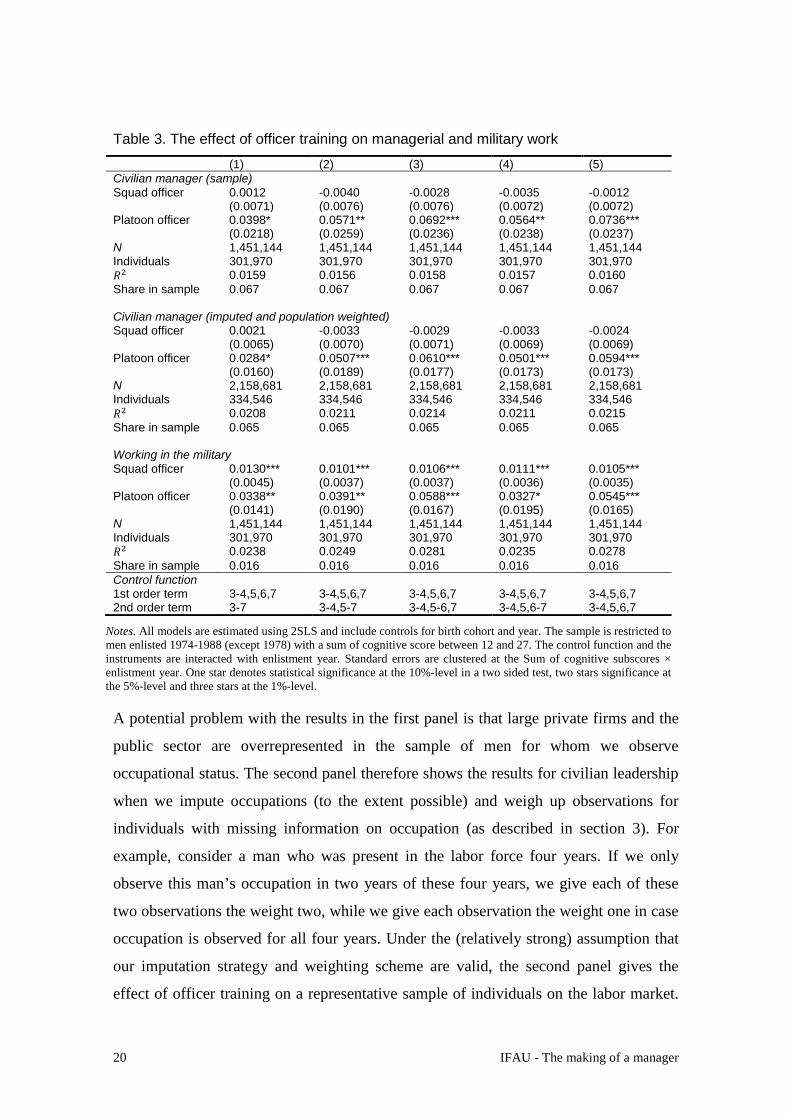
The upper panel in Table 3 shows the estimated effect of officer training on civilian
leadership that corresponds to the graphical evidence in Figure 2. In specification (1),
platoon officer training increases the probability of attaining a managerial position by
4.0 percentage points. Allowing for a separate quadratic terms between final scores 3-4
and 5-7 in specification (2) increases the estimated effect of platoon officer training to
5.7 percentage points. The three most flexible specifications give estimates for platoon
officer training of up to 7.4 percentage points. Because a more flexible control function
makes the estimates sensitive to observations close to the treatment thresholds, we de-
emphasize the high end of our estimates for platoon officer training. Rather,
specification (3)-(5) show that the significant effects we estimate in the less flexible
specifications are not sensitive to relaxing the parametric assumptions on the control
function. The estimated effect of squad officer training on civilian leadership is close to
zero in all specifications and never statistically significant.
-0.04
-0.02
0.00
0.02
0.04
Man
ager
ial p
ositi
on (r
es)
12 14 16 18 20 22 24 26 28Sum of cognitive subscore
Draft cohort 1974-1979 (excl. 1978)
-0.04
-0.02
0.00
0.02
0.04
Man
ager
ial p
ositi
on (r
es)
12 14 16 18 20 22 24 26 28Sum of cognitive subscore
Draft cohort 1980-1988
A. Civilian leadership not imputed for military workers
-0.04
-0.02
0.00
0.02
0.04
Man
ager
ial p
ositi
on (r
es)
12 14 16 18 20 22 24 26 28Sum of cognitive subscore
Draft cohort 1974-1979 (excl. 1978)
-0.04
-0.02
0.00
0.02
0.04
Man
ager
ial p
ositi
on (r
es)
12 14 16 18 20 22 24 26 28Sum of cognitive subscore
Draft cohort 1980-1988
B. Civilian leadership imputed for military workers using occupations of ex-military workers
20 IFAU - The making of a manager
Table 3. The effect of officer training on managerial and military work (1) (2) (3) (4) (5) Civilian manager (sample) Squad officer 0.0012 -0.0040 -0.0028 -0.0035 -0.0012 (0.0071) (0.0076) (0.0076) (0.0072) (0.0072) Platoon officer 0.0398* 0.0571** 0.0692*** 0.0564** 0.0736*** (0.0218) (0.0259) (0.0236) (0.0238) (0.0237) N 1,451,144 1,451,144 1,451,144 1,451,144 1,451,144 Individuals 301,970 301,970 301,970 301,970 301,970 𝑅2 0.0159 0.0156 0.0158 0.0157 0.0160 Share in sample 0.067 0.067 0.067 0.067 0.067 Civilian manager (imputed and population weighted) Squad officer 0.0021 -0.0033 -0.0029 -0.0033 -0.0024 (0.0065) (0.0070) (0.0071) (0.0069) (0.0069) Platoon officer 0.0284* 0.0507*** 0.0610*** 0.0501*** 0.0594*** (0.0160) (0.0189) (0.0177) (0.0173) (0.0173) N 2,158,681 2,158,681 2,158,681 2,158,681 2,158,681 Individuals 334,546 334,546 334,546 334,546 334,546 𝑅2 0.0208 0.0211 0.0214 0.0211 0.0215 Share in sample 0.065 0.065 0.065 0.065 0.065 Working in the military Squad officer 0.0130*** 0.0101*** 0.0106*** 0.0111*** 0.0105*** (0.0045) (0.0037) (0.0037) (0.0036) (0.0035) Platoon officer 0.0338** 0.0391** 0.0588*** 0.0327* 0.0545*** (0.0141) (0.0190) (0.0167) (0.0195) (0.0165) N 1,451,144 1,451,144 1,451,144 1,451,144 1,451,144 Individuals 301,970 301,970 301,970 301,970 301,970 𝑅2 0.0238 0.0249 0.0281 0.0235 0.0278 Share in sample 0.016 0.016 0.016 0.016 0.016 Control function 1st order term 3-4,5,6,7 3-4,5,6,7 3-4,5,6,7 3-4,5,6,7 3-4,5,6,7 2nd order term 3-7 3-4,5-7 3-4,5-6,7 3-4,5,6-7 3-4,5,6,7
Notes. All models are estimated using 2SLS and include controls for birth cohort and year. The sample is restricted to men enlisted 1974-1988 (except 1978) with a sum of cognitive score between 12 and 27. The control function and the instruments are interacted with enlistment year. Standard errors are clustered at the Sum of cognitive subscores × enlistment year. One star denotes statistical significance at the 10%-level in a two sided test, two stars significance at the 5%-level and three stars at the 1%-level.
A potential problem with the results in the first panel is that large private firms and the
public sector are overrepresented in the sample of men for whom we observe
occupational status. The second panel therefore shows the results for civilian leadership
when we impute occupations (to the extent possible) and weigh up observations for
individuals with missing information on occupation (as described in section 3). For
example, consider a man who was present in the labor force four years. If we only
observe this man’s occupation in two years of these four years, we give each of these
two observations the weight two, while we give each observation the weight one in case
occupation is observed for all four years. Under the (relatively strong) assumption that
our imputation strategy and weighting scheme are valid, the second panel gives the
effect of officer training on a representative sample of individuals on the labor market.

IFAU - The making of a manager 21
The estimated effect of platoon officer training is between 0.6 and 1.4 percentage points
lower in the second panel, but since the standard errors are lower the level of statistical
significance is higher.
To put the estimated effect of platoon officer training into perspective, note that since
the share of managers in the relevant segment of the male population (i.e. with a
cognitive skill scores between 3 and 7) is 6.7 percent, a 5 percentage point increase in
the share managers corresponds to approximately 75 percent.
The third panel shows the effect of officer training on working in the military. Squad
officer training increases the probability of military work by about 1.0-1.3 percentage
points compared to 3.3-5.9 percentage points for platoon officers. The main reason for
these results is that officer training during the military service is a requirement for
admission into military college and a career as a professional officer.
Since workers employed by the military are defined as non-managers, the fact that
officer training induces selection into the military implies that the results in Table 3 may
underestimate the effect of officer training on civilian leadership. The reason is that we
implicitly assume that no military workers would have become managers had they
instead opted for a civilian career. In order to assess the extent of this bias, we impute
the counterfactual share of managers among military workers using i) their cognitive
and non-cognitive skills from the military draft or ii) the civilian career outcomes for
military workers who leave the military (see Appendix C2 for details). As shown in
Table 4, both of these approaches increase the estimated effect of platoon officer
training on civilian leadership. Panel B of Figure 2 provides graphical evidence based
on the second imputation. Table 4 also shows that the effect of platoon officer training
on civilian leadership is robust to controlling for socioeconomic characteristics,
estimation with LIML instead of 2SLS, and when we consider more narrow (3-6, 4-7)
and wider (3-8) partitions of the cognitive skill score distribution. The robustness tests
in Table 4 with the full set of specifications of the control function are provided in
Appendix B10.

Table 4. The effect of officer training on managerial work: Robustness tests (1) (2) (3) (4) (5) (6) (7) (8) Imputing civilian occupations
for military workers Different support Controlling for socio-economic
characteristics LIML
Squad officer -0.0033 -0.0025 -0.0044 0.0012 -0.0035 -0.0089 -0.0090 -0.0044 (0.0074) (0.0073) (0.0073) (0.0134) (0.0077) (0.0085) (0.0086) (0.0076) Platoon officer 0.0605** 0.0682*** 0.0921*** 0.0590** 0.0671*** 0.0650** 0.0673*** 0.0568** (0.0259) (0.0252) (0.0246) (0.0263) (0.0240) (0.0256) (0.0255) (0.0269) N 1,451,144 1,451,144 1,186,772 1,290,136 1,620,943 1,286,592 1,286,592 1,451,144 Individuals 301,970 301,970 248,557 267,550 336,027 259,001 259,001 301,970 𝑅2 0.0172 0.0184 0.0122 0.0141 0.0166 0.0161 0.0150 0.0155 Socioeconomic controls - - - - - Yes No - Imputation technique Skills Ex-military workers - - - - - - Support - - 3-6 4-7 3-8 - - - Control function 1st order term 3-4,5,6,7 3-4,5,6,7 3-4,5,6 4,5,6,7 3-4,5,6,7,8 3-4,5,6,7 3-4,5,6,7 3-4,5,6,7 2nd order term 3-4,5-7 3-4,5-7 3-4,5-6 4,5-7 3-4,5-8 3-4,5-7 3-4,5-7 3-4,5-7
Notes. All models are estimated using 2SLS and include controls for birth cohort and year. Column (1) also includes fixed effects for the mother’s and father’s years of schooling and an indicator variable for whether the mother and father is born in a non-Nordic country. The sample is restricted to men enlisted 1974-1988 (except 1978) with a sum of cognitive score between 12 and 27. The control function and the instruments are interacted with enlistment year. Standard errors are clustered at the Sum of cognitive subscores × enlistment year. One star denotes statistical significance at the 10%-level in a two sided test, two stars significance at the 5%-level and three stars at the 1%-level. The sample in column (7) is restricted to men with non-missing values on the vector of socio-economic controls. The results for the full set of specifications of the control function are available in Appendix B3.

IFAU - The making of a manager 23
In Appendix B11 we also report results from regressions where we instead define the
dependent variable as having attained a leadership position at some point in the career.
While these estimates are less precise (because we make use of less data), they indicate
that the effect of platoon officer training is increasing with labor market experience. A
natural explanation for this result is that few men obtain managerial positions early in
their careers (see Figure B11. 1).
5.2 Education and other labor market outcomes The two upper panels of Table 5 show the effect of officer training on educational
attainment. Squad officer training increases the probability of attaining at least three
years of tertiary education (roughly corresponding to a B.Sc. degree) by about 3
percentage points while the probability to attain at least five years of tertiary education
(corresponding to a M.Sc. degree) increases by 0.6-1.0 percentage points. Platoon
officer training increases the probability of attaining a 5-year degree by 2.5-3.9
percentage points. We de-emphasize the nominally significant effect of platoon officer
training on 3-year degrees in specification (1) since this result is not robust to allowing
for a more flexible control function. The third panel of Table 5 shows that platoon
officer training delays entry into the labor market by about 1 year. Part of the
explanation for this result is the longer duration of military service associated with
officer training. Finally, we estimate a wage premium of 0.6 to 3.1 percent for platoon
officers depending on the exact specification, though the effect is never statistically
significant. The estimated wage premiums for platoon officer training, though
imprecise, are consistent with the wage differential between managers and non-
managers we observed in the data. 24 We show in Appendix B12 and B13 that the
results for wages and educational attainment are generally robust to the same types of
tests we have conducted for civilian leadership.25
24 Controlling for educational attainment, cognitive and non-cognitive skills, we estimate a manager wage premium of 30 percent. Suppose this figure reflects the manager wage premium for the men who become managers as a result of platoon officer training. The results in Table 3 would then imply that the positive effect of officer training on the probability to become a manager can account for an increase in average wages by between 1.2 and 2.2 percent, which is similar to the actual wage premia we estimate. Note that the example above does not take into account the negative effect of officer training on wages due to later entry into the labor market. 25 An exception is that including men with a cognitive score of 8 make results for educational attainment sensitive to the exact specification of the control function, suggesting that it is hard to properly control for the strong underlying relationship between educational attainment and cognitive skills at the high end of the distribution of cognitive skill.

24 IFAU - The making of a manager
Table 5. The effect of officer training on education and labor market outcomes (1) (2) (3) (4) (5) 3-year tertiary degree or higher Squad officer 0.0290*** 0.0371*** 0.0349*** 0.0342*** 0.0338*** (0.0061) (0.0065) (0.0065) (0.0062) (0.0062) Platoon officer 0.0484*** 0.0205 0.0112 0.0126 -0.0143 (0.0178) (0.0263) (0.0274) (0.0266) (0.0249) N (individuals) 649,501 649,501 649,501 649,501 649,501 𝑅2 0.0833 0.0797 0.0783 0.0785 0.0741 5-year tertiary degree or higher Squad officer 0.0056** 0.0100*** 0.0106*** 0.0069*** 0.0071*** (0.0023) (0.0021) (0.0021) (0.0019) (0.0019) Platoon officer 0.0387*** 0.0290** 0.0247** 0.0369*** 0.0342*** (0.0090) (0.0124) (0.0122) (0.0115) (0.0108) N (individuals) 649,501 649,501 649,501 649,501 649,501 𝑅2 0.0184 0.0184 0.0182 0.0186 0.0187 Age at labor market entry Squad officer 0.0699 -0.0435 -0.0360 -0.0352 -0.0119 (0.1200) (0.1284) (0.1281) (0.1262) (0.1269) Platoon officer 0.9971*** 1.3728*** 1.1933** 1.4203*** 1.2170** (0.2890) (0.4565) (0.5034) (0.4377) (0.4701) N (individuals) 133,781 133,781 133,781 133,781 133,781 𝑅2 0.0872 0.0830 0.0843 0.0829 0.0849 Log wages (age 30-40) Squad officer -0.0073 -0.0025 -0.0007 -0.0004 0.0007 (0.0075) (0.0079) (0.0079) (0.0075) (0.0075) Platoon officer 0.0275 0.0130 0.0309 0.0063 0.0213 (0.0201) (0.0243) (0.0235) (0.0240) (0.0237) N (yearly observations) 2,220,565 2,220,565 2,220,565 2,220,565 2,220,565 Individuals 422,786 422,786 422,786 422,786 422,786 R2 0.2673 0.2659 0.2692 0.2652 0.2680 Control function 1st order term 3-4,5,6,7 3-4,5,6,7 3-4,5,6,7 3-4,5,6,7 3-4,5,6,7 2nd order term 3-7 3-4,5-7 3-4,5-6,7 3-4,5,6-7 3-4,5,6,7
Notes. All models are estimated using 2SLS and include controls for birth cohort. The regressions for log wages also include controls for observation year. The sample is restricted to men enlisted 1970-1988 (except 1978) with a sum of cognitive score between 12 and 27, except for wages where we only consider men born in 1974 or later. Age at labor market entry is only estimated for draft cohorts 1985-1988 since data on income is available from 1985. The control function and the instruments are interacted with enlistment year. Standard errors are clustered at the Sum of cognitive subscores × enlistment year. One star denotes statistical significance at the 10%-level in a two sided test, two stars significance at the 5%-level and three stars at the 1%-level. For educational attainment and age at labor market entry, each individual occurs once in the data. For wages, each year for which we observe an individual is one observation. Missing values for wages have not been imputed.
6 Mechanisms In the previous section, we showed that military service as a platoon officer had a
sizeable positive effect on civilian leadership. Our identification strategy does not allow
us to identify the mechanism behind the effect, but given the exceptional exposure to
leadership received by conscripted officers, a potential explanation is that conscripted

IFAU - The making of a manager 25
platoon officers acquire leadership-specific skills during the military service. In this
section, we provide suggestive evidence against a number of alternative mechanisms.
First, officer training may signal a high level of cognitive and non-cognitive skill to
employers. Models of employer learning (Altonji and Pierret, 2001; Lange 2007)
predict that the return to return to officer training should fall – and the return to skills
increase – with experience if employers use officer training to infer applicants’ skills.
Estimating OLS regressions in the spirit of Altonji and Pierret, we find that the return to
both skills and platoon officer training increases with experience, while the return to
squad officer training decreases slightly (see Appendix B15). These results – which are
based on strong identification assumptions – suggest that signaling does not explain the
effect of platoon officer training on civilian leadership. A related piece of evidence in
line with a limited role of signaling is that we find no evidence that platoon officers are
more likely to leave managerial positions (see Appendix B15).
A second potential mechanism is that officer training create networks which are
valuable throughout civilian careers (Laschever, 2009). We use information on rank,
line of service and year of enlistment to create rough measures of peer groups during the
military service. We then test for a specific type of network effect: whether conscripted
officers are more likely than regular soldiers to work in firms with a high fraction of
men from their peer group, controlling for the size of the peer group. As shown in
Appendix B15, the share of peers is in fact lower for officers than for regular soldiers.
While not obtaining support for a network effect, we acknowledge that there are many
other potential types of officer networks (e.g. across firms) that we cannot test for.
Third, the effect of officer training on managerial positions could be mediated by
education. However, the correlation between education and managerial positions is too
weak to rationalize more than a small share of the manager effect. Table B15.4 shows
that, controlling for cognitive and non-cognitive skills, one more years of schooling
predicts a 0.17 percentage point higher probability to hold a managerial position
between the age of 30 and 40. Multiplying this number with the highest point estimate
for the estimated causal effect of platoon officer training on years of schooling (0.45,
26 IFAU - The making of a manager
see Table B15.5) implies that educational attainment can account for 1-2 % of the
estimated effect of platoon officer training on civilian leadership.26
Fourth, the effect of officer training could be a mechanical effect of selection into
“hierarchical” firms with a high fraction of managers. However, as shown in Appendix
B15, we find no evidence that officer training affects selection into firms with a higher
share of managers.
Why did officer training increase educational attainment? Table B13.6 shows that the
effect of officer training on educational attainment is robust to excluding military
college from our set of tertiary degrees.27 An alternative mechanism, which we consider
plausible but for which we lack direct evidence, is that educational choices post-military
service is affected by military service peers. Since conscripted officers have higher
high-school GPA and come from a higher socio-economic background (see Table 2),
men selected into officer training because they pass the threshold to a higher final
cognitive score spend their military service in a peer group with higher educational
aspirations at a point in time when they themselves are likely to decide whether to enter
into higher education.
7 Conclusions In this paper, we have conducted the first large-scale evaluation of whether exposure to
leadership actually promotes leadership. We find that the training received by
conscripted platoon officers in the Swedish armed forces had a strong, positive effect on
the probability of attaining a managerial position in the civilian labor market, and also
on the propensity to enter into higher education post-military service. We have also
presented suggestive evidence that the effect on civilian leadership is not due to
signaling, networks or a direct effect on education. Conscripted officers also get little
training which is directly valuable to specific firms or industries. Even though
alternative mechanisms cannot be ruled out, our results are thus consistent with the view
that there is a general type of leadership skill that can be acquired via training or
experience (Murphy and Zabojnik 2006; Frydman 2007). 26 Since years of schooling is also a function of completing secondary school, which is determined before the onset of the military service, we focused on the attainment of higher degrees in our main set of outcomes. However, in the back-of-the-envelope calculation presented above, years of schooling is more convenient. 27 Since it was not possible to avoid the military service by enrolling into higher education, a direct “enlistment effect” on educational attainment is unlikely.

IFAU - The making of a manager 27
References Altonji, Joseph G., and Charles R. Pierret. 2001. “Employer Learning and Statistical
Discrimination.” Quarterly Journal of Economics, 116(1), 313–350.
Adams, Renée, Heitor Almeida, and Daniel Ferreira. 2005. “Powerful CEOs and Their
Impact on Corporate Performance.” Review of Financial Studies, 18(4): 1403–32.
Angrist, Joshua. D. 1990. “Lifetime Earnings and the Vietnam Era Draft Lottery:
Evidence from Social Security Administrative Records.” American Economic
Review, 80(3): 313–336.
Angrist, Joshua D. 1993. “The Effect of Veterans Benefits on Education and Earnings.”
Industrial and Labor Relations Review, 46(4): 637–652.
Angrist, Joshua D., and Alan B. Krueger. 1994. “Why Do World War II Veterans Earn
More Than Nonveterans?” Journal of Labor Economics, 12(1): 74–97.
Angrist, Joshua. D. 1998. “Estimating the Labor Market Impact of Voluntary Military
Service Using Social Security Data on Military Applicants.” Econometrica, 1998,
66(2), 249–288.
Angrist, Joshua D. and Stacey Chen. 2011. “Schooling and the Vietnam-Era GI Bill:
Evidence from the Draft Lottery.” American Economic Journal: Applied Economics,
3(2): 96–118.
Angrist, Joshua D., Stacey H. Chen, and Jae Song. 2011. “Long-Term Consequences of
Vietnam-Era Conscription: New Estimates Using Social Security Data.” American
Economic Review, 101(3): 334–38.
Barling, Julian, Tom Weber, and E. Kevin Kelloway. 1996. “Effects of Transforma-
tional Leadership Training on Attitudinal and Financial Outcomes: A Field
Experiment.” Journal of Applied Psychology, 81(6): 827–832.
Bauer, Thomas K., Stefan Bender, Alfredo R. Paloyo, and Christoph M. Schmidt. 2012.
“Evaluating the Labor-market Effects of Compulsory Military Service.” European
Economic Review, 56 (4): 814–829.

28 IFAU - The making of a manager
Bauer, Thomas K., Stefan Bender, Alfredo R. Paloyo, and Christoph M. Schmidt. 2014.
“Do Guns Displace Books? – The Impact of Compulsory Military Service on
Educational Attainment.” Economics Letters, 124(3): 513–515.
Benmelech, Efraim, and Carola Frydman. “Military CEOs”, Mimeo, 2010.
Bennedsen, Morten, Francisco Pérez-Gonzáles, Kasper Meisner Nielsen, and Daniel
Wolfenzon. 2007. “Inside the Family Firm: The Role of Families in Succession
Decisions and Performance.” Quarterly Journal of Economics, 122(2): 647–691.
Bennedsen, Morten, Francisco Pérez-Gonzáles, and Daniel Wolfenzon. 2006. “Do
CEOs Matter?” NYU Working Paper No. FIN-06-032.
Bertrand, Marianne, and Antoinette Schoar. 2003. “Managing with Style: The Effect of
Managers on Corporate Policy.” Quarterly Journal of Economics. 118(4): 1169–208.
Bewley, Truman F. 1999. Why Wages Don’t Fall During a Recession, Cambridge, MA:
Harvard University Press.
Bloom, Nicholas, and John Van Reenen. 2007. “Measuring and Explaining Manage-
ment Practices across Firms and Countries.” Quarterly Journal of Economics,
122(4): 1351–1408.
Böhlmark, Anders, Erik Grönqvist and Jonas Vlachos. 2012 "The Headmaster Ritual:
The Importance of Management for School Outcomes", IFAU Working paper
2012:16.
Bound, John, and Sarah Turner. 2002. “Going to War or Going to College: Did World
War II and the G.I. Bill Increase Educational Attainment for Returning Veterans?”
Journal of Labor Economics, 20(4): 784–815.
Card, David, and Ana Rute Cardoso. 2012. “Can Compulsory Military Service Increase
Civilian Wages? Evidence from the Peacetime Draft in Portugal.” American
Economic Journal: Applied Economics, 4(4): 57–93.
Card, David, and Thomas Lemieux. 2001. “Going to College to Avoid the Draft: The
Unintended Legacy of the Vietnam War.” American Economic Review, 91(2): 97–
102.

IFAU - The making of a manager 29
Cipollone, Piero, and Alfonso Rosolia. 2007. “Social Interactions in High School:
Lessons from an Earthquake.” American Economic Review, 97(3): 948–965.
Dewan, Torun, and David P. Myatt. 2008. “The Qualities of Leadership: Direction,
Communication, and Obfuscation.” American Political Science Review, 102(3): 351–
368.
Dhuey, Elizabeth, and Stephen Lipscomb. 2008. “What Makes A Leader? Relative Age
and High School Leadership.” Economics of Education Review, 27(2): 173–183.
Dvir, Taly, Dov Eden, Bruce Avolio, and Boas Shamir. 2002. “Impact of Transfor-
mational Leadership on Follower Development and Performance: A Field Experi-
ment.” Academy of Management Journal, 45(4): 735–744.
Ericsson, Lars. 1999. Medborgare i vapen – värnplikten i Sverige under två sekel.
Historiska media, Lund.
Fehr, Ernst, Simon Gächter, and Georg Kirchsteiger. 1997. “Reciprocity as a Contract
Enforcement Device: Experimental Evidence.” Econometrica, 65(4): 833–860.
Frederiksen, Anders and Takao Kato. 2011. ”Human Capital and Career Success:
Evidence from Linked Enployer-Employee Data.” IZA Discussion Paper No. 5764.
Frydman, Carola. 2007. “Rising through the Ranks. The Evolution of the Market for
Corporate Executives 1936–2003.” Working Paper, MIT Sloan.
Giroud, Xavier, and Holger Mueller. 2010. “Does Corporate Governance Matter in
Competitive Industries?” Journal of Financial Economics, 95(3): 312–331.
Grenet, Julien, Robert A. Hart, and J. Elizabeth Roberts. 2011. “Above and beyond the
Call: Long-term Real Earnings Effects of British Male Military Conscription in the
Post-War Years.” Labour Economics, 18(2):194–204.
Hanes, Niklas, Erik Norlin, and Magnus Sjöström. 2010. ”The Civil Returns of Military
Training: A Study of Young Men in Sweden.” Defence and Peace Economics, 21(5-
6): 547–565.
Hermalin, Benjamin E. “Toward an Economic Theory of Leadership: Leading by
Example.” American Economic Review, 88(5), 1188–1206.

30 IFAU - The making of a manager
Hogan, Robert, Gordon Curphy, and Joyce Hogan. 1994. “What We Know About
Leadership: Effectiveness and Personality.” American Psychologist, 49(6): 493-504.
Huson, Mark, Paul Malatesta, and Robert Parrino. 2004. “Managerial Succession and
Firm Performance.“ Journal of Financial Economics, 74(2): 237–275.
Imbens, Guido, and Wilbert van der Klaauw. 1995. “Evaluating the Cost of Conscrip-
tion in The Netherlands.” Journal of Business and Economic Statistics, 13(2): 72–80.
Jones, Benjamin F., and Benjamin A. Olken. 2005. “Do Leaders Matter? National
Leadership and Growth Since World War II.” Quarterly Journal of Economics,
120(3): 835–864.
Kaplan Steven, Mark Klebanov, and Morten Sorensen. 2012. “Which CEO Charac-
teristics and Abilities Matter?”, Journal of Finance, 67(3): 973–1007.
Kuhn, Peter, and Catherine Weinberger. 2005. “Leadership Skills and Wages.” Journal
of Labor Economics, 23(3): 395–436.
Lange, Fabian. 2007. “The Speed of Employer Learning.” Journal of Labor Economics,
25(1), 1–35.
Laschever, Ron. 2009. “The Doughboys Network: Social Interactions and the
Employment of World War I Veterans.” Mimeo, University of Illinois at Urbana-
Champaign.
Lazear, Edward P. 2004. “Balanced Skills and Entrepreneurship.” American Economic
Review, 94(2): 208–211.
Lazear, Edward P. 2005. “Entrepreneurship.” Journal of Labor Economics, 23(4): 649–
680.
Lazear, Edward P. 2012. “Leadership: A Personnel Economics Approach.” Labour
Economics, 19(1): 92–101.
Lazear, Edward P., Katryn L. Shaw and Christopher T. Stanton. 2012. “The Value of
Bosses.” NBER Working Paper No. 18317.
Lee, David S., and David Card. 2008. “Regression Discontinuity Inference with
Specification Error.” Journal of Econometrics, 142(2): 655–74.
IFAU - The making of a manager 31
Lee, David S. and Lemieux, Thomas. 2010. “Regression Discontinuity Designs in
Economics.” Journal of Economic Literature 48(2): 281–355.
Lindqvist, Erik, and Roine Vestman. 2011. “The Labor Market Returns to Cognitive
and Noncognitive Ability: Evidence from the Swedish Enlistment.” American
Economic Journal: Applied Economics, 3(1): 101–128.
Lindqvist, Erik. 2012. “Height and Leadership.” Review of Economics and Statistics,
94(4), 1191–1196.
Malmendier, Ulrike, and Geoffrey Tate. 2005. “CEO Overconfidence and Corporate
Investment.” Journal of Finance, 60(6): 2661–2700.
Malmendier, Ulrike, and Geoffrey Tate. 2009. “Superstar CEOs.” Quarterly Journal of
Economics, 124(4): 1593–1638.
Maurin, Eric, and Theodora Xenogiani. 2007. “Demand for Education and Labor
Market Outcomes: Lessons from the Abolition of Compulsory Conscription in
France.” Journal of Human Resources, 42(4): 795–819.
McCrary, Justin. 2008. “Manipulation of the running variable in the regression disconti-
nuity design: A density test.” Journal of Econometrics, 142(2): 698–714.
Murphy Kevin J., and Jan Zabojnik. 2006. “Managerial Capital and the Market for
CEOs.” Working Papers, USC.
Myerson, Roger B. 2004. “Justice, Institutions, and Multiple Equilibria.” Chicago
Journal of International Law, 5(1): 91–107.
Pérez-González, Francisco. 2006. “Inherited Control and Firm Performance.” American
Economic Review, 96(5): 1559–1588.
SOU 1965:68. Värnplikten: Betänkande avgivet av 1960 års värnpliktsutredning,
Försvarsdepartmentet.
SOU 1984:71. Värnplikten i framtiden: Betänkande av 1983 års värnpliktsutbildnings-
kommitté, Försvarsdepartementet.
The Supreme Commander. 1986. Chefen och ledarskapet, Försvarets läromedelsanstalt.

32 IFAU - The making of a manager

IFAU - The making of a manager 33
Appendix A. Descriptive statistics
Table A1. Descriptive statistics Mean SD Min Max N Individuals Manager (sample) .067 .249 0 1 1451144 301970 Manager (imputed and population weighted)
.065 .246 0 1 2158681 334546
Military work .016 .124 0 1 1451144 301970 Normalized log wage 8.953 .292 7.024 12.710 2220565 422786 Age at labor market entry 19.755 2.305 16 43 133781 133781 Years of schooling 12.316 2.399 7.5 20.4 649501 649501 3yrs tertiary education .133 .339 0 1 649501 649501 5 yrs tertiary education .015 .120 0 1 649501 649501 Secondary education .852 .356 0 1 649501 649501 Fathers yrs of schooling 8.876 3.014 6.600 20.4 570669 570669 Mothers yrs of schooling 9.474 2.897 6.600 20.4 588743 588743 High school GPA 3.092 .576 0 5 109499 109499 Year of birth 1960.7 5.667 1950 1971 649501 649501 Squad officer .204 .403 0 1 649501 649501 Platoon officer .060 .238 0 1 649501 649501
The sample is restricted to men with a sum of cognitive score between 12 and 27 and for which educational attainment is observable. In addition, the sample for “manager”, “military work” and “log wages” is restricted to men between age 30 and 40 while there is no age restriction for any of the other variables (since they are time-invariant). The sample for “manager” and “military work” is further restricted to men born between 1974 and 1988 while the sample for all other outcomes is restricted to men born between 1970 and 1988 (excluding 1978). We impose these restrictions since as they correspond to the restrictions in the main analysis for each outcome.
Figure A1. Distribution of cognitive skill Notes: The figure shows histograms for the distribution of cognitive skills for draft cohorts 1970-1979 (excluding 1978) and 1980-1988. The vertical lines indicate the thresholds for cognitive score groups 1-9. The red lines indicates a normal distributions with the same mean and variance as the empirical (discrete) distributions of cognitive skill, and are intended only as a benchmark to the empirical distributions.
1 2 3 4 5 6 7 8 9
0.00
0.02
0.04
0.06
0.08
Den
sity
4 8 12 16 20 24 28 32 36Sum of cognitive subscores
Draft cohort 1970-1979 (excl. 1978)
1 2 3 4 5 6 7 8 9
0.00
0.02
0.04
0.06
0.08
Den
sity
4 8 12 16 20 24 28 32 36Sum of cognitive subscores
Draft cohort 1980-1988

34 IFAU - The making of a manager
Appendix B. Additional empirical results Content of Appendix B
B1. Basic descriptive statistics ........................................................................................ 35 B2. Selection into sample for which occupational status is observed ............................. 36 B3. Balance of pre-draft characteristics at the cognitive score thresholds ...................... 37 B4. Test of sorting at cognitive score thresholds following McCrary (2008) ................. 40 B5. Assumption #1: Treatment effect homogeneity ........................................................ 42 B6. Assumption #2: Probability of enlistment ................................................................ 43 B7. Assumption #3: Other dimensions of the military service........................................ 44 B8. Assumption #4: Attrition from the military service .................................................. 47 B9. Reduced-form results for main outcomes ................................................................. 48 B10. Full set of results for Table 4 .................................................................................. 56 B11. Alternative definitions of leadership ....................................................................... 59 B12. Robustness tests for wages..................................................................................... 63 B13. Robustness tests for educational attainment .......................................................... 66 B14. Main results including men drafted in 1978 ........................................................... 70 B15. Mechanisms ............................................................................................................ 71

IFAU - The making of a manager 35
B1. Basic descriptive statistics Table B1. 1 Type of training by soldier rank (%) Private Squad officer Platoon officer Leadership training No commanding position 100.0 22.5 7.1 Squad leader 0.0 77.4 4.6 Troop leader 0.0 0.1 14.3 Platoon leader (deputy) 0.0 0.0 23.1 Platoon leader 0.0 0.0 50.9 Other types of training Technician/Mechanic/Computer 8.8 6.1 2.6 Driver 12.7 7.6 3.0 Chef 1.2 0.4 0.0 Interpreter 0.0 0.0 0.2 Other 0.3 0.1 0.0
Notes: The sample is restricted to men enlisted 1970-1988 (excluding 1978) with a standardized cognitive score between 12 and 27 (as explained below, this is the main sample used in our analysis). Our classification of leadership training and other types of training is based upon the Swedish National Service Administration’s (Värnpliktsverket) requirements for different soldier types (Kravtabell för grundrekryterade befattningstyper) as of August 1st 1975. A detailed description of our classification is available in Appendix C1.
Figure B1. 1 Share enlisted by draft year Notes: The figure shows the share of men at the military draft who were enlisted into the military service. The small proportion of men who were exempted from the draft altogether due to, for example, severe mental or physical handicaps, have been excluded from the sample. The figure is based on 1,140,844 observations.
0.0
0.2
0.4
0.6
0.8
1.0
Shar
e of
men
enl
iste
d
1970 1975 1980 1985 1990 1995Year of draft

36 IFAU - The making of a manager
Figure B1.2 Share enlisted in different officer categories by draft year Notes: The figure shows the share of enlisted men at the military draft who were enlisted as squad or platoon officers. The figure is based on 1,131,775 observations.
B2. Selection into sample for which occupational status is observed As discussed in section 3 of the paper, our data on occupational status has better
coverage of the public sector and large private firms than small private firms. Table B2.
1 below shows that the variation in officer training we use in our RDD is not related in a
statistically significant way to selection into the sample for which we observe
occupational status.
Table B2. 1 Probability of selection into sample for which occupational status is observed (1) (2) (3) (4) (5) Squad officer -0.0032 0.0010 -0.0000 -0.0020 -0.0024 (0.0096) (0.0102) (0.0102) (0.0099) (0.0099) Platoon officer -0.0254 -0.0308 -0.0335 0.0117 0.0121 (0.0314) (0.0410) (0.0429) (0.0424) (0.0421) N 3,611,722 3,611,722 3,611,722 3,611,722 3,611,722 𝑅2 0.0060 0.0060 0.0059 0.0068 0.0068 Control function 1st order term 3-4,5,6,7 3-4,5,6,7 3-4,5,6,7 3-4,5,6,7 3-4,5,6,7 2nd order term 3-7 3-4,5-7 3-4,5-6,7 3-4,5,6-7 3-4,5,6,7
Notes. All models are estimated using 2SLS and include controls for birth cohort and year. The sample is restricted to men enlisted 1970-1988 (except 1978) with a sum of cognitive score between 12 and 27. The control function and the instruments are interacted with enlistment year. Standard errors are clustered at the Sum of cognitive subscores × enlistment year. One star denotes statistical significance at the 10%-level in a two sided test, two stars significance at the 5%-level and three stars at the 1%-level.
0.0
0.05
0.10
0.15
0.20
0.25Sh
are
enlis
ted
offic
ers
1970 1975 1980 1985 1990 1995Year of draft
Squad officers Platoon officers
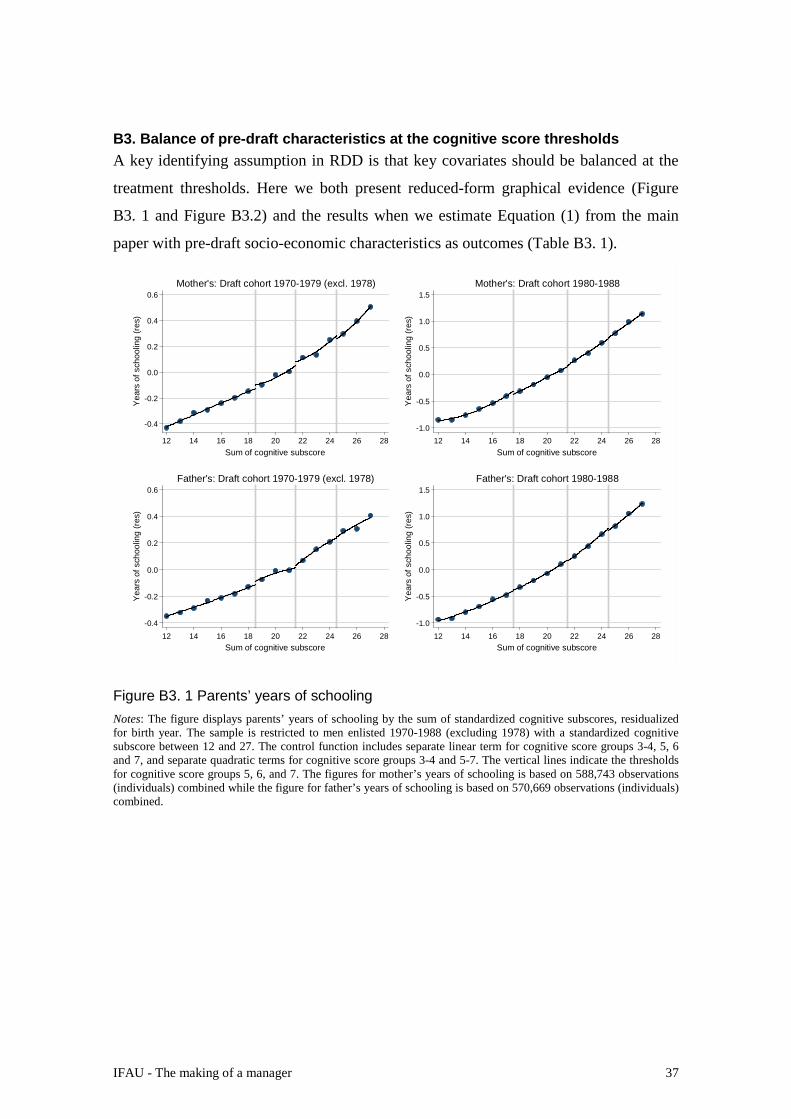
IFAU - The making of a manager 37
B3. Balance of pre-draft characteristics at the cognitive score thresholds A key identifying assumption in RDD is that key covariates should be balanced at the
treatment thresholds. Here we both present reduced-form graphical evidence (Figure
B3. 1 and Figure B3.2) and the results when we estimate Equation (1) from the main
paper with pre-draft socio-economic characteristics as outcomes (Table B3. 1).
Figure B3. 1 Parents’ years of schooling Notes: The figure displays parents’ years of schooling by the sum of standardized cognitive subscores, residualized for birth year. The sample is restricted to men enlisted 1970-1988 (excluding 1978) with a standardized cognitive subscore between 12 and 27. The control function includes separate linear term for cognitive score groups 3-4, 5, 6 and 7, and separate quadratic terms for cognitive score groups 3-4 and 5-7. The vertical lines indicate the thresholds for cognitive score groups 5, 6, and 7. The figures for mother’s years of schooling is based on 588,743 observations (individuals) combined while the figure for father’s years of schooling is based on 570,669 observations (individuals) combined.
-0.4
-0.2
0.0
0.2
0.4
0.6
Yea
rs o
f sch
oolin
g (r
es)
12 14 16 18 20 22 24 26 28Sum of cognitive subscore
Mother's: Draft cohort 1970-1979 (excl. 1978)
-1.0
-0.5
0.0
0.5
1.0
1.5
Yea
rs o
f sch
oolin
g (r
es)
12 14 16 18 20 22 24 26 28Sum of cognitive subscore
Mother's: Draft cohort 1980-1988
-0.4
-0.2
0.0
0.2
0.4
0.6
Yea
rs o
f sch
oolin
g (r
es)
12 14 16 18 20 22 24 26 28Sum of cognitive subscore
Father's: Draft cohort 1970-1979 (excl. 1978)
-1.0
-0.5
0.0
0.5
1.0
1.5
Yea
rs o
f sch
oolin
g (r
es)
12 14 16 18 20 22 24 26 28Sum of cognitive subscore
Father's: Draft cohort 1980-1988

38 IFAU - The making of a manager
Figure B3.2 Completing high school and Grade point average Notes: The upper panel displays propensity of completing high school by the sum of standardized cognitive subscores, residualized for birth year. The sample is restricted to men enlisted 1970-1988 (excluding 1978) with a standardized cognitive subscore between 12 and 27. The lower panel displays high school GPA by the sum of standardized cognitive subscores, residualized for birth year and high school program. The sample is restricted to men enlisted 1985-1988 with a standardized cognitive subscore between 12 and 27. The control function for both panels includes separate linear term for cognitive score groups 3-4, 5, 6 and 7, and separate quadratic terms for cognitive score groups 3-4 and 5-7. The vertical lines indicate the thresholds for cognitive score groups 5, 6, and 7. The figures for high school completion are based on 649,501 observations (individuals) combined while the figure for GPA is based on 109,499 observations (individuals).
-0.2
-0.1
0.0
0.1
0.2
Hig
h sc
hool
(res
)
12 14 16 18 20 22 24 26 28Sum of cognitive subscore
Draft cohort 1970-1979 (excl. 1978)
-0.2
-0.1
0.0
0.1
0.2
Hig
h sc
hool
(res
)
12 14 16 18 20 22 24 26 28Sum of cognitive subscore
Draft cohort 1980-1988
-0.4
-0.2
0.0
0.2
0.4
Gra
de p
oint
ave
rage
(res
)
12 14 16 18 20 22 24 26 28Sum of cognitive subscore
Draft cohort 1985-1988

IFAU - The making of a manager 39
Table B3. 1 Tests of exogeneity with respect to pre-draft characteristics (1) (2) (3) (4) (5) Probability of completing high school Squad officer -0.0010 -0.0009 -0.0009 0.0031 0.0024 (0.0104) (0.0119) (0.0119) (0.0125) (0.0125) Platoon officer 0.0061 0.0123 0.0180 0.0051 0.0151 (0.0239) (0.0250) (0.0258) (0.0295) (0.0312) N 649,501 649,501 649,501 649,501 649,501 𝑅2 Father’s years of schooling Squad officer 0.0732 0.0193 0.0292 0.0742 0.0927 (0.0762) (0.0878) (0.0875) (0.0895) (0.0887) Platoon officer 0.1506 0.2591 0.3623 -0.1353 -0.0375 (0.1965) (0.3066) (0.3199) (0.3159) (0.3296) N 570,669 570,669 570,669 570,669 570,669 𝑅2 0.1687 0.1690 0.1697 0.1661 0.1673 Mother’s years of schooling Squad officer -0.1345* -0.1324* -0.1225* -0.1432** -0.1159 (0.0732) (0.0726) (0.0728) (0.0719) (0.0726) Platoon officer 0.0048 -0.1006 -0.1687 0.1405 0.0598 (0.1714) (0.2488) (0.2553) (0.2849) (0.3038) N 588,743 588,743 588,743 588,743 588,743 𝑅2 0.1714 0.1705 0.1700 0.1722 0.1721 High school GPA Squad officer -0.0318 -0.0142 -0.0161 -0.0149 -0.0127 (0.0288) (0.0242) (0.0242) (0.0242) (0.0238) Platoon officer 0.2135* 0.1564 0.1829 0.0761 0.0418 (0.1093) (0.1686) (0.1705) (0.1222) (0.1266) N 109,499 109,499 109,499 109,499 109,499 𝑅2 0.1451 0.1481 0.1477 0.1475 0.1467 Control function 1st order term 3-4,5,6,7 3-4,5,6,7 3-4,5,6,7 3-4,5,6,7 3-4,5,6,7 2nd order term 3-7 3-4,5-7 3-4,5-6,7 3-4,5,6-7 3-4,5,6,7
Notes. All models are estimated using 2SLS and include controls for birth cohort. The sample is restricted to men enlisted 1970-1988 (except 1978) with a sum of cognitive score between 12 and 27. The control function and the instruments are interacted with enlistment year. Standard errors are clustered at the Sum of cognitive subscores × enlistment year. One star denotes statistical significance at the 10%-level in a two sided test, two stars significance at the 5%-level and three stars at the 1%-level.

40 IFAU - The making of a manager
B4. Test of sorting at cognitive score thresholds following McCrary (2008) A common way to evaluate regression-discontinuity designs (RDD) is to consider the
distribution of the forcing variable at each side of the treatment threshold. As suggested
by McCrary (2008), there should be no heaping at either side of the threshold in case the
forcing variable cannot be manipulated. Figure A1 (in the paper) shows the distribution
of our forcing variable – the underlying subscore of cognitive skill as measured at the
military draft. To aid the interpretation of these distributions we also plot a normal
distribution with similar mean and variance. Clearly, though discrete, the distribution of
cognitive skill closely resembles a normal distribution. Importantly, there is no clearly
visible evidence of “heaping” around the thresholds to final cognitive score groups 5, 6
and 7 which are the thresholds we use as instruments when estimating the effect of
officer training on various outcomes.
McCrary (2008) also suggests a formal test of heaping under the assumption that the
forcing variable is continuous. Since our forcing variable is discrete, it is an open
question how well the McCrary test performs in our setting. To get a sense of this, we
conduct a simple simulation exercise where we generated samples with independent
draws from a normal distribution with mean and variance similar to the distribution of
cognitive skills we observe for the periods 1970-79 and 1980-88. We then split each
sample it into 33 bins, thus getting a discrete distribution similar to the distribution we
observe in the data (where the sum of subscores varies from 4 to 36). We then
performed the McCrary test on “thresholds” to final cognitive scores of 5, 6 and 7 on
simulated samples of the same sizes as our samples from 1970-79 and 1980-88
(generating each sample 1,000 times). Table B4. 1 below shows the proportion of times
we reject the null hypothesis in the McCrary test on the 5% level at each threshold. In
sum, Table B4. 1 shows that there is a modest tendency for the McCrary test to over-
reject the null hypothesis of no sorting.
An important caveat is that the test conducted above is based on the assumption that
the underlying distribution of skill is normal. That is, cognitive skill as measured by the
military draft would follow a normal distribution if the measure were continuous. While
Figure A1 shows that the distribution of cognitive skill as measured by the military draft
is “close” to normal, there is no reason to expect the underlying distribution of cognitive
skill to be exactly normal. Hence our test of the performance of the McCrary test is

IFAU - The making of a manager 41
merely suggestive, and the true level of over rejection could be higher or lower than
suggested by the simulations.
Table B4. 1 Simulated probability of rejecting at the 5%-level in the McCrary test
Cognitive score 1970-1979 1980-1988 5 0.057 0.050 6 0.061 0.051 7 0.092 0.051
The table reports results from the McCrary (2008) test on simulated samples. Each cell reports the proportion of times that the null hypothesis of no sorting around the specified threshold is rejected at the 5%-level in 1,000 simulated samples of the same size as the draft data from 1970-1979 (except 1978) and 1980-1988. Each sample is generated from a discretized normal distribution with mean and variance equal to the corresponding empirical distributions of cognitive skill. The test is implemented using DCdensity.ado with BW=2
Table B4. 2 shows the results when we perform the McCrary test on the actual data.
Among the 6 different thresholds we evaluate (three thresholds in two different
samples), we reject the null hypothesis of no sorting at the 5% in one case, at the 10% in
another case and are not close to rejecting in the remaining four cases. The likelihood of
rejecting at least two out of six hypotheses the null of no heaping at, respectively, the
5%- and 10%-level, is 11.9%. Note that this is an ex post evaluation, and that there are
other potential non-overlapping events (e.g., a single threshold rejected at the 1% level
or three thresholds rejected at the 10% level) that we have not taken into account when
calculating the probability that the pattern observed could arise even in the absence of
sorting.
Table B4. 2 McCrary test (DCdensity) for manipulation at thresholds
Cognitive score 1970-1979 1980-1988 5 0.2457 0.0503 6 0.0492 0.9018 7 0.3241 0.2064
Each cell reports the p-value at the specified thresholds from the McCrary (2008) test of sorting at the thresholds. The test is implemented using DCdensity.ado with BW=2.

42 IFAU - The making of a manager
B5. Assumption #1: Treatment effect homogeneity In section 4, we list four additional assumptions (in addition to the absence of sorting
around the cognitive score thresholds) that must hold in order for our RDD-strategy to
deliver unbiased estimates of the causal effect of officer training on labor market
outcomes. The first of these assumptions is that the effect of squad and platoon officer
training does not depend on the cognitive score thresholds. Here we provide descriptive
statistics which support (but does not prove) that this assumption is reasonable.
First, Table B5. 1 shows the average leadership ability (as assessed by the
psychologist at the military draft) of men enlisted as squad or platoon officers for each
final cognitive score. Table B5. 1 shows that leadership ability (assessed on a 1-9 scale)
does not vary much with cognitive skill among officers in a given category. This
indicates that, at least in terms of leadership ability, men with a given type of training
are similar regardless of their cognitive skill, thereby making treatment effect
heterogeneity less likely.
Table B5. 1 Average leadership ability by cognitive score and type of officer training Cognitive score Squad officers Platoon officers 5 6.0 - 6 6.0 7.3 7 6.3 7.5
Treatment effect homogeneity could also be violated if there are non-monotonicities in
the data, i.e., if for some men passing the threshold to a higher final score decreases the
probability of them being enlisted as officers. This could occur, for example, if there are
certain skilled specialists enlisted as privates. To get a sense of how likely such non-
monotonicities are, we calculated the average cognitive and non-cognitive skills of men
enlisted as privates, squad officers or platoon officers within a given line of service. The
average skills of these groups defined by rank and line of service are shown in Figure
B5. 1 below. Clearly, there is hardly any overlap between the average cognitive skill
among privates, squad officer and platoon officers, and also very little overlap in terms
of non-cognitive skill. While this evidence is descriptive and indirect, it does suggest
that there are no specialist units where the requirements for privates is higher than for
squad officers in other units, or units where the requirements for squad officers are
higher than for platoon officers in other units. This, in turn, suggests that non-
monotonicities are unlikely.

IFAU - The making of a manager 43
Figure B5. 1 Average cognitive and non-cognitive skill by rank and line of service Notes: The figure shows the average cognitive and non-cognitive score from the military draft by rank (private, squad officer, platoon officer) and line of service (e.g., arctic ranger, military police, etc.). Each combination of rank and line of service is weighted by their relative size. The figure is based on 627,410 observations.
B6. Assumption #2: Probability of enlistment In section 4, we list four additional assumptions (in addition to the absence of sorting
around the cognitive score thresholds) that must hold in order for our RDD-strategy to
deliver unbiased estimates of the causal effect of officer training on labor market
outcomes. The second assumption is that passing the thresholds to a higher final
cognitive score does not affect the probability of being enlisted to the military service.
Table B6. 1 below displays the results from first-stage regressions where the dependent
variable is a dummy for being enlisted instead of dummies for squad- and platoon
officer training as in Equation (1) in the paper. Table B6. 1 shows that there are some
indications that the enlistment probabilities change at the cognitive score thresholds.
However, the sizes of these effects are about an order of magnitude smaller than the
effects on officer training that we estimate in the first stage for officer training (see
Table 1). Another way to see the difference between the first stage in Table B6. 1 and
Table 1 is by studying the F-statistic of the instruments. In Table B6. 1, the highest F-
statistic is 5.2, while the F-statistic varies between 80 and 1000 in Table 1.
Consequently, unless the effect of enlistment on labor market outcomes or educational
4
5
6
7
8St
anda
rdiz
ed n
on-c
ogni
tive
scor
e
4 5 6 7Standardized cognitive score
Privates Squad officers Platoon officers

44 IFAU - The making of a manager
attainment is huge, our estimates will reflect the effect of officer training, not the
military service per se.
Table B6. 1 First-stage regression for enlistment probability (1) (2) (3) (4) 1970-1979 (excluding 1978) 1980-1988 Final score = 5 0.0069*** 0.0069*** 0.0037 0.0037 (0.002) (0.002) (0.003) (0.003) Final score = 6 -0.0045 -0.0045 -0.0027 -0.0025 (0.004) (0.004) (0.002) (0.002) Final score = 7 -0.0056* -0.0053* -0.0100** -0.0127*** (0.003) (0.003) (0.004) (0.004) F-value of joint significance 5.20 4.93 3.37 4.51 p-value of joint significance 0.002 0.003 0.020 0.005 N 357,263 357,263 352,087 352,087 𝑅2 0.008 0.008 0.013 0.013 Control function 1st order term 3-4,5,6,7 3-4,5,6,7 3-4,5,6,7 3-4,5,6,7 2nd order term 3-7 3-4,5-7 3-4,5-6,7 3-4,5,6-7
Notes. All models are OLS-estimates of the final cognitive score thresholds 3-7 on the probability of private soldiers doing military services in a fighting position and include dummies for birth cohort. The sample is restricted to men enlisted 1970-1988 (except 1978) with a cognitive score between 3 and 7. The control function is interacted with enlistment year. One star denotes statistical significance at the 10%-level in a two sided test, two stars significance at the 5%-level and three stars at the 1%-level. Standard errors are clustered at the Sum of cognitive subscores × enlistment year.
B7. Assumption #3: Other dimensions of the military service In section 4, we list four additional assumptions (in addition to the absence of sorting
around the cognitive score thresholds) that must hold in order for our RDD-strategy to
deliver unbiased estimates of the causal effect of officer training on labor market
outcomes. The third assumption is that, conditional on being enlisted, no other salient
dimensions of the military service change at the cognitive score thresholds. A particular
concern here is that passing a threshold to 5, 6 or 7 implies an increased probability of
selection into more advanced positions unrelated to officer training. There are limits in
our data as to how precisely we can measure the exact type of military service, but there
are a number of tests we can do to gauge how likely such effects are to pose a major
threat to identifying the effect of officer training. These tests are presented below.
Different types of privates: combat vs. non-combat soldiers The Swedish Enlistment Agency divides privates into four distinct categories, denoted
E-H, based on their type of service. In short, privates of in categories E and F are trained
for combat while categories G and H serve in units that operate behind the front. The
physical and mental requirements of “combat soldiers” (E and F) are higher than for

IFAU - The making of a manager 45
“non-combat soldiers” (G and H). Since combat soldiers also are exposed to a more
demanding training, our strategy for identifying the effect of officer training on labor
market outcomes may fail if the share of combat soldiers increases at the cognitive score
thresholds we use as instruments for officer training.
Figure B7. 1 shows the share of “combat soldiers” exhibits discrete jumps at the
thresholds to a cognitive score of 2, 3 and 4. However, there are no discernible jumps at
the thresholds we use as instruments for officer training.
Figure B7. 1 Probability privates being assigned a combat position by cognitive ability Note: The figure displays the share of privates having a fighting position by the sum of cognitive subscores. The sample is restricted to men enlisted 1971-1979 (excluding 1978) and 1982-1988 with a standardized cognitive subscore between 4 and 36. The vertical lines indicate the thresholds for final scores of 2, 3, 4, 5, 6, 7, 8 and 9. The figure does not include men drafted 1980-1981 since these cohorts have a different mapping from the sum of subscores to the cognitive score groups at the low end of the cognitive score distribution. The figure is based on 470,782 observations.
Elite units A related concern is that the cognitive score thresholds affect selection into different
types of elite units (regardless of service as a private or as an officer). There are two
types of elite units that deserve specific attention – rangers and scouts. What distinguish
rangers and scouts is that they often operate close to or behind enemy lines and
therefore out of the reach of the regular supply chain. Military service as a scout or a
ranger therefore places high requirements on conscripts’ physical and psychological
skills.
Figure B7.2 and Figure B7.3 show how the share of rangers and scouts change with
cognitive skills. At the thresholds to a cognitive score of 3 and 4, the share rangers and
scouts exhibit discrete jumps by 1-2 percentage points, reflecting the fact that men with
low cognitive skills are not allowed to serve in these elite units. However, there are no
2 3 4 5 6 7 8 9
0
0.2
0.4
0.6
0.8
Shar
e pr
ivat
es in
figh
ting
posi
tions
4 8 12 16 20 24 28 32 36
Sum of cognitive subscores
Draft cohort 1971-1979 (excl. 1978)2 3 4 5 6 7 8 9
0
0.2
0.4
0.6
0.8
Shar
e pr
ivat
es in
figh
ting
posi
tions
4 8 12 16 20 24 28 32 36
Sum of cognitive subscores
Draft cohort 1982-1988

46 IFAU - The making of a manager
discernible jumps in the share of rangers and scouts at the thresholds to 5, 6 and 7, i.e.,
the thresholds we use to identify the effect of officer training. The only possible
exception is that the share of scouts drops about 0.5 percentage points at the threshold to
a cognitive score of 5 in the 1982-1988 period. (The exact cutoffs at the low end of the
cognitive score distribution is different for the 1980-81 cohorts. Since these are only
two cohorts we ignore them here). Unless we believe that service as a scout has a very
strong negative effect on future labor market outcomes (which we view as implausible),
this cannot account for the positive effect of officer training we estimate using the data
at hand.
Figure B7.2 Probability of being assigned to a Ranger unit by cognitive ability Notes: The figure displays the share of enlisted serving in a ranger unit by the sum of cognitive subscores. The sample is restricted to men enlisted 1971-1979 (excluding 1978) and 1982-1988 with a standardized cognitive subscore between 4 and 36. The vertical lines indicate the thresholds for final scores of 2, 3, 4, 5, 6, 7, 8 and 9. The figure is based on 625,335 observations.
Figure B7.3 Probability of being assigned to a Scout unit by cognitive ability Note: The figure displays the share of enlisted serving in a scout unit by the sum of cognitive subscores. The sample is restricted to men enlisted 1971-1979 (excluding 1978) and 1982-1988 with a standardized cognitive subscore between 4 and 36. The vertical lines indicate the thresholds for final scores of 2, 3, 4, 5, 6, 7, 8 and 9. The figure is based on 625,335 observations.
2 3 4 5 6 7 8 9
0
.02
.04
.06
.08
Shar
e ra
nger
s
4 8 12 16 20 24 28 32 36
Sum of cognitive subscores
Draft cohort 1971-1979 (excl. 1978)2 3 4 5 6 7 8 9
0
.02
.04
.06
.08
Shar
e ra
nger
s
4 8 12 16 20 24 28 32 36
Sum of cognitive subscores
Draft cohort 1982-1988
2 3 4 5 6 7 8 9
0
.02
.04
.06
.08
Shar
e sc
outs
4 8 12 16 20 24 28 32 36
Sum of cognitive subscores
Draft cohort 1971-1979 (excl. 1978)2 3 4 5 6 7 8 9
0
.02
.04
.06
.08
Shar
e sc
outs
4 8 12 16 20 24 28 32 36
Sum of cognitive subscores
Draft cohort 1982-1988

IFAU - The making of a manager 47
B8. Assumption #4: Attrition from the military service In section 4, we list four additional assumptions (in addition to the absence of sorting
around the cognitive score thresholds) that must hold in order for our RDD-strategy to
deliver unbiased estimates of the causal effect of officer training on labor market
outcomes. The fourth assumption is that passing the thresholds does not affect attrition
from the military service. Note that attrition could potentially mean two different things
here: either that a man who was enlisted at the military draft for some reason (e.g.,
sickness) does not begin the military service, or that he begins but does not complete his
military service.
We lack data on completion of the military service, and thus cannot directly assess
how passing the thresholds affect the probability of completing the military service.28
Instead, we use information from a the socio-economic panel data set LINDA, which
covers 3% of the Swedish population, to assess the relationship between officer training
and attrition in the first sense, i.e., not beginning the military service. LINDA has
information about the financial compensation that conscripts receive while in the
military service. We generate a dummy variable for “enrollment in the military” equal
to 1 in case an individual received a non-zero amount of compensation from the
military. We then test whether enlistment as an officer is related to the probability of
enrollment, conditional on cognitive and non-cognitive skills. This test falls short of
examining how the enrollment probability changes at the cognitive score thresholds, but
does not some indication as to whether enrollment depends on type of position. As
shown in Table B8. 1, we find no evidence that enrollment is related to type of service.
28 We did access a data set over the de-listing of men from the military. However, men are missing from this data in a systematic way that makes it of little use to us. For example, men who opt for a career as semi-professional or professional officer are not classified as “de-listed”, and all men who did the military service in the Coast Artillery are not included.

48 IFAU - The making of a manager
Table B8. 1 Enrollment into military service conditional on being enlisted (sample from LINDA) (1) Squad officer -0.002 (0.008) Platoon officer 0.007 (0.013) N 8,674 𝑅2 0.0078
Notes. The model is estimated using OLS and include fixed effects for score group for cognitive and non-cognitive skills. The sample is restricted to men enlisted between 1983 and 1988 with a cognitive score between 3 and 8. One star denotes statistical significance at the 10%-level in a two sided test, two stars significance at the 5%-level and three stars at the 1%-level.
We are not able to test for the second form of attrition, i.e., that men may leave the
military service after being enrolled. One piece of evidence which speaks against
attrition being systematically related to attrition is that the later entry of platoon officers
estimated in the paper fits well with their longer duration of service.
B9. Reduced-form results for main outcomes Due to space constraints, the paper does not include the full set of reduce-form results.
Here we first present graphical evidence and then the corresponding estimates. Note that
when estimating the first stage (see Table B9. 1-B9.6), we do not interact the
instruments with draft year due to expositional simplicity. The specifications reported in
this section are therefore not exactly comparable to the 2SLS-estimates which is our
main focus.
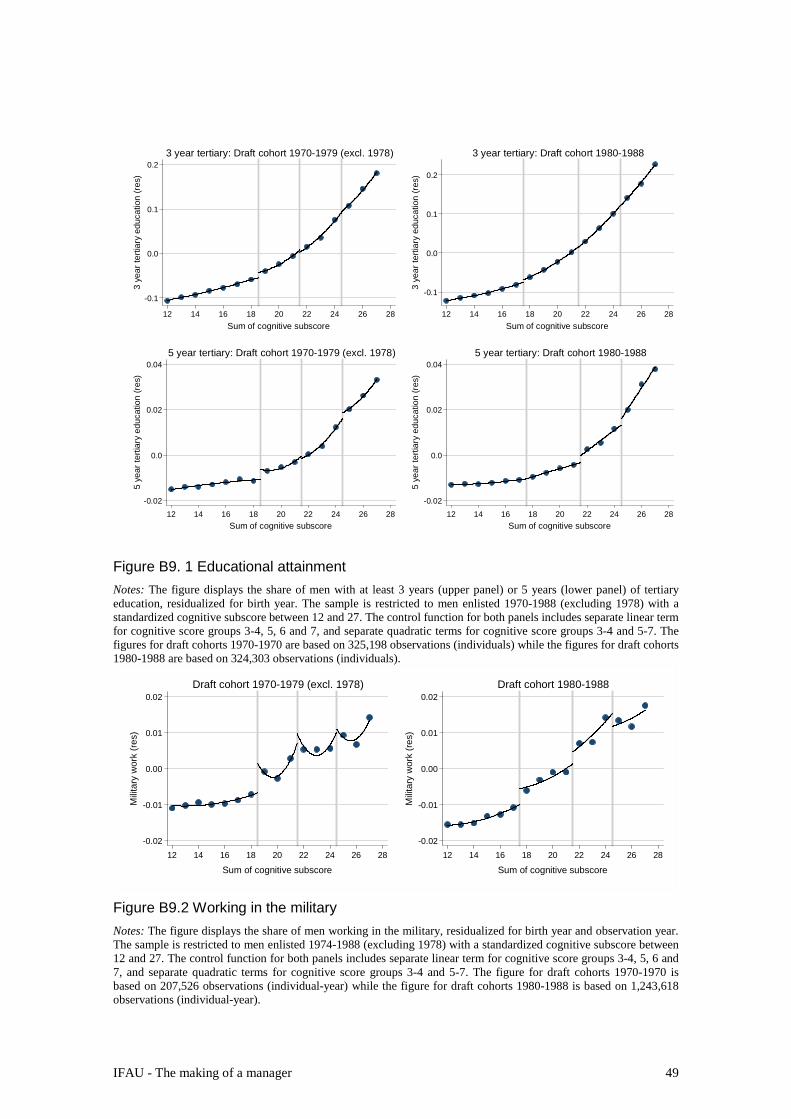
IFAU - The making of a manager 49
Figure B9. 1 Educational attainment Notes: The figure displays the share of men with at least 3 years (upper panel) or 5 years (lower panel) of tertiary education, residualized for birth year. The sample is restricted to men enlisted 1970-1988 (excluding 1978) with a standardized cognitive subscore between 12 and 27. The control function for both panels includes separate linear term for cognitive score groups 3-4, 5, 6 and 7, and separate quadratic terms for cognitive score groups 3-4 and 5-7. The figures for draft cohorts 1970-1970 are based on 325,198 observations (individuals) while the figures for draft cohorts 1980-1988 are based on 324,303 observations (individuals).
Figure B9.2 Working in the military Notes: The figure displays the share of men working in the military, residualized for birth year and observation year. The sample is restricted to men enlisted 1974-1988 (excluding 1978) with a standardized cognitive subscore between 12 and 27. The control function for both panels includes separate linear term for cognitive score groups 3-4, 5, 6 and 7, and separate quadratic terms for cognitive score groups 3-4 and 5-7. The figure for draft cohorts 1970-1970 is based on 207,526 observations (individual-year) while the figure for draft cohorts 1980-1988 is based on 1,243,618 observations (individual-year).
-0.1
0.0
0.1
0.2
3 ye
ar te
rtiar
y ed
ucat
ion
(res
)
12 14 16 18 20 22 24 26 28Sum of cognitive subscore
3 year tertiary: Draft cohort 1970-1979 (excl. 1978)
-0.1
0.0
0.1
0.2
3 ye
ar te
rtiar
y ed
ucat
ion
(res
)
12 14 16 18 20 22 24 26 28Sum of cognitive subscore
3 year tertiary: Draft cohort 1980-1988
-0.02
0.0
0.02
0.04
5 ye
ar te
rtiar
y ed
ucat
ion
(res
)
12 14 16 18 20 22 24 26 28Sum of cognitive subscore
5 year tertiary: Draft cohort 1970-1979 (excl. 1978)
-0.02
0.0
0.02
0.04
5 ye
ar te
rtiar
y ed
ucat
ion
(res
)
12 14 16 18 20 22 24 26 28Sum of cognitive subscore
5 year tertiary: Draft cohort 1980-1988
-0.02
-0.01
0.00
0.01
0.02
Milit
ary
wor
k (re
s)
12 14 16 18 20 22 24 26 28
Sum of cognitive subscore
Draft cohort 1970-1979 (excl. 1978)
-0.02
-0.01
0.00
0.01
0.02
Milit
ary
wor
k (re
s)
12 14 16 18 20 22 24 26 28
Sum of cognitive subscore
Draft cohort 1980-1988
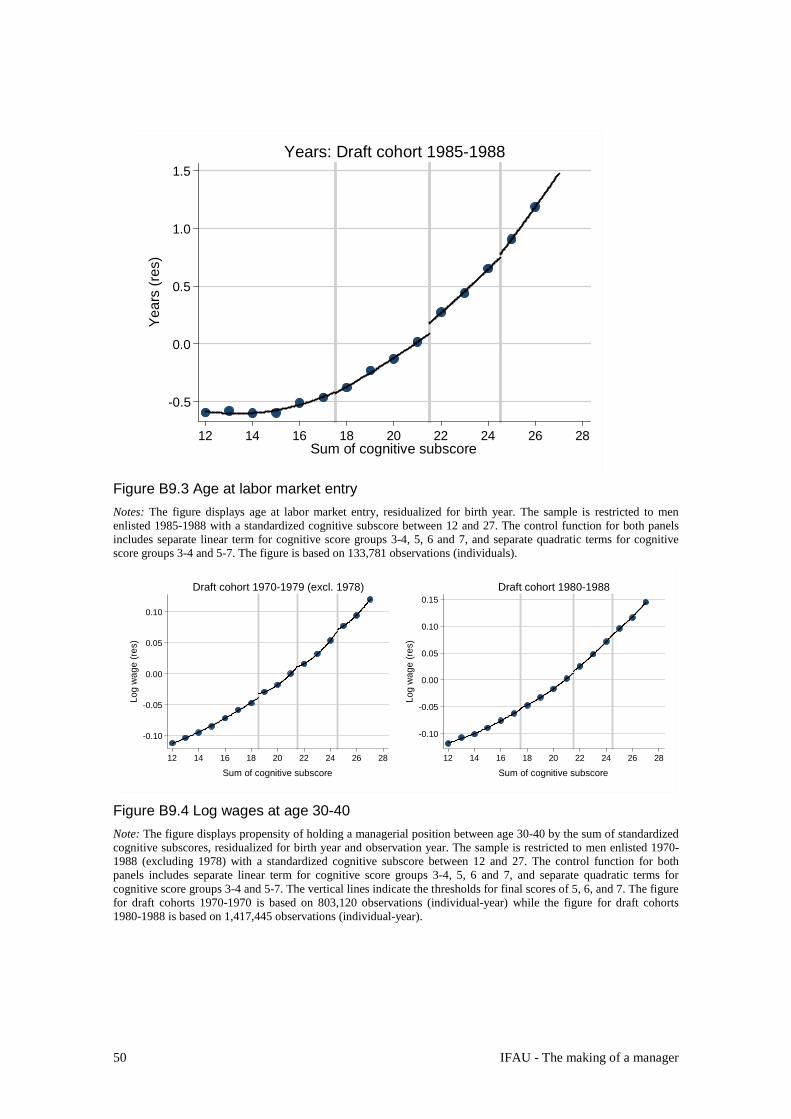
50 IFAU - The making of a manager
Figure B9.3 Age at labor market entry Notes: The figure displays age at labor market entry, residualized for birth year. The sample is restricted to men enlisted 1985-1988 with a standardized cognitive subscore between 12 and 27. The control function for both panels includes separate linear term for cognitive score groups 3-4, 5, 6 and 7, and separate quadratic terms for cognitive score groups 3-4 and 5-7. The figure is based on 133,781 observations (individuals).
Figure B9.4 Log wages at age 30-40 Note: The figure displays propensity of holding a managerial position between age 30-40 by the sum of standardized cognitive subscores, residualized for birth year and observation year. The sample is restricted to men enlisted 1970-1988 (excluding 1978) with a standardized cognitive subscore between 12 and 27. The control function for both panels includes separate linear term for cognitive score groups 3-4, 5, 6 and 7, and separate quadratic terms for cognitive score groups 3-4 and 5-7. The vertical lines indicate the thresholds for final scores of 5, 6, and 7. The figure for draft cohorts 1970-1970 is based on 803,120 observations (individual-year) while the figure for draft cohorts 1980-1988 is based on 1,417,445 observations (individual-year).
-0.5
0.0
0.5
1.0
1.5Ye
ars
(res
)
12 14 16 18 20 22 24 26 28Sum of cognitive subscore
Years: Draft cohort 1985-1988
-0.10
-0.05
0.00
0.05
0.10
Log
wag
e (re
s)
12 14 16 18 20 22 24 26 28
Sum of cognitive subscore
Draft cohort 1970-1979 (excl. 1978)
-0.10
-0.05
0.00
0.05
0.10
0.15
Log
wag
e (re
s)
12 14 16 18 20 22 24 26 28
Sum of cognitive subscore
Draft cohort 1980-1988
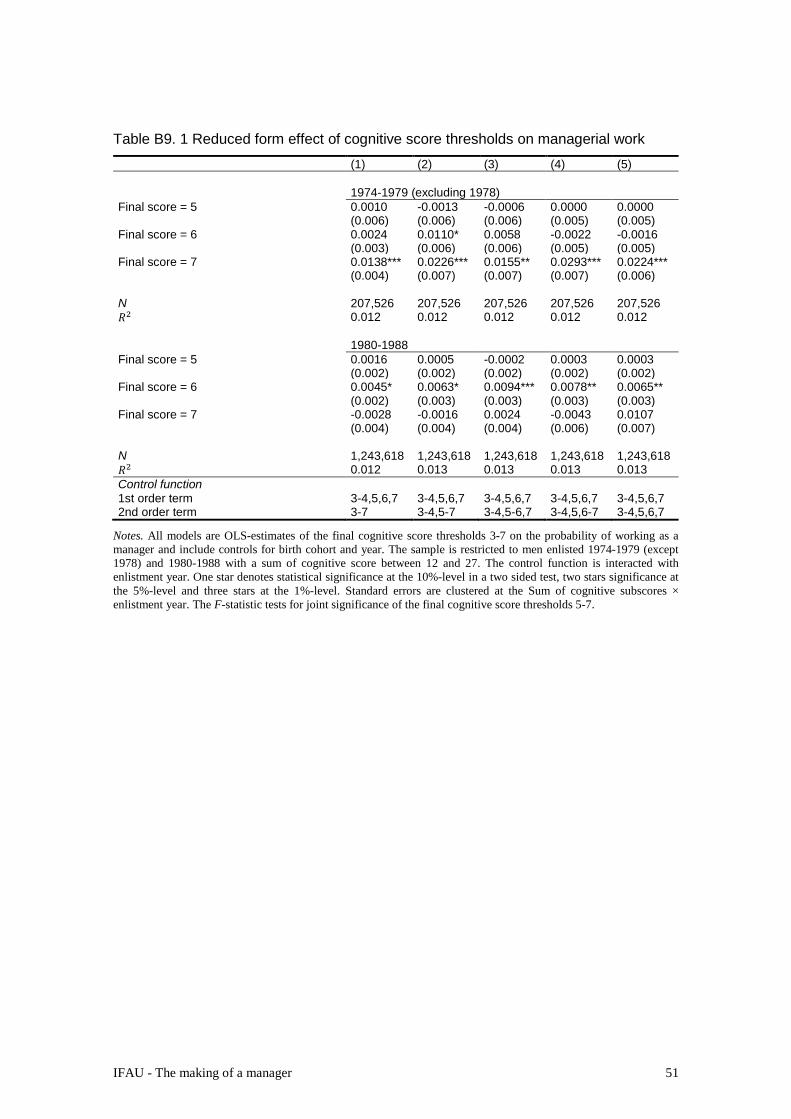
IFAU - The making of a manager 51
Table B9. 1 Reduced form effect of cognitive score thresholds on managerial work (1) (2) (3) (4) (5) 1974-1979 (excluding 1978) Final score = 5 0.0010 -0.0013 -0.0006 0.0000 0.0000 (0.006) (0.006) (0.006) (0.005) (0.005) Final score = 6 0.0024 0.0110* 0.0058 -0.0022 -0.0016 (0.003) (0.006) (0.006) (0.005) (0.005) Final score = 7 0.0138*** 0.0226*** 0.0155** 0.0293*** 0.0224*** (0.004) (0.007) (0.007) (0.007) (0.006) N 207,526 207,526 207,526 207,526 207,526 𝑅2 0.012 0.012 0.012 0.012 0.012 1980-1988 Final score = 5 0.0016 0.0005 -0.0002 0.0003 0.0003 (0.002) (0.002) (0.002) (0.002) (0.002) Final score = 6 0.0045* 0.0063* 0.0094*** 0.0078** 0.0065** (0.002) (0.003) (0.003) (0.003) (0.003) Final score = 7 -0.0028 -0.0016 0.0024 -0.0043 0.0107 (0.004) (0.004) (0.004) (0.006) (0.007) N 1,243,618 1,243,618 1,243,618 1,243,618 1,243,618 𝑅2 0.012 0.013 0.013 0.013 0.013 Control function 1st order term 3-4,5,6,7 3-4,5,6,7 3-4,5,6,7 3-4,5,6,7 3-4,5,6,7 2nd order term 3-7 3-4,5-7 3-4,5-6,7 3-4,5,6-7 3-4,5,6,7
Notes. All models are OLS-estimates of the final cognitive score thresholds 3-7 on the probability of working as a manager and include controls for birth cohort and year. The sample is restricted to men enlisted 1974-1979 (except 1978) and 1980-1988 with a sum of cognitive score between 12 and 27. The control function is interacted with enlistment year. One star denotes statistical significance at the 10%-level in a two sided test, two stars significance at the 5%-level and three stars at the 1%-level. Standard errors are clustered at the Sum of cognitive subscores × enlistment year. The F-statistic tests for joint significance of the final cognitive score thresholds 5-7.

52 IFAU - The making of a manager
Table B9. 2 Reduced form effect of cognitive score thresholds on military work (1) (2) (3) (4) (5) 1974-1979 (excluding 1978) Final score = 5 0.0029* 0.0048*** 0.0045*** 0.0052*** 0.0052*** (0.002) (0.001) (0.001) (0.001) (0.001) Final score = 6 0.0012 -0.0064 -0.0038 -0.0097 -0.0104* (0.004) (0.005) (0.006) (0.006) (0.006) Final score = 7 0.0014 -0.0065 -0.0029 -0.0049 0.0032 (0.002) (0.004) (0.005) (0.005) (0.006) N 207,526 207,526 207,526 207,526 207,526 𝑅2 0.006 0.006 0.006 0.006 0.006 1980-1988 Final score = 5 0.0036** 0.0038*** 0.0034*** 0.0028** 0.0028** (0.001) (0.001) (0.001) (0.001) (0.001) Final score = 6 0.0036** 0.0033 0.0051** 0.0090*** 0.0090*** (0.001) (0.002) (0.002) (0.002) (0.002) Final score = 7 -0.0048** -0.0050* -0.0026 -0.0149*** -0.0139*** (0.002) (0.003) (0.003) (0.003) (0.003) N 1,243,618 1,243,618 1,243,618 1,243,618 1,243,618 𝑅2 0.010 0.010 0.010 0.010 0.010 Control function 1st order term 3-4,5,6,7 3-4,5,6,7 3-4,5,6,7 3-4,5,6,7 3-4,5,6,7 2nd order term 3-7 3-4,5-7 3-4,5-6,7 3-4,5,6-7 3-4,5,6,7
Notes. All models are OLS-estimates of the final cognitive score thresholds 3-7 on the probability of working in the military and include controls for birth cohort and year. The sample is restricted to men enlisted 1974-1979 (except 1978) and 1980-1988 with a sum of cognitive score between 12 and 27. The control function is interacted with enlistment year. One star denotes statistical significance at the 10%-level in a two sided test, two stars significance at the 5%-level and three stars at the 1%-level. Standard errors are clustered at the Sum of cognitive subscores × enlistment year. The F-statistic tests for joint significance of the final cognitive score thresholds 5-7.

IFAU - The making of a manager 53
Table B9. 3 Reduced form effect of cognitive score thresholds on 3-year tertiary degree or higher (1) (2) (3) (4) (5) 1970-1979 (excluding 1978) Final score = 5 0.0086*** 0.0107*** 0.0113*** 0.0099*** 0.0099*** (0.002) (0.002) (0.002) (0.002) (0.002) Final score = 6 0.0002 -0.0087** -0.0138*** -0.0004 0.0011 (0.002) (0.004) (0.005) (0.005) (0.005) Final score = 7 0.0046 -0.0048 -0.0118** -0.0092 -0.0265*** (0.003) (0.005) (0.005) (0.006) (0.005) N 325,198 325,198 325,198 325,198 325,198 𝑅2 0.061 0.061 0.061 0.061 0.061 1980-1988 Final score = 5 0.0048* 0.0074*** 0.0070*** 0.0070*** 0.0070*** (0.002) (0.003) (0.003) (0.002) (0.002) Final score = 6 0.0034 -0.0012 0.0010 0.0016 0.0009 (0.002) (0.003) (0.003) (0.003) (0.003) Final score = 7 0.0010 -0.0021 0.0008 -0.0073 0.0008 (0.004) (0.004) (0.004) (0.007) (0.008) N 324,303 324,303 324,303 324,303 324,303 𝑅2 0.086 0.086 0.086 0.086 0.086 Control function 1st order term 3-4,5,6,7 3-4,5,6,7 3-4,5,6,7 3-4,5,6,7 3-4,5,6,7 2nd order term 3-7 3-4,5-7 3-4,5-6,7 3-4,5,6-7 3-4,5,6,7
Notes. All models are OLS-estimates of the final cognitive score thresholds 3-7 on the probability of holding a three-year tertiary degree or higher and include controls for birth cohort and year. The sample is restricted to men enlisted 1970-1979 (except 1978) and 1980-1988 with a sum of cognitive score between 12 and 27. The control function is interacted with enlistment year. One star denotes statistical significance at the 10%-level in a two sided test, two stars significance at the 5%-level and three stars at the 1%-level. Standard errors are clustered at the Sum of cognitive subscores × enlistment year. The F-statistic tests for joint significance of the final cognitive score thresholds 5-7.

54 IFAU - The making of a manager
Table B9. 4 Reduced form effect of officer training on 5-year tertiary degree or higher (1) (2) (3) (4) (5) 1970-1979 (excluding 1978) Final score = 5 0.0032*** 0.0040*** 0.0041*** 0.0037*** 0.0037*** (0.001) (0.001) (0.001) (0.001) (0.001) Final score = 6 0.0010 -0.0024 -0.0030* 0.0005 0.0008 (0.001) (0.002) (0.002) (0.002) (0.002) Final score = 7 0.0031** -0.0004 -0.0013 -0.0019 -0.0051* (0.001) (0.002) (0.002) (0.003) (0.003) N 325,198 325,198 325,198 325,198 325,198 𝑅2 0.013 0.013 0.013 0.013 0.013 1980-1988 Final score = 5 0.0008 0.0006 0.0008* 0.0005 0.0005 (0.001) (0.000) (0.000) (0.000) (0.000) Final score = 6 0.0042*** 0.0045*** 0.0035** 0.0047*** 0.0053*** (0.001) (0.002) (0.002) (0.001) (0.001) Final score = 7 0.0050*** 0.0052*** 0.0038* 0.0048* -0.0017 (0.002) (0.002) (0.002) (0.003) (0.004) N 324,303 324,303 324,303 324,303 324,303 𝑅2 0.017 0.017 0.017 0.017 0.017 Control function 1st order term 3-4,5,6,7 3-4,5,6,7 3-4,5,6,7 3-4,5,6,7 3-4,5,6,7 2nd order term 3-7 3-4,5-7 3-4,5-6,7 3-4,5,6-7 3-4,5,6,7
Notes. All models are OLS-estimates of the final cognitive score thresholds 3-7 on the probability of holding a five-year tertiary degree or higher and include controls for birth cohort and year. The sample is restricted to men enlisted 1970-1979 (except 1978) and 1980-1988 with a sum of cognitive score between 12 and 27. The control function is interacted with enlistment year. One star denotes statistical significance at the 10%-level in a two sided test, two stars significance at the 5%-level and three stars at the 1%-level. Standard errors are clustered at the Sum of cognitive subscores × enlistment year. The F-statistic tests for joint significance of the final cognitive score thresholds 5-7.
Table B9. 5 Reduced form effect of cognitive score thresholds on age at labor market entry (1) (2) (3) (4) (5) 1985-1988 Final score = 5 0.0190 -0.0027 0.0001 -0.0034 -0.0034 (0.028) (0.032) (0.032) (0.031) (0.031) Final score = 6 0.0834*** 0.1192*** 0.1065*** 0.1228*** 0.1296*** (0.023) (0.034) (0.036) (0.038) (0.038) Final score = 7 0.0513* 0.0748** 0.0578 0.0680 -0.0138 (0.029) (0.035) (0.037) (0.046) (0.058) N 133,781 133,781 133,781 133,781 133,781 𝑅2 0.073 0.073 0.073 0.073 0.074 Control function 1st order term 3-4,5,6,7 3-4,5,6,7 3-4,5,6,7 3-4,5,6,7 3-4,5,6,7 2nd order term 3-7 3-4,5-7 3-4,5-6,7 3-4,5,6-7 3-4,5,6,7
Notes. All models are OLS-estimates of the final cognitive score thresholds 3-7 on the probability of holding a three-year tertiary degree or higher and include controls for birth cohort and year. The sample is restricted to men enlisted 1985-1988 with a sum of cognitive score between 12 and 27. The control function is interacted with enlistment year. One star denotes statistical significance at the 10%-level in a two sided test, two stars significance at the 5%-level and three stars at the 1%-level. Standard errors are clustered at the Sum of cognitive subscores × enlistment year. The F-statistic tests for joint significance of the final cognitive score thresholds 5-7.

IFAU - The making of a manager 55
Table B9. 6 Reduced form effect of cognitive score thresholds on log wages (1) (2) (3) (4) (5) 1970-1979 (excluding 1978) Final score = 5 0.0003 0.0026 0.0025 0.0025 0.0025 (0.004) (0.004) (0.004) (0.004) (0.004) Final score = 6 -0.0004 -0.0090** -0.0078 -0.0080 -0.0083 (0.003) (0.004) (0.005) (0.006) (0.006) Final score = 7 0.0025 -0.0063 -0.0046 -0.0068 -0.0042 (0.003) (0.005) (0.006) (0.004) (0.006) F-stat for joint significance of instruments 0.256 1.569 1.091 1.561 0.991 p-value for joint significance of instruments 0.857 0.200 0.355 0.202 0.399 N 803,120 803,120 803,120 803,120 803,120 𝑅2 0.134 0.134 0.134 0.134 0.134 1980-1988 Final score = 5 -0.0014 -0.0001 -0.0005 -0.0004 -0.0004 (0.002) (0.002) (0.002) (0.002) (0.002) Final score = 6 0.0036 0.0017 0.0035 0.0031 0.0024 (0.003) (0.003) (0.003) (0.003) (0.003) Final score = 7 -0.0017 -0.0030 -0.0007 -0.0056 0.0021 (0.004) (0.004) (0.004) (0.005) (0.006) F-stat for joint significance of instruments 1.684 0.675 0.679 0.638 0.223 p-value for joint significance of instruments 0.173 0.569 0.566 0.592 0.880 N 1,417,445 1,417,445 1,417,445 1,417,445 1,417,445 𝑅2 0.246 0.246 0.246 0.246 0.246 Control function 1st order term 3-4,5,6,7 3-4,5,6,7 3-4,5,6,7 3-4,5,6,7 3-4,5,6,7 2nd order term 3-7 3-4,5-7 3-4,5-6,7 3-4,5,6-7 3-4,5,6,7
Notes. All models are OLS-estimates of the final cognitive score thresholds 3-7 on the probability of holding a three-year tertiary degree or higher and include controls for birth cohort and year. The sample is restricted to men enlisted 1970-1979 (except 1978) and 1980-1988 with a sum of cognitive score between 12 and 27. The control function is interacted with enlistment year. One star denotes statistical significance at the 10%-level in a two sided test, two stars significance at the 5%-level and three stars at the 1%-level. Standard errors are clustered at the Sum of cognitive subscores × enlistment year. The F-statistic tests for joint significance of the final cognitive score thresholds 5-7.
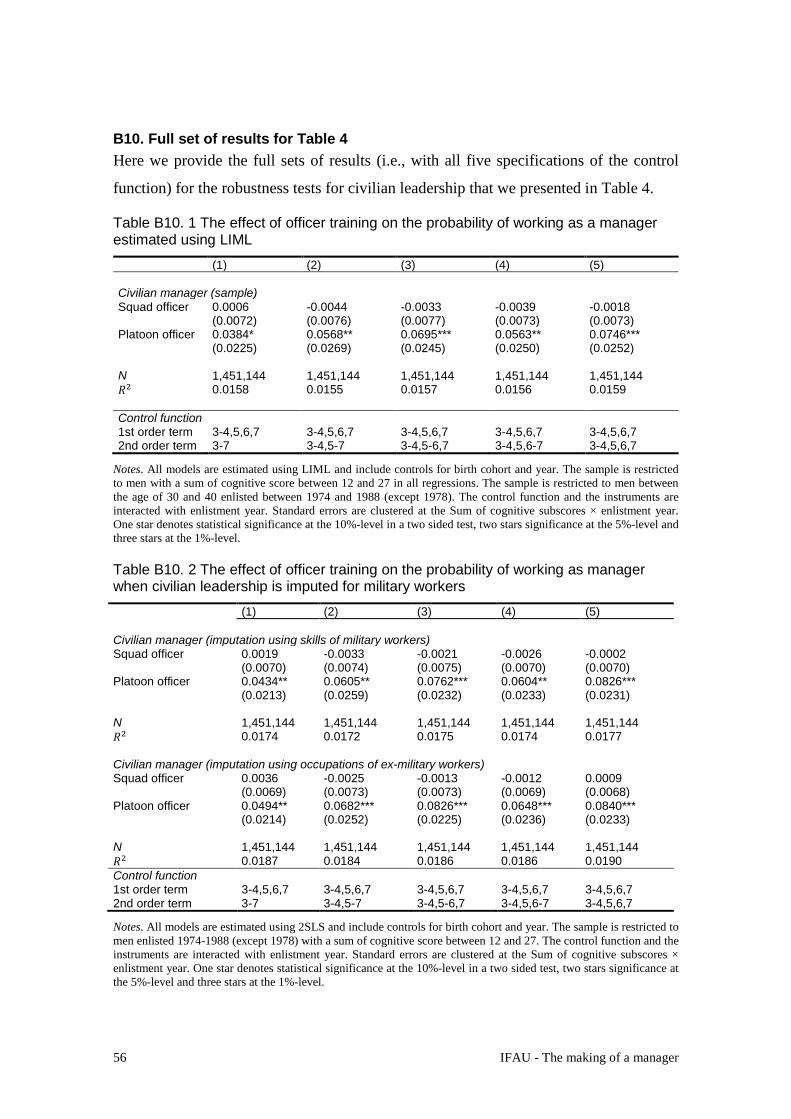
56 IFAU - The making of a manager
B10. Full set of results for Table 4 Here we provide the full sets of results (i.e., with all five specifications of the control
function) for the robustness tests for civilian leadership that we presented in Table 4.
Table B10. 1 The effect of officer training on the probability of working as a manager estimated using LIML (1) (2) (3) (4) (5) Civilian manager (sample) Squad officer 0.0006 -0.0044 -0.0033 -0.0039 -0.0018 (0.0072) (0.0076) (0.0077) (0.0073) (0.0073) Platoon officer 0.0384* 0.0568** 0.0695*** 0.0563** 0.0746*** (0.0225) (0.0269) (0.0245) (0.0250) (0.0252) N 1,451,144 1,451,144 1,451,144 1,451,144 1,451,144 𝑅2 0.0158 0.0155 0.0157 0.0156 0.0159 Control function 1st order term 3-4,5,6,7 3-4,5,6,7 3-4,5,6,7 3-4,5,6,7 3-4,5,6,7 2nd order term 3-7 3-4,5-7 3-4,5-6,7 3-4,5,6-7 3-4,5,6,7
Notes. All models are estimated using LIML and include controls for birth cohort and year. The sample is restricted to men with a sum of cognitive score between 12 and 27 in all regressions. The sample is restricted to men between the age of 30 and 40 enlisted between 1974 and 1988 (except 1978). The control function and the instruments are interacted with enlistment year. Standard errors are clustered at the Sum of cognitive subscores × enlistment year. One star denotes statistical significance at the 10%-level in a two sided test, two stars significance at the 5%-level and three stars at the 1%-level.
Table B10. 2 The effect of officer training on the probability of working as manager when civilian leadership is imputed for military workers (1) (2) (3) (4) (5) Civilian manager (imputation using skills of military workers) Squad officer 0.0019 -0.0033 -0.0021 -0.0026 -0.0002 (0.0070) (0.0074) (0.0075) (0.0070) (0.0070) Platoon officer 0.0434** 0.0605** 0.0762*** 0.0604** 0.0826*** (0.0213) (0.0259) (0.0232) (0.0233) (0.0231) N 1,451,144 1,451,144 1,451,144 1,451,144 1,451,144 𝑅2 0.0174 0.0172 0.0175 0.0174 0.0177 Civilian manager (imputation using occupations of ex-military workers) Squad officer 0.0036 -0.0025 -0.0013 -0.0012 0.0009 (0.0069) (0.0073) (0.0073) (0.0069) (0.0068) Platoon officer 0.0494** 0.0682*** 0.0826*** 0.0648*** 0.0840*** (0.0214) (0.0252) (0.0225) (0.0236) (0.0233) N 1,451,144 1,451,144 1,451,144 1,451,144 1,451,144 𝑅2 0.0187 0.0184 0.0186 0.0186 0.0190 Control function 1st order term 3-4,5,6,7 3-4,5,6,7 3-4,5,6,7 3-4,5,6,7 3-4,5,6,7 2nd order term 3-7 3-4,5-7 3-4,5-6,7 3-4,5,6-7 3-4,5,6,7
Notes. All models are estimated using 2SLS and include controls for birth cohort and year. The sample is restricted to men enlisted 1974-1988 (except 1978) with a sum of cognitive score between 12 and 27. The control function and the instruments are interacted with enlistment year. Standard errors are clustered at the Sum of cognitive subscores × enlistment year. One star denotes statistical significance at the 10%-level in a two sided test, two stars significance at the 5%-level and three stars at the 1%-level.

IFAU - The making of a manager 57
Table B10. 3 The effect of officer training on the probability of working as manager controlling for socioeconomic characteristics (1) (2) (3) (4) (5) Including covariates Squad officer -0.0008 -0.0089 -0.0084 -0.0093 -0.0076 (0.0081) (0.0085) (0.0085) (0.0084) (0.0083) Platoon officer 0.0373 0.0650** 0.0748*** 0.0592** 0.0640*** (0.0229) (0.0256) (0.0237) (0.0228) (0.0222)
N 1,286,592 1,286,592 1,286,592 1,286,592 1,286,592 𝑅2 0.0171 0.0161 0.0160 0.0162 0.0165 Excluding covariates, restricted sample Squad officer -0.0006 -0.0090 -0.0084 -0.0094 -0.0078 (0.0081) (0.0086) (0.0086) (0.0084) (0.0084) Platoon officer 0.0396* 0.0673*** 0.0766*** 0.0612*** 0.0661*** (0.0226) (0.0255) (0.0238) (0.0229) (0.0223) N 1,286,592 1,286,592 1,286,592 1,286,592 1,286,592 𝑅2 0.0161 0.0150 0.0149 0.0150 0.0154 Control function 1st order term 3-4,5,6,7 3-4,5,6,7 3-4,5,6,7 3-4,5,6,7 3-4,5,6,7 2nd order term 3-7 3-4,5-7 3-4,5-6,7 3-4,5,6-7 3-4,5,6,7
Notes. The sample is restricted to men enlisted 1974-1988 (except 1978) with a sum of cognitive score between 12 and 27. All models are estimated using 2SLS where top panel include fixed effects for the mother’s and father’s years of schooling, an indicator for whether the mother and father is born in a non-Nordic country, and fixed effects for birth cohort and year; bottom panel analyses uses the same sample but only include fixed effects for birth cohort and year. The control function and the instruments are interacted with enlistment year. Standard errors are clustered at the Sum of cognitive subscores × enlistment year. One star denotes statistical significance at the 10%-level in a two sided test, two stars significance at the 5%-level and three stars at the 1%-level.
Table B10.4 The effect of officer training on the probability of working as manager, men with final cognitive score between 3 and 6 (1) (2) (3) Squad officer 0.0042 -0.0044 -0.0036 (0.0073) (0.0073) (0.0072) Platoon officer 0.0490** 0.0921*** 0.0619*** (0.0218) (0.0246) (0.0220) N 1,186,772 1,186,772 1,186,772 𝑅2 0.0140 0.0122 0.0130 Control function Polynomial 3-4,5,6 3-4,5,6 3-4,5,6 Separate slopes 3-6 3-4,5-6 3-4,5,6
Notes. All models are estimated using 2SLS and include controls for birth cohort and year. The sample is restricted to men between age 30 and 40 enlisted 1974-1988 (except 1978) with a sum of cognitive score between 12 and 24. The control function and the instruments are interacted with enlistment year. Standard errors are clustered at the Sum of cognitive subscores × enlistment year. One star denotes statistical significance at the 10%-level in a two sided test, two stars significance at the 5%-level and three stars at the 1%-level.
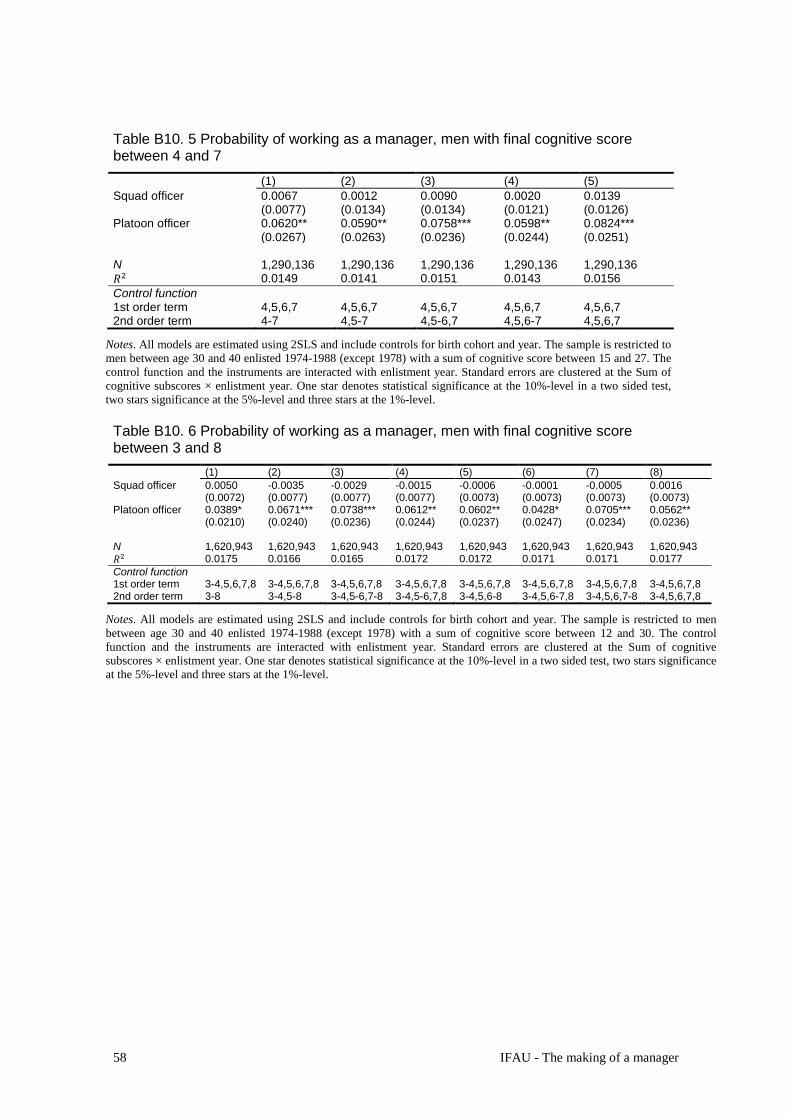
58 IFAU - The making of a manager
Table B10. 5 Probability of working as a manager, men with final cognitive score between 4 and 7 (1) (2) (3) (4) (5) Squad officer 0.0067 0.0012 0.0090 0.0020 0.0139 (0.0077) (0.0134) (0.0134) (0.0121) (0.0126) Platoon officer 0.0620** 0.0590** 0.0758*** 0.0598** 0.0824*** (0.0267) (0.0263) (0.0236) (0.0244) (0.0251) N 1,290,136 1,290,136 1,290,136 1,290,136 1,290,136 𝑅2 0.0149 0.0141 0.0151 0.0143 0.0156 Control function 1st order term 4,5,6,7 4,5,6,7 4,5,6,7 4,5,6,7 4,5,6,7 2nd order term 4-7 4,5-7 4,5-6,7 4,5,6-7 4,5,6,7
Notes. All models are estimated using 2SLS and include controls for birth cohort and year. The sample is restricted to men between age 30 and 40 enlisted 1974-1988 (except 1978) with a sum of cognitive score between 15 and 27. The control function and the instruments are interacted with enlistment year. Standard errors are clustered at the Sum of cognitive subscores × enlistment year. One star denotes statistical significance at the 10%-level in a two sided test, two stars significance at the 5%-level and three stars at the 1%-level.
Table B10. 6 Probability of working as a manager, men with final cognitive score between 3 and 8 (1) (2) (3) (4) (5) (6) (7) (8) Squad officer 0.0050 -0.0035 -0.0029 -0.0015 -0.0006 -0.0001 -0.0005 0.0016 (0.0072) (0.0077) (0.0077) (0.0077) (0.0073) (0.0073) (0.0073) (0.0073) Platoon officer 0.0389* 0.0671*** 0.0738*** 0.0612** 0.0602** 0.0428* 0.0705*** 0.0562** (0.0210) (0.0240) (0.0236) (0.0244) (0.0237) (0.0247) (0.0234) (0.0236) N 1,620,943 1,620,943 1,620,943 1,620,943 1,620,943 1,620,943 1,620,943 1,620,943 𝑅2 0.0175 0.0166 0.0165 0.0172 0.0172 0.0171 0.0171 0.0177 Control function 1st order term 3-4,5,6,7,8 3-4,5,6,7,8 3-4,5,6,7,8 3-4,5,6,7,8 3-4,5,6,7,8 3-4,5,6,7,8 3-4,5,6,7,8 3-4,5,6,7,8 2nd order term 3-8 3-4,5-8 3-4,5-6,7-8 3-4,5-6,7,8 3-4,5,6-8 3-4,5,6-7,8 3-4,5,6,7-8 3-4,5,6,7,8
Notes. All models are estimated using 2SLS and include controls for birth cohort and year. The sample is restricted to men between age 30 and 40 enlisted 1974-1988 (except 1978) with a sum of cognitive score between 12 and 30. The control function and the instruments are interacted with enlistment year. Standard errors are clustered at the Sum of cognitive subscores × enlistment year. One star denotes statistical significance at the 10%-level in a two sided test, two stars significance at the 5%-level and three stars at the 1%-level.
IFAU - The making of a manager 59
B11. Alternative definitions of leadership In our main set of analyses, we let the manager-dummy vary by individual and year, and
we consider men between age 30 and 40. There are certainly other ways of measuring
leadership, and in this section we consider to such ways.
Leadership at a certain point in the career We define a dummy variable equal to 1 in case an individual was ever a manager during
a certain period of his career, defined by work experience. Since we lose observations as
the experience interval becomes narrower, we consider 5-year intervals. We thus ask
questions of the type: “Was this person a manager sometime between 11 and 15 years of
work experience?” We base our measure of having “ever” been a manager on the
imputed set of occupations (see section 3 in the paper) in order for the sample to be as
large and representative as possible with respect to the set of workers.
Table B11. 1 shows the results by five-year experience intervals. The effect of
platoon officer training is increasing in experience and economically large, but not
precisely estimated compared to the results reported in the paper. The reason for the
larger standard errors are larger since we only focus on occupational status on the
“extensive margin” (manager for at least one year) and restrict attention to a more
narrow experience interval. For high levels of experience (above 21 years) standard
errors go up and eventually (from 26 years of experience), the estimates become very
sensitive to the exact specification. We emphasize that the very large point estimates in
these cases likely overstate the true effect of officer training.
A natural explanation for the larger effect of officer training among men with
extensive experience is that very few men obtain a managerial position until they have
gathered substantial labor market experience. As shown in Figure B11. 1, only 3 percent
of men with five years of experience (typically age 25) hold a managerial position
compared to 8 percent of men with 15 years of experience (typically age 35). Figure
B11. 1 also shows that the share of managers by experience is similar in the sample
without imputations and when we use imputation and weights to get closer to the
population.

60 IFAU - The making of a manager
Table B11. 1 Effect of officer training on civilian leadership by labor market experience (1) (2) (3) (4) (5) 6-10 years of labor market experience Squad officer -0.0052 0.0130 0.0107 0.0040 0.0018 (0.0112) (0.0101) (0.0099) (0.0099) (0.0096) Platoon officer -0.0211 -0.0317 -0.0191 0.0295 0.0536 (0.0292) (0.0314) (0.0299) (0.0352) (0.0331) N 133,302 133,302 133,302 133,302 133,302 𝑅2 0.0077 0.0052 0.0095 0.0197 0.0217 11-15 years of labor market experience Squad officer 0.0106 0.0150 0.0162 0.0153 0.0160 (0.0091) (0.0108) (0.0107) (0.0103) (0.0102) Platoon officer 0.0397 0.0384 0.0497* 0.0394 0.0480* (0.0248) (0.0279) (0.0264) (0.0269) (0.0257) N 248,156 248,156 248,156 248,156 248,156 𝑅2 0.0258 0.0261 0.0275 0.0263 0.0274 16-20 years of labor market experience Squad officer 0.0058 0.0086 0.0086 0.0036 0.0021 (0.0104) (0.0113) (0.0113) (0.0108) (0.0108) Platoon officer 0.0452* 0.0383 0.0547 0.0606* 0.0751** (0.0245) (0.0361) (0.0360) (0.0318) (0.0323) N 306,361 306,361 306,361 306,361 306,361 𝑅2 0.0263 0.0260 0.0276 0.0273 0.0281 21-25 years of labor market experience Squad officer 0.0056 0.0062 0.0061 0.0046 0.0042 (0.0138) (0.0142) (0.0141) (0.0141) (0.0140) Platoon officer 0.0607 0.0859* 0.1059** 0.0884 0.1135** (0.0377) (0.0491) (0.0498) (0.0551) (0.0550) N 264,881 264,881 264,881 264,881 264,881 𝑅2 0.0272 0.0286 0.0293 0.0285 0.0291 26-30 years of labor market experience Squad officer 0.0098 0.0141 0.0166 0.0041 0.0002 (0.0171) (0.0146) (0.0140) (0.0145) (0.0145) Platoon officer 0.1253** 0.1189 0.1750** 0.1297 0.2203* (0.0588) (0.0823) (0.0818) (0.1055) (0.1204) N 150,980 150,980 150,980 150,980 150,980 𝑅2 0.0241 0.0247 0.0239 0.0237 0.0194 Control function 1st order term 3-4,5,6,7 3-4,5,6,7 3-4,5,6,7 3-4,5,6,7 3-4,5,6,7 2nd order term 3-7 3-4,5-7 3-4,5-6,7 3-4,5,6-7 3-4,5,6,7
Notes. The dependent variable is a dummy variable equal to 1 in case an individual was a manager in at least one year within a given interval of labor market experience. Occupational status is imputed using information from adjacent years (see Online Appendix C1). Sample includes all individuals observed at least one year that falls in a given experience interval. All models are estimated using 2SLS and include controls for birth cohort. The sample is restricted to men enlisted 1970-1988 (except 1978) with a sum of cognitive score between 12 and 27. The control function and the instruments are interacted with enlistment year. Standard errors are clustered at the Sum of cognitive subscores × enlistment year. One star denotes statistical significance at the 10%-level in a two sided test, two stars significance at the 5%-level and three stars at the 1%-level
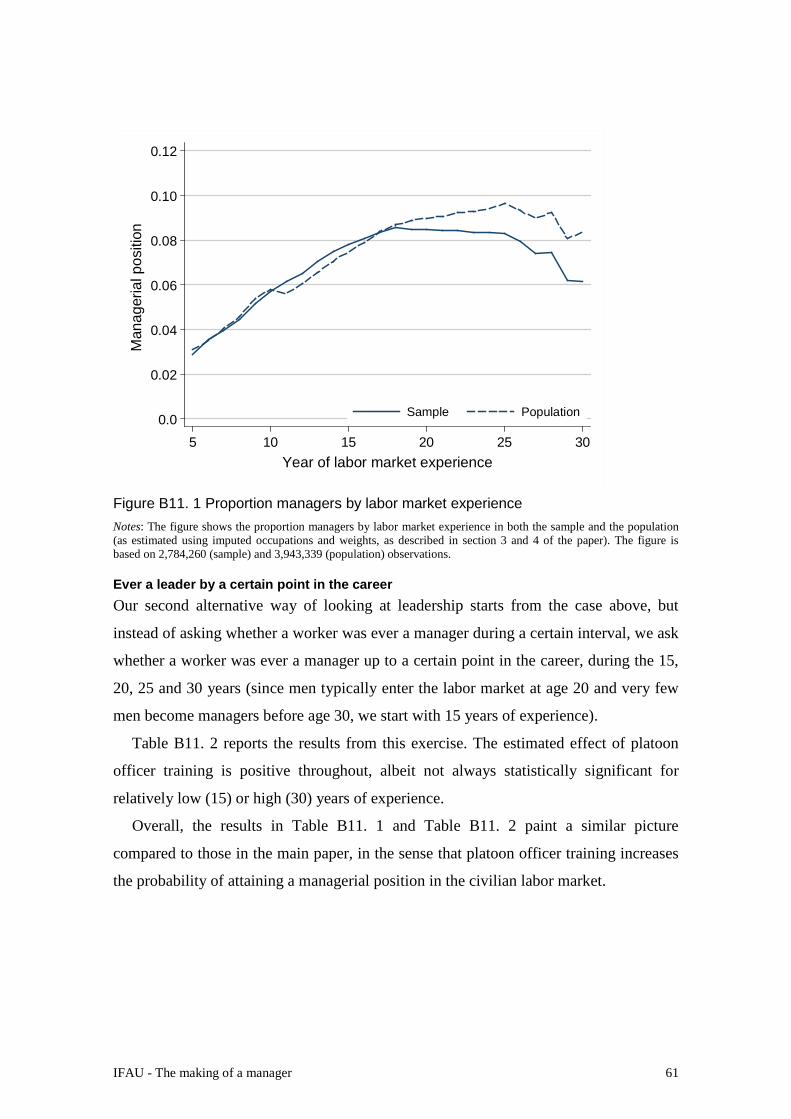
IFAU - The making of a manager 61
Figure B11. 1 Proportion managers by labor market experience Notes: The figure shows the proportion managers by labor market experience in both the sample and the population (as estimated using imputed occupations and weights, as described in section 3 and 4 of the paper). The figure is based on 2,784,260 (sample) and 3,943,339 (population) observations.
Ever a leader by a certain point in the career Our second alternative way of looking at leadership starts from the case above, but
instead of asking whether a worker was ever a manager during a certain interval, we ask
whether a worker was ever a manager up to a certain point in the career, during the 15,
20, 25 and 30 years (since men typically enter the labor market at age 20 and very few
men become managers before age 30, we start with 15 years of experience).
Table B11. 2 reports the results from this exercise. The estimated effect of platoon
officer training is positive throughout, albeit not always statistically significant for
relatively low (15) or high (30) years of experience.
Overall, the results in Table B11. 1 and Table B11. 2 paint a similar picture
compared to those in the main paper, in the sense that platoon officer training increases
the probability of attaining a managerial position in the civilian labor market.
0.0
0.02
0.04
0.06
0.08
0.10
0.12M
anag
eria
l pos
ition
5 10 15 20 25 30Year of labor market experience
Sample Population

62 IFAU - The making of a manager
Table B11. 2 Effect of officer training on civilian leadership during the first X years of the career (1) (2) (3) (4) (5) First 15 years Squad officer 0.0086 0.0151 0.0165 0.0149 0.0162* (0.0091) (0.0104) (0.0103) (0.0099) (0.0098) Platoon officer 0.0331 0.0271 0.0447 0.0386 0.0497* (0.0261) (0.0303) (0.0277) (0.0287) (0.0270) N 252,577 252,577 252,577 252,577 252,577 𝑅2 0.0260 0.0259 0.0283 0.0274 0.0289 First 20 years Squad officer 0.0074 0.0135 0.0141 0.0077 0.0084 (0.0103) (0.0108) (0.0108) (0.0103) (0.0103) Platoon officer 0.0494* 0.0363 0.0563 0.0849** 0.0989*** (0.0254) (0.0363) (0.0346) (0.0338) (0.0326) N 334,342 334,342 334,342 334,342 334,342 𝑅2 0.0296 0.0290 0.0311 0.0321 0.0328 First 25 years Squad officer 0.0081 0.0150 0.0158 0.0107 0.0110 (0.0112) (0.0116) (0.0115) (0.0111) (0.0110) Platoon officer 0.0521* 0.0501 0.0800** 0.0763** 0.0989*** (0.0298) (0.0389) (0.0360) (0.0380) (0.0350) N 364,730 364,730 364,730 364,730 364,730 𝑅2 0.0303 0.0310 0.0332 0.0324 0.0335 First 30 years Squad officer 0.0104 0.0157 0.0168 0.0112 0.0114 (0.0119) (0.0122) (0.0121) (0.0120) (0.0119) Platoon officer 0.0646** 0.0557 0.0889** 0.0748* 0.1004** (0.0304) (0.0396) (0.0367) (0.0419) (0.0392) N 365,407 365,407 365,407 365,407 365,407 𝑅2 0.0308 0.0308 0.0329 0.0316 0.0327 Control function 1st order term 3-4,5,6,7 3-4,5,6,7 3-4,5,6,7 3-4,5,6,7 3-4,5,6,7 2nd order term 3-7 3-4,5-7 3-4,5-6,7 3-4,5,6-7 3-4,5,6,7
Notes. The dependent variable is a dummy variable equal to 1 in case an individual was a manager in at least one year within a given interval of labor market experience. Occupational status is imputed using information from adjacent years (see Online Appendix C1). Sample restricted to any individual observed at least one year that falls within the interval. All models are estimated using 2SLS and include controls for birth cohort. The sample is restricted to men enlisted 1970-1988 (except 1978) with a sum of cognitive score between 12 and 27. The control function and the instruments are interacted with enlistment year. Standard errors are clustered at the Sum of cognitive subscores × enlistment year. One star denotes statistical significance at the 10%-level in a two sided test, two stars significance at the 5%-level and three stars at the 1%-level.
IFAU - The making of a manager 63
B12. Robustness tests for wages In this section, we present robustness tests for wages similar to those presented for
leadership in Table 4 and (for the full set of specifications) in Appendix B10. The only
difference compared to the set of robustness tests for leadership is that we use different
imputation strategies for missing values of wages.
Table B12. 1 The effect of officer training on wages, estimated using LIML (1) (2) (3) (4) (5) Log wages Squad officer -0.0088 -0.0035 -0.0018 -0.0010 0.0001 (0.0076) (0.0080) (0.0080) (0.0075) (0.0075) Platoon officer 0.0227 0.0066 0.0248 -0.0016 0.0143 (0.0208) (0.0256) (0.0248) (0.0257) (0.0253) N 2,220,565 2,220,565 2,220,565 2,220,565 2,220,565 𝑅2 0.2662 0.2646 0.2681 0.2636 0.2667 Control function 1st order term 3-4,5,6,7 3-4,5,6,7 3-4,5,6,7 3-4,5,6,7 3-4,5,6,7 2nd order term 3-7 3-4,5-7 3-4,5-6,7 3-4,5,6-7 3-4,5,6,7
Notes. All models are estimated using LIML and include controls for birth cohort and year. The sample is restricted to men with a sum of cognitive score between 12 and 27 in all regressions. The samples is restricted to men between age 30 and 40 who were enlisted between 1970 and 1988. The control function and the instruments are interacted with enlistment year. Standard errors are clustered at the Sum of cognitive subscores × enlistment year. One star denotes statistical significance at the 10%-level in a two sided test, two stars significance at the 5%-level and three stars at the 1%-level.
Table B12.2 The effect of officer training on wages, robustness to imputation of wages (1) (2) (3) (4) (5) Wages imputed from adjacent years Squad officer -0.0073 -0.0021 -0.0008 -0.0004 0.0007 (0.0066) (0.0066) (0.0066) (0.0063) (0.0063) Platoon officer 0.0264 0.0115 0.0244 0.0137 0.0201 (0.0184) (0.0239) (0.0236) (0.0241) (0.0252) N 2,993,808 2,993,808 2,993,808 2,993,808 2,993,808 𝑅2 0.2540 0.2526 0.2551 0.2533 0.2547 Wages imputed with wages and income from adjacent years Squad officer -0.0046 -0.0008 -0.0007 -0.0008 -0.0006 (0.0055) (0.0056) (0.0056) (0.0053) (0.0053) Platoon officer 0.0321** 0.0160 0.0234 0.0057 0.0060 (0.0136) (0.0192) (0.0197) (0.0205) (0.0216) N 4,621,683 4,621,683 4,621,683 4,621,683 4,621,683 𝑅2 0.2768 0.2749 0.2762 0.2730 0.2731 Control function 1st order term 3-4,5,6,7 3-4,5,6,7 3-4,5,6,7 3-4,5,6,7 3-4,5,6,7 2nd order term 3-7 3-4,5-7 3-4,5-6,7 3-4,5,6-7 3-4,5,6,7
Notes. All models are estimated using 2SLS and include controls for birth cohort and year. The sample is restricted to men enlisted 1970-1988 (except 1978) with a sum of cognitive score between 12 and 27. The control function and the instruments are interacted with enlistment year. Standard errors are clustered at the Sum of cognitive subscores × enlistment year. One star denotes statistical significance at the 10%-level in a two sided test, two stars significance at the 5%-level and three stars at the 1%-level.

64 IFAU - The making of a manager
Table B12.3 The effect of officer training in log wages controlling for socioeconomic characteristics (1) (2) (3) (4) (5) Including covariates Squad officer -0.0061 -0.0054 -0.0042 -0.0042 -0.0032 (0.0078) (0.0080) (0.0080) (0.0076) (0.0076) Platoon officer 0.0282 0.0239 0.0349 0.0222 0.0295 (0.0200) (0.0222) (0.0218) (0.0208) (0.0214) N 1,845,497 1,845,497 1,845,497 1,845,497 1,845,497 𝑅2 0.2861 0.2857 0.2874 0.2857 0.2869 Excluding covariates, restricted sample Squad officer -0.0072 -0.0072 -0.0057 -0.0053 -0.0040 (0.0080) (0.0081) (0.0082) (0.0077) (0.0077) Platoon officer 0.0355* 0.0328 0.0421* 0.0268 0.0337 (0.0198) (0.0229) (0.0229) (0.0211) (0.0218) N 1,845,497 1,845,497 1,845,497 1,845,497 1,845,497 𝑅2 0.2718 0.2714 0.2730 0.2710 0.2723 Control function 1st order term 3-4,5,6,7 3-4,5,6,7 3-4,5,6,7 3-4,5,6,7 3-4,5,6,7 2nd order term 3-7 3-4,5-7 3-4,5-6,7 3-4,5,6-7 3-4,5,6,7
Notes. The sample is restricted to men enlisted 1970-1988 (except 1978) with a sum of cognitive score between 12 and 27. All models are estimated using 2SLS where top panel include fixed effects for the mother’s and father’s years of schooling, an indicator for whether the mother and father is born in a non-Nordic country, and fixed effects for birth cohort and year; bottom panel analyses uses the same sample but only include fixed effects for birth cohort and year. The control function and the instruments are interacted with enlistment year. Standard errors are clustered at the Sum of cognitive subscores × enlistment year. One star denotes statistical significance at the 10%-level in a two sided test, two stars significance at the 5%-level and three stars at the 1%-level.
Table B12.4 The effect of officer training on log wages, men with final cognitive score between 3 and 6 (1) (2) (3) Squad officer -0.0058 -0.0003 -0.0001 (0.0075) (0.0075) (0.0075) Platoon officer 0.0316 0.0200 0.0075 (0.0199) (0.0239) (0.0257) N 1,800,834 1,800,834 1,800,834 𝑅2 0.2516 0.2518 0.2504 Control function 1st order term 3-4,5,6 3-4,5,6 3-4,5,6 2nd order term 3-6 3-4,5-6 3-4,5,6
Notes. All models are estimated using 2SLS and include controls for birth cohort and year. The sample is restricted to men enlisted 1970-1988 (except 1978) with a sum of cognitive score between 15 and 27. The control function and the instruments are interacted with enlistment year. Standard errors are clustered at the Sum of cognitive subscores × enlistment year. One star denotes statistical significance at the 10%-level in a two sided test, two stars significance at the 5%-level and three stars at the 1%-level.
IFAU - The making of a manager 65
Table B12.5 Log wage at age 30-40, men with final cognitive score between 4 and 7 (1) (2) (3) (4) (5) Squad officer -0.0116 0.0030 0.0115 0.0100 0.0159 (0.0080) (0.0126) (0.0125) (0.0121) (0.0122) Platoon officer 0.0079 0.0139 0.0364 0.0120 0.0301 (0.0250) (0.0253) (0.0242) (0.0243) (0.0241) N 1,989,063 1,989,063 1,989,063 1,989,063 1,989,063 𝑅2 0.2549 0.2590 0.2644 0.2598 0.2640 Control function 1st order term 3-4,5,6,7 3-4,5,6,7 3-4,5,6,7 3-4,5,6,7 3-4,5,6,7 2nd order term 3-7 3-4,5-7 3-4,5-6,7 3-4,5,6-7 3-4,5,6,7
Notes. All models are estimated using 2SLS and include controls for birth cohort and year. The sample is restricted to men enlisted 1970-1988 (except 1978) with a sum of cognitive score between 15 and 27. The control function and the instruments are interacted with enlistment year. Standard errors are clustered at the Sum of cognitive subscores × enlistment year. One star denotes statistical significance at the 10%-level in a two sided test, two stars significance at the 5%-level and three stars at the 1%-level.
Table B12.6 Log wage at age 30-40, men with final cognitive score between 3 and 8 (1) (2) (3) (4) (5) (6) (7) (8) Squad officer -0.0092 -0.0014 -0.0004 0.0001 0.0019 0.0014 0.0021 0.0025 (0.0075) (0.0082) (0.0079) (0.0079) (0.0075) (0.0075) (0.0075) (0.0075) Platoon officer 0.0124 -0.0107 0.0125 0.0179 -0.0232 -0.0194 -0.0008 0.0039 (0.0180) (0.0225) (0.0223) (0.0229) (0.0238) (0.0234) (0.0229) (0.0232) N 2,491,656 2,491,656 2,491,656 2,491,656 2,491,656 2,491,656 2,491,656 2,491,656 𝑅2 0.2825 0.2787 0.2839 0.2851 0.2759 0.2769 0.2815 0.2826 Control function 1st order term 3-4,5,6,7,8 3-4,5,6,7,8 3-4,5,6,7,8 3-4,5,6,7,8 3-4,5,6,7,8 3-4,5,6,7,8 3-4,5,6,7,8 3-4,5,6,7,8 2nd order term 3-8 3-4,5-8 3-4,5-6,7-8 3-4,5-6,7,8 3-4,5,6-8 3-4,5,6-7,8 3-4,5,6,7-8 3-4,5,6,7,8
Notes. All models are estimated using 2SLS and include controls for birth cohort and year. The sample is restricted to men enlisted 1970-1988 (except 1978) with a sum of cognitive score between 12 and 30. The control function and the instruments are interacted with enlistment year. Standard errors are clustered at the Sum of cognitive subscores × enlistment year. One star denotes statistical significance at the 10%-level in a two sided test, two stars significance at the 5%-level and three stars at the 1%-level.

66 IFAU - The making of a manager
B13. Robustness tests for educational attainment In this section, we present robustness tests for wages similar to those presented for
leadership in Table 4 and (for the full set of specifications) in Appendix B10. The only
differences compared to the set of robustness tests for leadership is that we 1) abstain
from imputing education (since missing values is much less of an issue) and 2) perform
a robustness test where we code degrees from military college as “no degree” (see Table
B13.6 below). Not including degrees from military college into our definition of tertiary
education biases the effect of officer training on higher education downward, thus
providing a “lower bound” for the effect of officer training on education. We undertake
this test to see if the positive effect of officer training on higher education could be due
a larger set of educational options (i.e., military college in addition to civilian
education).
Table B13. 1 The effect of officer training on educational attainment estimated using LIML (1) (2) (3) (4) (5) 3-year tertiary degree Squad officer 0.0285*** 0.0370*** 0.0347*** 0.0343*** 0.0339*** (0.0061) (0.0065) (0.0065) (0.0063) (0.0062) Platoon officer 0.0458** 0.0146 0.0048 0.0025 -0.0260 (0.0180) (0.0272) (0.0283) (0.0281) (0.0266) N 649,501 649,501 649,501 649,501 649,501 𝑅2 0.0829 0.0789 0.0773 0.0769 0.0720 5-year tertiary degree Squad officer 0.0056** 0.0101*** 0.0106*** 0.0069*** 0.0071*** (0.0023) (0.0021) (0.0021) (0.0019) (0.0019) Platoon officer 0.0388*** 0.0287** 0.0243* 0.0371*** 0.0342*** (0.0092) (0.0129) (0.0127) (0.0121) (0.0116) N 649,501 649,501 649,501 649,501 649,501 𝑅2 0.0184 0.0184 0.0181 0.0186 0.0187 Control function 1st order term 3-4,5,6,7 3-4,5,6,7 3-4,5,6,7 3-4,5,6,7 3-4,5,6,7 2nd order term 3-7 3-4,5-7 3-4,5-6,7 3-4,5,6-7 3-4,5,6,7
Notes. All models are estimated using LIML and include controls for birth cohort and year. The sample is restricted to men with a sum of cognitive score between 12 and 27 in all regressions. The samples in each panel are subject to the same age restrictions as the corresponding restrictions in Table 5 in the paper. The control function and the instruments are interacted with enlistment year. Standard errors are clustered at the Sum of cognitive subscores × enlistment year. One star denotes statistical significance at the 10%-level in a two sided test, two stars significance at the 5%-level and three stars at the 1%-level.

IFAU - The making of a manager 67
Table B13.2 The effect of officer training on higher education controlling for socioeconomic characteristics
Notes. The sample is restricted to men enlisted 1970-1988 (except 1978) with a sum of cognitive score between 12 and 27. All models are estimated using 2SLS where top panel include fixed effects for the mother’s and father’s years of schooling, an indicator for whether the mother and father is born in a non-Nordic country, and fixed effects for birth cohort; bottom panel analyses uses the same sample but only include fixed effects for birth cohort. The control function and the instruments are interacted with enlistment year. Standard errors are clustered at the Sum of cognitive subscores × enlistment year. One star denotes statistical significance at the 10%-level in a two sided test, two stars significance at the 5%-level and three stars at the 1%-level.
(1) (2) (3) (4) (5) At least a 3-year tertiary degree Including covariates Squad officer 0.0382*** 0.0386*** 0.0376*** 0.0321*** 0.0300*** (0.0078) (0.0074) (0.0071) (0.0071) (0.0069) Platoon officer 0.0208 0.0182 0.0037 0.0686** -0.0099 (0.0203) (0.0236) (0.0228) (0.0275) (0.0247) N 514,480 514,480 514,480 514,480 514,480 𝑅2 0.1209 0.1206 0.1187 0.1259 0.1169 Excluding covariates, restricted sample Squad officer 0.0366*** 0.0380*** 0.0364*** 0.0314*** 0.0294*** (0.0075) (0.0071) (0.0069) (0.0069) (0.0066) Platoon officer 0.0299 0.0246 0.0104 0.0744*** -0.0057 (0.0213) (0.0243) (0.0236) (0.0282) (0.0265) N 514,480 514,480 514,480 514,480 514,480 𝑅2 0.0829 0.0822 0.0800 0.0881 0.0773 At least a 5-year tertiary degree Including covariates Squad officer 0.0082*** 0.0098*** 0.0047** 0.0059*** 0.0055*** (0.0026) (0.0025) (0.0022) (0.0021) (0.0020) Platoon officer 0.0197** 0.0206* 0.0342*** 0.0468*** 0.0431*** (0.0089) (0.0106) (0.0109) (0.0116) (0.0109) N 514,480 514,480 514,480 514,480 514,480 𝑅2 0.0275 0.0275 0.0278 0.0266 0.0272 Excluding covariates, restricted sample Squad officer 0.0079*** 0.0095*** 0.0044* 0.0056** 0.0052** (0.0027) (0.0026) (0.0023) (0.0022) (0.0021) Platoon officer 0.0201** 0.0216** 0.0349*** 0.0474*** 0.0428*** (0.0090) (0.0106) (0.0110) (0.0117) (0.0109) N 514,480 514,480 514,480 514,480 514,480 𝑅2 0.0176 0.0178 0.0182 0.0174 0.0179 Control function 1st order term 3-4,5,6,7 3-4,5,6,7 3-4,5,6,7 3-4,5,6,7 3-4,5,6,7 2nd order term 3-7 3-4,5-7 3-4,5-6,7 3-4,5,6-7 3-4,5,6,7
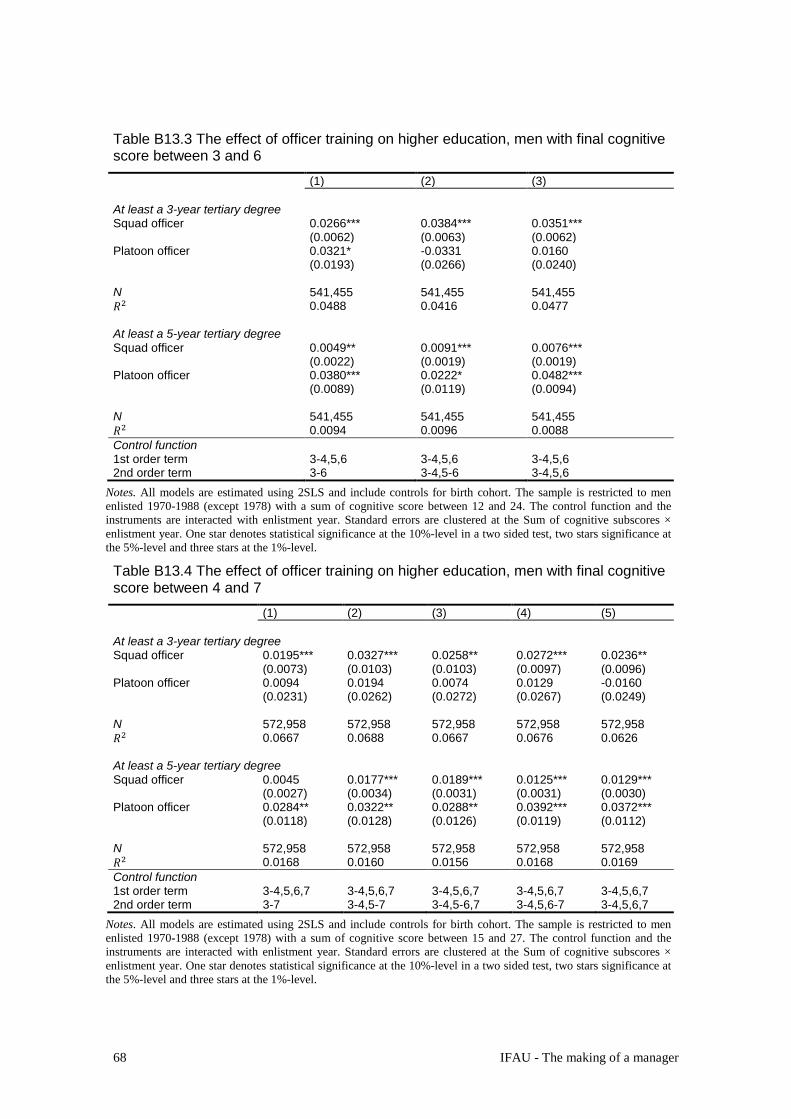
68 IFAU - The making of a manager
Table B13.3 The effect of officer training on higher education, men with final cognitive score between 3 and 6 (1) (2) (3) At least a 3-year tertiary degree Squad officer 0.0266*** 0.0384*** 0.0351*** (0.0062) (0.0063) (0.0062) Platoon officer 0.0321* -0.0331 0.0160 (0.0193) (0.0266) (0.0240) N 541,455 541,455 541,455 𝑅2 0.0488 0.0416 0.0477 At least a 5-year tertiary degree Squad officer 0.0049** 0.0091*** 0.0076*** (0.0022) (0.0019) (0.0019) Platoon officer 0.0380*** 0.0222* 0.0482*** (0.0089) (0.0119) (0.0094) N 541,455 541,455 541,455 𝑅2 0.0094 0.0096 0.0088 Control function 1st order term 3-4,5,6 3-4,5,6 3-4,5,6 2nd order term 3-6 3-4,5-6 3-4,5,6
Notes. All models are estimated using 2SLS and include controls for birth cohort. The sample is restricted to men enlisted 1970-1988 (except 1978) with a sum of cognitive score between 12 and 24. The control function and the instruments are interacted with enlistment year. Standard errors are clustered at the Sum of cognitive subscores × enlistment year. One star denotes statistical significance at the 10%-level in a two sided test, two stars significance at the 5%-level and three stars at the 1%-level.
Table B13.4 The effect of officer training on higher education, men with final cognitive score between 4 and 7 (1) (2) (3) (4) (5) At least a 3-year tertiary degree Squad officer 0.0195*** 0.0327*** 0.0258** 0.0272*** 0.0236** (0.0073) (0.0103) (0.0103) (0.0097) (0.0096) Platoon officer 0.0094 0.0194 0.0074 0.0129 -0.0160 (0.0231) (0.0262) (0.0272) (0.0267) (0.0249) N 572,958 572,958 572,958 572,958 572,958 𝑅2 0.0667 0.0688 0.0667 0.0676 0.0626 At least a 5-year tertiary degree Squad officer 0.0045 0.0177*** 0.0189*** 0.0125*** 0.0129*** (0.0027) (0.0034) (0.0031) (0.0031) (0.0030) Platoon officer 0.0284** 0.0322** 0.0288** 0.0392*** 0.0372*** (0.0118) (0.0128) (0.0126) (0.0119) (0.0112) N 572,958 572,958 572,958 572,958 572,958 𝑅2 0.0168 0.0160 0.0156 0.0168 0.0169 Control function 1st order term 3-4,5,6,7 3-4,5,6,7 3-4,5,6,7 3-4,5,6,7 3-4,5,6,7 2nd order term 3-7 3-4,5-7 3-4,5-6,7 3-4,5,6-7 3-4,5,6,7
Notes. All models are estimated using 2SLS and include controls for birth cohort. The sample is restricted to men enlisted 1970-1988 (except 1978) with a sum of cognitive score between 15 and 27. The control function and the instruments are interacted with enlistment year. Standard errors are clustered at the Sum of cognitive subscores × enlistment year. One star denotes statistical significance at the 10%-level in a two sided test, two stars significance at the 5%-level and three stars at the 1%-level.

IFAU - The making of a manager 69
Table B13.5 The effect of officer training on higher education, men with final cognitive score between 3 and 8 (1) (2) (3) (4) (5) (6) (7) (8) At least a 3-year tertiary degree Squad officer 0.0294*** 0.0385*** 0.0359*** 0.0341*** 0.0345*** 0.0336*** 0.0339*** 0.0317*** (0.0062) (0.0066) (0.0065) (0.0065) (0.0062) (0.0062) (0.0063) (0.0062) Platoon officer 0.0536*** 0.0282 0.0267 0.0437* 0.0255 0.0343 0.0090 0.0297 (0.0166) (0.0253) (0.0285) (0.0246) (0.0278) (0.0227) (0.0317) (0.0237) N 715,557 715,557 715,557 715,557 715,557 715,557 715,557 715,557 𝑅2 0.1200 0.1166 0.1164 0.1189 0.1162 0.1176 0.1135 0.1169 At least a 5-year tertiary degree Squad officer 0.0050** 0.0108*** 0.0109*** 0.0104*** 0.0082*** 0.0076*** 0.0075*** 0.0067*** (0.0025) (0.0023) (0.0021) (0.0021) (0.0021) (0.0020) (0.0020) (0.0019) Platoon officer 0.0361*** 0.0227 0.0121 0.0277** 0.0253 0.0444*** 0.0148 0.0369*** (0.0102) (0.0152) (0.0164) (0.0117) (0.0184) (0.0130) (0.0195) (0.0116) N 715,557 715,557 715,557 715,557 715,557 715,557 715,557 715,557 𝑅2 0.0308 0.0301 0.0288 0.0308 0.0305 0.0309 0.0295 0.0311 Control function 1st order term 3-4,5,6,7,8 3-4,5,6,7,8 3-4,5,6,7,8 3-4,5,6,7,8 3-4,5,6,7,8 3-4,5,6,7,8 3-4,5,6,7,8 3-4,5,6,7,8 2nd order term 3-8 3-4,5-8 3-4,5-6,7-8 3-4,5-6,7,8 3-4,5,6-8 3-4,5,6-7,8 3-4,5,6,7-8 3-4,5,6,7,8
Notes. All models are estimated using 2SLS and include controls for birth cohort. The sample is restricted to men enlisted 1970-1988 (except 1978) with a sum of cognitive score between 12 and 30. The control function and the instruments are interacted with enlistment year. Standard errors are clustered at the Sum of cognitive subscores × enlistment year. One star denotes statistical significance at the 10%-level in a two sided test, two stars significance at the 5%-level and three stars at the 1%-level.
Table B13.6 The effect of officer training on higher education (excluding military college) (1) (2) (3) (4) (5) At least a 3-year non-military tertiary degree Squad officer 0.0219*** 0.0300*** 0.0275*** 0.0276*** 0.0273*** (0.0057) (0.0063) (0.0062) (0.0060) (0.0059) Platoon officer 0.0338* 0.0130 -0.0029 0.0099 -0.0291 (0.0174) (0.0279) (0.0290) (0.0277) (0.0257) N 649,501 649,501 649,501 649,501 649,501 𝑅2 0.0754 0.0732 0.0711 0.0728 0.0671 At least a 5-year non-military tertiary degree Squad officer 0.0058*** 0.0092*** 0.0096*** 0.0064*** 0.0066*** (0.0021) (0.0020) (0.0020) (0.0018) (0.0018) Platoon officer 0.0393*** 0.0322*** 0.0266** 0.0392*** 0.0337*** (0.0084) (0.0118) (0.0117) (0.0113) (0.0108) N 649,501 649,501 649,501 649,501 649,501 𝑅2 0.0159 0.0164 0.0164 0.0160 0.0164 Control function 1st order term 3-4,5,6,7 3-4,5,6,7 3-4,5,6,7 3-4,5,6,7 3-4,5,6,7 2nd order term 3-7 3-4,5-7 3-4,5-6,7 3-4,5,6-7 3-4,5,6,7
Notes. All models are estimated using 2SLS and include controls for birth cohort. The sample is restricted to men enlisted 1970-1988 (except 1978) with a sum of cognitive score between 12 and 27. The control function and the instruments are interacted with enlistment year. Standard errors are clustered at the Sum of cognitive subscores × enlistment year. One star denotes statistical significance at the 10%-level in a two sided test, two stars significance at the 5%-level and three stars at the 1%-level.

70 IFAU - The making of a manager
B14. Main results including men drafted in 1978 As mentioned in section 3, we exclude men drafted in 1978 from the main analyses. The
reason is that only about 1/3 of all men who were drafted this year are included in our
data, and we cannot be sure that these men constitute a representative sample. We
nevertheless conduct a robustness check where we include men drafted in 1978. As
shown in Table B14. 1 below, not much changes when we include the 1978-cohort in
our sample.
Table B14. 1 Main results estimated including men drafted in 1978 (1) (2) (3) (4) (5) Civilian manager (sample) Squad officer 0.0016 -0.0038 -0.0026 -0.0033 -0.0009 (0.0070) (0.0074) (0.0075) (0.0071) (0.0070) Platoon officer 0.0389* 0.0575** 0.0690*** 0.0564** 0.0727*** (0.0216) (0.0256) (0.0234) (0.0236) (0.0236) N 1,468,118 1,468,118 1,468,118 1,468,118 1,468,118 𝑅2 0.0159 0.0156 0.0158 0.0157 0.0160 Working in the military Squad officer 0.0132*** 0.0105*** 0.0110*** 0.0117*** 0.0112*** (0.0044) (0.0037) (0.0036) (0.0035) (0.0034) Platoon officer 0.0343** 0.0386** 0.0590*** 0.0314 0.0545*** (0.0139) (0.0189) (0.0166) (0.0195) (0.0164) N 1,468,118 1,468,118 1,468,118 1,468,118 1,468,118 𝑅2 0.0248 0.0256 0.0289 0.0240 0.0286 3-year tertiary degree Squad officer 0.0306*** 0.0392*** 0.0371*** 0.0357*** 0.0353*** (0.0061) (0.0065) (0.0064) (0.0062) (0.0061) Platoon officer 0.0494*** 0.0187 0.0107 0.0140 -0.0111 (0.0176) (0.0260) (0.0270) (0.0263) (0.0246) N 659,410 659,410 659,410 659,410 659,410 𝑅2 0.0832 0.0793 0.0780 0.0785 0.0744 5-year tertiary degree Squad officer 0.0057** 0.0098*** 0.0103*** 0.0068*** 0.0070*** (0.0022) (0.0021) (0.0020) (0.0019) (0.0018) Platoon officer 0.0359*** 0.0283** 0.0233* 0.0352*** 0.0314*** (0.0091) (0.0123) (0.0121) (0.0116) (0.0110) N 659,410 659,410 659,410 659,410 659,410 𝑅2 0.0184 0.0183 0.0180 0.0185 0.0186 Log wages Squad officer -0.0032 0.0022 0.0042 0.0043 0.0057 (0.0078) (0.0082) (0.0082) (0.0079) (0.0079) Platoon officer 0.0276 0.0114 0.0303 0.0036 0.0201 (0.0202) (0.0241) (0.0233) (0.0240) (0.0237) N 2,257,940 2,257,940 2,257,940 2,257,940 2,257,940 𝑅2 0.2675 0.2658 0.2693 0.2647 0.2679 Control function 1st order term 3-4,5,6,7 3-4,5,6,7 3-4,5,6,7 3-4,5,6,7 3-4,5,6,7 2nd order term 3-7 3-4,5-7 3-4,5-6,7 3-4,5,6-7 3-4,5,6,7
Notes. All models are estimated using 2SLS and include controls for birth cohort. The sample is restricted to men enlisted 1970-1988 with a sum of cognitive score between 12 and 27. The control function and the instruments are interacted with enlistment year. Standard errors are clustered at the Sum of cognitive subscores × enlistment year. One star denotes statistical significance at the 10%-level in a two sided test, two stars significance at the 5%-level and three stars at the 1%-level.

IFAU - The making of a manager 71
B15. Mechanisms This section provides a number of additional tests related to different mechanisms by
which officer training may impact labor market outcomes, discussed in section 6 of the
paper.
Employer learning Since officers are selected based upon their cognitive and non-cognitive skills,
employers could take enlistment as an officer as a signal of high skills as measured at
the military draft. In order to test for this mechanism, we run an augmented version of
the main regression in Altonji and Pierret (2001). In their paper, educational attainment
is assumed to be observed by both employers and the econometrician while cognitive
skills are unobserved to employers. In the early phases of workers’ careers, employers
therefore use educational attainment as a proxy for cognitive skill. As workers gain
experience, employers learn about their true ability, implying that the return to cognitive
skill increases while the return to education falls. In our regressions, we add squad and
platoon officer training to the list of variables observed by both the econometrician and
employers, while the military draft measures of cognitive and non-cognitive skill are
assumed to be observed only by the econometrician. If the effect of officer training on
civilian leadership is purely due to signaling, we expect the return to officer training to
be falling in experience.
As discussed in the paper, we observe wages from 1990 and occupation from 1996.
Since we study labor market outcomes of men born between 1952 and 1970, we observe
labor market outcomes at low levels of experience only for workers who are from the
latest cohort in our data and/or with low educational attainment. This in turn creates a
correlation between experience and educational attainment: For low levels of
experience, men with high levels of education are overrepresented while, for high levels
of experience, men with low levels of education are overrepresented. To limit the
correlation between education and experience, we therefore restrict attention to
outcomes for workers with between 5 and 15 years of experience and exclude men with
a Ph.D (1.3 percent of the sample).29 While this implies that our results have less value
as a more general test of employer learning, they are still informative about the role of
29 Even after imposing these restrictions, there is a moderate negative correlation between experience and educational attainment. The average years of schooling for 5 years of experience is 1.07 years higher than at 15 years of experience.

72 IFAU - The making of a manager
signaling in the sample we considered in the previous section (age 30 to 40). Hensvik
and Nordström-Skans (2013) provide a more general test of employer learning using the
Swedish draft data.
Figure B15. 1 shows how the return to skill and officer training evolve with
experience. We follow Lange (2007) in interacting the enlistment skill measures,
schooling and officer training with a full set of experience dummies, implying that we
report separate estimates for each year of experience. The return to cognitive skill is
stable around 3 percent as experience increases whereas the return to non-cognitive goes
from 2 to 3 percent. The return to platoon officer training increases from approximately
6.5 to about 8.5 percentage points while the return to squad officer training falls from
slightly above to slightly below 2 percent. These results suggest that the effect of
platoon officer training on civilian labor market outcomes is not due to signaling, while
there may be some signaling component to squad officer training. Column (1) in Table
B15. 1 shows the results when we instead consider linear interaction terms between
experience and skills, schooling and officer training. Column (2) reports the results
when we add firm fixed effects to the regression. Columns (3) and (4) show the
corresponding results when we replace log wages with a manager dummy as the
dependent variable. The main conclusions from these regressions are the same as in
Figure B15. 1: the return to platoon officer training does not appear to be falling with
experience, thus not indicating that the results are due to signaling.

IFAU - The making of a manager 73
Figure B15. 1 The return to skills and officer training by experience Notes: The figure reports the estimated effect of cognitive skills, non-cognitive skills, squad officer and platoon officer training by experience. All estimates are from the same regression estimated with OLS. Experience is based upon educational attainment and duration of military service and rounded off to the closest integer value between 5 and 15 (i.e. between 4.50 and 15.49). The model is estimated with controls for a full set of experience and year fixed effects plus, experience dummies interacted with years of schooling, and a cubic in time interacted with cognitive and non-cognitive skills, years of schooling, squad officer and platoon officer. We exclude observations above age 40 and men with a Ph.D degree are excluded from the sample. The figure is based on 1,452,930 observations.
0.00
0.01
0.02
0.03
0.04
Wag
e pr
emiu
m
5 7 9 11 13 15Years of experience
Cognitive skills
0.00
0.01
0.02
0.03
0.04
Wag
e pr
emiu
m
5 7 9 11 13 15Years of experience
Non-cognitive skills
0.00
0.02
0.04
0.06
0.08
0.10
Wag
e pr
emiu
m
5 7 9 11 13 15Years of experience
Squad officer
0.00
0.02
0.04
0.06
0.08
0.10
Wag
e pr
emiu
m
5 7 9 11 13 15Years of experience
Platoon officer

74 IFAU - The making of a manager
Table B15. 1 Test of employer learning (1) (2) (3) (4) Manager Boss Squad officer 0.0064 0.0209*** 0.0295*** 0.0308*** (0.006) (0.005) (0.004) (0.003) Platoon officer 0.0235** 0.0389*** 0.0623*** 0.0581*** (0.010) (0.009) (0.006) (0.005) Years of schooling -0.0072*** 0.0049*** 0.0140*** 0.0216*** (0.001) (0.001) (0.001) (0.001) Cognitive skill 0.0033 -0.0042 0.0296*** -0.0036* (0.004) (0.004) (0.002) (0.002) Non-cognitive skills 0.0093*** 0.0156*** 0.0179*** 0.0141*** (0.003) (0.003) (0.002) (0.002) Squad officer*Experience 0.0006 -0.0002 -0.0008** -0.0008*** (0.000) (0.000) (0.000) (0.000) Platoon officer*Experience 0.0016* 0.0009 0.0018*** 0.0019*** (0.001) (0.001) (0.001) (0.000) Years of schooling*Experience 0.0011*** 0.0010*** 0.0014*** 0.0016*** (0.000) (0.000) (0.000) (0.000) Cognitive skills*Experience 0.0009*** 0.0013*** 0.0003 0.0015*** (0.000) (0.000) (0.000) (0.000) Non-cognitive skills*Experience 0.0010*** 0.0006** 0.0008*** 0.0010*** (0.000) (0.000) (0.000) (0.000) Firm fixed effects No Yes No Yes N 693,065 677,546 1,312,073 1,256,981 𝑅2 0.033 0.167 0.404 0.603
Note: All regressions are estimated with OLS. One star denotes statistical significance at the 10%-level in a two sided test, two stars significance at the 5%-level and three stars at the 1%-level. Experience is based upon educational attainment and duration of military service. All models are estimated with a cubic in experience, year fixed effects plus, and a cubic in time interacted with cognitive and non-cognitive skills, years of schooling, squad officer and platoon officer. We exclude observations above age 40, observations with fewer than 5 or more than 15 years of experience, and men with a Ph.D degree. Standard errors are robust and clustered on the individual.
References: Altonji, Joseph G., and Charles R. Pierret. 2001. “Employer Learning and Statistical Discrimination.”
Quarterly Journal of Economics, 116(1), 313–350.
Hensvik, Lena, and Oskar Nordström-Skans. 2013. ”Social Networks, Employee Selection, and Labor Market Outcomes.” IFAU Working Paper 2013:15.
Lange, Fabian. 2007. “The Speed of Employer Learning.” Journal of Labor Economics, 25(1), 1–35.
IFAU - The making of a manager 75
“Booted out” from a managerial position We also perform an additional (indirect) test of signaling based in the idea that men
selected into managerial positions based on a positive signal are more likely to be
“booted out” once their employers learn about their true ability. If enlistment as an
officer merely signals high ability to prospective employers, we thus expect to see
officer training increase the risk of being “booted out”. To get at this question, we
construct a dummy equal to one in case an individual has ever been a manager but is
now a non-manager. We then test whether enlistment as an officer increase the
probability of being “booted out” as defined in this way.
A major methodological concern with our measure of being Booted out is that you
can only leave a leadership position if you have, at some point, been considered suitable
for leadership. Hence only men of reasonably high leadership skill could ever go out of
a leadership position. And men can leave leadership positions for many reasons other
than being “booted out”: because firms go bankrupt, because they want to spend more
time with their family, etc. If officer training increases the share of men with high
leadership skills, it may thus also mechanically increase the share of men who have
previously held a leadership position but do not do this at the moment.
Table B15.2 nevertheless shows the results using this measure of having been
“booted out”. We see that squad officer training increases the probability of having been
“booted out” by about 1.5 percentage points. The second panel shows that the estimated
effect goes down to 0.3 percentage points if we impose a more restrictive definition of
being “booted out”, including also a wage cut by 10%. In neither of these cases do we
find any evidence that platoon officer training increase the risk of being “booted out”.
A solution to the mechanical effect of officer training on being “booted out” is to
restrict the sample to men who have ever held a managerial position. Yet while this
restriction solves one problem, it also implies that we run the regressions on a selected
sample. Since officer training as a substantial effect on selection into the group of
managers, officer training could be negatively correlated with leadership skill among
the group of managers even if officer training builds leadership skill.
Despite this concern, the final panel of Table B15.2 shows the results when we
restrict attention to the group of managers. Squad officer training is associated with a
higher probability of being booted out while the coefficients for platoon officer training
are negative (though statistically significant).

76 IFAU - The making of a manager
Due to the methodological issues mentioned above, it is hard to draw definitive
conclusions from the results in Table B15.2, and the results should only be seen as
suggestive. However, with this caveat in mind, the results do not support of the view
that platoon officers are quickly booted out from managerial positions.
Table B15.2 The effect of officer training on being “booted out” of a managerial position (1) (2) (3) (4) (5) “Booted out” of a managerial position Squad officer 0.0055 0.0162*** 0.0166*** 0.0136*** 0.0134*** (0.0047) (0.0039) (0.0038) (0.0040) (0.0039) Platoon officer 0.0065 -0.0223 -0.0097 0.0107 0.0162 (0.0150) (0.0194) (0.0177) (0.0206) (0.0191) N 1,200,828 1,200,828 1,200,828 1,200,828 1,200,828 𝑅2 0.0136 0.0091 0.0115 0.0138 0.0141 “Booted out” of a managerial position + 10% wage cut Squad officer 0.0034** 0.0032** 0.0035** 0.0026* 0.0029* (0.0016) (0.0015) (0.0015) (0.0015) (0.0015) Platoon officer 0.0087* 0.0092 0.0075 0.0127 0.0101 (0.0052) (0.0067) (0.0067) (0.0079) (0.0075) N 1,200,828 1,200,828 1,200,828 1,200,828 1,200,828 𝑅2 0.0003 0.0002 0.0007 - - “Booted out” of a managerial position (sample restricted to ever being a manager) Squad officer 0.0383 0.1691*** 0.1616*** 0.1542*** 0.1550*** (0.0487) (0.0572) (0.0560) (0.0561) (0.0559) Platoon officer 0.0138 -0.0883 -0.0888 -0.0431 -0.0527 (0.1380) (0.1559) (0.1580) (0.1708) (0.1749) N 94,672 94,672 94,672 94,672 94,672 𝑅2 0.0577 0.0239 0.0266 0.0340 0.0330 Control function 1st order term 3-4,5,6,7 3-4,5,6,7 3-4,5,6,7 3-4,5,6,7 3-4,5,6,7 2nd order term 3-7 3-4,5-7 3-4,5-6,7 3-4,5,6-7 3-4,5,6,7
Notes. The dependent variable in panel 1 and 3 is a dummy variable equal to 1 for non-managers who held a managerial position at a prior point in time (panel 1 and 3). The dependent variable in panel 2 is defined the same way as in panel 1 and 3 except that it is set to 0 in case the wage is larger than 90% of the wage in the latest year as a manager. All models are estimated using 2SLS and include controls for birth cohort and year. The sample is restricted to men of age 30 to 40, enlisted 1974-1988 (except 1978) with a sum of cognitive score between 12 and 27. The control function and the instruments are interacted with enlistment year, except for the third panel where the control function is only interacted with a dummy for the early (1970-1979) or late (1980-1988) period. Standard errors are clustered at the Sum of cognitive subscores × enlistment year. The R-square cannot be computed in specification (4) and (5) in panel 2. One star denotes statistical significance at the 10%-level in a two sided test, two stars significance at the 5%-level and three stars at the 1%-level.

IFAU - The making of a manager 77
Military service peers Below, we report the effect of officer training on the propensity to work with military
peers on the civilian labor market. As we do not have information from the military
service we define peer groups based on enlistment information. We use both a narrow
and a broad definition of peer. The narrow peer group is defined as individuals who
enlisted in to the same line of service, to the same rank, during the same year and at the
same enlistment office, while broadly defined peer groups consists of individuals who
enlisted in to the same line of service, during the same year and at the same enlistment
office. When using the definition of peers we to control for the expected share of peers
at the firm—defined as the size of the peer group relative to set of potential peers on the
labor market—in order to account for there being more privates than officers. In Table
B15.3 we that the point estimates are negative for both squad and platoon officers
across all specifications and when using both definitions of peers. The effects are
significant for squad officers when using the narrow definition, and for platoon officers
when using the broad definition. Hence, we find no evidence that conscripted officers
are more likely than regular soldiers to work in firms with a high fraction of men from
their peer group; if anything, the results suggest that officers are less likely to work with
military peers.
Table B15.3 Share of military service peers at firm conditional on expected share of peers at firm (1) (2) (3) (4) (5) Peers defined by field of service, enlistment year and rank Squad officer -0.0004** -0.0005** -0.0006*** -0.0005** -0.0006*** (0.0002) (0.0002) (0.0002) (0.0002) (0.0002) Platoon officer -0.0007* -0.0005 -0.0007 -0.0002 -0.0003 (0.0004) (0.0006) (0.0006) (0.0006) (0.0006) N 1,983,523 1,983,523 1,983,523 1,983,523 1,983,523 𝑅2 0.0246 0.0246 0.0245 0.0246 0.0246 Peers defined by field of service and enlistment year Squad officer -0.0002 -0.0002 -0.0003 -0.0002 -0.0002 (0.0003) (0.0003) (0.0003) (0.0003) (0.0003) Platoon officer -0.0013** -0.0013* -0.0014* -0.0013* -0.0013* (0.0005) (0.0007) (0.0007) (0.0008) (0.0008) N 1,983,523 1,983,523 1,983,523 1,983,523 1,983,523 𝑅2 0.0027 0.0027 0.0026 0.0027 0.0027 Control function 1st order term 3-4,5,6,7 3-4,5,6,7 3-4,5,6,7 3-4,5,6,7 3-4,5,6,7 2nd order term 3-7 3-4,5-7 3-4,5-6,7 3-4,5,6-7 3-4,5,6,7
Notes. All models are estimated using 2SLS and include controls for birth cohort and year. Regressions in the upper panel also control for rhe expected share of peers. The sample is restricted to men enlisted 1970-1988 (except) with a sum of cognitive score between 12 and 27. The control function and the instruments are interacted with enlistment year. Standard errors are clustered at the Sum of cognitive subscores × enlistment year. One star denotes statistical significance at the 10%-level in a two sided test, two stars significance at the 5%-level and three stars at the 1%-level

78 IFAU - The making of a manager
Education as a mediating factor In section 6, we provide a back-of-the envelope calculation of how large share of the
effect of platoon officer training on leadership that could be mediated by the positive
effect on education. This calculation is based on two numbers: 1) the association
between years of schooling and the probability of attaining a managerial position and 2)
the effect of officer training on years of schooling. The first number is provided in Table
B15.4 Each year of schooling is associated with a 0.17 percentage point higher
probability of attaining a managerial position. In our calculation, we assume that this
estimate (which is estimated from a simple OLS) reflects a causal effect. Table B15.5
gives us five different estimates for the effect of officer training on years of schooling.
We use the highest number (that platoon officer training increase years of schooling by
0.45) in our calculation.
Table B15.4 Association between leadership and educational attainment (1) Years of schooling 0.0017*** (0.0002) N 1,434,185 𝑅2 0.0232
Notes. Model estimated with OLS. The set of control variables includes fixed effects for cohort and dummies for cognitive skills (4-36) interacted with dummies for non-cognitive skills (1-9). One star denotes statistical significance at the 10%-level in a two sided test, two stars significance at the 5%-level and three stars at the 1%-level.
Table B15.5 The effect of officer training on years of schooling (1) (2) (3) (4) (5) Squad officer 0.1752*** 0.2204*** 0.2183*** 0.2458*** 0.2523*** (0.0578) (0.0599) (0.0598) (0.0613) (0.0611) Platoon officer 0.4532*** 0.3885* 0.3744* 0.1350 0.0400 (0.1521) (0.2001) (0.2131) (0.2461) (0.2605) N 649,501 649,501 649,501 649,501 649,501 𝑅2 0.1784 0.1781 0.1779 0.1736 0.1715 Control function 1st order term 3-4,5,6,7 3-4,5,6,7 3-4,5,6,7 3-4,5,6,7 3-4,5,6,7 2nd order term 3-7 3-4,5-7 3-4,5-6,7 3-4,5,6-7 3-4,5,6,7
Notes. All models are estimated using 2SLS and include controls for birth cohort. The sample is restricted to men enlisted 1970-1988 (except 1978) with a sum of cognitive score between 12 and 27. The control function and the instruments are interacted with enlistment year. Standard errors are clustered at the Sum of cognitive subscores × enlistment year. One star denotes statistical significance at the 10%-level in a two sided test, two stars significance at the 5%-level and three stars at the 1%-level.

IFAU - The making of a manager 79
Selection into different types of firms Below, we report the effect of officer training on selection into more or less hierarchical
firms and industries (proxied by the share of the firm’s workforce who is managers) and
selection into productive firms and industries (proxied by average wages). As shown in
Table B15.6 and Table B15.7, we find no evidence that officer training affects selection
into “hierarchical” firms, but some suggestive evidence that officer training induces
selection into high-wage firms.
Table B15.6 The effect of officer training and selection into firms and industries with different share managers (1) (2) (3) (4) (5) Share managers in the industry (SNI3) Squad officer -0.0013 0.0001 0.0001 -0.0002 -0.0003 (0.0012) (0.0010) (0.0010) (0.0010) (0.0010) Platoon officer 0.0027 -0.0021 -0.0017 -0.0016 -0.0028 (0.0040) (0.0055) (0.0055) (0.0057) (0.0058) N 1,427,003 1,427,003 1,427,003 1,427,003 1,427,003 𝑅2 0.0088 0.0113 0.0112 0.0114 0.0118 Share managers at the firm Squad officer -0.0009 0.0021 0.0023 0.0015 0.0017 (0.0021) (0.0020) (0.0020) (0.0020) (0.0020) Platoon officer 0.0058 -0.0059 -0.0061 -0.0016 -0.0033 (0.0049) (0.0066) (0.0066) (0.0071) (0.0070) N 1,427,003 1,427,003 1,427,003 1,427,003 1,427,003 𝑅2 0.0028 0.0036 0.0036 0.0042 0.0041 Share managers at the firm controlling for industry fixed effects (SNI3) Squad officer 0.0000 0.0018 0.0019 0.0018 0.0019 (0.0021) (0.0022) (0.0022) (0.0022) (0.0022) Platoon officer 0.0041 -0.0033 -0.0036 -0.0012 -0.0012 (0.0036) (0.0041) (0.0042) (0.0047) (0.0048) N 1,427,003 1,427,003 1,427,003 1,427,003 1,427,003 𝑅2 0.2887 0.2880 0.2880 0.2885 0.2885 Control function 1st order term 3-4,5,6,7 3-4,5,6,7 3-4,5,6,7 3-4,5,6,7 3-4,5,6,7 2nd order term 3-7 3-4,5-7 3-4,5-6,7 3-4,5,6-7 3-4,5,6,7
Notes. All models are estimated using 2SLS and include controls for birth cohort and year. The sample is restricted to men enlisted 1970-1988 (except 1978) with a sum of cognitive score between 12 and 27. The control function and the instruments are interacted with enlistment year. Standard errors are clustered at the Sum of cognitive subscores × enlistment year. One star denotes statistical significance at the 10%-level in a two sided test, two stars significance at the 5%-level and three stars at the 1%-level.
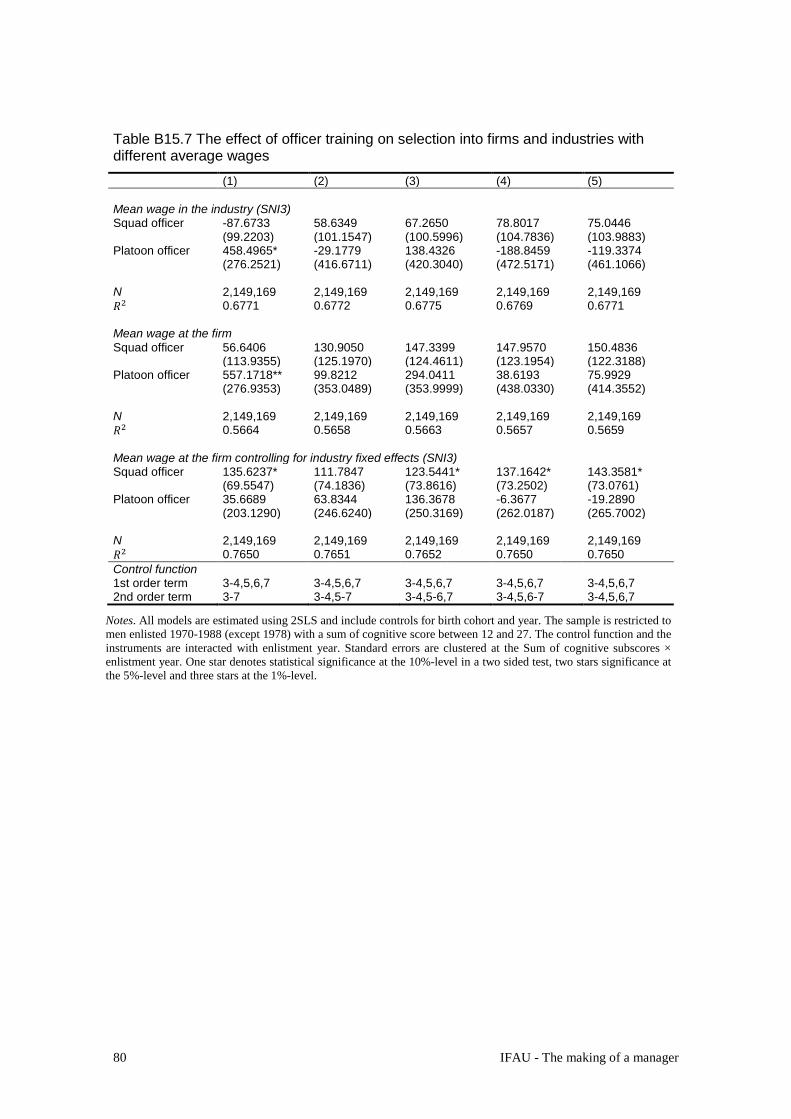
80 IFAU - The making of a manager
Table B15.7 The effect of officer training on selection into firms and industries with different average wages (1) (2) (3) (4) (5) Mean wage in the industry (SNI3) Squad officer -87.6733 58.6349 67.2650 78.8017 75.0446 (99.2203) (101.1547) (100.5996) (104.7836) (103.9883) Platoon officer 458.4965* -29.1779 138.4326 -188.8459 -119.3374 (276.2521) (416.6711) (420.3040) (472.5171) (461.1066) N 2,149,169 2,149,169 2,149,169 2,149,169 2,149,169 𝑅2 0.6771 0.6772 0.6775 0.6769 0.6771 Mean wage at the firm Squad officer 56.6406 130.9050 147.3399 147.9570 150.4836 (113.9355) (125.1970) (124.4611) (123.1954) (122.3188) Platoon officer 557.1718** 99.8212 294.0411 38.6193 75.9929 (276.9353) (353.0489) (353.9999) (438.0330) (414.3552) N 2,149,169 2,149,169 2,149,169 2,149,169 2,149,169 𝑅2 0.5664 0.5658 0.5663 0.5657 0.5659 Mean wage at the firm controlling for industry fixed effects (SNI3) Squad officer 135.6237* 111.7847 123.5441* 137.1642* 143.3581* (69.5547) (74.1836) (73.8616) (73.2502) (73.0761) Platoon officer 35.6689 63.8344 136.3678 -6.3677 -19.2890 (203.1290) (246.6240) (250.3169) (262.0187) (265.7002) N 2,149,169 2,149,169 2,149,169 2,149,169 2,149,169 𝑅2 0.7650 0.7651 0.7652 0.7650 0.7650 Control function 1st order term 3-4,5,6,7 3-4,5,6,7 3-4,5,6,7 3-4,5,6,7 3-4,5,6,7 2nd order term 3-7 3-4,5-7 3-4,5-6,7 3-4,5,6-7 3-4,5,6,7
Notes. All models are estimated using 2SLS and include controls for birth cohort and year. The sample is restricted to men enlisted 1970-1988 (except 1978) with a sum of cognitive score between 12 and 27. The control function and the instruments are interacted with enlistment year. Standard errors are clustered at the Sum of cognitive subscores × enlistment year. One star denotes statistical significance at the 10%-level in a two sided test, two stars significance at the 5%-level and three stars at the 1%-level.
IFAU - The making of a manager 81
Appendix C. Coding of data Here we describe the coding of military training and peer groups, as well as the
imputation of occupations and wages.
C1. Coding of type of military training In addition to soldier category, the enlistment data also contains codes for the exact
position to which conscript was enlisted. In total, there are over 2,000 different
positions. Codes consist of two letters and three digits. The letters denote the type of
unit to which a certain position belongs, like arctic ranger or fire direction at an artillery
unit. The first digit denotes which of the four soldier categories to which a conscript
belongs. Soldier category in turn determines the duration or service and the rank
conscripts receive in the wartime organization. There is also a close but not perfect
correspondence between soldier category and level of command. Conscripts in the
kompanibefäl (KB) category are typically trained to become platoon leaders in combat
units while conscripts enlisted as plutonsbefäl (PB) become platoon leaders at non-
combat units or deputy platoon leaders or troop leaders at combat units. Soldiers
enlisted as gruppbefäl (GB) are trained as squad leaders in combat or non-combat units.
The exceptions to the rule consist of different types of experts that are enlisted in one
of the higher ranked soldier categories despite the fact that they do not hold a
commanding position. Examples include interpreters (PB), technicians (PB), mechanics
(GB) and staff assistants (PB/KB). Some highly qualified units, such as parachute
rangers, enlist squad leaders from the KB or PB categories and regular soldiers from the
GB category.
In order to obtain a more precise measure of the extent of leadership required by
conscripts in different positions, we use a table with the exact position titles created
August 1st, 1975 and made available to us by the Swedish National Service
Administration. This table contains position titles such as “deputy platoon leader for a
ranger platoon” for more than 1,500 different positions. Using this table, we classify
conscripts as platoon leaders, deputy platoon leaders, troop leaders, deputy troop
leaders, squad leaders, deputy squad leaders and regular soldiers. A subset of positions
state not the exact position but instead the type of soldier category and the type of unit
(e.g., “ranger – PB”), thus not providing exact information on the size of unit under the
command of a conscript. There are also some cases where the exact position is stated,
82 IFAU - The making of a manager
but the unit under command is not given. For example, the company quartermaster is
the leader of a platoon or a troop, but this is not stated in the title. Other examples
include fire directors and technicians who may or may not have some unit under their
command. Coding such positions involves some form of subjective judgment. With the
exception of quartermasters, who are coded as platoon leaders, we code positions where
the size of the group under command is not explicitly stated as regular soldiers.
In addition to leadership positions, we also use the information on type of position to
infer whether conscripts receive training which is likely to be valuable in the civilian
labor market. More precisely, we code indicator variables for technicians, mechanic
(including welders, plumbers, and similar jobs), drivers of civilian vehicles (not
including APCs, tanks, etc), chefs (and other positions related to the supply of food),
interpreters and other positions which might entail some civilian value (e.g., painters,
carpenters, butchers, photographers and interpreters). Commanders for squads, troops or
platoons that consist of mechanics are also coded as mechanics.
There are about 700 position titles in our data which are not available in the table
from the Swedish National Service Administration. Lack of information on a specific
position code is more common (but not restricted to) later years, which is not surprising
given that the table stems from 1975. For the vast majority of cases, the missing codes
only differ in minor respects from the codes for the same type of unit available in the
tables. In this case, we use the table with existing position codes to impute type of
position, both with respect to leadership and civilian market value. When there is
conflicting coding within a certain type of unit, we assign each category two alternative
codes with the highest and lowest rank for a given soldier category within this type of
unit. For soldiers in the KB/PB-categories, position codes which only give the specific
soldier category are coded more lower-ranked than platoon leaders, deputy platoon
leaders and troop leaders, but as higher ranked than squad leaders. For soldiers in the
GB-category, codes that only indicate that soldiers belong to the GB-category are coded
as more lower-ranked than squad leadership but as higher ranked than privates. When
there is no previous code for the KB-category, they are assigned the highest rank of
soldiers in the PB-category within the same subfield. When there are no previous codes
for soldiers in the KB/PB-category we abstain from imputing a position. All uncertain
imputations are flagged.

IFAU - The making of a manager 83
In the end, we manage to obtain data on the type of position for 94 % of our sample
(we have the exact position code for 88 % and manage to impute position codes for 6
%). We use the sample of conscripts for which we observe exact command in the upper
panel of Table 1 in the paper.
Classification of combat and non-combat soldiers The grouping into “combat” and “non-combat” privates is made based on the four main
categories of privates, denoted E, F, G and H. Privates Category E includes a relatively
small group of privates who serve in special units, such as the rangers or the military
police. Category F includes privates who serve in units where the main task is to serve
in battle or close to, such as infantry, mechanized infantry, artillery and supply services
close to the front. Category G includes privates serving in support units in the field but
further from battle. Category H is a relatively small group and includes privates who
typically do not serve in the field, such as in larger supply centers. All types of privates
receive some training for battle, but the training is more intense for categories E and F.
Privates in these categories can also expect a more demanding training in other
dimensions, such as staying in the field for more extensive periods of time. The
different intensity of training is also reflected in the skill level of each category, with
average skills being highest in category E followed by in turn F, G and H.
C2. Imputation of occupations and wages Information on occupation and wage is not available for all yearly observations.
Specifically, only a representative sample of private employers with less than 500
employees is covered in data; different firms are sampled each year. We therefore
impute missing data on wages and managerial status, for individuals participating on the
labor market, if alternative information is obtainable. For managerial status we use
available information on the individual’s occupation and extrapolate over years when
information is missing. In those cases where managerial status is still missing after
extrapolating, we reweigh observations for individuals with missing information to
make them representative of their labor market participation. For wages we similarly
use available information on wages and extrapolate over missing years. In addition we
impute wages by using the yearly earnings in those cases wage information is still
missing after extrapolating over missing years.

84 IFAU - The making of a manager
In the occupation classification, military workers are defined as non-managers. Since
officer training increases the probability of a military career, the sample of men on the
civilian labor market may be non-random with respect to leadership skills. To account
for this we impute the counterfactual managerial status for military workers using either
i) their cognitive and non-cognitive skills from the military draft or ii) the civilian career
outcomes for military workers who leave the military.
Imputing occupation and weighting observations
Imputing A. When information on the managerial status is missing but is observed both for an
earlier and a later year.
1. If the individual has the same managerial status at the last earlier and the first
later observations the individual is given the same managerial status for all the
missing year in-between.
2. If managerial status at the last earlier and the first later observation is dissimilar
and (i) managerial status is missing for more than three years then the first two
missing observations are given the managerial status at the last earlier
observation and the last two missing observations are given the managerial
status at the first later observation; (ii) managerial status is missing for more two
or three years then the first missing observations is given the managerial status
at the last earlier observation and the last missing observations is given the
managerial status at the first later observation; (iii) managerial status is missing
for one year then the missing observations is not imputed.
B. When information on the managerial status is missing and is observed only for an
earlier year and (i) the earlier position is a non-managerial position then the first two
missing observations are imputed as non-manager; (ii) the earlier observation is a
managerial position then all subsequent missing observations are imputed as
manager.
C. When information on the managerial status is missing and is observed only for a
later year and (i) the first later observation is a non-managerial position then all
preceding missing observations are imputed as non-manager; (ii) the first later
observation is a managerial position then the last two missing observations are
imputed as manager.
IFAU - The making of a manager 85
D. The imputation is based on professions observed at ages 30-50 (ages 26-50 for
analyses in the Web Appendix where managerial status is related to labor market
experience).
E. Observations are only imputed if the individual is participating on the labor market
during the observation year, which is defined by having wage earnings of at least 50
percent of what the average 30 year old earn.
Weights A. For each individual we count the number of years, between ages 30-40, where he is
participating on the labor market, which is defined by having wage earnings of at
least 50 percent of what the average 30 year old earn.
B. For each individual we count the number of years, between ages 30-40, where he is
participating on the labor market and for which we observe his actual or imputed
managerial status.
C. For each individual we calculate at weight equal to the number of years he is
participating on the labor market (according to A) divided by the number of years
we observe the managerial status (according to B).
Weighting each individual’s observations according to C in the analysis makes him
representative to his participation on the labor market.
Imputing wages We primarily impute missing wages with wages from adjacent years. If wage informa-
tion is still missing impute remaining wages with income
Imputing wage with wage A. When information on wage is missing but is observed both for an earlier and a later
year the missing observations are given a wage based on a linear transformation
between the last previous and the first later wage observation for the individual
B. When information on wage is missing and is observed only for an earlier (later) year
then the first (last) two missing observations are imputed based on an estimated age-
wage trajectory from a model where we also allow for individual fixed effects.
C. The imputation is based on wages observed at ages 30-50.
86 IFAU - The making of a manager
D. Observations are only imputed if the individual is participating on the labor market
during the observation year, which is defined by having wage earnings of at least 50
percent of what the average 39 year old earn.
Imputing wage with income In our data the yearly wage earnings is observable for all employed individuals. As an
alternative imputation strategy we therefore use information on wage earnings to impute
wages. To reduce noise we restrict attention to individuals earning at least 50 percent of
what the average 39 year old earn. We thereafter impute missing wage observations
using the predicted values from the parameters of a regression model where we for each
year of observation (1990-2009) regress the log wage on a 4th order polynomial of log
income interacted with an indicator for having a postsecondary degree times a broad set
of industry indicator (10 categories). In addition we add the indicators for the level of
schooling, a 42-category industry indicator and the year of birth.
Imputing civilian leadership for military workers
Imputing with cognitive and non-cognitive skills For each observation year and age (between 30-40) we first regress managerial status
for men with a civilian profession on cognitive skills, non-cognitive skills, and
cognitive and non-cognitive skills interacted. From the estimated regression coefficients
we calculate the probability of being a manager by skill combination, observations year
and age. We then use the probabilities to randomize a counterfactual managerial status
on the civilian labor market for military workers by skill combination, observations year
and age.
Imputing with career outcomes for military workers who leave the military For each observation year and age (between 30-40) we first calculate the share of
managers among men with a civilian profession who previously worked in the military.
We then use these shares as probabilities (by observations year and age) to randomize a
counterfactual managerial status on the civilian labor market for military workers.
Publication series published by IFAU – latest issues
Rapporter/Reports 2015:1 Albrecht James, Peter Skogman Thoursie and Susan Vroman ”Glastaket och föräldraförsäk-
ringen i Sverige”
2015:2 Persson Petra ” Socialförsäkringar och äktenskapsbeslut”
2015:3 Frostenson Magnus ”Organisatoriska åtgärder på skolnivå till följd av lärarlegitimations-reformen”
2015:4 Grönqvist Erik and Erik Lindqvist ”Kan man lära sig ledarskap? Befälsutbildning under värnplikten och utfall på arbetsmarknaden”
Working papers 2015:1 Avdic Daniel “A matter of life and death? Hospital distance and quality of care: evidence from
emergency hospital closures and myocardial infarctions”
2015:2 Eliason Marcus “Alcohol-related morbidity and mortality following involuntary job loss”
2015:3 Pingel Ronnie and Ingeborg Waernbaum “Correlation and efficiency of propensity score-based estimators for average causal effects”
2015:4 Albrecht James, Peter Skogman Thoursie and Susan Vroman “Parental leave and the glass ceiling in Sweden”
2015:5 Vikström Johan “Evaluation of sequences of treatments with application to active labor market policies”
2015:6 Persson Petra “Social insurance and the marriage market”
2015:7 Grönqvist Erik and Erik Lindqvist “The making of a manager: evidence from military officer training”
Dissertation series 2014:1 Avdic Daniel “Microeconometric analyses of individual behaviour in public welfare systems”
2014:2 Karimi Arizo “Impacts of policies, peers and parenthood on labor market outcomes”
2014:3 Eliasson Tove “Empirical essays on wage setting and immigrant labor market opportunities”
2014:4 Nilsson Martin “Essays on health shocks and social insurance”
2014:5 Pingel Ronnie “Some aspects of propensity score-based estimators for causal inference”
2014:6 Karbownik Krzysztof “Essays in education and family economics”
![Algorithms Lecture 1: Discrete Probability [Sp’20] · 2020-04-07 · Algorithms Lecture 1: Discrete Probability [Sp’20] Moregenerally,acountablesetofeventsfAi ji 2Igisfullyormutuallyindependentifand](https://static.fdocuments.net/doc/165x107/5f8ded7df702d4365b6a0d5e/algorithms-lecture-1-discrete-probability-spa20-2020-04-07-algorithms-lecture.jpg)