The macroeconomics of uncertainty · The macroeconomics of uncertainty Nick Bloom (Stanford & NBER)...
78
The macroeconomics of uncertainty Nick Bloom (Stanford & NBER) Chicago Macro Lecture, December 4 th 2012
-
Upload
duongxuyen -
Category
Documents
-
view
219 -
download
0
Transcript of The macroeconomics of uncertainty · The macroeconomics of uncertainty Nick Bloom (Stanford & NBER)...

The macroeconomics of uncertainty Nick Bloom (Stanford & NBER) Chicago Macro Lecture, December 4th 2012

(1) Lecture summarizes a JEL draft with Fernandez-Villaverde and Schneider
I can circulate the current scrappy version and will post on-line a better version in the next few months

(2) Thursday and Friday the BF Center has a Policy Uncertainty conference

• Definition: What is uncertainty? • Stylized facts: Uncertainty over time and countries • Theory: Why might uncertainty matter?
• Empirics: Evidence on the impact of uncertainty

Uncertainty is forward looking and volatility is realized
For example in the simple Brownian motion process: dXt = μdt + σt-1dwt where dwt ~ N(0,1)
uncertainty about dXt+1=σt volatility over period t-s to t=variance(dXt-s,dXt-s+1….dXt) These are linked because E[variance of dXt+1]=σt
Defining uncertainty and volatility

An example for the S&P5000 from 2007 to 2012
A volatile period So uncertainty about the future was high here (implied volatility on the VIX was >40)

The last slide used a stochastic volatility definition (a process that evolves over time with a changing variance) There is another broad concept of uncertainty: Bayesian uncertainty, which is how diffuse your prior is. - Knightian uncertainty is the situation when the prior is infinitely diffuse (you have no idea)
Ambiguity is similar to Bayesian uncertainty. Risk, is very similar to uncertainty, except it is more often used when some outcomes involve loses
Difference concepts of uncertainty

• Definition: What is uncertainty? • Stylized facts: Uncertainty over time and countries • Theory: Why might uncertainty matter?
• Empirics: Evidence on the impact of uncertainty

Uncertainty is hard to measure because it is not directly observed
Unfortunately no working uncertainty barometer exists…
Uncertainty barometer
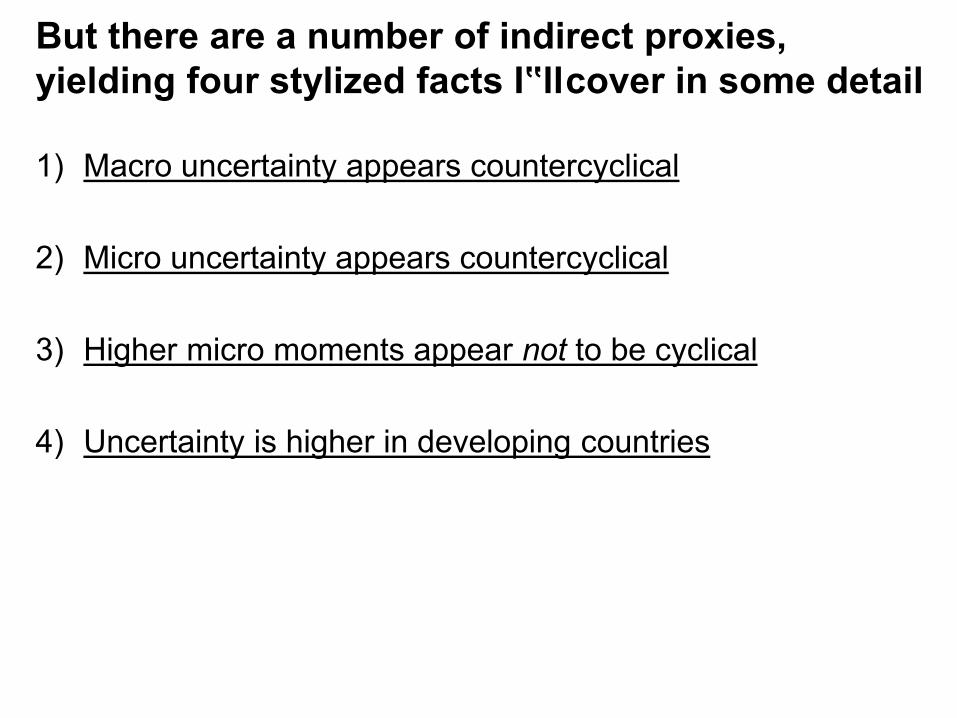
1) Macro uncertainty appears countercyclical
2) Micro uncertainty appears countercyclical
3) Higher micro moments appear not to be cyclical
4) Uncertainty is higher in developing countries
But there are a number of indirect proxies, yielding four stylized facts I‟ll cover in some detail

Would naturally generalize At to include demand (and other) shocks (e.g. Hopenhayn and Rogerson, 1993)
Hence, it looks like the following is a reasonable model for macro and micro shocks

1) Macro uncertainty appears countercyclical
2) Micro firm uncertainty appears countercyclical
3) Higher micro moments appear not to be cyclical
4) Uncertainty is higher in developing countries

020
4060
80
Stoc
k m
arke
t im
plie
d/ac
tual
vol
atilit
y
1965 1970 1975 1980 1985 1990 1995 2000 2005 2010Year
Macro uncertainty: Stock returns (implied from 1990 onwards)
Source: Bloom (2009). Notes: Realized volatility from 1962 to 1990 on S&P100, and implied volatility from 1990 onwards (Source Bloom 2009). Grey bars are NBER recessions.
GDP growth correlation 0.419 (p-value 0.000)

.005
.01
.015
.02
Fore
cast
sta
ndar
d-de
viat
ion,
from
GA
RC
H m
odel
1950 1955 1960 1965 1970 1975 1980 1985 1990 1995 2000 2005Year
Note: Predicted volatility from a GARCH(1,1) estimation of current quarterly log(GDP) on its four lagged values. Source Bloom, Floetotto, Jaimovich, Saporta and Terry 2011 using TFP data provided by John Fernald.
Macro uncertainty: GARCH for TFP

0
.05
.1.1
5.2
IQR
of u
nem
p gr
owth
rat
e fo
reca
st
1970 1975 1980 1985 1990 1995 2000 2005Year
Note: Interquartile range of cross-sectional forecasts divided by average of cross-sectional forecasts, 4 quarters ahead unemployment rates from the Survey of Professional Forecasters. Forecasts collected quarterly with an average of 41 forecasters per period. The grey shaded columns are recessionary quarters defined according to the NBER.
IQR
of u
nem
ploy
men
t for
ecas
ts
(nor
mal
ized
by
the
mea
n of
une
mpl
oym
ent)
Macro uncertainty: Disagreement (unemployment)

50
100
150
200
250
Macro uncertainty: Economic policy uncertainty
Source: Baker, Bloom and Davis (2012). Data at www.policyuncertainty.com. Data normalized to 100 prior to 2010. Plotted up until October 2012
Polic
y U
ncer
tain
ty In
dex
1st Gulf War
9/11
Clinton Election
2nd Gulf War
Bush Election
Balanced Budget Act
Lehman and
TARP
Large interest
rate cuts, Stimulus
Banking Crisis, Obama Election
Debt Ceiling Dispute; Euro Debt
Russian Crisis/LTCM
Black Monday
Fiscal Cliff

1) Macro uncertainty appears countercyclical
2) Micro firm uncertainty appears countercyclical
3) Firm skewness and kurtosis appear to be acyclical
4) Uncertainty is higher in developing countries
5) Income uncertainty and skewness appear countercyclical

.01
.02
.03
.04
.05
.06
1970 1980 1990 2000 2010Year
Micro uncertainty: Industry growth dispersion (1/2)
Note: Plots the IQR of the monthly industry growth rates within each quarter across the 196 NAICS manufacturing industries. Source: Bloom, Floetotto and Jaimovich (2009)
Inte
r Qua
rtile
rang
e of
out
put g
row
th

-.4
-.2
0.2
1970 1980 1990 2000 2010Year
Note: 1st, 5th, 10th, 25th, 50th, 75th, 90th, 95th and 99th percentiles of 3-month growth rates of industrial production within each quarter. All 196 manufacturing NAICS sectors in the Federal Reserve Board database. Source: Bloom, Floetotto and Jaimovich (2009)
99th percentile, 2.2% higher in recessions
1st percentile 7.4% lower in recessions
50th percentile, 1.3% lower in recessions
Indu
stry
leve
l qua
rterly
out
put g
row
th ra
te
Micro uncertainty: Industry growth dispersion (2/2)

Micro uncertainty: Industry stock-returns spread
Source: Chen, Kannan, Loungani and Trehan (2012)

.1.1
5.2
.25
.3
1970 1980 1990 2000 2010Year
Across all firms (+ symbol)
Across firms in a SIC2 industry
Inte
r Qua
rtile
rang
e of
sal
es g
row
th ra
te
Note: Interquartile range of sales growth (Compustat firms). Only firms with 25+ years of accounts, and quarters with 500+ observations. SIC2 only cells with 25+ obs. SIC2 is used as the level of industry definition to maintain sample size. The grey shaded columns are recessions according to the NBER. Source: Bloom, Floetotto, Jaimovich, Saporta and Terry (2011)
Micro uncertainty: Firm growth dispersion

.05
.1.1
5.2
1970 1980 1990 2000 2010Year
Across all firms (+ symbol)
Across firms in a SIC2 industry
Inte
r Qua
rtile
rang
e of
sto
ck re
turn
s
Note: Interquartile range of stock returns (CRSP firms). Only firms with 25+ years of accounts, and quarters with 1000+ observations. SIC2 only cells with 25+ obs. SIC2 is used as the level of industry definition to maintain sample size. Source: Bloom, Floetotto, Jaimovich, Saporta and Terry (2011)
Micro uncertainty: Firm stock-returns dispersion

Sales growth rate
Den
sity
Source: “Really Uncertain Business Cycles” by Bloom, Floetotto, Jaimovich, Saporta and Terry (2012) Notes: Constructed from the Census of Manufactures and the Annual Survey of Manufactures using a balanced panel of 15,752 establishments active in 2005-06 and 2008-09. Moments of the distribution for non-recession (recession) years are: mean 0.026 (-0.191), variance 0.052 (0.131), coefficient of skewness 0.164 (-0.330) and kurtosis 13.07 (7.66). The year 2007 is omitted because according to the NBER the recession began in December 2007, so 2007 is not a clean “before” or “during” recession year.
Micro uncertainty: Plant sales growth

Aver
age
Qua
rter
ly G
DP
Gro
wth
Rat
es
Inte
rqua
rtile
Ran
ge o
f pla
nt T
FP „
shoc
ks‟
Source: “Really Uncertain Business Cycles” by Bloom, Floetotto, Jaimovich, Saporta and Terry (2012) Note: Annual Survey of Manufacturing establishments with 25+ years (to reduce sample selection). Shaded columns are share of quarters in recession. Source Bloom, Floetotto, Jaimovich, Saporta and Terry (2011).
Micro uncertainty: Plant TFP „shock‟ dispersion

Source: David Berger and Joe Vavra (2009, Yale Mimeo)
Micro uncertainty: Item level price changes

1) Macro uncertainty appears countercyclical
2) Micro firm uncertainty appears countercyclical
3) Higher micro moments appear not to be cyclical
4) Uncertainty is higher in developing countries

Higher moments harder to measure - need yet larger samples - but these suggest little cyclical behavior
Source: “Really Uncertain Business Cycles” by Bloom, Floetotto, Jaimovich, Saporta and Terry (2012) Note: Annual Survey of Manufacturing establishments with 25+ years (to reduce sample selection). Shaded columns are share of quarters in recession. Source Bloom, Floetotto, Jaimovich, Saporta and Terry (2011).

Income seems to display a similar increasing spread as plant data, at least in earlier analysis
Storesletten, Telmer and Yaron (2004) show that US cohorts in the PSID that have lived through more recessions have more dispersed incomes Meghir and Pistaferri (2004) (also on the PSID) show that labor market residuals have a higher standard deviation in recessions

Recent data suggests a rising third moment (skewness) in recessions, particularly 2007-10
Source: Guvenen, Ozkan and Song, “The nature of countercyclical income risk” (2012), Minneapolis Fed mimeo Notes: Uses about 5m obs per year from the US Social Security Administration earnings data

Macro, industry, firms, plants and product prices
Incomes?
So in summary

1) Macro uncertainty appears countercyclical
2) Micro firm uncertainty appears countercyclical
3) Firm skewness and kurtosis appear to be acyclical
4) Uncertainty is higher in developing countries

Developing countries have more volatile GDP
Source: Baker & Bloom (2012) “Does uncertainty reduce growth? Evidence from disaster shocks”. Notes: Rich=(GDP Per Capita>$20,000 in 2010 PPP)

Annual GDP growth deciles (in deviation from country mean)
Unc
erta
inty
pro
xies
(n
orm
aliz
ed to
mea
n 0,
SD
1)
Source: Baker and Bloom (2012), “Does uncertainty reduce growth? Evidence from disaster shocks” Notes: Volatility indicators constructed from the unbalanced panel of daily data from 1970 to 2012 from 60 countries. The GDP growth quintiles are calculated using annual values in deviations from the country mean across the sample.
-.2
0 .2
.4
.6
.8
1 2 3 4 5 6 7 8 9 10
Stock index daily returns volatility Cross-firm daily stock returns spread Sovereign bond yields daily volatility Exchange rate daily volatility GDP forecast disagreement
Developing (and in fact all) countries also appear to have countercyclical uncertainty
• Definition: What is uncertainty? • Stylized facts: Uncertainty over time and countries • Theory: Why might uncertainty matter?
• Empirics: Evidence on the impact of uncertainty

Policymakers think that uncertainty matters

FOMC (October 2001) “increased uncertainty is depressing investment by fostering an increasingly widespread wait-and-see attitude about undertaking new investment expenditures FOMC (April 2008) “participants reported that uncertainty about the economic outlook was leading firms to defer spending projects until prospects for economic activity became clearer.” FOMC (June 2009) “participants noted elevated uncertainty was said to be inhibiting spending in many cases.” FOMC (September 2010) “A number of business contacts indicated that they were holding back on hiring and spending plans because of uncertainty about future fiscal and regulatory policies”
Policymakers think that uncertainty matters

Famous economists also worry about uncertainty
Olivier Blanchard (January 2009) “Uncertainty is largely behind the dramatic collapse in demand. Given the uncertainty, why build a new plant, or introduce a new product now? Better to pause until the smoke clears.”
Larry Summers (March 2009) “…unresolved uncertainty can be a major inhibitor of investment. If energy prices will trend higher, you invest one way; if energy prices will be lower, you invest a different way. But if you don‟t know what prices will do, often you do not invest at all.”
Christina Romer (April 2009) “Volatility has been over five times as high over the past six months as it was in the first half of 2007. The resulting uncertainty has almost surely contributed to a decline in spending.”

Although not everyone agrees….

• Imagine everything was linear – for example utility is a linear function U(c) = A+Bc
• Then you only care about is the mean of c, the first moment which is E(c) (certainly equivalence)
• As soon as you have curvature the distribution of c also matters, for example U(c) = A + Bc – Dc2
Uncertainty and volatility matter when you have curvature so that distributions matter

The main sources of curvature by firms and consumers
Firms - Adjustment costs (real options) - Revenue functions (Oi-Hartman-Abel effects) - Financial frictions - Managerial risk-aversion Consumers

• Idea is that investment and hiring are (partially) sunk-costs
• As a result when uncertainty is high about the future you want to wait to find out before investing or hiring
• Literature most strongly associated with Dixit and Pindyck‟s (1994) book
• Other key early papers include Bernanke (1983), McDonald, Siegel (1986) and Bertola and Bentolila (1990)
Real options literature emphasizes that many investment and hiring decisions are irreversible

A micro to macro model (from “Really uncertain business cycles”, Bloom et al. 2012)
• Large number of heterogeneous firms
• Macro productivity and micro productivity follow an AR
process with time variation in the variance of innovations
• Uncertainty (σA and σZ) also persistent - e.g. follows a 2-point markov chain

Capital and labor adjustment costs
● Capital and labor follow the laws of motion:
where i: investment δk: depreciation s: hiring δn: attrition
● Allow for the full range of adjustment costs found in micro data ● Fixed – lump sum cost for investment and/or hiring ● Partial – per $ disinvestment and/or per worker hired/fired

For both investment and hiring get these Ss type models with investment/disinvestment thresholds
Disinvest (s) Invest (S)
Productivity / Capital
Den
sity
of u
nits

Disinvest (s) Invest (S)
Productivity / Capital
Den
sity
of u
nits
When uncertainty increases the thresholds move out and investment temporarily falls

Since the model has 2-factors with adjustment costs it has a 2-dimensional response box
High uncertainty Low uncertainty

The real options effects work through two channels
“Delay effect”: when uncertainty increases firms put off making decisions. So investment and hiring tends to fall. ∂I/∂σ<0 where I=investment or hiring, σ=uncertainty
“Caution effect”: when uncertainty increases firms are less sensitive to other changes, like prices and demand ∂2I/∂A∂σ<0 where I and σ as above, A=TFP or demand

Figure 1: An uncertainty shock causes an output drop of just over 3%, and a recovery to almost level within 1 year
Quarters (uncertainty shock in quarter 1)
Out
put d
evia
tion
(in lo
gs fr
om v
alue
in p
erio
d 0)
“Delay effect”
Source: “Really Uncertain Business Cycles” by Bloom, Floetotto, Jaimovich, Saporta and Terry (2012)

Quarters (uncertainty shock in quarter 1)
Dev
iatio
n (in
logs
from
val
ue in
per
iod
0)
Figure 2: Labor and investment drop and rebound, and TFP slowly falls and rebounds
“Delay effect”
“Delay effect”
“Caution effect”
Source: “Really Uncertain Business Cycles” by Bloom, Floetotto, Jaimovich, Saporta and Terry (2012)

1. You can wait – rules out now or never situations (e.g. patent races, first-mover games, auctions etc)
2. Investing now reduces returns from investing later – rules out perfect competition and constant returns to scale
3. You can act „rapidly‟ – rules out large delays, which Bar-Ilan & Strange (1996) show generate offsetting put options
4. Some „non-convex‟ adjustment costs – this means some fixed (lump-sum) or partial irreversibility (i.e. a resale loss), rather than only quadratic (smoothly increasing) costs
How general are these results? Real option effects only arise under certain conditions
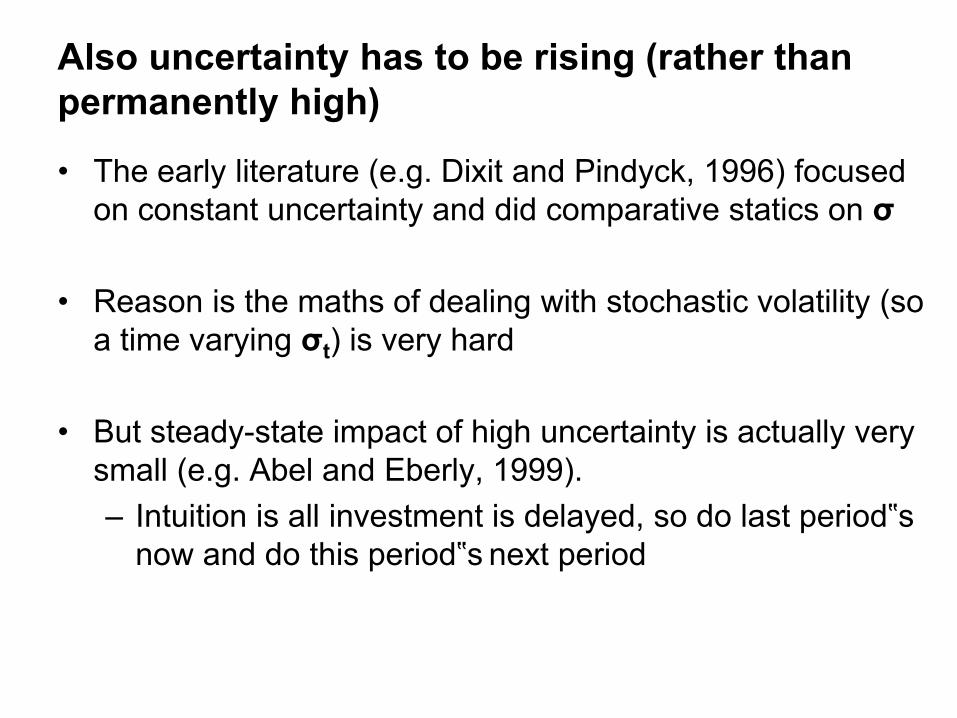
• The early literature (e.g. Dixit and Pindyck, 1996) focused on constant uncertainty and did comparative statics on σ
• Reason is the maths of dealing with stochastic volatility (so a time varying σt) is very hard
• But steady-state impact of high uncertainty is actually very small (e.g. Abel and Eberly, 1999). – Intuition is all investment is delayed, so do last period‟s
now and do this period‟s next period
Also uncertainty has to be rising (rather than permanently high)

In a New Keynesian model in which prices are sticky in the short-run, Basu and Bundick (2011) obtain negative uncertainty effects from a lack of demand Benigno and Ricci (2011) show that with downward nominal wage rigidity higher uncertainty increases probability of binding, reducing hiring
Other macro models have exploited price (rather than factor input) adjustment costs

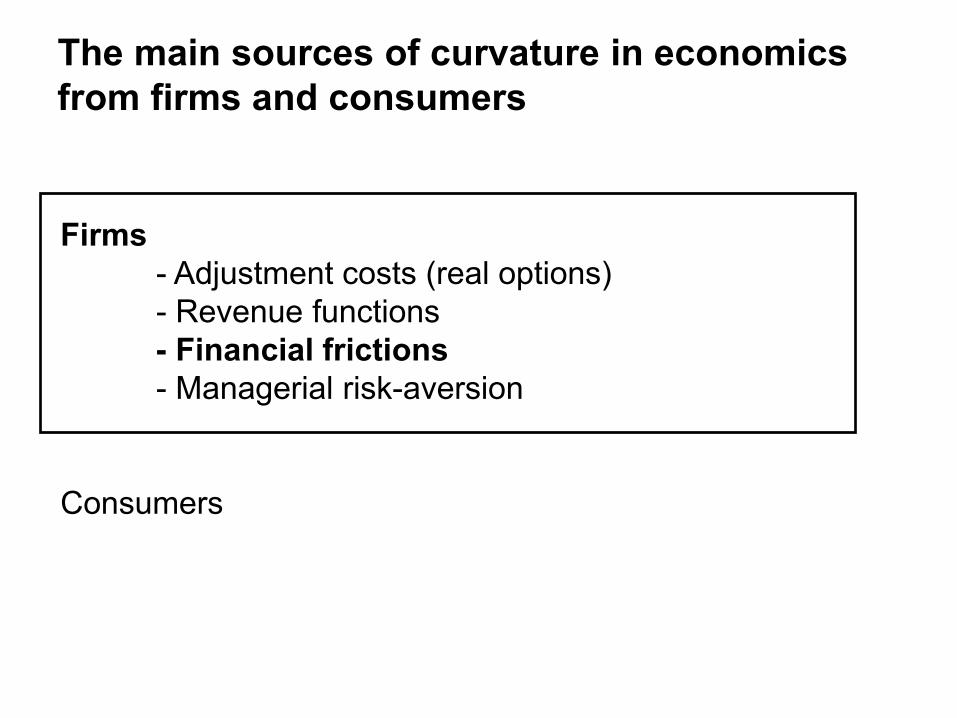
The main sources of curvature in economics from firms and consumers
Firms - Adjustment costs (real options) - Revenue functions - Financial frictions - Managerial risk-aversion Consumers

• The Oi-Hartman-Abel effect (sometimes Hartman-Abel effect) based on the impact of uncertainty on revenue. Based on Oi (1961), Hartman (1972) and Abel (1983)
• The basic idea is that if capital and labor are costlessly adjustable variability is good for average revenue – When demand is high expand – When demand is low contract
Non-linear revenue functions can also induce uncertainty effects (1/2)

For example, for Cobb-Douglas if profits are: Π=AKαLβ – rK – wL Then you obtain for optimal (flexible) capital and labor K*=λKA1/(1- α – β) L*=λLA1 /(1- α – β)
where λK and λL are constants As a result K* and L* are convex in A, so a higher variance in A leads to higher average K and L
Non-linear revenue functions can also induce uncertainty effects (2/2)

This result requires no capital or labor adjustment costs, which in reality is very unlikely to happen
Hence, while theoretically this can reverse the impact of uncertainty, in practice I don‟t think it‟s an important channel in the short-run (when factors are fixed). Bloom et al. (2012) find real-option effects dominate in the short-run (≤6 quarters) and OHA in medium-run (6+ quarters)
But the Oi-Hartman-Abel effect is not robust
The main sources of curvature in economics from firms and consumers
Firms - Adjustment costs (real options) - Revenue functions - Financial frictions - Managerial risk-aversion Consumers

The 2007-2009 crisis clearly highlighted the issues of both finance and uncertainty, and natural to ask do they interact? Many recent papers (e.g. Arrellano, Bai & Kehoe 2011, Gilchrist, Sim & Zakrajsek 2011, and Christiano, Motto & Rostango, 2011) emphasize uncertainty-finance interaction They have an empirical and theory component – both suggest financial frictions and uncertainty amply each other
Recent financial crisis have emphasized the role of uncertainty and finance

The main sources of curvature in economics from firms and consumers
Firms - Adjustment costs (real options) - Revenue functions - Financial frictions - Managerial risk-aversion Consumers

While investors may be diversified (at least for publicly quoted firms) managers typically are not. Managers hold human-capital in the firm (firm-specific training etc) and often financial capital (shares) As a result they have a risk-return trade-off for the firm. So higher uncertainty should induce more cautious behavior, typically meaning less investment and hiring
Another channel is that managers are typically not well diversified, so firm risk=personal risk

The main sources of curvature in economics from firms and consumers
Firms Consumers - Risk aversion - Durable adjustment costs (real options)

Classic idea is higher risk requires higher returns, reducing investment and hiring Fernandez-Villaverde, Guerron, Rubio-Ramirez and Uribe (2011) use numerical methods to solve complex realistic models and find significant negative impacts Ilut and Schneider (2012) use ambiguity aversion to demonstrate large negative effects (fear of the worst case) Gourio (2011) has higher-moment (left-tail) concerns that again generate drops in uncertainty
Risk aversion has seen an increase in interest recently

The main sources of curvature in economics from firms and consumers
Firms Consumers - Risk aversion - Durable adjustment costs (real options)

For consumers (like firms) sunk investments have option values if they can delay The classic example is buying a car – you can always delay. If uncertainty is high the option value of waiting may be so high you do not purchase this period Note: Non-durables do not satisfy the “Investing now reduces returns from investing later” criteria, so no option value of delay. e.g. Eating next year no substitute for eating this year
For consumption there is also a real-options effect on durable expenditure
Postponed by uncertainty?

Classic papers include: Romer (1990) who showed a big drop of durable/non-durable expenditure during the Great Depression arguing this is due to Uncertainty Eberly (1994) looked at US car purchases, showing higher uncertainty led to a caution effect (Ss bands moved out).
For consumption there is also a real-options effect on durable expenditure

• Definition: What is uncertainty? • Stylized facts: Uncertainty over time and countries • Theory: Why might uncertainty matter?
• Empirics: Evidence on the impact of uncertainty

Impact of uncertainty on growth
Micro evidence Macro evidence Identification and reverse causality

Micro papers on firms typically find negative effects of uncertainty on investment, e.g. • Leahy and Whited (1996) is the classic in the literature.
Build a firm-level panel (Compustat) and regresses investment on Tobin‟s Q and stock-return volatility (using daily data within each year)
• Used lagged values as instruments for identification
• Find a significant negative effect of uncertainty on investment, but nothing for covariance

Other papers have also found good micro-data evidence of negative uncertainty impacts • Guiso and Parigi (1999) used Italian survey data on firms
expectations of demand, and again found a negative impact on levels (“delay effect”)
• Bloom, Bond and Van Reenen (2007) build a model and estimated on UK data using GMM, finding a negative “caution effect” (makes firms less responsive)
• Panousi and Papanikolaou (2011) undertook a novel twist demonstrating part of negative uncertainty effect appears to be management risk aversion.

Impact of uncertainty on growth
Micro evidence Macro evidence Identification and reverse causality

Source: Cholesky VAR estimates using monthly data from June 1962 to June 2008, variables in order include stock-market levels, VIX, FFR, log(ave earnings), log (CPI), hours, log(employment) and log (IP). All variables HP detrended (lambda=129,600). Reults very robust to varying VAR specifications (i.e. ordering, variable inclusion detrending etc). Source: Bloom (2009)
Basic results suggest a drop and recovery from VAR types estimates, e.g. Bloom (2009)

Some papers use a cross-country approach
• Ramey and Ramey (1995) provided evidence on volatility
and growth, using Government expenditure as an instrument for volatility, and find a strong negative relationship
• Engel and Rangel (2008) update this using a larger and more details cross-country panel and a better volatility measure, and again find a large negative correlation between volatility on growth

Impact of uncertainty on growth
Micro evidence Macro evidence Identification and reverse causality

An obvious concern is over reverse causality, which seems very plausible from the theory • One model is Van Nieuwerburgh and Veldkamp (2006)
which assumes learning is generated by activity, so recessions slow learning
• Bachmann and Moscarini (2011) assume instead that recessions are good times to experiment
• Kehrig (2011) has some very nice data showing counter-cyclical productivity dispersion and a model endogenizing volatility due to fixed costs of production
• Or maybe recessions are a good time for Governments to try new policies, as in Lubos and Veronesi (2012)

The evidence on causality between uncertainty and recessions is weak, and an active research area • In Baker and Bloom (2012) use disasters as instruments and
find a negative causal impact of uncertainty on growth
• Stein and Stone (2012) use energy and currency instruments in firm data finding a large causal impact of uncertainty on investment, hiring and advertising but positive on R&D
But still an open and very interesting research question

• Definition: What is uncertainty? • Stylized facts: Uncertainty over time and countries • Theory: Why might uncertainty matter?
• Empirics: Evidence on the impact of uncertainty
• Conclusions

Wrap-up summary
1. Micro and macro uncertainty are countercyclical
2. Theory suggests this is likely to reduce hiring, investment and consumer durable expenditures due to: a) Postponing action due to real-options “delay effects” b) Risk aversion (from consumers and managers)
3. Empirical evidence suggests negative impacts of
uncertainty, maybe explains ≈ 1/3 of business cycles
4. Uncertainty also reduces policy impact due to real options “caution effects” – makes firms & consumers less responsive

Goodbye from General Equilibrium