THE MACRO-ECONOMIC IMPLICATIONS OF MICRO … · THE MACRO-ECONOMIC IMPLICATIONS OF MICRO-ECONOMIC...
42
1 THE MACRO-ECONOMIC IMPLICATIONS OF MICRO-ECONOMIC MARKET FAILURES IN TELECOMMUNICATIONS – THE CASE OF SA. Nicola Theron ECONEX www.econex.co.za Department of Economics University of Stellenbosch [email protected] 1. INTRODUCTION This paper will examine the micro-economic market failures and the rationale for regulation in the South African telecommunications sector. The role of telecommunications in economic growth will be emphasized by analysing the effect that the micro-economic market failures can have on economic growth rates. Section 2 will highlight the role of telecommunications in economic growth, by looking at fixed line and mobile penetration rates in South Africa and selected African countries. Section 3 will deal with regulation and specifically with the relevant concepts in the SA Competition Act (no. 89 of 1998). Concepts such as market power and dominance will be discussed. Section 4 defines the relevant fixed line market, and also analyses the potential abusive behaviour, by specifically looking at the case of ADSL and also the current VANS complaint before the Competition Tribunal. Section 5 analyses the effect of these anti-competitive acts on competition. The second part of the paper focus on the mobile sector. Section 6 gives an overview of the SA mobile market, by looking at market shares, concentration indices, etc. Finally it is argued in section 6 that mobile prices have converged over time and that there might be a case for joint dominance between Vodacom and MTN in this market. Section 7 concludes. 2. ROLE OF TELECOMMUNICATIONS IN ECONOMIC GROWTH High telecommunication prices have a negative effect on economic activity. The telecoms sector directly contributes approximately 4% of SA’s GDP. Indirectly, telecommunications are used as an input by the remaining 96% of the economy and so, if telecoms costs are high, this acts as a tax on production across the economy.
Transcript of THE MACRO-ECONOMIC IMPLICATIONS OF MICRO … · THE MACRO-ECONOMIC IMPLICATIONS OF MICRO-ECONOMIC...

1
THE MACRO-ECONOMIC IMPLICATIONS OF MICRO-ECONOMIC
MARKET FAILURES IN TELECOMMUNICATIONS – THE CASE OF SA.
Nicola Theron ECONEX
www.econex.co.za
Department of Economics University of Stellenbosch
1. INTRODUCTION
This paper will examine the micro-economic market failures and the rationale for regulation in the South African telecommunications sector. The role of telecommunications in economic growth will be emphasized by analysing the effect that the micro-economic market failures can have on economic growth rates. Section 2 will highlight the role of telecommunications in economic growth, by looking at fixed line and mobile penetration rates in South Africa and selected African countries. Section 3 will deal with regulation and specifically with the relevant concepts in the SA Competition Act (no. 89 of 1998). Concepts such as market power and dominance will be discussed. Section 4 defines the relevant fixed line market, and also analyses the potential abusive behaviour, by specifically looking at the case of ADSL and also the current VANS complaint before the Competition Tribunal. Section 5 analyses the effect of these anti-competitive acts on competition. The second part of the paper focus on the mobile sector. Section 6 gives an overview of the SA mobile market, by looking at market shares, concentration indices, etc. Finally it is argued in section 6 that mobile prices have converged over time and that there might be a case for joint dominance between Vodacom and MTN in this market. Section 7 concludes.
2. ROLE OF TELECOMMUNICATIONS IN ECONOMIC GROWTH High telecommunication prices have a negative effect on economic activity. The telecoms sector directly contributes approximately 4% of SA’s GDP. Indirectly, telecommunications are used as an input by the remaining 96% of the economy and so, if telecoms costs are high, this acts as a tax on production across the economy.

2
Figure 1 – Percentage contribution of Communication to GDP
Percentage contribution to gross domestic product by industry at current prices : Transport and communication - Communication (Unit: Percentage contribution to annual gross domestic product; Source: P0441 : Table 9)
1.99
2.16
2.50
2.76
2.99
3.32
3.48
3.683.82 3.84
3.91
0.00
0.50
1.00
1.50
2.00
2.50
3.00
3.50
4.00
4.50
1993 1994 1995 1996 1997 1998 1999 2000 2001 2002 2003
percentage
Source: StatsSA, 2005 When South Africa became a representative democracy in 1994, the government started pursuing one of its urgent objectives, i.e. that of improving the accessibility of services to those who prior to the democracy, did not enjoy access (who typically find themselves in the low-income earning category). To address the lack of accessibility, most sectors quantified targets to be achieved during a set period. In the case of the telecommunications sector, "targets were set for individual residential service ('universal service') and for community service outside of individual homes ('universal access')." (Hodge, 2003: 1). Shortly after becoming a democracy, South Africa joined the World Trade Organisation ('WTO') and committed itself to gradually liberalising the telecommunications sector thereby increasing the level of competition in the sector (Hodge, 2003: 2). The following graph shows the importance of access to telecommunications facilities to economic development. The higher access rates in SA, compared to the other African countries shown below, correspond with higher per capita GDP growth rates. It must be noted however, that in an international context, SA has relatively low overall access rates. The main problem is that the access to communications facilities is very unevenly spread across the population. Figure 2 – Telecommunications penetration and economic development

3
Role of telecommunication in economic development
10.44 0.43 0.41 0.28
0.8
11.35
1.6
0.840.28
1.191.43
0.92
21
0
1
2
3
4
5
6
7
8
9
10
11
12
13
14
15
16
17
18
19
20
21
Kenya Mozambique Nigeria Tanzania Uganda Zambia South Africa
0
1000
2000
3000
4000
5000
6000
7000
8000
9000
Fixed-line telephones per 100 inhabitants Mobile customers per 100 inhabitants GDP per capita ($)
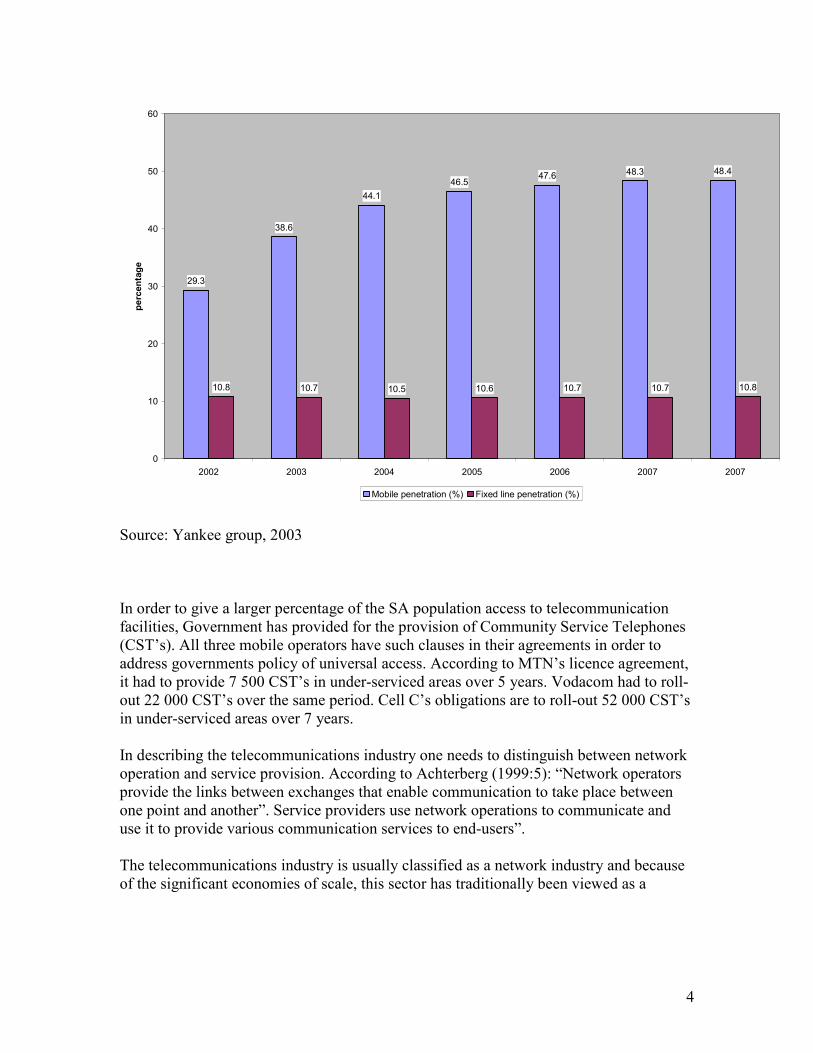
Source: Telkom (2003) The South African average for fixed line penetration is approximately 11 lines per 100 people. Internet services are traditionally provided via fixed line facilities, and this low rate of penetration is a severe impediment to business activities such as e-commerce and ultimately limits economic growth. It is therefore in the interest of the country to have higher access rates and a better distribution of access to communications facilities. Part of the liberalisation strategy of government was to grant two mobile licenses to MTN and Vodacom (1994) and a PSTN license to Telkom (1997). In 2001 Cell C entered the market. The total mobile market in SA consist of approximately 25 million subscribers1. The following graph shows mobile penetration vs. fixed line penetration for SA. This is based on research done by the Yankee group (2003). MTN has also recently stated that it expects the mobile market to grow by 51 percent by 20082. Figure 3: Mobile and fixed line penetration
1 Business Report, Monday 5/9/2005, p. 17 2 Business Report, Monday 5/9/2005, p. 17
4
29.3
38.6
44.1
46.547.6 48.3 48.4
10.8 10.7 10.5 10.6 10.7 10.7 10.8
0
10
20
30
40
50
60
2002 2003 2004 2005 2006 2007 2007
percentage
Mobile penetration (%) Fixed line penetration (%)
Source: Yankee group, 2003 In order to give a larger percentage of the SA population access to telecommunication facilities, Government has provided for the provision of Community Service Telephones (CST’s). All three mobile operators have such clauses in their agreements in order to address governments policy of universal access. According to MTN’s licence agreement, it had to provide 7 500 CST’s in under-serviced areas over 5 years. Vodacom had to roll-out 22 000 CST’s over the same period. Cell C’s obligations are to roll-out 52 000 CST’s in under-serviced areas over 7 years. In describing the telecommunications industry one needs to distinguish between network operation and service provision. According to Achterberg (1999:5): “Network operators provide the links between exchanges that enable communication to take place between one point and another”. Service providers use network operations to communicate and use it to provide various communication services to end-users”. The telecommunications industry is usually classified as a network industry and because of the significant economies of scale, this sector has traditionally been viewed as a
5
natural monopoly3. The initial cost of providing a network is huge and these costs are sunk costs which can not be retrieved. The marginal cost, however, of giving another user access, or making another call, is very low. In the service provision market, cost structures are different as these service providers use the network of the incumbent, to provide services ranging from telephone calls (local, long-distance and international) to Value Added Network Services (VANS). Traditionally, the network operation and service provisions were integrated and in SA provided by the previously state owned Telkom. In 1991, Telkom was incorporated and registered as a public limited liability company under the SA Companies Act, as part of a commercialization process aimed at liberalizing the telecommunications sector. This process of liberalization led to the listing of Telkom on the Johannesburg Securities Exchange and the New York Stock Exchange in March 2003. Telkom was granted a five-year exclusivity period until May 2002, during which it had to prepare for a competitive environment and had to achieve certain roll-out targets (Telkom, 2003). Government is still in the process of appointing a second network operator (SNO) which should become operative in the 2nd half of 2005). However, for the purposes of this report, Telkom will be assumed to be the only provider of network services in South Africa, as the sole participant in the fixed-line market. Telkom stated in its IPO (2003:100) that: “We believe our extensive state-of-the-art fixed-line network places us in a strong position to compete with new providers of communications services as it enables us to sell value-added voice and data services.”
3. REGULATION – ICASA AND THE COMPETITION ACT Telecommunications is a regulated industry worldwide and this is also true for South Africa. Prices and other conditions in the market are determined by the regulatory body, the Independent Communications Authority of SA (ICASA). All tariff increases have to be approved by ICASA. However, the more practical avenue for companies who want to complain against certain aspects of the behaviour of telecommunications firms, is to file a complaint under the Competition Act (no. 89 of 1998). This act defines certain acts as anti-competitive. The analysis below will rely mainly on concepts used in the Competition Act, such as market power, exclusionary acts, vertical integration, price discrimination, etc.
3.1 MARKET POWER & DOMINANCE
3.1.1 CRITERIA FOR DOMINANCE
3 A natural monopoly is a market, such as telecommunications, or electricity provision, where the initial capital cost is very high and scale economies very big (technically, very high sunk costs and low marginal costs), so that it normally makes sense for these services to be provided by a single firm, traditionally state owned.

6
Dominance is described in the South African Competition Act (section 8) as: ‘A firm is dominant in a market if – (a) it has at least 45% of that market; (b) it has at least 35%, but less than 45%, of that market, unless it can show that it does not have market power; or (c) it has less than 35% of that market, but has market power.’ Before a complaint of an anti-competitive act by a dominant firm (sections 8 and 9 of the Act) can be brought before the Tribunal, the complainant has to prove that the incumbent firm is dominant. If a firm has more than 45% of the market, it is assumed to be dominant (there is no defense for dominance), with an implied presumption of guilt. If it has more than 35% but less than 45% of the market, the onus rests on the firm to show that it does not have market power. If it has less than 35% of the market, the onus is on the Competition Authorities to prove that it has market power. The European Court of Justice (ECJ) defines a ‘dominant position’ referred to in article 86 of the EC Treaty as a “position of economic strength enjoyed by an undertaking which enables it to prevent effective competition [from] being maintained on the relevant market by giving it the power to behave to an appreciable extent independently of its competitors, customers and ultimately of its consumers”. No firm can have significant market power if there is effective competition (regardless of market shares). One of the characteristics of effective competition is the inability of firms to act independently, e.g. to change prices independently. This is described in article 86 (EC Treaty on dominance) as a “position of economic strength enjoyed by an undertaking which enables it to prevent effective competition [from] being maintained on the relevant market by giving it the power to behave to an appreciable extent independently of its competitors, customers and ultimately of its consumers”. “A dominant position does not mean that an undertaking deemed to be in a dominant position has no competitors; it simply means that an undertaking is in a position to have an “appreciable influence on the conditions” under which conduct in the relevant market will develop and to act largely in disregard of its competition “so long as such conduct does not operate to its detriment.” It is not illegal for an undertaking to have a dominant position; rather, where a firm is found to be in a dominant position it “has a special responsibility not to allow its conduct to impair genuine undistorted competition on the Common Market.”4 The definition of dominance used by the South African Tribunal in the York Timbers case (Case Number: 15/IR/Feb01) is instructive. The Tribunal argued that an abuse of dominance must be based on the exercise of market power and the extension of this market power to lessen competition in the relevant market:
4 The “dominant position” doctrine and the European Union’s response to the British Airways/American airlines alliance. Available: http://www.bc.edu/bc_org/avp/law/lwsch/journals/bciclr/23_1/04_TXT.htm

7
“In order to consider a claim in terms of Section 8 the Tribunal must be satisfied that the respondent is either dominant in the market in which the alleged abuse is perpetrated or that the effect of the abuse is experienced in a related market, one either upstream or downstream of the market in which the alleged perpetrator of the abuse is dominant. However where that is the case, it still remains to be established that the perpetrator of the alleged abuse is, by drawing on its power in the market in which it is dominant, attempting to create or to exercise market power in this related market...It is not enough to show that a given practice is a product of market power. It must also be shown that the act complained of actually extends that power or creates new sites of power.” This approach is also taken in the USA where it is stated in Areeda and Hovenkamp that: “An ‘arbitrary’ refusal to deal by a monopolist cannot be unlawful unless it extends, preserves, creates, or threatens to create significant market power in some market, which could be either the primary market in which the monopoly firm sells or a vertically related or even collateral market. Refusals that do not accomplish at least one of these results do not violate Sec 2 (of the Sherman Act), no matter how much they might harm the person or class of person declined service. Nor are such refusals an ‘abuse’ of monopoly power in the sense of using power in one market as ‘leverage’ to increase one’s advantage in another market”.
3.1.2 MARKET POWER IN TELECOMMUNICATIONS
Market power’ is defined in the South African Act as: ‘the power of a firm to control prices, to exclude competition or to behave to an appreciable extent independently of its competitors, customers or suppliers’. Apart from market shares and pricing behaviour, there are other criteria that are usually employed to consider whether a firm has market power. While it is recognized that a firm without significant market shares will probably not have sufficient market power to behave anti-competitively, in the telecommunications sector it is important to consider aspects such as barriers to entry, profitability, vertical integration, etc. The extent to which established market players are constrained by the prospect of new entry is a key factor in determining the existence of market power. In the telecommunications sector, barriers to entry are often high because of existing legislative and other regulatory requirements which may limit the number of available licences or the provision of certain services. The profitability of existing suppliers in a market can also be indicative of the extent of true competition. Excessive profitability typically may indicate insufficient competition. The relevance of vertical integration relates to the ability of a firm which enjoys market power in one market to extend its power into related markets. Vertically integrated firms in the telecommunications market (e.g. that provide local as well as long distance or international services) can often use market power in one market to act anti-competitively
8
in a related market. Telkom is a good example of a firm which is vertically integrated, and this has certain implications for competitiveness that will be discussed below.
3.1.3 SIGNIFICANT MARKET POWER
A related concept, used by the European Commission in telecommunications markets is that of ‘significant market power’. A number of the European Commissions Open Network Provision directives permit the imposition of additional obligations on operators that have significant market power. In addition to the EU criteria for dominance (articles 85 and 86 of the Treaty of Rome), specific market shares are used to determine the existence of significant market power in telecommunications. Article 4 of the European Commission’s Interconnection Directive states that: ‘an organization shall be presumed to have significant market power when it has a share of more than 25% of a particular telecommunications market’5. Apart from the market share threshold the following factors are used to determine whether a firm has significant market power:
• “the organisation’s ability to influence market conditions;
• turnover relative to the size of the market;
• control of means of access to end-users;
• access to financial resources;
• experience in providing products and services in the market”6. It is important to note that although the SA criteria for dominance are the relevant measure, the EU also uses the concept of significant market power in the context of telecommunications markets. This is in recognition that these markets are usually highly regulated with price controls being necessary because of inefficient competition. The EU interconnection directive (97/33/EC) laid down a range of obligations to be imposed on undertakings with significant market power: ‘transparency, non-discrimination, accounting separation, access, and price control including cost orientation”. 7 More stringent control of firms with market power in the telecommunications industry is therefore the norm worldwide. This is also applicable to South Africa where some progress has been made towards liberalization of this sector. Extra care should therefore be taken when considering the application of the Competition Act to a sector that is characterized by firms who have market power as a result of regulatory measures and more specifically barriers to entry.
5 ‘Market power and dominance’. Available: [http://cbdd.wsu.edu/edev/Nigeria_ToT/tr503/page46.htm 6 ‘Market power and dominance’. Available: [http://cbdd.wsu.edu/edev/Nigeria_ToT/tr503/page46.htm 7 Commission of the European Communities (2000). “Directive of the European Parliament and of the council on access to, and interconnection of, electronic communications networks and associated facilities”. (COMM(2000))384).

9
3.2 ABUSE OF MARKET POWER – EXCLUSIONARY ACTS, PRICE DICRIMINATION, ETC.
Under the South African Competition Act (act 89 of 1998), it is unlawful for a dominant firm to engage in exclusionary acts (8(c)). An ‘exclusionary act’ is defined in the Act as: “an act that impedes or prevents a firm entering into, or expanding within, a market”. The following provisions of the Competition Act could be applicable to the present complaint:
8(c) engage in an exclusionary act, other than an act listed in paragraph (d), if
the anti-competitive effect of that act outweighs its technological, efficiency or other pro-competitive gain; or
8(d) engage in any of the following exclusionary acts, unless the firm concerned can show technological, efficiency or other pro-competitive gains which outweigh the anti-competitive effect of its act –
(i) requiring or inducing a supplier or customer to not deal with a competitor;
(iii) selling goods or services on condition that the buyer purchases separate goods or services unrelated to the object of a contract, or forcing a buyer to accept a condition unrelated to the object of a contract;
(iv) selling goods or services below their marginal or average variable cost; or
There is a possible efficiency trade-off for these exclusionary acts: “if the anti-competitive effect of the act outweighs its technological, efficiency or other pro-competitive gain”. The EU describes exclusionary acts in the telecommunications sector as follows: “Some incumbent TOs (telecommunications operators) may be tempted to resist providing access to third party service providers or other network operators, particularly in areas where the proposed service will be in competition with the service provided by the TO itself. This resistance will often manifest itself as unjustified delay in giving access, a reluctance to allow access or a willingness to allow it only under disadvantageous conditions. It is the role of the competition rules to ensure that these prospective access markets are allowed to develop, and that incumbent TOs are not permitted to use their control over access to stifle developments on the service markets (EU,1998:10)”.

10
These concepts will be used below to determine whether Telkom is involved in any exclusionary or anti-competitive acts in the fixed line sector, and whether the mobile operators likewise are engaged in any exclusionary or anti-competitive acts in the mobile markets.
4. FIXED LINE – TELKOM MONOPOLY
4.1 RELEVANT MARKET
Market definition is a vital step in any competition analysis. The purpose of market delineation is to permit calculation of market shares which are then used to evaluate market power issues (and to determine dominance). The market definition is traditionally divided into two parts, determining the relevant product market and then the geographic market. The method used in the USA is the concept of a ‘small but significant and nontransitory’ increase in price by a hypothetical monopolist (US Horizontal Merger Guidelines, 1992). The EU (‘Commission Notice on the definition of the relevant market for the purposes of Community competition law’8), defines the relevant market as: “A relevant product market comprises all those products and/or services which are regarded as interchangeable or substitutable by the consumer, by reason of the products’ characteristics, their prices and their intended use” (EU,1997:2). 4.1.1 PRODUCT MARKET
There are at least two types of relevant product markets to consider in the telecommunications sector; that of services provided to end users (services market) and that of access to facilities necessary to provide such services (access market)9. This second market becomes more important with liberalization. As noted by the EU Commission (Access Notice, 98/C 265/02): “Liberalisation of the telecommunications sector will lead to the emergence of a second type of market, that of access to facilities which are currently necessary to provide these liberalized services. Interconnection to the public switched telecommunications network would be a typical example of such access”. The relevant access and services markets have to be determined within the specific context of each individual case. 4.1.2 SERVICES (RETAIL) MARKET
In its broadest sense, telecommunications markets can be defined as the provision of any telecommunications service to end users. This can also be described as the retail market,
8 Available: [http://europa.eu.int/comm./competition/antitrust/relevma_en.htm] 9 This distinction is defined by the Commission of the European Communities Access Notice.

11
where final consumers buy telecommunication services, either fixed line services (from Telkom), or mobile services (from the mobile operators). 4.1.3 ACCESS (WHOLESALE) MARKET
The access market is important as it provides companies with the necessary connectivity to network infrastructure. The EU (98/C 265/02) states that: “For a service provider to provide services to end-users it will often require access to one or more (upstream and downstream) facilities. For example, to deliver physically the service to end-users, it needs access to the termination points of the telecommunications network to which these end-users are connected…It can also be achieved either through a service provider who already has these end-users as subscribers, or through an interconnection provider who has access directly or indirectly to the relevant termination points”10. An example of the importance of the access market is the fact that all internet service providers need access to the Telkom infrastructure and network in order to participate in the internet service provision market. While the participants in the Internet service provider market all provide access to the Internet under the banner of a VANS licence, there are certain important distinctions between their relevant position and/ or their ability to provide telecommunications services. In particular, Telkom is the holder of both a VANS licence and a public switched telecommunications services (‘PSTS’) licence. Presently Telkom is the only holder of a PSTS licence within SA, as no SNO has as yet been granted a PSTS licence. As a holder of a PSTS licence, Telkom is obliged in terms of the provisions of section 36 of the Telecommunications Act to provide local, national and international telecommunications services.
4.1.4 GEOGRAPHIC MARKET
The EU defines the relevant geographic market i.t.o. telecommunications services as: “the area in which the objective conditions of competition applying to service providers are similar, and competitors are able to offer their services” (1998:10). Using this definition, the relevant geographic market can be defined as the whole of South Africa.
4.2 ABUSIVE BEHAVIOUR AND COMPLAINTS
4.2.1 VERTICAL RELATIONSHIPS AND BARRIERS TO ENTRY
Vertical relationships may create barriers to entry in a market. Telkom is the sole provider of the network facilities and connectivity, in fact all infrastructure required for local connections between participants is provided by Telkom, and Telkom also provides part of the connection to international service providers. Telkom therefore occupies both a horizontal and a vertical position within the Internet service provider market by virtue of its ability to offer Internet services and other telecommunications facilities.
10 EU (1998). “Notice on the application of the competition rules to access agreements in the telecommunications sector. Framework, relevant markets and principles”. (98/C 265/02).

12
It was stated above that Telkom is the holder of both a VANS licence and a public switched telecommunications services (‘PSTS’) licence. Presently Telkom is the only holder of a PSTS licence within SA, as no SNO has as yet been granted a PSTS licence. Telkom therefore occupies both a horizontal and a vertical position within the Internet service provider market by virtue of its ability to offer Internet services and other telecommunications facilities. This is a dangerous position, as problems normally associated with vertical integration are ‘foreclosure’ and ‘raising rival’s costs’. Telkom is present in the Internet Market through its SAIX (the South African Internet Exchange) service, which is an Internet access service (a VANS). According to Telkom: “SAIX is South Africa's largest Internet Access Provider and owns the largest IP backbone infrastructure connecting South Africa to the world. SAIX is the wholesale provider of raw Tier1 Internet connectivity to corporate and ISP companies; it specialises in the access, conveyance and delivery of international, national long-distance and local IP traffic through South Africa's largest and most resilient IP backbone. SAIX not only owns but also built its infrastructure, making us the specialists in raw Internet access provisioning. …SAIX is the most robust IP network in South Africa.” (www.telkom.co.za) Although Telkom describes SAIX as an IAP, SAIX also offers the following services:
• Domain name service;
• Customer authentication services;
• File repositories;
• Entertainment and gaming services. Telkom is an upstream monopoly, being the exclusive provider of network facilities that the service providers need access to. It is also a service provider and provides services in both the retail and wholesale (access) markets, defined above. Being vertically integrated, it can easily raise the cost of access to its competitors, as there is no competition in the upstream market. The tables below show Telkom’s market shares in the downstream markets. Table 1 – Dial-up access subscribers
Company % Market share (2003)
M-Web Access (including Tiscali
(14.7%))
42.7
Absa 12.8
Telkom 10.8
XsInet 4.9
Atlantic Internet services 2.0
DataPro 1.8
ICL 1.2

13
M-Web Business Solutions 0.9
Interprise 0.5
Other Access 22.5
Total 100.00
Source: BMI-T,2004 Table 2 – Leased lines
Company % Market share (2003)
Internet solutions 23
Telkom 23
UUnet 18
MTN Network Solutions 7
DataPro 7
M-Web (previously Tiscali) 6
Storm Internet 3
Interprise 2
SAI 2
24 Seven Internet Service 1
Other 8
Total 100.00
Source: BMI-T,2004 Table 3 – ADSL market shares
Company % Market share (2003)
MWeb 25
Telkom 55
UUnet 3.3
IS 8.3
Other 8.3
Total 100.00
Source: Industry estimates (2005) Telkom is therefore vertically integrated into the downstream markets. Table 3 also shows that Telkom is dominant in the downstream ADSL market. It will be argued below that Telkom uses its monopoly position in the upstream access markets to leverage its market power into the downstream markets. The ADSL market is of specific concern as Telkom is dominant both upstream and downstream. According to Ofcom (2003:92): “The Director will continue to take a close interest in the behaviour of vertically
integrated dominant providers, particularly in markets which are reliant on new
wholesale access products or where there are other reasons to believe that margin
squeeze may occur. The Director will not hesitate to take action under the Competition Act 1998 and, where this is considered insufficient to prevent a recurrence of an offence, will give full consideration to making a designation under Articles 14(2) or 14(3) of the Framework Directive and imposing ex ante regulation.” [own emphasis]

14
4.2.2 EXCESSIVE PRICES IN THE RETAIL MARKET – ADSL EXAMPLE
Section 8(a) of the Competition Act states that: “It is prohibited for a dominant firm to charge an excessive price to the detriment of consumers”. Excessive pricing is defined in the Act as: “(ix) ‘excessive price’ means a price for a good or service which – (aa) bears no reasonable relation to the economic value of that good or service; and (bb) is higher than the value referred to in subparagraph (aa);”. The focus in analyzing a complaint of excessive pricing should be on the term ‘economic value’. The concept of ‘reasonable relation’ is difficult to quantify and is therefore discretionary and open to interpretation. The ‘economic value’ can be quantified, using theoretical economic concepts such as price/cost comparisons or data on profitability. The most practical approach and the one most often employed both locally and internationally, is that of price comparisons or benchmarking. This is a more practical approach as it is relatively easy to use. Prices should be compared to similar prices in similar markets in other jurisdictions. This method was used by the Competition Commission in a recent decision about excessive prices charged by Iscor. Retail prices might not reflect the monopoly power of Telkom. In the case of ADSL (asymmetrical digital subscriber line), which will be analysed below, consumers are offered low prices which create a margin squeeze for Telkom’s competitors. According to Ofcom (2003:92): “With regard to preventing the vertical leverage of market power, the Director also notes that where a dominant provider is required to provide wholesale services on fair and reasonable terms but offers retail prices which create a margin squeeze, this may call into question whether, in the context of the retail prices offered, the wholesale prices can be considered fair and reasonable. Therefore, even if retail prices are low, the fact that wholesale prices are excessive, will still be considered evidence of a margin squeeze by the dominant firm.” In terms of wholesale access prices, Telkom is charging excessive prices when an international benchmark method is used. According to a report by Genesis Consulting (2005): “On domestic leased lines, on the data available, South Africa was the most expensive of twelve countries surveyed (100% more expensive than the average price sampled, and almost fifteen times more expensive than the cheapest country surveyed).” The following graph shows the cost of international leased lines for SA relative to other countries.

15
Figure 4: International leased lines, annual fee for 2mbps.
Source: Genesis Consulting, 2005:3
It is clear from the graph that South Africa is much more expensive than any comparable country. Another method of testing for excessive prices is to compare the price to some cost measure. In the case of international leased lines, the initial investment for the undersea cable (SAT-3) was $650 million, of which Telkom paid only a part. At an annual price of approximately $0.3 million per 2mbps line, Telkom would need to sell about 2 200 2mbps private lines, or about 11% of total line capacity at 40Gbs, to cover the total initial investment of $650 million in only one year (Genesis Consulting, 2005:3). The high cost of international bandwidth also translates into high broadband retail prices. In a recent report on Telecommunications prices in South Africa (Genesis Consulting, 2005), it was found that: “On business ADSL, despite the fact that a number of the international products sampled had a substantially higher product specification than the Telkom ADSL offering, South Africa was the most expensive broadband of all fifteen countries sampled, and was in fact more than nine times as expensive as the cheapest country surveyed.” South African prices were 148% higher than the average sample price. This is shown in the following graph for business ADSL.

16
Figure 5: Business ADSL, monthly fee for approximately 512 kbps.
Source: Genesis (2005:19).
The following table shows the main conclusions on price comparisons by Genesis Consulting.
Table 4: Summary of international price comparisons.
Rank Out of:
(number of
countries
surveyed)
Number of times
more expensive
than the cheapest
price
% greater than the
average price
Business ADSL 1 15 9.3 147.7%
Domestic leased lines 1 12 14.7 101.5%
International leased lines 1 11 31.4 398.6%
Retail ADSL 1 15 8.0 139.2%
ISP fees 4 13 5.1 45.3%
Source: Genesis Consulting, 2005:29
The table shows that South Africa charged the highest prices for ‘Business ADSL’, ‘Domestic leased lines’, ‘International leased lines’ and ‘retail ADSL’. ISP fees ranked 4th highest out of 13 countries. Although there is significant competition at the ISP level, the high cost of bandwidth affect the retail price. According to Genesis Consulting
17
(2005:3): “The high price of international bandwidth inflates ISP fees by approximately 30%”. The Genesis report (2005) also explains that: “The most startling price comparison though was on international leased lines, where South African prices are almost three times as high as the next most expensive country sampled, and 31 times more expensive than the cheapest country (out of ten countries, excluding Canada). International leased lines allow business to transport data and voice communications out of South Africa. The cost of international leased lines thus affects the cost of the internet, private data networks and Voice over Internet Protocol (VOIP)” The ADSL market provides a specific example of Telkom’s abuse of dominance and leveraging of its market power in the wholesale market. A key component of the whole ADSL infrastructure is the connectivity between the ADSL infrastructure and the networks of ISPs. In Telkom’s current implementation of ADSL, Telkom controls the connection between the DSLAM and the edge switch routers (ESR) (formerly B-RAS). ISP’s must purchase access to the ESR from Telkom to provide ADSL services. Telkom’s control over the connection between the DSLAM and the ESR means that Telkom alone can determine the quality of the Internet access service provided by ISPs to customers connected to the DSLAM via ADSL. Telkom is also the only firm licensed to provide ADSL access circuits to final consumers. Telkom therefore owns all the infrastructure required for ADSL service provision The following diagram depicts the provision of ADSL services using Telkom infrastructure.

18
Figure 6: The cost of ADSL provision
The price of ADSL has two components: (1) customer ADSL access charges (the connectivity costs associated with the
connection between the customer and the local exchange via local leads); (2) connectivity charges between a VANS licensee and the Telkom ADSL
infrastructure for the purpose of providing the ADSL service to the customer. Figure 6 shows the cost of a ‘home ADSL 512’ mbps service at R 599 (previously R 680). This is the retail price paid by the customer per month. In addition to this, the customer still pays the normal monthly line rental, R 87.05 per month for a residential line. There is a once-off installation cost of R 404. There is also a separate ISP connection, in addition to the line rental. For a standard ‘3GB Shaped TIpA Advanced’ ADSL product, the Telkom ISP charge is R 249. The ISP pays Telkom (SAIX) R 216.60 per month for each subscriber (the connectivity charges).
The high cost of access charges of Telkom therefore creates a margin squeeze for competing ISP’s. Telkom reduced the cost of their Home ADSL 512 kbps offering from R 680 to R 599 when it reached a target of 50 000 subscribers. This clearly illustrates the economies of scale and network effects associated with telecommunications. However, since there is no competition on the access portion (infrastructure owned by Telkom), the access price of R 216.60 was not reduced11.
11 The ISPs asked for a reduction from Telkom, but this was not given.
Telephone
Copper
Cable (1-5km)
Telkom Exchange
Computer DSL
Modem
DSLAM
ATM
ESR
ADSL USER
The Cost of ADSL provision
SAIX
INTERNET
ISP
ISP
MAIL SERVICE
INTERNET
BANKING
R599 pm R 216 pm
R 87.05
per
month
WAS
NOW
VOICE NETWORK
M

19
As a result of a previous complaint by ISPA (February 2003) before ICASA, Telkom made a proposal to VANS licencees in terms of which Telkom agreed to allow VANS to connect their networks to edge switch routers (ERS) located on Telkom’s ATM network. The following graph shows the proposed price of wholesale access to a 2 mbps ATM bandwidth.
Figure 7: Telkom’s wholesale model.
Figure 7 shows that Telkom is prepared to give the competing ISP’s wholesale access between their own networks and the ESR’s located on Telkom’s ATM network, but at a price of R 27 780 per 2 mbps line. It is not possible for the ISP’s to pay such a high access price, and therefore to date, no ISP has taken up this offer from Telkom.
It is interesting to note that a similar case12 has been decided by the UK authority Ofcom, during 2003. The particulars of that case are very similar to the South African situation. A number of telecommunications companies (Energis, Thus, Your Communications, mediaWays, Tiscali) complained that British Telecom (BT) was involved in a margin squeeze between BT’s wholesale broadband products and the ATM interconnection. Specifically the issue was around xDSL interconnection at the ATM switch.
12 Case Number: CW/00607/04/03
Telephone
Copper
Cable (1-5km)
Telkom Exchange
Computer DSL
Modem
DSLAM
ATM
ESR
ADSL USER
The IPC (IP Connect model)
ISP
ISP
MAIL SERVICE
INTERNET BANKING
A R599 pm B R 27 780 per 2M
VOICE
NETWORK
M

20
“The complainants alleged that BT’s pricing of its IPStream13 services was in breach of the ATM Direction, as it created a margin squeeze in relation to ATM interconnection services. The Director stated in the ATM Direction that BT should ensure, when setting its charges, that it does not operate a Margin Squeeze between its
own broadband products, such as IPStream, and the interconnection services it is
required to provide under the Direction” (2003:2) (own emphasis).
The rationale for the ATM Directive which describes the conditions for access has been described by Ofcom as: “The purpose of ensuring that a margin squeeze is avoided is to prevent BT from leveraging its upstream market power into downstream markets, which would frustrate the intention of the Director to facilitate greater downstream competition”. (2003:3)
Shortly after the ATM Direction was launched by Ofcom (then Oftel), they conducted a ‘Margin Squeeze test’ and found that the relative prices BT’s interconnect services passed the test. However, shortly after on 3 April 2003, BT announced several price cuts to its wholesale broadband products. These cuts were quite significant as shown by the following table:
Table 5 – BT’s price cuts – case no. CW/00607/04/03
Product Current monthly fee New monthly fee
IPStream Home 500 £14.75 £13.00
IPStream Office500 £40 £18
IPStream Office 1000 £60 £28
IPStream Office 2000 £80 £38
Source: Ofcom,2003:5
It is clear from the table that these were significant price reductions on the broadband products. Interesting is to note that BT did not announce any planned changes to its access prices (the ATM interconnection services). Therefore this created a margin squeeze: “Given that on average the monthly charge per end user for ATM interconnection was approximately £11.25 for Home 500 this reduced the margin for competitors from £3.50 per month to between £1.49 and £1.75 depending on the level of discount.” (2003:5).
13 IPStream is a wholesale Asymmetric Digital Subscriber Line (“ADSL”) broadband product that BT sells to Internet Service Providers (“ISPs”) and corporate customers. It conveys Internet traffic from an end user across BT's networks to a point where it can be picked up by an ISP for onward conveyance to the wider Internet. ISPs then bundle the whole package for sale to retail consumers.

21
Ofcom conducted another margin squeeze test. Some of BT’s products failed the test and others passed the test. BT then settled the issue with Ofcom by reducing some of the access prices and increasing some of the retail prices.
According to the ATM Direction, “a Margin Squeeze will arise if IPStream revenues are less than the sum of ATM interconnection charges plus any additional costs which are necessary to create an IPStream service”. It is however, not straightforward to calculate these costs, as the costs are not publicly known. The only body that would be capable of calculation Telkom’s costs and conducting a margin squeeze test would be ICASA. The following diagram gives a valuable overview of the process that was followed by Ofcom in the margin squeeze case against BT.
Figure 8: Ofcom’s margin squeeze test
Source: Ofcom, 2003:15
In order to ensure that ADSL service charges are reduced, that access prices are not excessive and that there does not occur a margin squeeze, Telkom’s costs for the access portion will have to be investigated by ICASA to ensure that the access charges represent Telkom’s actual costs in providing the access portion.

22
4.2.3 ACCESS TO AN ESSENTIAL FACILITY
Section 8(b) of the Competition Act (no 89 of 1998) states that: “It is prohibited for a dominant firm to - (b) refuse to give a competitor access to an essential facility when it is economically
feasible to do so;” An ‘essential facility’ is defined in the Act as: “an infrastructure or resource that cannot reasonably be duplicated, and without access to which competitors cannot reasonably provide goods or services to their customers”. From an economic perspective the issue here is with the control of an essential facility by a dominant firm. This strengthens the position of market power and contributes to high prices. In the context of utility and regulated markets, the inability of a competitor seeking access to practically or reasonably duplicate the essential facility, are important considerations. An essential facility can be: “a product such as a raw material, or a service, including access to a place such as a harbour or a distribution network such as a telecommunication network”.14 The concept of essential facilities is important to the application of competition law in the telecommunications sector. In the sector, an essential facility is generally defined as one which has the following characteristics:
• It is supplied on a monopoly basis or is subject to some degree of monopoly control
• It is required by competitors (e.g. interconnecting operators) in order to compete
• It cannot be practically duplicated by competitors for technical or economic reasons.
The World Trade Organisation (WTO) defines an essential facility as: “Essential facilities mean facilities of a public telecommunications transport network or service that:
• are exclusively or predominately provided by a single or limited number of suppliers;
• cannot feasibly be economically or technically substituted in order to provide a service”
A telecommunications operator that controls an essential facility often has both the incentive and the means to limit access to the facility by competitors. It becomes a matter of public interest to ensure that essential facilities are available to competitors on reasonable terms. Without such access, competition will suffer, and the sector will operate less efficiently than it could. According to the EU guidelines: “If there were no commercially feasible alternatives to the access being requested, then unless access is granted, the party requesting access would not be able to operate in the service market. Refusal in this case would therefore
14 Competition News.(2002). “Essential Facilities Doctrine”. Edition 9,p.9.

23
limit the development of new markets, or new products on those markets, contrary to Article 86(b), or impede the development of competition on existing markets. A refusal having these effects is likely to have abusive effects” (EU,1998:15). It seems form the evidence above (specifically the ADSL example), that Telkom is not providing access to an essential facility at reasonable costs and this impedes the ability of competitors to compete in this market, as well as new firms to enter this market. 4.2.4 EXCLUSIONARY ACTS Under the South African Competition Act (act 89 of 1998), it is unlawful for a dominant firm to engage in exclusionary acts (8(c)). An ‘exclusionary act’ is defined in the Act as: “an act that impedes or prevents a firm entering into, or expanding within, a market”. Examples of ‘exclusionary acts’ listed in the Act under (8(d)), that might be relevant here are e.g. (8(d)(i) ‘requiring or inducing a supplier or customer not to deal with a competitor’; (8(d)(iv) ‘selling goods or services below their marginal or average variable cost (predatory pricing), There is a possible efficiency trade-off for these exclusionary acts: “if the anti-competitive effect of the act outweighs its technological, efficiency or other pro-competitive gain”. In general, abusive behaviour may be found where a firm in a dominant position strengthens that position to an extent that “substantially obstructs” the competitive ability of competitor undertakings in the relevant market. Within this context, where an undertaking occupies a dominant position, and where that dominant position has already weakened the competitive structure of the relevant market, any additional weakening of the competitive structure on that market may constitute an abuse of a dominant position. Specific abuses that are illustrated in ECJ case law include: “tying purchasers to an exclusive distributor, predatory pricing, discriminatory prices, restrictive contract clauses enforced by a dominant competitor, and conditional discounts.” “Some incumbent TOs (telecommunications operators) may be tempted to resist providing access to third party service providers or other network operators, particularly in areas where the proposed service will be in competition with the service provided by the TO itself. This resistance will often manifest itself as unjustified delay in giving access, a reluctance to allow access or a willingness to allow it only under disadvantageous conditions. It is the role of the competition rules to ensure that these prospective access markets are allowed to develop, and that incumbent TOs are not permitted to use their control over access to stifle developments on the service markets (EU,1998:10)”.

24
4.2.5 PRICE DISCRIMINATION AND CROSS SUBSIDISATION
Price discrimination is defined as selling the same good at different prices, adjusted for differences in cost. All forms of price discrimination are not prohibited per se. It is only illegal if it is likely to substantially prevent or lessen competition. Section 9(2) of the Competition Act states that: “Despite subsection (1), conduct involving differential treatment of purchasers in terms of any matter listed in paragraph (c) of that subsection is not prohibited price discrimination if the dominant firm establishes that the differential treatment-
(a) makes only reasonable allowance for differences in cost or likely cost of manufacture, distribution, sale, promotion or delivery resulting from the differing places to which, methods by which, or quantities in which goods or services are supplied to different purchasers”.
In the EU this principle is well-established: “Article 7 of the Interconnection Directive provides that different tariffs, terms and conditions for interconnection may be set for different categories of organizations which are authorized to provide networks and services, where such differences can be objectively justified on the basis of the type of interconnection provided and / or the relevant national licensing conditions”.15 The technical definition of cross-subsidisation is to transfer value from one business to another. It usually occurs when a firm uses profits it makes in one sector to support low prices in other markets where it faces more competition. Although competition law does not explicitly forbid cross-subsidisation, where a company is dominant the practice of cross-subsidisation is problematic as it may lead to abusive practices such as predatory pricing and selective price cutting. The problem in SA is that different rates are charged to Telkom’s own internet provider and its competitors (price discrimination). This can not be justified on the basis of differences in costs. As stated by the EU, equal access on equal terms should be given to all competitors: “In general terms, the dominant company’s duty is to provide access in such a way that the goods and services offered to downstream companies are available on terms no less favourable than those given to other parties, including its own corresponding downstream operations (EU,1998:15)”16. There have been numerous cases of price discrimination and cross-subsidisation against British Telecom (BT). “In 1996, Oftel found that BT was unfairly cross-subsidising parts of its value-added services business, BT Managed Networks Services (‘BTMNS’). The direction issued by Oftel required BT to achieve specified rates of return targets over the anticipated life of the activity or the contract (if a long-term contract). In addition, BT
15 European Commission (1998). Notice on the application of the competition rules to access agreements in the telecommunications sector. 16 EU (1998). “Notice on the application of the competition rules to access agreements in the telecommunications sector. Framework, relevant markets and principles”. (98/C 265/02).

25
was to comply with subsidy tests for relevant parts of its value-added services business by providing details of charges paid by the value-added service business to other parts of BT. In 1997 in a further case relating to BT (and its new internet businesses), Oftel said that a two stage test should be used to work out whether unfair cross-subsidisation is taking place:
a) a financial analysis should be carried out to determine whether each area of a company’s business plan is reasonable on a stand alone basis; and
b) a competition analysis should be undertaken to determine whether cross-subsidisation should be viewed as anti-competitive on the relevant market” (Martineau Johnson, Utilities Brief, May 2004).
Ofcom (Oftel’s successor) has also spelled out remedies for uncompetitive access markets in their 2004 ‘Review of the wholesale local access market’: “Given its position of SMP, Ofcom proposes to impose the following SMP service conditions on BT in the wholesale local access market…:
• requirement to provide Network Access on reasonable request;
• requirement not to unduly discriminate;
• basis of charges (i.e. cost orientation);
• requirement to publish a reference offer;
• requirement to notify charges and terms and conditions;
• requirement to notify technical information;
• quality of service; and
• requests for Network Access” (Oftel, 2004:4)
4.2.6 THE VANS COMPLAINT During May 2002, a complaint was filed by more than 20 VANS providers against Telkom. There are a number of service providers who participate in the VANS market. They provide a variety of services that broadly fall within the definition of Value Added Network services (VANS). These services will vary according to the nature of the business conducted by each participant but will generally include access to the Internet, e-mail services, managed data network services, security services and the establishment of virtual private networks (‘VPN’). The largest sub-sector here is web hosting services (BMI-T,2004). The main first tier providers in South Africa are Telkom, Internet Solutions (IS) and UUnet. A first tier provider is someone who access international Internet traffic and provide connectivity to the South African user to the Internet throughout the world. A first tier provider can either provide services directly to a customer or alternatively, to another Internet service provider (thereby establishing the second tier in the supply chain). Similarly, the second tier provider is entitled to service end customers or what would be termed the third tier service providers.

26
The following diagram illustrates the structure of the broad VANS market: Figure 9 – Market structure Source: IS, 2005. The diagram illustrates the need for connectivity between the various tiers. In the first tier there is a need for an international connection for the first tier participants to connect to the infrastructure of their international counterparts. Telkom provides the necessary infrastructure. IS and UUnet therefore has no other choice but to buy connectivity from Telkom. Telkom is part owner of the fiber cable (known as SAT-3) which provides this connection. In the case of connection within each tier (i.e. between all the market participants in all successive tiers), Telkom is the sole provider of the infrastructure necessary to facilitate the connection. The connection between tiers is once again provided by Telkom’s telecommunications infrastructure and routed at various peering points established throughout South Africa. The 2002 VANS complaint has been recommended by the Competition Commission to the Competition Tribunal, and this process has not been completed. Mainly, the VANS companies complained that Telkom is abusing its dominance in the upstream market by
� ‘refusing to provide backbone and access facilities to certain VANS providers to construct their VANS networks unless they provide confirmations to Telkom that they would use the facilities in accordance with Telkom’s interpretation of the Telecommunications Act,’
� ‘refusing to lease access facilities to VANS providers directly and insisting on VANS providers acting as agents of their customers in leasing access facilities from it;’
T H E IN T E R N E T
1 s t t ie r pa rt ic ipa n tIN T E R N E T S O LU T IO N S
1 s t tie r pa r tic ip an tU une t
1 s t t ie r pa rt ic ip an tT E LK O M
C us tom e r 2 nd tie r p a r tic ip an t C u s tom e r 2 nd tie r p a r tic ip an t C us tom e r 2 nd t ie r pa rtic ip an t
C u s tom e r 3 rd t ie r pa rt icp an t C us tom e r 3 rd t ie r pa rt ic ipa n t C us tom e r 3 rd t ie r p a r t ic ipa n t

27
� ‘charging more for telecommunication facilities, which connect to the networks of other VANS providers, than it charges for the same access facilities, which connect to its own competitive VANS networks;
� charging other VANS providers and / or their customers for two sets of end connections (which consist of network terminating units (‘NTUS’), local leads and Diginet Ports) for a Diginet circuit whilst it charges its customers for one set only;’etc.
5. THE EFFECT ON COMPETITION
Telkom’s abuse of its dominance in the market for telecommunication services, and more specifically in the relevant access market, is having a negative effect on overall competition levels. Firstly, there is an immediate adverse effect on competitors, who can not compete with Telkom, because of the excessive prices that Telkom charge for access. This is an exclusionary act and will lead to a strengthening of Telkom’s dominant position. Secondly, although consumers might experience a short term gain because of lower prices, the long term effect on consumers will be negative. Telkom’s abusive behaviour will force its competitors out of the market and ultimately consumers will have fewer choices and will pay higher prices. 6. THE MOBILE MARKET The mobile phone market is a textbook example of what is termed a ‘network’ industry. Network industries are a large part of the world economy, and these industries often provide necessities which often necessitates regulation to guarantee optimal supply (Economides,2004). Many network industries exhibit increasing returns to scale in production, i.e. unit or average cost decreases significantly with the scale of production. Incremental cost (adding another user) is often negligible. Networks are composed of complementary nodes and links. Network effects are as a result of these complementarities. This refers e.g. to the benefit a subscriber of a certain network receives when the scale of the operation is enlarged and he can reach more subscribers in the larger network. Where the average cost curve in a traditional market declines over time and reaches a point where it starts to rise again, in network industries the average cost might be declining over a very long period as network effects are realized. The initial capital costs are very high, but will be retrieved over time. High initial costs in the mobile industry often mean that firms only become profitable after 6-8 years. The following graph shows the percentage of MTN’s Nett debt to EBITDA (Earnings before interest, taxes, depreciation and amortization) between 2000-2005. Figure 10 – MTN : Nett Debt (includes cash) to EBITDA (2000-2005)

28
MTN - Net Debt to EBITDA
-40%
-20%
0%
20%
40%
60%
80%
100%
120%
140%
2000 2001 2002 2003 2004 2005
Source: MTN 2005 annual report EBITDA is a good indicator of profitability and the graph above shows that until 2003/2004, MTN’s net nett debt to EBITDA was positive, indicating that a long period is needed before companies in this industry becomes profitable. It is only in 2004 that MTN became debt free (nett debt became negative). This graph illustrates the high barriers to entry, apart from regulatory requirements. The cellular market is therefore a typical market which is open to the abuse of market power.
6.1 SA MARKET STRUCTURE – OLIGOPOLY / DUOPOLY
It will be argued in this section that the South African mobile market can be classified as an oligopoly, or even a duopoly, with two firms, Vodacom and MTN of more or less the same size dominating the market. It will also be shown that they have market power in the cellular market. Both Vodacom and MTN have market shares that exceed 35%. There might even be a case of ‘joint dominance’, which will be discussed below. It is important to note that the combined market shares of the two large players are more than 90% which should be an indication of their collective market power. Where two large companies control a market (duopoly) and they have similar cost and pricing strategies, competition levels may not be optimal. Cell C entered the market in 2001 and has managed to grow its market share to around 10%. However, a recent report by ICASA on mobile pricing (July 2005) stated

29
that Cell C’s entry has not led to a reduction in mobile tariffs, as might be expected with more competition. Companies in the cellular sector are interdependent as they have structural links with each other in the form of cooperation agreements, such as termination of voice and data traffic and roaming relationships. This type of interdependence is a well-known characteristic of oligopoly (and duopoly) markets. An oligopolistic market is more likely to have a structure which is conducive to coordinated effects, because firms are likely to become aware of their common interests and to anticipate one another’s behaviour. Interdependence among the competing firms in an oligopoly (or a duopoly) can give rise to coordinated effects. The highly concentrated structure of the SA mobile market and the structural links (agreements) between the companies, do create a tendency for coordinated effects in this market. The following points will give greater detail about the particular characteristics of the market and will help to assess whether these are conducive to producing coordinated effects and to raise barriers to entry. It will be argued that the duopoly nature of the market can facilitate coordination, even if not explicit, with the effect of selling at above competitive prices. If there is no other (fringe) competitor or potential competitor, the large firms will continue to sell at uncompetitive price levels and will not be forced to be innovative. The factors below will be examined primarily on evidence available from the retail mobile voice telephony market in SA. The following are characteristics of an oligopoly market that can indicate that competition levels are not optimal:
• The degree of market concentration.
• Few firms in an oligopoly;
• The market shares of those firms are relatively symmetric;
• Actual and/ or potential market constraints;
• High barriers to entry;
• Lack of countervailing buying power; and
• Economies of scale and scope.
All these factors are evident in the South African mobile market. The market is highly concentrated, there are only three firms, the market shares of the two large firms are relatively symmetric and there are few potential market constraints.
A. The degree of market concentration.
There is a very high degree of market concentration, as there are only two firms that have a combined market share of more than 90%. The other participant (Cell C) has a market share of approximately 10%. A general indication of concentration is the Herfindahl-Hirschmann index17. The HHI for the mobile market in SA, based on market share
17 The HHI is the sum of market shares squared. A market with only one competitor will have a score of 10 000 and a more competitive market will have a lower score (less than 1 000).

30
figures for turnover is 4 412. This market is therefore highly concentrated (well above the benchmark 1 800 indicating high concentration). Figure 11 illustrates the high concentration levels in the cellular market in SA. Figure 11- HHI concentration indices
HHI index
10000
6791
6215 6177
5644
50424855
4412
3958 3907 37733404 3338 3322
27562488 2482
0
2000
4000
6000
8000
10000
12000
Moz
ambiqu
e
Saud
i Arabia
Mex
ico
Zambia
Botswan
a
Egyp
t
Nigeria
South Af
rica
Spain
Fran
ceIta
ly
Zimba
bwe
Poland
German
y
Chile U
K
Malay
sia
HHI index
Source: Yankee group (2003:74); and own calculations for SA.
B. The incentive to coordinate Typically, firms in an oligopolistic market have a strong incentive to coordinate their behaviour and maximize joint profits, rather than to pursue their own interests at lower profit levels. This incentive is even stronger when there are barriers to entry, and this is especially true in the mobile industry where initial capital costs are very high. Incentives for coordination are stronger when there are
• Few firms in an oligopoly; and
• The market shares of those firms are relatively symmetric. Both these conditions are met in the SA mobile market, where there are only three firms,
and the market shares of the two large firms are very close to each other (approximately

31
55% and 35% respectively for Vodacom and MTN). As entry is controlled by regulation, entry in the short term is not possible. The effect of potential entry is therefore negligible. The incentive to coordinate is also stronger when there are regular interactions between the firms, such as the interconnection and roaming agreements, which are common to a network industry.
C. The ability to coordinate Even if the incentive to coordinate exists in an oligopoly market, the question remains whether firms have the ability to coordinate their behaviour in order to increase joint profits. The ability to coordinate will be stronger if products offered are similar and easily comparable. In the case of MTN and Vodacom, the product offerings are very similar and a minute airtime can be described as a homogenous product. There is a high degree of standardization in the mobile industry and all three players in the market offer a similar portfolio of products. It is not difficult for one mobile operator to know the prices of the other, as these are public tariffs which are published on the websites and subject to regulatory approval. Prices are therefore transparent.
D. Actual and/ or potential market constraints.
The most important disciplining factor in a market which is conducive to coordination, is actual or potential competitors. Even a smaller ‘fringe’ competitor can exert enough competitive pressure to change the behaviour of the larger firms in an oligopoly. The presence of a competitive fringe will, in theory, tend to limit the scope for coordination. A competitive fringe firm may not be able to eliminate market power of the larger firms completely, but it might be able to erode it to a certain degree. In the SA mobile market, entry is regulated and potential entry is therefore non-existent, at least for the short to medium term. However, Cell C entered the market in 2001 and has gained some market share since then. At the time of Cell C’s entry in 2001, it entered the market with a specific focus on the pre-paid sector, through competitive pricing and innovative products (e.g. per second billing on pre-paid). In the standard pre-paid category, Cell C’s tariffs were cheaper for all the products classes. However, when 2005 figures are examined, prices of all three operators seem to have converged in the pre-paid categories. In the business and high level categories, Cell C seems to be somewhat cheaper. It is difficult to draw general conclusions from the data. However, ICASA has stated in its 2005 report on Mobile Pricing that the entrance of Cell C has not lead to significant tariff reductions.
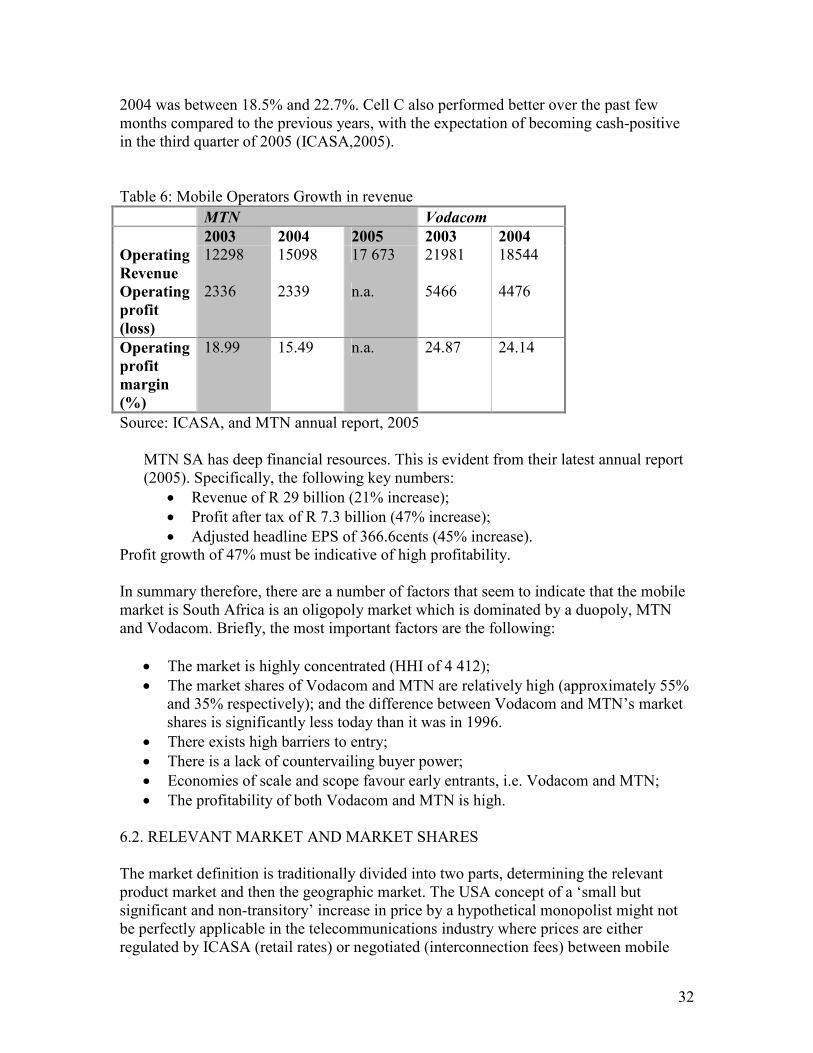
E. Profitability The two large cellular companies, Vodacom and MTN have a first-mover advantage and have become very profitable. The growth in revenue for Vodacom and MTN in 2003 and
32
2004 was between 18.5% and 22.7%. Cell C also performed better over the past few months compared to the previous years, with the expectation of becoming cash-positive in the third quarter of 2005 (ICASA,2005). Table 6: Mobile Operators Growth in revenue
MTN Vodacom
2003 2004 2005 2003 2004
Operating
Revenue
12298 15098 17 673 21981 18544
Operating
profit
(loss)
2336 2339 n.a. 5466 4476
Operating
profit
margin
(%)
18.99 15.49 n.a. 24.87 24.14
Source: ICASA, and MTN annual report, 2005 MTN SA has deep financial resources. This is evident from their latest annual report (2005). Specifically, the following key numbers:
• Revenue of R 29 billion (21% increase);
• Profit after tax of R 7.3 billion (47% increase);
• Adjusted headline EPS of 366.6cents (45% increase). Profit growth of 47% must be indicative of high profitability. In summary therefore, there are a number of factors that seem to indicate that the mobile market is South Africa is an oligopoly market which is dominated by a duopoly, MTN and Vodacom. Briefly, the most important factors are the following:
• The market is highly concentrated (HHI of 4 412);
• The market shares of Vodacom and MTN are relatively high (approximately 55% and 35% respectively); and the difference between Vodacom and MTN’s market shares is significantly less today than it was in 1996.
• There exists high barriers to entry;
• There is a lack of countervailing buyer power;
• Economies of scale and scope favour early entrants, i.e. Vodacom and MTN;
• The profitability of both Vodacom and MTN is high. 6.2. RELEVANT MARKET AND MARKET SHARES The market definition is traditionally divided into two parts, determining the relevant product market and then the geographic market. The USA concept of a ‘small but significant and non-transitory’ increase in price by a hypothetical monopolist might not be perfectly applicable in the telecommunications industry where prices are either regulated by ICASA (retail rates) or negotiated (interconnection fees) between mobile

33
operators. A more relevant test might be the one used by the EU (‘Commission Notice on the definition of the relevant market for the purposes of Community competition law’18), which states that: “A relevant product market comprises all those products and/or services which are regarded as interchangeable or substitutable by the consumer, by reason of the products’ characteristics, their prices and their intended use” (EU,1997:2). There are at least two types of relevant product markets to consider in the telecommunications sector; that of services provided to end users (services market) and that of access to facilities necessary to provide such services (access market)19. The services market can also be described as the retail market and the access market as the wholesale market. This second market becomes more important with liberalization20. 6.2.1 PRODUCT MARKET The retail mobile market is the service provided to end users and can be described as the mobile voice telephony services market. There are several reasons why the analysis is restricted to the market for mobile voice telephony. It would be incorrect to include fixed line services as:
• Mobile and fixed line services are fundamentally different. Mobile phones have the distinct functional advantage of portability;
• Prices for mobile telephony services are significantly higher than fixed line services (see graph below); and
• Competition authorities in both the US and EU have ruled that mobile and fixed line telephony services constitute two distinct markets.
The graph below shows average tariffs for mobile and fixed services in South Africa.
18 Available: [http://europa.eu.int/comm./competition/antitrust/relevma_en.htm] 19 This distinction is defined by the Commission of the European Communities Access Notice. 20 As noted by the EU Commission (Access Notice, 98/C 265/02): “Liberalisation of the telecommunications sector will lead to the emergence of a second type of market, that of access to facilities which are currently necessary to provide these liberalized services. Interconnection to the public switched telecommunications network would be a typical example of such access”.

34
Figure 12 – Comparison of fixed and mobile call charges21 (for calls of 60 sec).
R 0.00
R 0.50
R 1.00
R 1.50
R 2.00
R 2.50
R 3.00
R 3.50
R 4.00
Cell C MTN Vodacom Telkom (Pre-paid)
Cell C R 3.25 R 1.00 R 3.60 R 1.25 R 3.25 R 1.00
MTN R 3.30 R 1.02 R 3.60 R 1.26 R 3.30 R 1.02
Vodacom R 3.25 R 1.00 R 3.60 R 1.30 R 3.25 R 1.00
Telkom (Pre-paid) R 0.52 R 0.52 R 1.89 R 1.17 R 1.06 R 0.72
Peak Off-Peak Peak Off-Peak Peak Off-Peak
Calls to fixed lines (Telkom: local) Calls to cellular phones (on other mobile networks) Telkom long distance
. Source: ICASA, Telkom Figure 6 shows that there is a considerable difference in price between mobile and fixed line costs, for a 60 second call. The same has been found in the EU22: “As regards mobile communications, the Commission has found that, from a demand-side point of view, mobile services and fixed telephony services constitute separate markets”. According to ComReg (2004:18): “The difference in price between fixed and mobile retail services combined with the inability of other firms, such as fixed operators, to switch to providing mobile services indicate that mobile services are in a separate market to fixed services”. The conclusion is therefore that fixed line services can not be substituted for mobile services, because of the difference in the nature of the service to the consumer, but also because of the price difference. The relevant primary market is therefore the cellular services market.
21 Notes: In the graph above, pre-paid ‘per second’ plans were used (specifically, Cell C Easy chat per second, MTN pay as u go per second, and Vodacom 4U). Normal prices were used, and the billing increment is ‘per second (1/1)’ for mobile. All call charges include VAT. 22 European Commission (2001). “Proposed New Regulatory Framework for Electronic Communications Networks and Services”.

35
In South Africa, the growth in the pre-paid market has far outstripped growth in the contract market. The figure below shows that mainly people in the higher income groups (LSM 6-10) use post-paid cellular services. There might be a rationale for dividing the market between post-paid and pre-paid, but this distinction will depend on the facts of each case. Figure 13 – Prepaid vs contract categories
Cellular market base profile - AMPS
0%
6%
8%
13%14%
20%
10%9%
11%
9%
0%
5%
10%
15%
20%
25%
30%
35%
40%
45%
50%
LSM 1 LSM 2 LSM 3 LSM 4 LSM 5 LSM 6 LSM 7 LSM 8 LSM 9 LSM 10
Contract Pre-paid
Source: All Media Products Survey (AMPS) 6.2.2 ACCESS (WHOLESALE) MARKET
It is common in the literature to also consider the ability of the market participants to get access to the network of its counterparts. Interconnection to another network is a typical example of such an access market. In the EU Access Directive (2002:11)23, interconnection is defined as: “interconnection means the physical and logical linking of public communications networks used by the same or a different undertaking in order to allow the users of one undertaking to communicate with the users of the same or another undertaking”. The EU Access Directive defines several different ‘interconnection markets’, e.g.
1. call origination in the fixed public telephone network;
23 Directive 2002/19/EC of the European parliament and of the council on access to, and interconnection of, electronic communications networks and associated facilities, 7 March 2002.
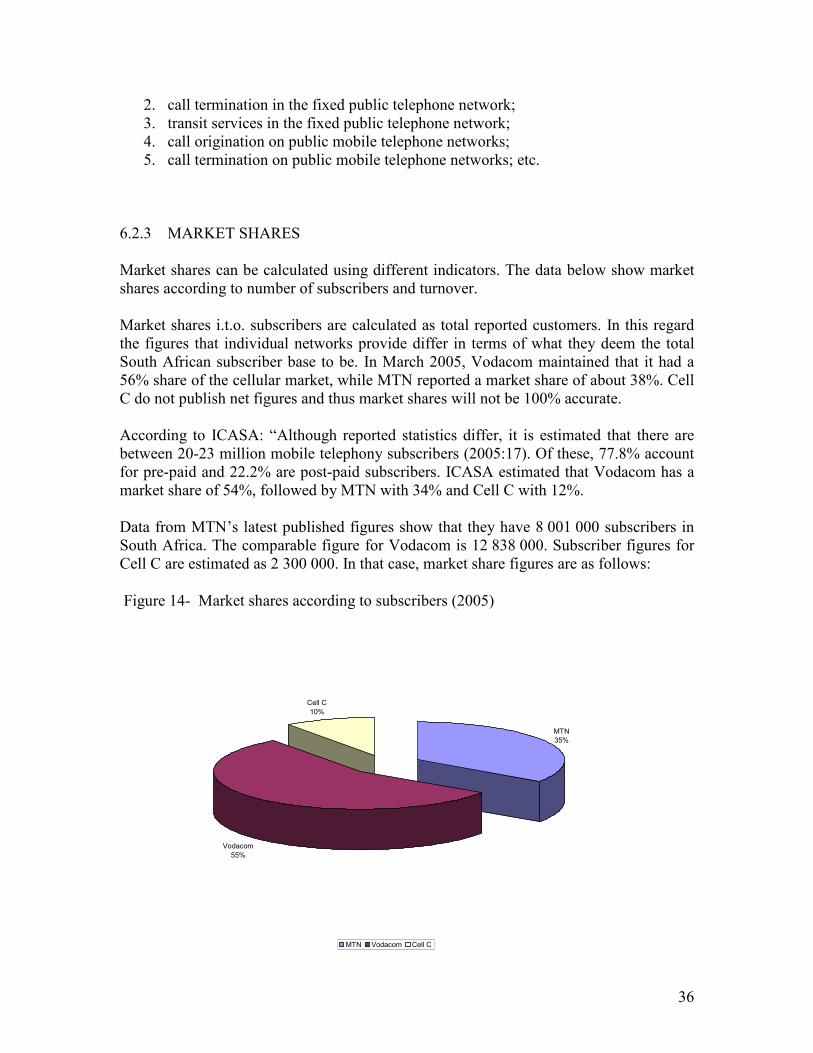
36
2. call termination in the fixed public telephone network; 3. transit services in the fixed public telephone network; 4. call origination on public mobile telephone networks; 5. call termination on public mobile telephone networks; etc.
6.2.3 MARKET SHARES Market shares can be calculated using different indicators. The data below show market shares according to number of subscribers and turnover. Market shares i.t.o. subscribers are calculated as total reported customers. In this regard the figures that individual networks provide differ in terms of what they deem the total South African subscriber base to be. In March 2005, Vodacom maintained that it had a 56% share of the cellular market, while MTN reported a market share of about 38%. Cell C do not publish net figures and thus market shares will not be 100% accurate. According to ICASA: “Although reported statistics differ, it is estimated that there are between 20-23 million mobile telephony subscribers (2005:17). Of these, 77.8% account for pre-paid and 22.2% are post-paid subscribers. ICASA estimated that Vodacom has a market share of 54%, followed by MTN with 34% and Cell C with 12%. Data from MTN’s latest published figures show that they have 8 001 000 subscribers in South Africa. The comparable figure for Vodacom is 12 838 000. Subscriber figures for Cell C are estimated as 2 300 000. In that case, market share figures are as follows:
Figure 14- Market shares according to subscribers (2005)
MTN35%
Vodacom
55%
Cell C
10%
MTN Vodacom Cell C

37
Source: Annual Reports, ICASA It must be noted that subscribers are probably not a perfect indicator as there is a large percentage of inactive subscribers in SA. In the case of Vodacom it was reported in 2003 that 18% of total subscribers were inactive (Yankee group). This is not unique to Vodacom. Market shares according to subscribers can therefore look different if calculated according to active subscribers. Nevertheless, it seems that MTN and Vodacom meet the Competition Act’s criteria for dominance (above 35%).
6.2.4 JOINT DOMINANCE AND EXCLUSIVITY
With joint shares of over 90%, it can also be argued that MTN and Vodacom have a jointly dominant position. In addition to their activities in the primary market they also have their own service providers in the downstream market. The Tribunal has expressed its concerns about exclusivity contracts enforced by specifically Vodacom and MTN. When Cell C was consulted in the merger case between Vodacom and GSM and Teljoy, they made the following statement: “The purchase of Service providers to facilitate vertical integration does not concern our client as much as the practice of limiting the number of distribution outlets through exclusivity agreements, either directly or through service providers or either of the operators. Both Vodacom and MTN appear to be engaging in these practices, which we believe are anti competitive, and warrant the attention of the Competition Commission.” This led the Tribunal to express its concerns about foreclosure in the retail market. They
concluded that the elimination of strategic outlets could raise rivals cost
considerably and inhibit entry into the market.24 6.3.PRICING Prices are transparent and products are very similar. The similarity in prices may be a function of the regulated nature of the mobile market, yet Cell C’s prices deviate from that of Vodacom and MTN in some instances. It would therefore seem that MTN and Vodacom can indeed act as a duopoly by tacitly coordinating prices to maximize joint profits. The ability to coordinate could potentially be less if consumers have considerable buyer power. In the mobile market, there seems to be insufficient countervailing buyer power. Most users are individuals and there does not seem to be any evidence that large customers (i.e. businesses) have been able to influence pricing structures to a significant degree.
24 Competition Tribunal :Case Number: 10/LM/Nov99 and Case Number: 13/LM/Nov99

38
According to a recent study by ICASA on Mobile pricing, (2005): “At a general level, the Authority is of the view that the overall picture pertaining to call rates in the country is not encouraging. The reality of the situation is that low-income consumers are subjected to much higher prices. Contract or post-paid users on the higher end tariff plans are charged lower rates in contrast to those who are on the lower end tariff plans…Instead of promoting seamless alignment to a cost-based model, the pricing models adopted by the operators, unfortunately widen the wedge that exists between pre-paid and post-paid users, aggravating the digital divide.”
It is clear that ICASA believes that the cellular firms are not using a cost-based pricing model. The firms must therefore have some pricing power, even in a regulated market. The entrance of Cell C did not lead to lower general price levels. This is clearly illustrated by the graphs below. When prices for pre-paid standard plans are compared, then it can be seen that in 2001 when Cell C entered the market, they were cheaper in all categories, compared to Vodacom and MTN. However, when 2005 prices are examined, it seems that prices have more or less converged. Figure 15 – Pre-paid standard plans (2001)
PRE-PAID STANDARD PLANS (2001)
R 0.00
R 0.50
R 1.00
R 1.50
R 2.00
R 2.50
R 3.00
PEAK OFF-PEAK PEAK OFF-PEAK PEAK OFF-PEAK
ON-NET CALLS (/Telkom Local) CALLS TO OTHER MOBILE CALLS TO FIXED LINE
Cell C MTN Vodacom

39
Figure 16 – Pre-paid standard plans (2005)
PRE-PAID STANDARD PLANS (2005)
R 0.00
R 0.50
R 1.00
R 1.50
R 2.00
R 2.50
R 3.00
PEAK OFF-PEAK PEAK OFF-PEAK PEAK OFF-PEAK
ON-NET CALLS (/Telkom Local) CALLS TO OTHER MOBILE CALLS TO FIXED LINE
Cell C MTN Vodacom
The graphs below show the current stability in prices and the similarity in the portfolio of products for MTN, Vodacom and Cell C. Current tariffs were used to show that Vodacom and MTN often have the same prices, especially in the category ‘calls to other mobiles’. There is some variation in the ‘entry level’ contracts, but Vodacom and MTN’s prices are exactly the same for both peak and off-peak times in the ‘entry business type’ and ‘high level’ contracts. In the latter two contract types, Cell C is always priced just below Vodacom and MTN.

40
Figure 17: Contract tariffs
ENTRY BUSINESS TYPE CONTRACT (2005)
R 0.00
R 0.50
R 1.00
R 1.50
R 2.00
R 2.50
PEAK OFF-PEAK PEAK OFF-PEAK PEAK OFF-PEAK
ON-NET CALLS (/Telkom Local) CALLS TO OTHER MOBILE CALLS TO FIXED LINE
Cell C MTN Vodacom
Figure 18: Contract tariffs
HIGH LEVEL CONTRACTS (2005)
R 0.00
R 0.20
R 0.40
R 0.60
R 0.80
R 1.00
R 1.20
R 1.40
R 1.60
R 1.80
R 2.00
PEAK OFF-PEAK PEAK OFF-PEAK PEAK OFF-PEAK
ON-NET CALLS (/Telkom Local) CALLS TO OTHER MOBILE CALLS TO FIXED LINE
Cell C MTN Vodacom

41
It would seem therefore that prices are very closely monitored and coordinated in the mobile sector. This has been the subject of numerous reports and it was reported recently in the press that both Vodacom and MTN will reduce some of their off-peak and pre-paid rates. 7. CONCLUSIONS It was argued in this report that the telecommunications sector is a typical network industry and there is a strong rationale for regulation. The relevant concepts in the SA Competition Act, e.g. market power, dominance, exclusionary acts, etc were used to analyse both the fixed line and mobile markets in SA. In the fixed line market, it was shown that Telkom has a dominant position in the upstream market, as the sole supplier of the fixed line network and the only holder currently of a PSTN licence. Telkom is however, also active in the downstream markets and is therefore vertically integrated into the broad VANS market. This has the potential of foreclosure and raising rival’s costs. It was argued here by using the ADSL example, that Telkom is engaged in a margin squeeze or raising rivals’ costs strategy. The VANS complaint also confirms this notion. The mobile market was analysed by looking at market shares, concentration indices, ability to collude, etc. It was show that this market is dominated by a strong duopoly between Vodacom and MTN and that there might even be a case for joint dominance. The market power in the sector is reflected in stable and generally high mobile tariffs. 8. BIBLIOGRAPHY
• BMI-T (2004). “SA Internet Services Market 2003-2008”
• Church,J. & Ware,R. (1999). “Vertical Integration and Vertical restraints”, Chapter 22, Industrial Organisation. McGraw Hill.
• Commission for Communications Regulation.(2004) “Market analysis – wholesale mobile access and call origination”. Available: [www.comreg.ie].
• Competition News.(2002). “Essential Facilities Doctrine”. Edition 9,p.9.
• Economides,N. (2004). “Competition Policy in Network Industries: an Introduction”. Working paper no. 04-23, Stern School of Business, NY University. Available: [www.NETinst.org].
• EU (1998). “Notice on the application of the competition rules on access agreements in the telecommunications sector – Framework, Relevant Markets and Principles”. (98/C 265/02).
• EU (2000). “Proposal for a directive of the European Parliament and of the council on access to, and interconnection of, electronic communications networks and associated facilities”. Brussels, 12 July, COM(2000) 384.
• EU (2002). “Directive 2002/21/EC of the European Parliament and of the council of 7 March 2002 on a common regulatory framework for electronic communications networks and services (Framework Directive).

42
• EU (2002). “Directive 2002/19/EC of the European Parliament and of the council of 7 March 2002 on access to, and interconnection of, electronic communications networks and associated facilities (Access Directive).
• Genesis Analytics (2005). “Telecommunications prices in South Africa – an international peer group comparison”.
• Geradien,D. & O’Donoghue,R. (2005). “The concurrent application of Competition Law and Regulation: the Case of Marin Squeeze Abuses in the Telecommunications Sector. GCLC Working Paper 04/05.
• Hodge,J. (2004). “Universal service trough roll-out targets and licence conditions: lessons from Telecommunications in South Africa”.
• Hodge,J. (1999). “The state of the telecommunications industry in South Africa and the potential costs/ benefits of liberalization”. TIPS annual forum.
• Hodge,J. (2003). “Extending telecoms ownership in South Africa: Policy, Performance and Future options”. TIPS Working Paper, 7-2003.
• ICASA (2005). “Findings document i.t.o. section 27 of the Telecommunications Act (no. 103 of 1996) on the enquiry into the provision of ADSL service”. Government Gazette, vol, 481, no. 27844, 27 July.
• ICASA (2005). “Discussion Document: Mobile Prices”. Government Gazette, vol. 481, no. 27854, 28 July.
• ICT Industry and Markets. “Market power and dominance”. Available: [http://cbdd.wsu.edu/edev/Nigeria_ToT/tr503/page46.htm
• ISPA (1996) “Submission to the Competition Board”. Available: [http://web.archive.org/web/20000416120239/http://www.ispa.org.za/submission.html
• Mochiko, T (2005). “Cellphone operators slash tariffs”. Business Report, Monday, 5 September, p.17
• MTN (2005). Annual Report.
• Ofcom (2004). “Review of the wholesale local access market”. 26 August.
• Wik-Consult (2003). “Methodologies for market definition and market analysis”. Final Report, 23 July.
• Yankee Group (2003). “South African Communications 2002-2008: Market review and Analysis”. Prepared for the Department of Communications, 11 December.