Echo and the Recovery of the Past in R. Murray Schafer’s ...
Upload
joy-dickersonCategory
view
214download
1
The Long Road to Recovery
Matthew N. Murray, Ph.D.
July 1, 2009

July 2009 Matthew N. Murray, Center for Business and Economic Research, The University of Tennessee, Knoxville 2
Deep Recession-Years to Regain Lost Ground
-Recession will be the longest since the Great Depression
-Mixed signals now emerging, indication of a possible bottom to current cycle
-Recession might be deemed over in 3rd or 4th quarter
-Very strong growth rates may then take place because economic activity is at such depressed levels
-But levels of economic activity will not be restored for several years—jobs, home starts, car sales, tax revenue

July 2009 Matthew N. Murray, Center for Business and Economic Research, The University of Tennessee, Knoxville 3
Source: IHS Global Insight, Inc.
Real GDP: 2005 to 2012
10,000
10,500
11,000
11,500
12,000
12,500
13,000
05.1 06.1 07.1 08.1 09.1 10.1 11.1 12.1
-5.0
-4.0
-3.0
-2.0
-1.0
0.0
1.0
2.0
3.0
4.0
5.0
Real GDP
Growth
Leve
l, bill
ions
of c
hain
ed 2
000 d
olla
rs
Perce
nta
ge ch
ange, sa
me q
uarte
r last ye
ar

July 2009 Matthew N. Murray, Center for Business and Economic Research, The University of Tennessee, Knoxville 4
U.S. Residential Fixed Investment and Nonresidential Fixed Investment in Equipment & Software and
Structures: 2005 to 2012
-50.0
-40.0
-30.0
-20.0
-10.0
0.0
10.0
20.0
30.0
40.0
2005.1 2006.1 2007.1 2008.1 2009.1 2010.1 2011.1 2012.1
Equip & SoftwareStructuresResidential
Perc
enta
ge c
hange, a
nnual r
ate
Source: IHS Global Insight, Inc.

July 2009 Matthew N. Murray, Center for Business and Economic Research, The University of Tennessee, Knoxville 5
Housing Starts and Light Vehicle Sales:2005 to 20012
0.0
0.5
1.0
1.5
2.0
2.5
2005.1 2006.1 2007.1 2008.1 2009.1 2010.1 2011.1 2012.1
0.0
2.0
4.0
6.0
8.0
10.0
12.0
14.0
16.0
18.0
20.0Housing StartsLight Vehicle Sales
Housi
ng S
tarts
Lig
ht V
ehicle
Sale
s
Source: IHS Global Insight, Inc.
(millions, annual rate)

July 2009 Matthew N. Murray, Center for Business and Economic Research, The University of Tennessee, Knoxville 6
Tennessee Building Permits:Jan-2005 to May-2009
0
500
1,000
1,500
2,000
2,500
3,000
3,500
4,000
4,500
5,000
Jan-05
May-05
Sep-05
Jan-06
May-06
Sep-06
Jan-07
May-07
Sep-07
Jan-08
May-08
Sep-08
Jan-09
May-09
TotalSingle-family
Num
ber
of u
nits
Source: U.S. Census Bureau, Building Permits Survey (as reported in the State of the Cities Data System [SOCDS] database).

July 2009 Matthew N. Murray, Center for Business and Economic Research, The University of Tennessee, Knoxville 7
FHFA Housing Price Index: 2005 to 2012
-15.0
-10.0
-5.0
0.0
5.0
10.0
15.0
2005.1 2006.1 2007.1 2008.1 2009.1 2010.1 2011.1 2012.1
Perc
ent c
hange, s
am
e q
tr la
st y
r
Source: IHS Global Insight, Inc.

July 2009 Matthew N. Murray, Center for Business and Economic Research, The University of Tennessee, Knoxville 8
$561 Billion Stimulus Injection2009–2010
Corporate tax cuts15.7%
Personal sector tax cuts
25.6%
Infrastructure & other spending
14.7%
Targeted transfer payments to
personal sector17.4%
Transfers to states26.7%
►2009 0.8 percentage pts
►2010 1.3 percentage pts
Boost to GDP
Source: IHS Global Insight, Inc.

July 2009 Matthew N. Murray, Center for Business and Economic Research, The University of Tennessee, Knoxville 9
Source: Bureau of Labor Statistics.
U.S. Payroll Employment: Jan-08 to May-09
-800.0
-700.0
-600.0
-500.0
-400.0
-300.0
-200.0
-100.0
0.0
Jan-08 May-08 Sep-08 Jan-09 May-09
M
onth
ly c
hange (th
ousa
nds)
(seasonally adjusted)
July 2009 Matthew N. Murray, Center for Business and Economic Research, The University of Tennessee, Knoxville 10
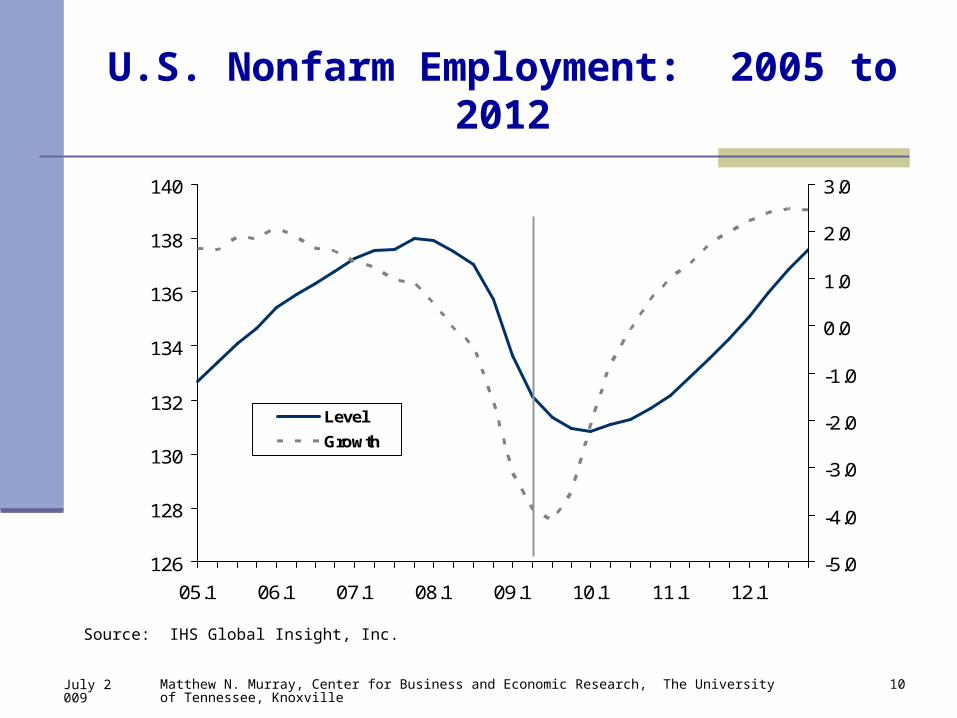
Source: IHS Global Insight, Inc.
U.S. Nonfarm Employment: 2005 to 2012
126
128
130
132
134
136
138
140
05.1 06.1 07.1 08.1 09.1 10.1 11.1 12.1
-5.0
-4.0
-3.0
-2.0
-1.0
0.0
1.0
2.0
3.0
Level
GrowthEm
plo
yment (
mill
ions)
Perce
nta
ge ch
ange, sa
me q
uarte
r last ye
ar

July 2009 Matthew N. Murray, Center for Business and Economic Research, The University of Tennessee, Knoxville 11
Source: Bureau of Labor Statistics.
TN Nonfarm Employment: Jan-08 to May-09
-20.0
-15.0
-10.0
-5.0
0.0
5.0
Jan-08 May-08 Sep-08 Jan-09 May-09
M
onth
ly c
hange (th
ousa
nds)
(seasonally adjusted)

July 2009 Matthew N. Murray, Center for Business and Economic Research, The University of Tennessee, Knoxville 12
2500.0
2550.0
2600.0
2650.0
2700.0
2750.0
2800.0
2850.0
2006.1 2007.1 2008.1 2009.1 2010.1 2011.1
-6.0
-5.0
-4.0
-3.0
-2.0
-1.0
0.0
1.0
2.0
3.0
LevelGrowth
Em
ploy
men
t (t
hous
ands
)
Percentage change, sam
e quarter last year
Source: Bureau of Labor Statistics; IHS Global Insight, Inc.; and CBER-UT.
(seasonally adjusted)
Tennessee Nonfarm Employment:2006 to 2011

July 2009 Matthew N. Murray, Center for Business and Economic Research, The University of Tennessee, Knoxville 13
Less than 9.0%9.0% to 11.9%
Note: County data are not seasonally adjusted.
Source: Tennessee Department of Labor and Workforce Development.
12.0% to 14.9%15.0% to 17.9%
Unemployment Rate, May 2009
18.0% to 20.9%21.0% or higher
Tennessee 10.7%United States 9.4%
July 2009 Matthew N. Murray, Center for Business and Economic Research, The University of Tennessee, Knoxville 14
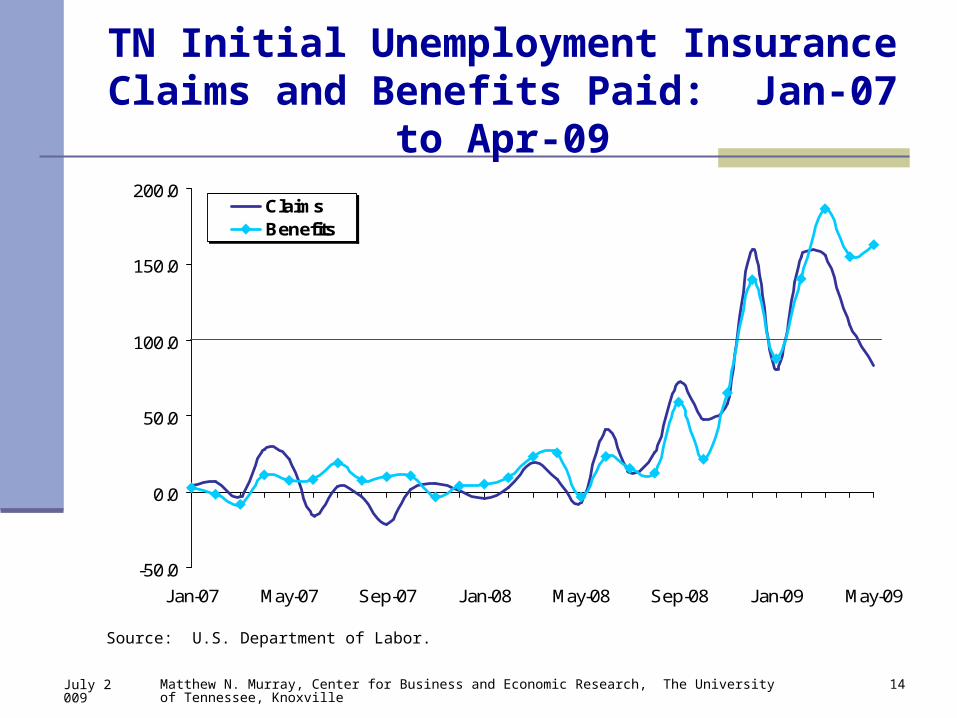
TN Initial Unemployment Insurance Claims and Benefits Paid: Jan-07 to Apr-09
-50.0
0.0
50.0
100.0
150.0
200.0
Jan-07 May-07 Sep-07 Jan-08 May-08 Sep-08 Jan-09 May-09
ClaimsBenefits
Per
cent
age
chan
ge, sa
me
mon
th la
st y
ear
Source: U.S. Department of Labor.

July 2009 Matthew N. Murray, Center for Business and Economic Research, The University of Tennessee, Knoxville 15
Year-Over-Year Change in Real Major Taxes:2004.1 to 2008.4
-4.0
-2.0
0.0
2.0
4.0
6.0
8.0
10.0
12.0
2004.1 2005.1 2006.1 2007.1 2008.1
Personal Income
General Sales
Property
4-q
tr a
vg o
f % c
hg
in r
ea
l ta
x re
ven
ue
Source: U.S. Census and Bureau of Economic Analysis.

July 2009 Matthew N. Murray, Center for Business and Economic Research, The University of Tennessee, Knoxville 16
TN Tax Collections, Total and Sales & Use:Jan-07 to Apr-09
-15.0
-10.0
-5.0
0.0
5.0
10.0
15.0
20.0
Jan-07 May-07 Sep-07 Jan-08 May-08 Sep-08 Jan-09 May-09
TotalSales & Use
Per
cent
age
chan
ge, sa
me
mon
th la
st y
ear
Source: Tennessee Department of Revenue, Revenue Collections, monthly.

July 2009 Matthew N. Murray, Center for Business and Economic Research, The University of Tennessee, Knoxville 17
TN Realty Transfer & Mortgage Tax Collections: Jan-05 to May-09
-50.0
-40.0
-30.0
-20.0
-10.0
0.0
10.0
20.0
30.0
40.0
50.0
Jan-05
May-05
Sep-05
Jan-06
May-06
Sep-06
Jan-07
May-07
Sep-07
Jan-08
May-08
Sep-08
Jan-09
May-09
Perc
enta
ge c
hange, s
am
e m
onth
last
year
Source: Tennessee Department of Revenue, Revenue Collections, monthly.

July 2009 Matthew N. Murray, Center for Business and Economic Research, The University of Tennessee, Knoxville 18
TN Long-Term Forecast, Revenue Collections(millions of dollars)
Tax 2007 2008 2009 2010 2011 2012Sales and Use 6,815.4 6,851.2 6,380.0 6,352.0 6,733.1 7,103.4Gasoline 612.3 617.1 592.0 595.0 601.0 607.0Motor Fuel 185.9 182.9 164.6 161.6 169.7 176.5Gasoline Inspection 65.3 65.2 60.6 61.5 62.8 64.4Motor Vehicle Registration 257.4 251.3 248.8 251.3 261.4 267.4Income 247.6 292.0 207.3 168.0 201.6 231.8Privilege 313.8 279.0 240.0 244.8 274.2 301.6Gross Receipts 277.6 291.0 305.0 310.7 322.6 335.0Gross Receipts - TVA 250.2 271.2 284.0 289.7 301.3 313.3Gross Receipts - Other 27.4 19.8 21.0 21.0 21.3 21.7Beer 18.0 17.9 18.0 18.7 19.0 19.3Alcoholic Beverage 41.0 42.6 44.8 46.6 48.5 50.4Franchise & Excise 1,766.1 1,619.5 1,305.0 1,259.3 1,410.4 1,551.5Inheritance & Estate 112.4 112.8 95.0 90.0 93.5 97.8Tobacco 138.0 286.0 290.0 300.0 301.5 303.0Motor Vehicle Title 11.1 11.4 10.9 11.3 11.6 12.0Mixed Drink 53.7 54.9 54.9 55.0 56.7 58.9Business 133.8 138.2 131.2 131.2 137.5 145.4Severance 1.5 2.6 2.0 2.0 2.0 1.9Coin Amusement 0.3 0.3 0.3 0.3 0.2 0.2Unauthorized Substance 1.7 1.9 1.9 1.9 1.9Total 11,052.7 11,117.6 10,150.5 10,059.3 10,709.0 11,329.3
Actual Estimate
Source:
William F. FoxCBER-UTMay 11, 2009

July 2009 Matthew N. Murray, Center for Business and Economic Research, The University of Tennessee, Knoxville 19
Center for Business & Economic Research
College of Business AdministrationThe University of Tennessee, Knoxville
716 Stokely Management Center916 Volunteer Boulevard
Knoxville, Tennessee 37996-0570
phone: 865.974.5441fax: 865.974.3100
http://cber.bus.utk.edu