
The London Millennium Footbridge · Borough of Southwark to design a new footbridge across the ......
15
PAPER: Dallard et al 17 The Structural Engineer Volume 79/No 22 20 November 2001 Synopsis This paper starts by describing the structure of the London Millennium Footbridge. The bridge opened on 10 June 2000. During the opening day unexpected lateral movements occurred as pedestrians crossed the bridge. The paper describes the events of opening day and the research and analysis that were carried out as a result of these movements. The lateral force exerted by pedestrians on the moving deck surface is found to be related to the movement. The results show that the phenomenon is not related to the technical innovations of the bridge and that the same phenomenon could occur on any bridge with a lateral frequency below about 1.3Hz loaded with a sufficient number of pedestrians. A selection of other bridges, including one road bridge, found to have exhibited the same phenomenon, are listed. The paper describes the development of a retrofit to control the vibrations. This involves the use of fluid- viscous dampers and tuned mass dampers to achieve damping levels in excess of 20% of critical. The results of tests on the bridge with a prototype installation of a small number of the proposed dampers are presented, which show that the performance of the damping scheme conforms with analytical predictions. Description of the bridge structure Introduction In September 1996 a competition was organised by the Financial Times newspaper in association with the London Borough of Southwark to design a new footbridge across the River Thames.Teams consisting of an engineer, an architect and an artist were invited to take part. The competition attracted over 200 entries and was won by the team of Arup (engineers), Foster and Partners (architects) and Sir Anthony Caro (sculp- tor). The concept The location of the bridge was to be in the area between Southwark Bridge and Blackfriars Bridge, but the precise axis for the deck was not prescribed in the competition brief. However, the aims of the bridge and the strong features of the site, the ‘corridor’ of Peter’s Hill on the north bank leading to Saint Paul’s Cathedral and the new Tate Modern art gallery on the south, influenced the choice of the bridge axis. Early on the team decided that the axis of Peter’s Hill was so strong that the bridge should follow this line directly, giving a clear view straight to St Paul’s Cathedral from the bridge deck as a result. This decision placed the bridge in the zone of influence of the St Paul’s height restrictions, allowing a thin sliver for the struc- ture between the navigation channel and the height limit. Superstructure General description: The bridge structural diagram is that of a shallow suspension bridge, where the cables are as much as pos- sible below the level of the bridge deck to free the views from the deck.Two groups of four 120mm diameter locked coil cables span from bank to bank over two river piers. The lengths of the three spans are 81m for the north span, 144m for the main span between the piers and 108m for the south span. The sag of the cable profile is 2.3m in the main span, around six times shal- lower than a more conventional suspension bridge structure. Fabricated steel box sections, known as the transverse arms, span between the two cable groups every 8m. The 4m wide deck structure comprises two steel edge tubes which span onto the transverse arms.The deck itself is made up of extruded alu- minium box sections which span between the edge tubes on each side. Other finishes such as the lighting and handrail are also fixed onto the edge tubes. The groups of cables are anchored at each bank. Each abut- ment is founded on a 3m reinforced concrete pilecap anchored by a group of 2.1m diameter reinforced concrete piles.There are 12 piles on the north bank and 16 on the south bank, where the site is constrained and the pilecap shorter in consequence. The river piers themselves comprise a steel ‘V’ bracket fixed to a tapering elliptical reinforced concrete body which is founded on two No. 6m diameter concrete caissons. Evening Meeting Based on an invited paper presented and discussed at a meeting of the Institution of Structural Engineers, held at the Institution of Civil Engineers, 1 Great George Street, London SW1, on 26 April 2001 at 6pm. Additional material is included. The London Millennium Footbridge P. Dallard CEng, MIMechE A. J. Fitzpatrick FREng, BSc(Eng), CEng, MIStructE, FICE A. Flint RAEng, FICE, FIStructE S. Le Bourva X-ENPC, CEng, MIStructE A. Low CEng, MICE R. M. Ridsdill Smith CEng, MIStructE M. Willford CEng, MIMechE All the authors are from Arup, except Dr Anthony Flint, who is a consultant to the Flint & Neill Partnership Keywords footbridges, suspension bridges, design, lateral loads, pedestrians, walking, vibration, damping, testing, synchronous excitation Fig 2. View of the bridge from the north Fig 1. View of the aluminium bridge deck looking north
Transcript of The London Millennium Footbridge · Borough of Southwark to design a new footbridge across the ......
P A P E R : D a l l a r d e t a l
17The Structural Engineer Volume 79/No 22 20 November 2001
SynopsisThis paper starts by describing the structure of theLondon Millennium Footbridge.
The bridge opened on 10 June 2000. During theopening day unexpected lateral movements occurred aspedestrians crossed the bridge. The paper describes theevents of opening day and the research and analysisthat were carried out as a result of these movements.
The lateral force exerted by pedestrians on themoving deck surface is found to be related to themovement. The results show that the phenomenon isnot related to the technical innovations of the bridgeand that the same phenomenon could occur on anybridge with a lateral frequency below about 1.3Hzloaded with a sufficient number of pedestrians. Aselection of other bridges, including one road bridge,found to have exhibited the same phenomenon, arelisted.
The paper describes the development of a retrofit tocontrol the vibrations. This involves the use of fluid-viscous dampers and tuned mass dampers to achievedamping levels in excess of 20% of critical. The resultsof tests on the bridge with a prototype installation of asmall number of the proposed dampers are presented,which show that the performance of the dampingscheme conforms with analytical predictions.
Description of the bridge structureIntroductionIn September 1996 a competition was organised by theFinancial Times newspaper in association with the LondonBorough of Southwark to design a new footbridge across theRiver Thames.Teams consisting of an engineer,an architect andan artist were invited to take part. The competition attractedover 200 entries and was won by the team of Arup (engineers),Foster and Partners (architects) and Sir Anthony Caro (sculp-tor).
The conceptThe location of the bridge was to be in the area betweenSouthwark Bridge and Blackfriars Bridge, but the precise axisfor the deck was not prescribed in the competition brief.
However, the aims of the bridge and the strong features of thesite, the ‘corridor’ of Peter’s Hill on the north bank leading toSaint Paul’s Cathedral and the new Tate Modern art gallery onthe south, influenced the choice of the bridge axis. Early on theteam decided that the axis of Peter’s Hill was so strong that thebridge should follow this line directly, giving a clear viewstraight to St Paul’s Cathedral from the bridge deck as a result.
This decision placed the bridge in the zone of influence of theSt Paul’s height restrictions,allowing a thin sliver for the struc-ture between the navigation channel and the height limit.
SuperstructureGeneral description: The bridge structural diagram is that of ashallow suspension bridge,where the cables are as much as pos-sible below the level of the bridge deck to free the views fromthe deck.Two groups of four 120mm diameter locked coil cablesspan from bank to bank over two river piers.The lengths of thethree spans are 81m for the north span,144m for the main spanbetween the piers and 108m for the south span.The sag of thecable profile is 2.3m in the main span, around six times shal-lower than a more conventional suspension bridge structure.
Fabricated steel box sections,known as the transverse arms,span between the two cable groups every 8m. The 4m widedeck structure comprises two steel edge tubes which span ontothe transverse arms.The deck itself is made up of extruded alu-minium box sections which span between the edge tubes oneach side. Other finishes such as the lighting and handrail arealso fixed onto the edge tubes.
The groups of cables are anchored at each bank. Each abut-ment is founded on a 3m reinforced concrete pilecap anchoredby a group of 2.1m diameter reinforced concrete piles.There are12 piles on the north bank and 16 on the south bank,where thesite is constrained and the pilecap shorter in consequence.Theriver piers themselves comprise a steel ‘V’ bracket fixed to atapering elliptical reinforced concrete body which is founded ontwo No. 6m diameter concrete caissons.
Evening MeetingBased on an invited paper presented and discussed at a meeting of the Institution of Structural Engineers, held at the Institutionof Civil Engineers, 1 Great George Street, London SW1, on 26 April 2001 at 6pm. Additional material is included.
The London MillenniumFootbridge
P. DallardCEng, MIMechE
A. J.FitzpatrickFREng, BSc(Eng),CEng, MIStructE,FICE
A. FlintRAEng, FICE,FIStructE
S. Le BourvaX-ENPC, CEng,MIStructE
A. LowCEng, MICE
R. M. RidsdillSmithCEng, MIStructE
M. WillfordCEng, MIMechE
All the authors are fromArup, except Dr AnthonyFlint, who is aconsultant to the Flint& Neill Partnership
Keywordsfootbridges,suspension bridges,design, lateralloads, pedestrians,walking, vibration,damping, testing,synchronousexcitation
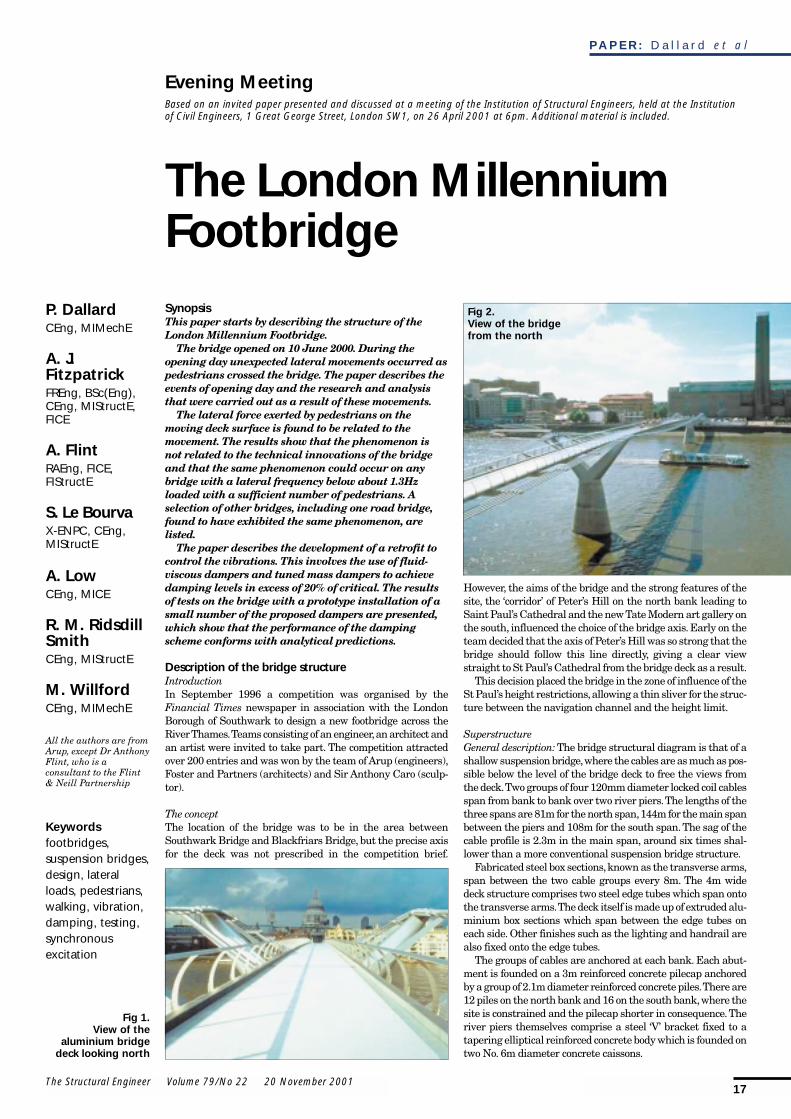
Fig 2.View of the bridgefrom the north
Fig 1.View of the
aluminium bridgedeck looking north
P A P E R : D a l l a r d e t a l
18 The Structural Engineer Volume 79/No 22 20 November 2001
Cable design: The cables form the primary structure of thebridge and have a very shallow cable profile,as described above.Ribbon bridges have similar shallow profiles, but are typicallysingle spans,allowing the cables to be anchored directly to sub-stantial stiff abutments.The stiff abutments help limit the liveload deflections.
The Millennium Bridge has some of the characteristics of aribbon bridge, but is unusual in having multiple spans. Theintermediate river piers are quite slender and cannot providestiffness comparable to that of a massive abutment.This meansthe spans interact,making the behaviour of the structure morecomplex than that of a single span bridge. For example, if onlythe central span was loaded, the outer spans would deflectupwards.
An initial series of parametric analyses, using the simplestmodels that could still meaningfully represent the non-linearresponse of the bridge, helped to understand the bridge behav-iour and set realistic targets for parameters such as the cablesizes, and the pier and abutment stiffnesses. The behaviour ofeach span is driven by the stiffness of the structural system atthe extremities of the span. The system providing stiffness iseither an abutment or the combination of the cable stiffness ofthe adjacent span with the stiffness of the pier. These studiesquantified the relative stiffnesses of the adjacent span cablesand of the pier structures,demonstrating that the cable stiffnessprovided about 80% and the piers 20% of the total stiffness atsuch a termination. Hence the main restraint stiffness to thecentral span came from the outer span cables and from theabutments, not directly from the piers. It was therefore impor-tant that variations in the abutment stiffnesses would not resultin similar variations of the bridge deflections. The parametricstudies enabled limiting foundation stiffnesses to be selected toachieve this requirement.
A shallow cable profile necessarily results in large cable ten-sions.The deadload of the bridge is 2t/linear m along the bridge
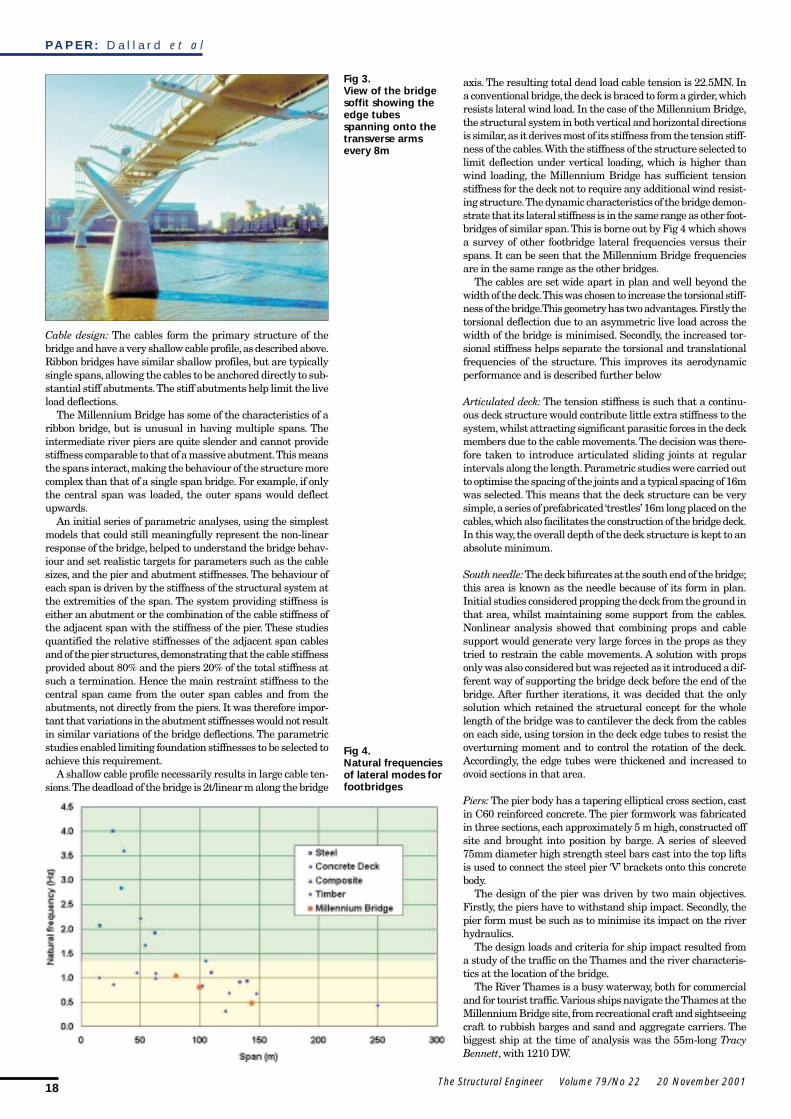
axis. The resulting total dead load cable tension is 22.5MN. Ina conventional bridge, the deck is braced to form a girder,whichresists lateral wind load. In the case of the Millennium Bridge,the structural system in both vertical and horizontal directionsis similar,as it derives most of its stiffness from the tension stiff-ness of the cables.With the stiffness of the structure selected tolimit deflection under vertical loading, which is higher thanwind loading, the Millennium Bridge has sufficient tensionstiffness for the deck not to require any additional wind resist-ing structure.The dynamic characteristics of the bridge demon-strate that its lateral stiffness is in the same range as other foot-bridges of similar span.This is borne out by Fig 4 which showsa survey of other footbridge lateral frequencies versus theirspans. It can be seen that the Millennium Bridge frequenciesare in the same range as the other bridges.
The cables are set wide apart in plan and well beyond thewidth of the deck.This was chosen to increase the torsional stiff-ness of the bridge.This geometry has two advantages.Firstly thetorsional deflection due to an asymmetric live load across thewidth of the bridge is minimised. Secondly, the increased tor-sional stiffness helps separate the torsional and translationalfrequencies of the structure. This improves its aerodynamicperformance and is described further below
Articulated deck: The tension stiffness is such that a continu-ous deck structure would contribute little extra stiffness to thesystem,whilst attracting significant parasitic forces in the deckmembers due to the cable movements.The decision was there-fore taken to introduce articulated sliding joints at regularintervals along the length.Parametric studies were carried outto optimise the spacing of the joints and a typical spacing of 16mwas selected. This means that the deck structure can be verysimple,a series of prefabricated ‘trestles’ 16m long placed on thecables,which also facilitates the construction of the bridge deck.In this way, the overall depth of the deck structure is kept to anabsolute minimum.
South needle:The deck bifurcates at the south end of the bridge;this area is known as the needle because of its form in plan.Initial studies considered propping the deck from the ground inthat area, whilst maintaining some support from the cables.Nonlinear analysis showed that combining props and cablesupport would generate very large forces in the props as theytried to restrain the cable movements. A solution with propsonly was also considered but was rejected as it introduced a dif-ferent way of supporting the bridge deck before the end of thebridge. After further iterations, it was decided that the onlysolution which retained the structural concept for the wholelength of the bridge was to cantilever the deck from the cableson each side, using torsion in the deck edge tubes to resist theoverturning moment and to control the rotation of the deck.Accordingly, the edge tubes were thickened and increased toovoid sections in that area.
Piers: The pier body has a tapering elliptical cross section, castin C60 reinforced concrete. The pier formwork was fabricatedin three sections, each approximately 5 m high, constructed offsite and brought into position by barge. A series of sleeved75mm diameter high strength steel bars cast into the top liftsis used to connect the steel pier ‘V’ brackets onto this concretebody.
The design of the pier was driven by two main objectives.Firstly, the piers have to withstand ship impact. Secondly, thepier form must be such as to minimise its impact on the riverhydraulics.
The design loads and criteria for ship impact resulted froma study of the traffic on the Thames and the river characteris-tics at the location of the bridge.
The River Thames is a busy waterway, both for commercialand for tourist traffic.Various ships navigate the Thames at theMillennium Bridge site, from recreational craft and sightseeingcraft to rubbish barges and sand and aggregate carriers. Thebiggest ship at the time of analysis was the 55m-long TracyBennett, with 1210 DW.
Fig 3.View of the bridgesoffit showing theedge tubesspanning onto thetransverse armsevery 8m
Fig 4.Natural frequenciesof lateral modes forfootbridges
P A P E R : D a l l a r d e t a l
19The Structural Engineer Volume 79/No 22 20 November 2001
The precise nature of the river traffic remains, nevertheless,relatively undefined. In order to establish river use more accu-rately,Arup commissioned a round-the-clock survey over a peri-od of a week, during which every vessel passing underSouthwark Bridge was recorded, along with its size, displace-ment and position in the river channel. It was found that thereare on average 400 boats a day which pass the bridge site.Theresultant raw data was processed in order to take account of sea-sonal variations in shipping. It was then used to establish theimpact forces to the piers via the probabilistic method set outby the AASHTO code1. Future water level changes due to sealevel rise were considered in order to define the height at whichthe force would be applied, and the risks of impact occurring.
The piers have been designed both to withstand collapseunder the load set out in the competition brief,and to resist,withthe need for remedial repairs, a more precise load calculatedusing the AASHTO probabilistic approach.The deck structureand cables are not susceptible to ship impact over the majorityof the span. A risk assessment carried out for the south spanestablished the height for the cable elevation at the south abut-ment, and resulted in the design of the south abutment ‘wing’structure to anchor the cables 4m above ground level.
Placing piers, cofferdams and construction equipment in ariver locally changes the nature of its hydraulics. In order toinvestigate these effects,Arup commissioned HR Wallingford toconstruct a 1:100 natural scale physical model to investigate theimpact of the Millennium Bridge on the River Thames.Permanent bed protection was placed around the piers andtemporary bed protection was placed on the foreshore as aresult of the tests after consultation with the EnvironmentAgency and the Port of London Authority.The tests on the piersalso confirmed that turbulence around the permanent workswas sufficiently low that it would not hamper navigationthrough the bridge or at the Bankside pontoon.
The cables are locked longitudinally at the top of the pieragainst the saddles by a series of friction clamps.The steel pierV-brackets are in turn fixed to the concrete body of the pier viathe pretensioned high-strength steel bars described above.During construction,the pier V-brackets were left articulated onhydraulic jacks in order to take up final adjustment.The jacksand the articulation of the pier V-bracket to the concrete bodycan be reinstated at a future date enabling the alignment of thepier to be modified to retension the cables.
South abutment: The cables are anchored down to the 3m pile-cap on the south side by a steel ‘strut and tie’ on each side of theconcrete ramp. The strut and tie lie in the same plane as thecable when subject to dead load alone. In this way the out-of-plane forces acting on the abutment structure are due only tothe change in cable geometry from live load on the bridge.
North abutment: The cables are anchored on the north abut-ment at the top of the steps leading up Peter’s Hill. The large,predominantly horizontal, forces from the cables transfer via ahorizontal reinforced concrete deep beam to vertical shear wallson each side of the steps.These shear walls, 1m thick, carry theloads to the 3m pilecap.In this way the existing space below thesteps, used by the City of London school for storage and park-ing, is maintained.
Substructure Ground conditions: Ground conditions were investigated byNorwest Holst Soil Engineering Ltd in July and August 1998.Boreholes were sunk at the abutments and at the river pier loca-tions. The stratigraphy comprises Made Ground overlying asequence of Terrace Gravels, London Clay and the LambethBeds.
Abutment foundations:The most significant loads applied to theabutment foundations will be the horizontal force (some 30MNcombined dead and live load) from the bridge cables, and theresulting overturning moment.The foundation piles resist thehorizontal loading by lateral loading of the soil.The moment isresisted partly by frame action but mainly by vertical push-pull
loading of the piles.The design of the foundation system is prin-cipally constrained by the requirement to limit horizontal defor-mations at the cable anchorage due to lateral movement androtation of the pile cap. A combination of single pile and pilegroup analyses were carried out using in-house programs todetermine the stiffness of the foundation and the forces in thesubstructure.
An additional consideration is the need to limit the effect ofground movements on the adjacent structures. The horizontalloading will cause some soil pressures to be applied to the pilessupporting the neighbouring buildings and the river walls,which they should be able to sustain without distress.
The north abutment site was excavated down to just belowthe pile cap soffit level by the Museum of London ArcheologicalService to investigate its archaeological potential. On threesides of the excavation the surrounding soil was supported bya temporary king post wall system, the former Swiss BankBuilding basement wall being on the fourth side. The excava-tion was temporarily backfilled prior to piling to allow access forthe piling rig.The foundations comprise a group of 12 bored castin situ concrete piles, 2.1m diameter and 28m long. The pileswere constructed from C40 concrete and reinforced at the topwith 44 T50 bars, reducing in number down the length of thepiles.The length of the piles and reinforcement were sized pri-marily to provide the desired stiffness response of the founda-tion.
The south abutment site was also archaeologically excavat-ed. As there was more room on the south side of the river, bat-tered side slopes could be formed and so the piles could installedfrom the base of the dig. The foundations comprise a group of16 bored cast in situ concrete piles,2.1m diameter and 28m longwith a 3m deep pile cap.
The abutment piles will tend to apply a pressure to the backof the river walls as they are pulled forwards by the force fromthe cables.This could lead to adverse effects on the walls unlessspecific protection measures are taken.The original proposal toavoid loading the river walls comprised a sleeving arrange-ment around the front row of piles at each abutment,which lefta 75mm clear void between the piles and the surrounding soilbehind the river walls. The outer sleeve comprised a 2.5mm-thick ribbed steel tube,which was designed to be flexible enoughto distort under loading from the piles behind. An alternativesystem was developed during discussion between Arup,Bachy-Soletanche and Monberg Thorsen McAlpine,whereby the fronttwo rows of piles are surrounded by an annulus filled with aweak, cement-bentonite slurry.The slurry had to be sufficient-ly dense and strong to support the soil,but soft enough to trans-fer only a limited amount of load to the ground as the pilesdeform.
The riverside face of the pile caps are separated from the soilby Cellcore,a compressible grillage formed from expanded poly-styrene, again to avoid loading the river wall. The other threesides of the pile caps are separated from the soil by 200mm-thick expanded polystyrene board. Each pilecap containsaround 1000m3 of reinforced C40 concrete, placed in one singlepour on the south abutment and two on the north due to traf-fic constraints in the area.
Pier foundations: The bridge is supported by two piers in the
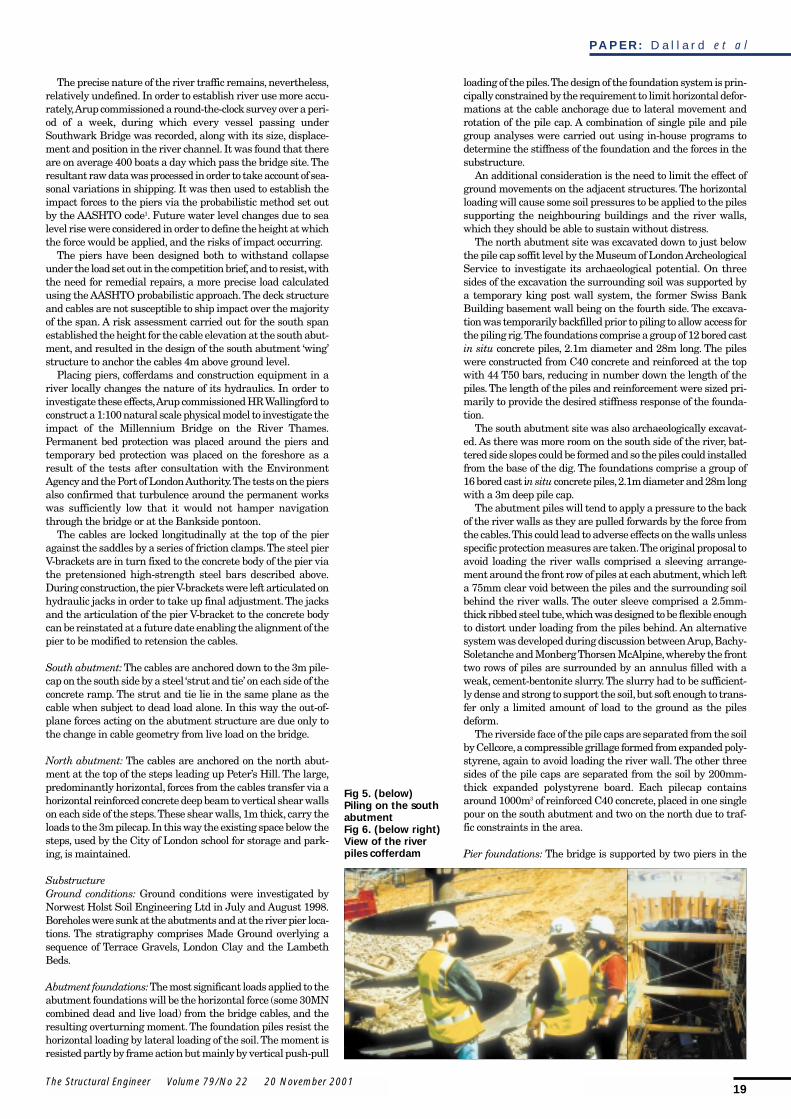
Fig 5. (below)Piling on the southabutmentFig 6. (below right)View of the riverpiles cofferdam
P A P E R : D a l l a r d e t a l
20 The Structural Engineer Volume 79/No 22 20 November 2001
River Thames.The foundations for each pier comprise a pair of6m diameter caissons, dug to some 18m below river bed levelwithin a sheet pile cofferdam, connected via a 3m deep pilecap.The caisson system was proposed by the contractor as an alter-native to the original driven steel pile supports and refined bythe design team to ensure that adequate lateral stiffness wouldbe provided.The pier foundations have to withstand a 35.9MNhead on and skew ship impact without significant permanentdisplacements as well as providing adequate longitudinal stiff-ness to the cables.The effects of sheet pile withdrawal were alsostudied.
The design of the caissons was carried out using a 3-D finiteelement analysis which modelled the structure and the soil by40 000 brick elements.The non-linear behaviour of the soil wassimulated to represent its stiffness at relatively small move-ments in service as well as the large displacements which wouldoccur during a ship impact.
The caisson construction made use of standard water indus-try tunnel lining precast segments to excavate a vertical tubeinto the underlying clays by a combination of mini-excavatorand clay spades.The segments were grouted to ensure good con-tact with the surrounding soil. The caissons were subsequent-ly backfilled with reinforced concrete.During excavation the soilbeneath the shafts was drained using pre-drilled relief wells toreduce the likelihood of base failure,with monitoring carried outusing arrays of vibrating wire piezometers.
Dynamic characteristics of the bridgeAnalysis method:Any analysis of the bridge has to allow for thedominant tension stiffness. The modeshapes and natural fre-quencies were calculated using the Arup GSA program, whichhas the capability to use a combined normal and geometricstiffness matrix in an eigen analysis.The modeshapes are closeto sinusoidal, with frequency related to tension, wavelengthand mass for translational modes,or inertia for torsional modes.The modes tend to only have a significant response in one span,allowing them to be characterised as, say, the second torsionalmode of the south span.
Wind excitation: The influence of the wind on the bridge hasbeen examined in terms of wind load,aerodynamic stability,buf-fet movements and environment for bridge users. The first ofthree sectional model wind tunnel tests took place during thecompetition to confirm the feasibility of the concept. Furthertests during scheme design established design wind loads andthe parametrics governing stability,and confirmatory tests werecarried out once the geometry had been finalised. These stud-ies were performed at RWDI’s laboratories in Canada with 1:16scale sectional models.The position of the cables relative to thedeck, and the mass, stiffness and polar moment of inertia werevaried in order to model different sections along the bridge.
The bridge was shown to be aerodynamically stable in windspeeds up to and beyond a 10 000 year return period windevent.The slim depth and round edges of the cross section con-tribute to the bridge stability. The separation of the torsionaland translational frequencies as described above minimisesthe interaction between those modes, preventing flutter insta-bility.The cable arrangement contributes positive aerodynam-ic damping of torsional motion. Significant vortex sheddingexcitation does not occur.
The response to wind buffeting was also evaluated during thedesign period. The buffeting response of the bridge is primari-ly vertical and mainly occurs in the lowest modes. Becausethere are limited data on acceptable levels of vibration for fre-quencies below 1Hz,motion simulator tests were carried out atthe Institute of Sound and Vibration Research at the Universityof Southampton to confirm the acceptability of the predictedmotions. Subsequent monitoring of the built bridge has vali-dated the predicted levels of buffet-induced movement.
Pedestrian excitation based on BS 5400: During design, a mod-ified BS 5400 approach was used for assessment of the responseto vertical pedestrian excitation,using a higher input force thanis recommended in the code. To take into account the effects
resulting from the inclined cables, including the coupling of lat-eral and torsional movements, the lateral and torsionalresponse to eccentrically applied vertical loads was alsoassessed.
Whilst it is possible to calculate the response to pedestrianexcitation in a manner consistent with BS 5400 using modaltime history analysis, the bridge has many modes in the fre-quency range of pedestrian input, hence time history analysisis somewhat impractical.By approximating the modeshapes ofthe bridge to sinusoids, it is possible to obtain a closed form solu-tion for the likely peak response in each mode. This methodallowed all pedestrian excitable modes to be assessed. Theresponses have been calculated both in terms of accelerationand response factor R, this being the ratio of acceleration to theacceleration that a human can just perceive at that frequency.
The peak response in the vertical modes is associated withthe north span. This is because the north span is the shortest,so its modes have the least modal mass.The peak accelerationwas 19 milli-g, the peak response factor R = 18.
Below about 3Hz, humans are more sensitive to horizontalthan vertical accelerations.Torsion modes give rise to both ver-tical and horizontal response.On the Millennium Bridge,about50% of the mass of the bridge superstructure is in the cables andcable clamps. Spacing the cables wide apart results in the tor-sion modes having relatively high modal mass. The torsionmodes also have relatively low excitability, because the deckmoves less than the cables.
This means that the response in torsional modes is general-ly lower than in vertical modes,even when the sensitivity to hor-izontal acceleration is taken into account.The north span is anexception. Where the bridge meets the Peter’s Hill Steps, thecables cannot be spaced much wider apart than the deck width,or they would obstruct the stairs.The benefit of relatively highmodal mass and low excitability is reduced, resulting in high-
er peak vertical and horizontal accelerations of 17 and 11 milli-g, combining to give a response factor of R = 26.
Testing with a few people took place on the bridge in May2000 prior to the opening and confirmed the calculated accel-erations.
ConstructionConstruction began on site with the archeological excavation ofeach abutment in late 1998. The enabling works were carriedout by Balfour Beatty.A Joint Venture of Monberg Thorsen and Sir Robert McAlpinewon the contract for the Main Works and started piling on sitein April 1999. The superstructure began to be erected at thebeginning of 2000, and the bridge opened on 10 June 2000.
Opening dayIt is estimated that between 80 000 and 100 000 people crossedthe bridge during the first day.Analysis of video footage showeda maximum of 2000 people on the deck at any one time, result-ing in a maximum density of between 1.3 and 1.5 people persquare metre.
Unexpected excessive lateral vibrations of the bridge
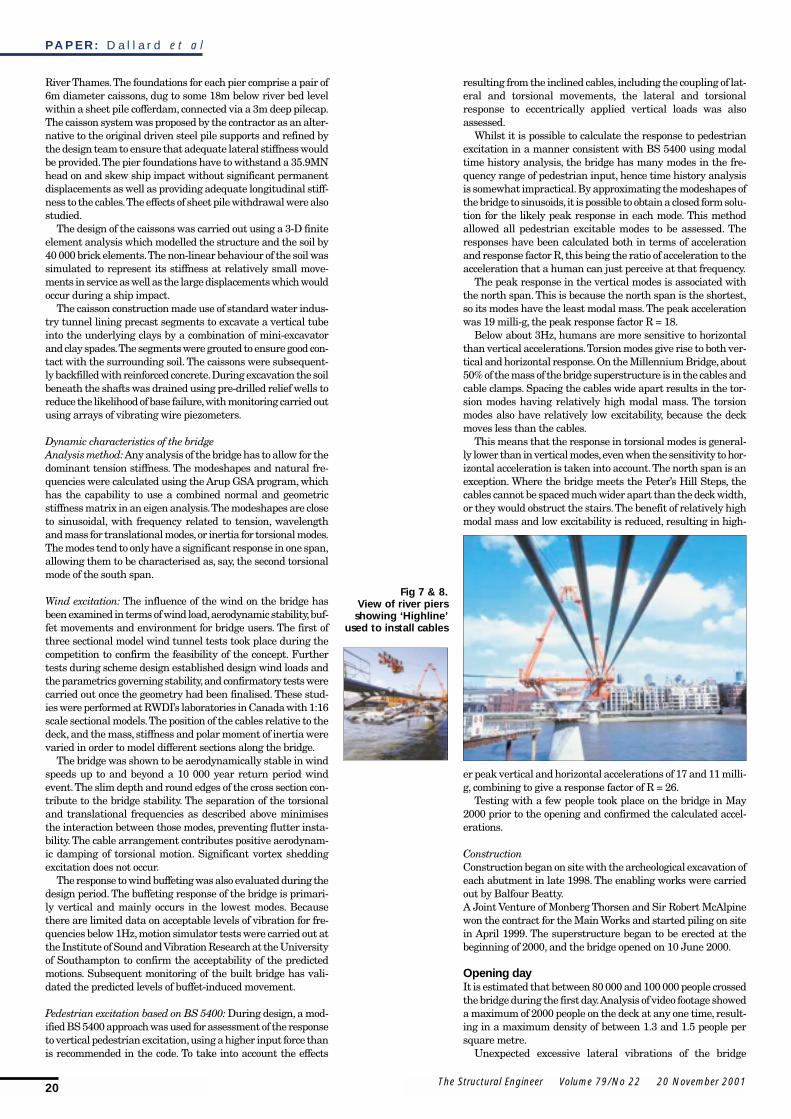
Fig 7 & 8.View of river piersshowing ‘Highline’
used to install cables
P A P E R : D a l l a r d e t a l
21The Structural Engineer Volume 79/No 22 20 November 2001
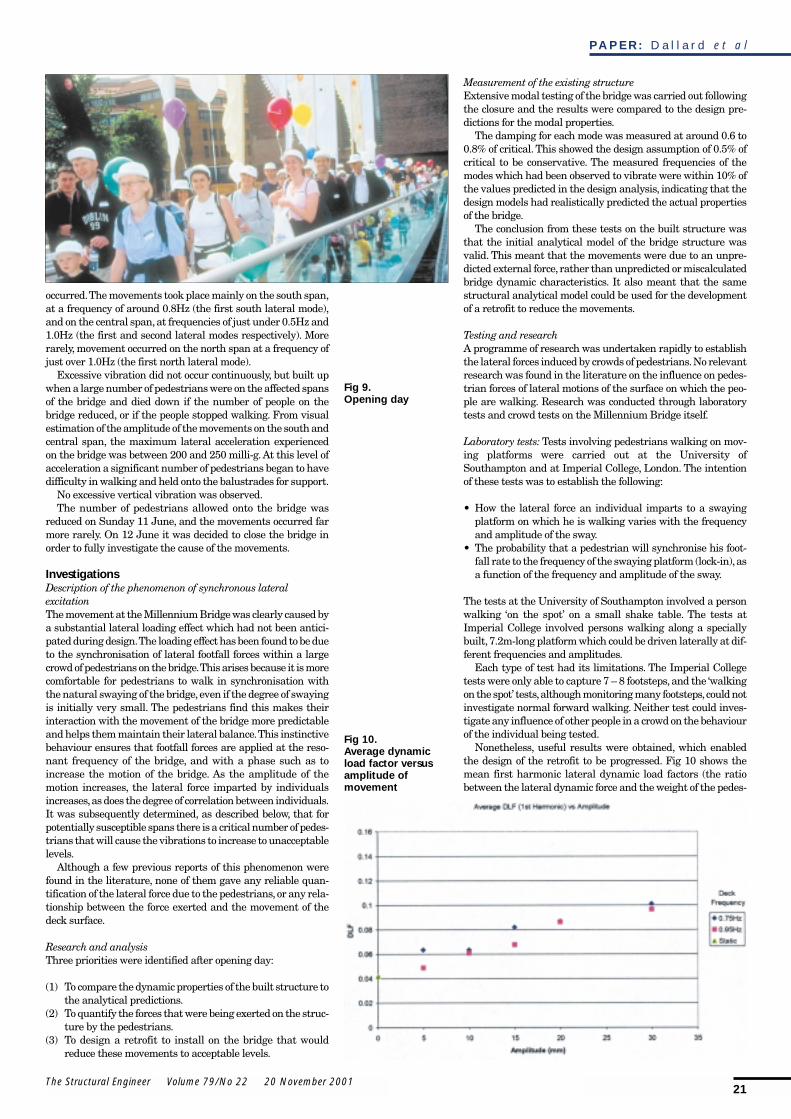
occurred.The movements took place mainly on the south span,at a frequency of around 0.8Hz (the first south lateral mode),and on the central span,at frequencies of just under 0.5Hz and1.0Hz (the first and second lateral modes respectively). Morerarely, movement occurred on the north span at a frequency ofjust over 1.0Hz (the first north lateral mode).
Excessive vibration did not occur continuously, but built upwhen a large number of pedestrians were on the affected spansof the bridge and died down if the number of people on thebridge reduced, or if the people stopped walking. From visualestimation of the amplitude of the movements on the south andcentral span, the maximum lateral acceleration experiencedon the bridge was between 200 and 250 milli-g. At this level ofacceleration a significant number of pedestrians began to havedifficulty in walking and held onto the balustrades for support.
No excessive vertical vibration was observed.The number of pedestrians allowed onto the bridge was
reduced on Sunday 11 June, and the movements occurred farmore rarely. On 12 June it was decided to close the bridge inorder to fully investigate the cause of the movements.
InvestigationsDescription of the phenomenon of synchronous lateralexcitationThe movement at the Millennium Bridge was clearly caused bya substantial lateral loading effect which had not been antici-pated during design.The loading effect has been found to be dueto the synchronisation of lateral footfall forces within a largecrowd of pedestrians on the bridge.This arises because it is morecomfortable for pedestrians to walk in synchronisation withthe natural swaying of the bridge,even if the degree of swayingis initially very small. The pedestrians find this makes theirinteraction with the movement of the bridge more predictableand helps them maintain their lateral balance.This instinctivebehaviour ensures that footfall forces are applied at the reso-nant frequency of the bridge, and with a phase such as toincrease the motion of the bridge. As the amplitude of themotion increases, the lateral force imparted by individualsincreases,as does the degree of correlation between individuals.It was subsequently determined, as described below, that forpotentially susceptible spans there is a critical number of pedes-trians that will cause the vibrations to increase to unacceptablelevels.
Although a few previous reports of this phenomenon werefound in the literature, none of them gave any reliable quan-tification of the lateral force due to the pedestrians,or any rela-tionship between the force exerted and the movement of thedeck surface.
Research and analysisThree priorities were identified after opening day:
(1) To compare the dynamic properties of the built structure tothe analytical predictions.
(2) To quantify the forces that were being exerted on the struc-ture by the pedestrians.
(3) To design a retrofit to install on the bridge that wouldreduce these movements to acceptable levels.
Measurement of the existing structureExtensive modal testing of the bridge was carried out followingthe closure and the results were compared to the design pre-dictions for the modal properties.
The damping for each mode was measured at around 0.6 to0.8% of critical. This showed the design assumption of 0.5% ofcritical to be conservative. The measured frequencies of themodes which had been observed to vibrate were within 10% ofthe values predicted in the design analysis, indicating that thedesign models had realistically predicted the actual propertiesof the bridge.
The conclusion from these tests on the built structure wasthat the initial analytical model of the bridge structure wasvalid. This meant that the movements were due to an unpre-dicted external force, rather than unpredicted or miscalculatedbridge dynamic characteristics. It also meant that the samestructural analytical model could be used for the developmentof a retrofit to reduce the movements.
Testing and researchA programme of research was undertaken rapidly to establishthe lateral forces induced by crowds of pedestrians.No relevantresearch was found in the literature on the influence on pedes-trian forces of lateral motions of the surface on which the peo-ple are walking. Research was conducted through laboratorytests and crowd tests on the Millennium Bridge itself.
Laboratory tests: Tests involving pedestrians walking on mov-ing platforms were carried out at the University ofSouthampton and at Imperial College, London. The intentionof these tests was to establish the following:
• How the lateral force an individual imparts to a swayingplatform on which he is walking varies with the frequencyand amplitude of the sway.
• The probability that a pedestrian will synchronise his foot-fall rate to the frequency of the swaying platform (lock-in),asa function of the frequency and amplitude of the sway.
The tests at the University of Southampton involved a personwalking ‘on the spot’ on a small shake table. The tests atImperial College involved persons walking along a speciallybuilt,7.2m-long platform which could be driven laterally at dif-ferent frequencies and amplitudes.
Each type of test had its limitations. The Imperial Collegetests were only able to capture 7 – 8 footsteps, and the ‘walkingon the spot’ tests,although monitoring many footsteps,could notinvestigate normal forward walking. Neither test could inves-tigate any influence of other people in a crowd on the behaviourof the individual being tested.
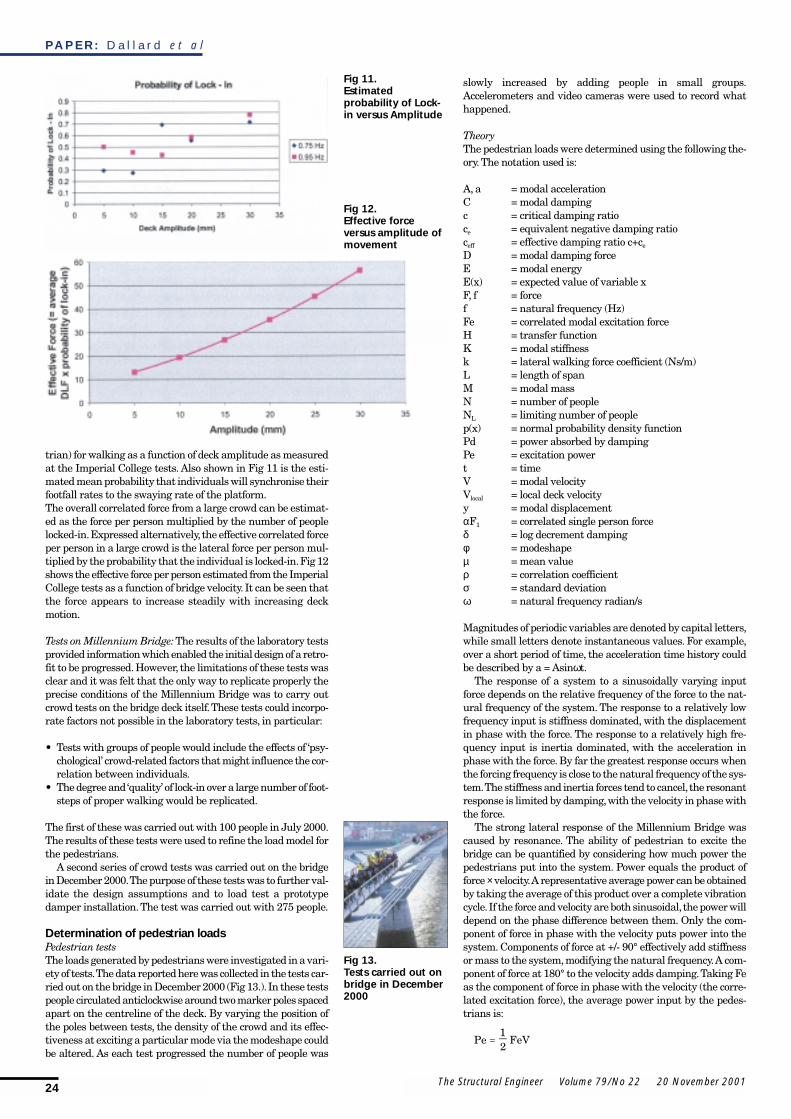
Nonetheless, useful results were obtained, which enabledthe design of the retrofit to be progressed. Fig 10 shows themean first harmonic lateral dynamic load factors (the ratiobetween the lateral dynamic force and the weight of the pedes-
Fig 10. Average dynamicload factor versusamplitude ofmovement
Fig 9.Opening day
P A P E R : D a l l a r d e t a l
24 The Structural Engineer Volume 79/No 22 20 November 2001
trian) for walking as a function of deck amplitude as measuredat the Imperial College tests. Also shown in Fig 11 is the esti-mated mean probability that individuals will synchronise theirfootfall rates to the swaying rate of the platform.The overall correlated force from a large crowd can be estimat-ed as the force per person multiplied by the number of peoplelocked-in.Expressed alternatively, the effective correlated forceper person in a large crowd is the lateral force per person mul-tiplied by the probability that the individual is locked-in.Fig 12shows the effective force per person estimated from the ImperialCollege tests as a function of bridge velocity. It can be seen thatthe force appears to increase steadily with increasing deckmotion.
Tests on Millennium Bridge: The results of the laboratory testsprovided information which enabled the initial design of a retro-fit to be progressed. However, the limitations of these tests wasclear and it was felt that the only way to replicate properly theprecise conditions of the Millennium Bridge was to carry outcrowd tests on the bridge deck itself.These tests could incorpo-rate factors not possible in the laboratory tests, in particular:
• Tests with groups of people would include the effects of ‘psy-chological’ crowd-related factors that might influence the cor-relation between individuals.
• The degree and ‘quality’ of lock-in over a large number of foot-steps of proper walking would be replicated.
The first of these was carried out with 100 people in July 2000.The results of these tests were used to refine the load model forthe pedestrians.
A second series of crowd tests was carried out on the bridgein December 2000.The purpose of these tests was to further val-idate the design assumptions and to load test a prototypedamper installation.The test was carried out with 275 people.
Determination of pedestrian loadsPedestrian testsThe loads generated by pedestrians were investigated in a vari-ety of tests.The data reported here was collected in the tests car-ried out on the bridge in December 2000 (Fig 13.). In these testspeople circulated anticlockwise around two marker poles spacedapart on the centreline of the deck. By varying the position ofthe poles between tests, the density of the crowd and its effec-tiveness at exciting a particular mode via the modeshape couldbe altered. As each test progressed the number of people was
slowly increased by adding people in small groups.Accelerometers and video cameras were used to record whathappened.
TheoryThe pedestrian loads were determined using the following the-ory.The notation used is:
A, a = modal accelerationC = modal dampingc = critical damping ratioce = equivalent negative damping ratioceff = effective damping ratio c+ce
D = modal damping forceE = modal energyE(x) = expected value of variable xF, f = forcef = natural frequency (Hz)Fe = correlated modal excitation forceH = transfer functionK = modal stiffnessk = lateral walking force coefficient (Ns/m)L = length of spanM = modal massN = number of peopleNL = limiting number of peoplep(x) = normal probability density functionPd = power absorbed by dampingPe = excitation powert = timeV = modal velocityVlocal = local deck velocityy = modal displacementαF1 = correlated single person forceδ = log decrement dampingφ = modeshapeµ = mean valueρ = correlation coefficientσ = standard deviationω = natural frequency radian/s
Magnitudes of periodic variables are denoted by capital letters,while small letters denote instantaneous values. For example,over a short period of time, the acceleration time history couldbe described by a = Asinωt.
The response of a system to a sinusoidally varying inputforce depends on the relative frequency of the force to the nat-ural frequency of the system. The response to a relatively lowfrequency input is stiffness dominated, with the displacementin phase with the force. The response to a relatively high fre-quency input is inertia dominated, with the acceleration inphase with the force. By far the greatest response occurs whenthe forcing frequency is close to the natural frequency of the sys-tem.The stiffness and inertia forces tend to cancel, the resonantresponse is limited by damping,with the velocity in phase withthe force.
The strong lateral response of the Millennium Bridge wascaused by resonance. The ability of pedestrian to excite thebridge can be quantified by considering how much power thepedestrians put into the system. Power equals the product offorce ×velocity.A representative average power can be obtainedby taking the average of this product over a complete vibrationcycle.If the force and velocity are both sinusoidal, the power willdepend on the phase difference between them. Only the com-ponent of force in phase with the velocity puts power into thesystem. Components of force at +/- 90° effectively add stiffnessor mass to the system,modifying the natural frequency.A com-ponent of force at 180° to the velocity adds damping.Taking Feas the component of force in phase with the velocity (the corre-lated excitation force), the average power input by the pedes-trians is:
Pe FeV21
=
Fig 13.Tests carried out onbridge in December2000
Fig 12. Effective forceversus amplitude ofmovement
Fig 11.Estimatedprobability of Lock-in versus Amplitude
P A P E R : D a l l a r d e t a l
25The Structural Engineer Volume 79/No 22 20 November 2001
The power absorbed by the dampers is:
Pd DV21
=
The resultant power input equals the rate of change of modalenergy against time:
Pe Pddtd
Edtd
MV MVdtdV
21 2- = = =c m
Reordering and substituting the power relationships givenabove:
FeV DV MVdtdV
21
21
= +
Fe D MdtdV
2= +
Substituting A = ωV gives:
Fe D MdtdA
ω21
= + ...equation 1
This equation was used to process the test acceleration data,taking the modal damping force D as a nonlinear function ofamplitude. The nonlinearity was due largely to stiction in theviscous dampers used in some tests to increase the damping ofthe bridge. If the damping is assumed to be linear, the modaldamping force can be related to the critical damping ratio:
C MK M
D CV cC V c MV cMA
ω
ω
2 2
2 2
cr
cr
= =
= = = =
Approximating the rate of change of acceleration by the changeover one period:
/dtdA
tA A
∆∆
π ω∆
2. =
Substituting these expressions into equation 1:
Fe cMA MAπ
∆2= +
While this equation may not be familiar, it can be shown toembody two well-known relationships.Setting ∆A to zero givesthe familiar equation for steady state response:
Fe = 2cMA
Ac M
Fe21
=
Setting Fe to zero gives the familiar equation for damped decay:
cMA MAπ∆
2 0+ =
AA
c∆
π δ2=- =-
Data processingTo obtain the acceleration in a particular mode, the relevantaccelerometer signals were first combined, then digitally fil-tered to remove content away from the natural frequency. Theresulting time history signal was processed to obtain a recordof acceleration magnitude at each period. Equation 1 was usedto convert this into a record of modal force.The modal force wasthen divided by the effective number of people involved in thetest at that time,to obtain a record of the correlated modal forceper person αF1.
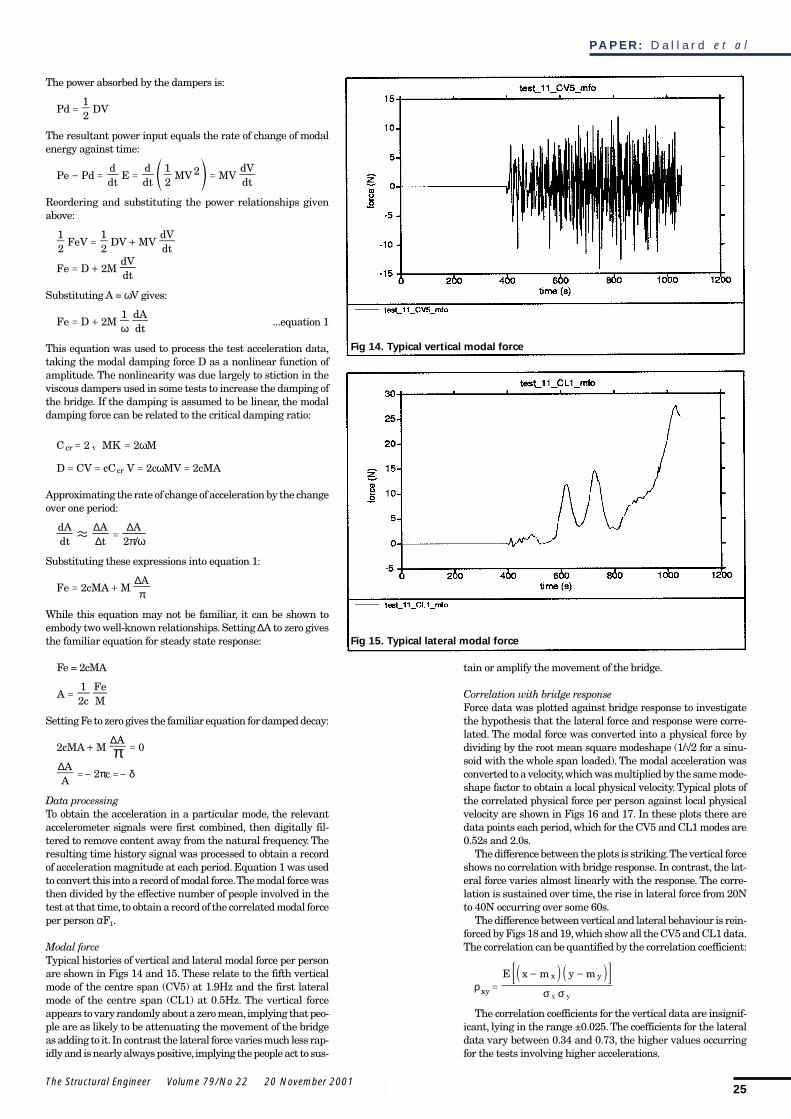
Modal forceTypical histories of vertical and lateral modal force per personare shown in Figs 14 and 15. These relate to the fifth verticalmode of the centre span (CV5) at 1.9Hz and the first lateralmode of the centre span (CL1) at 0.5Hz. The vertical forceappears to vary randomly about a zero mean,implying that peo-ple are as likely to be attenuating the movement of the bridgeas adding to it. In contrast the lateral force varies much less rap-idly and is nearly always positive, implying the people act to sus-
tain or amplify the movement of the bridge.
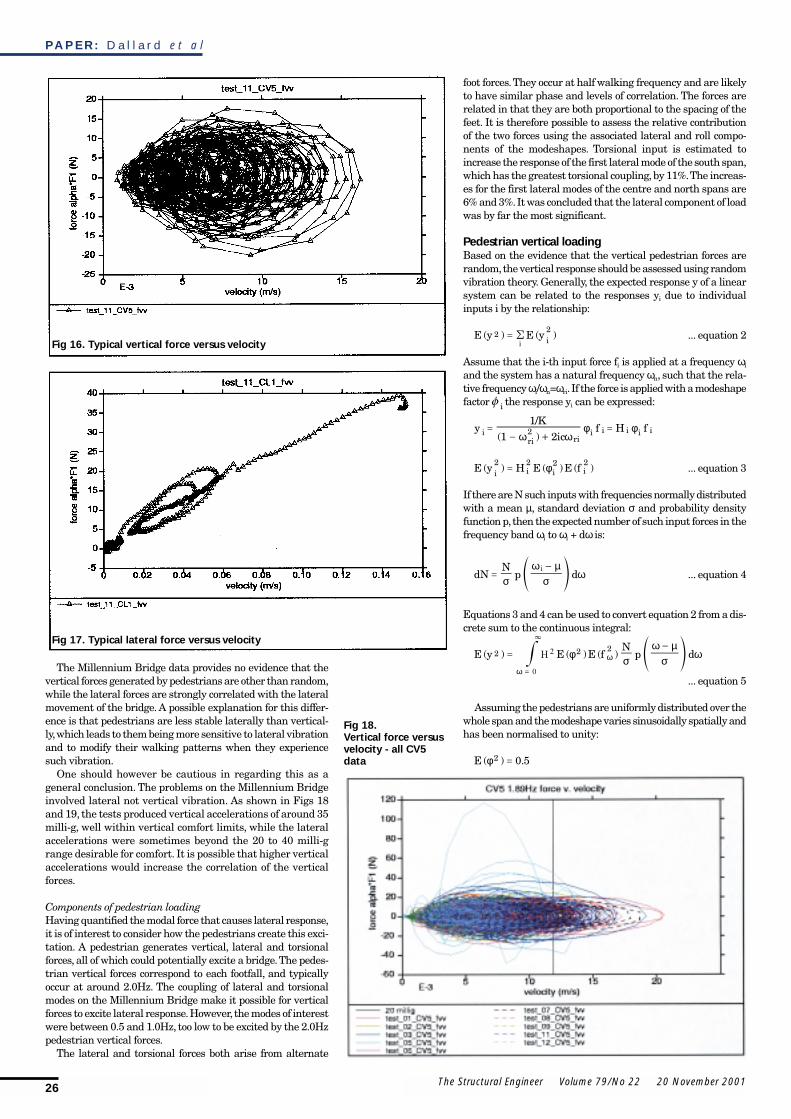
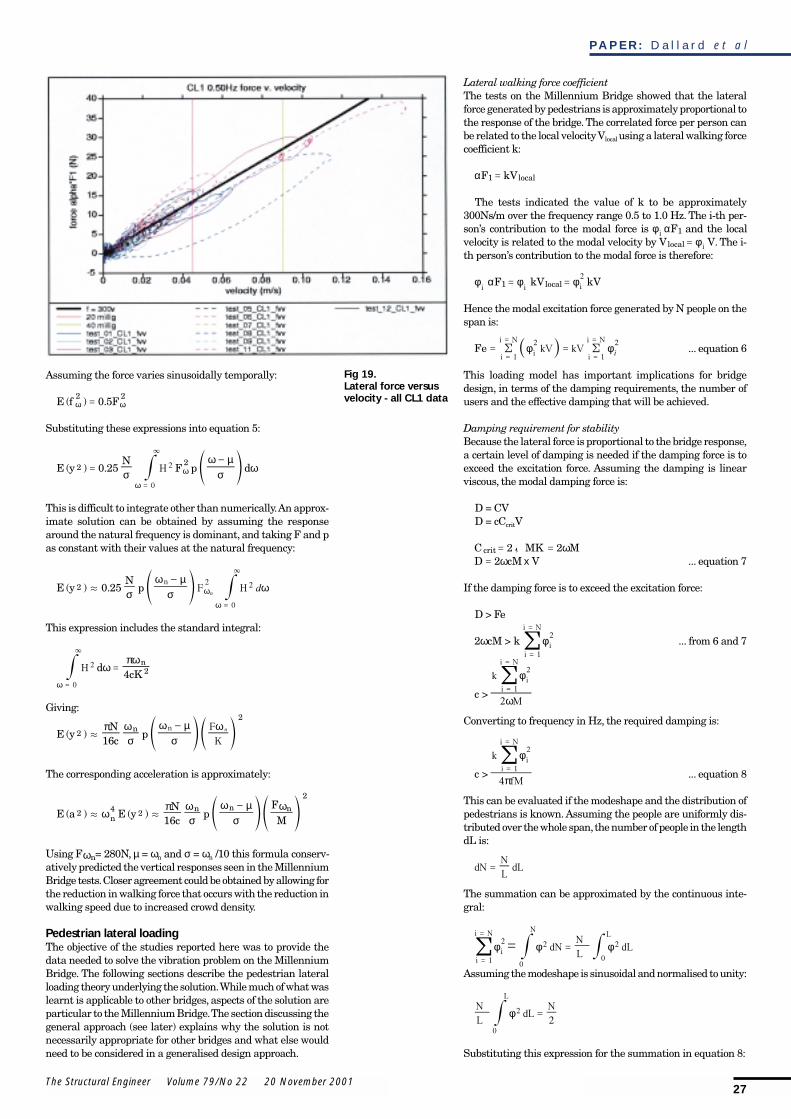
Correlation with bridge responseForce data was plotted against bridge response to investigatethe hypothesis that the lateral force and response were corre-lated. The modal force was converted into a physical force bydividing by the root mean square modeshape (1/√2 for a sinu-soid with the whole span loaded). The modal acceleration wasconverted to a velocity,which was multiplied by the same mode-shape factor to obtain a local physical velocity. Typical plots ofthe correlated physical force per person against local physicalvelocity are shown in Figs 16 and 17. In these plots there aredata points each period, which for the CV5 and CL1 modes are0.52s and 2.0s.
The difference between the plots is striking.The vertical forceshows no correlation with bridge response. In contrast, the lat-eral force varies almost linearly with the response. The corre-lation is sustained over time, the rise in lateral force from 20Nto 40N occurring over some 60s.
The difference between vertical and lateral behaviour is rein-forced by Figs 18 and 19,which show all the CV5 and CL1 data.The correlation can be quantified by the correlation coefficient:
E x m y mρ σ σx y
xy
x y=
- -a ak k; E
The correlation coefficients for the vertical data are insignif-icant, lying in the range ±0.025.The coefficients for the lateraldata vary between 0.34 and 0.73, the higher values occurringfor the tests involving higher accelerations.
Fig 14. Typical vertical modal force
Fig 15. Typical lateral modal force
P A P E R : D a l l a r d e t a l
26 The Structural Engineer Volume 79/No 22 20 November 2001
The Millennium Bridge data provides no evidence that thevertical forces generated by pedestrians are other than random,while the lateral forces are strongly correlated with the lateralmovement of the bridge. A possible explanation for this differ-ence is that pedestrians are less stable laterally than vertical-ly,which leads to them being more sensitive to lateral vibrationand to modify their walking patterns when they experiencesuch vibration.
One should however be cautious in regarding this as ageneral conclusion. The problems on the Millennium Bridgeinvolved lateral not vertical vibration. As shown in Figs 18and 19, the tests produced vertical accelerations of around 35milli-g, well within vertical comfort limits, while the lateralaccelerations were sometimes beyond the 20 to 40 milli-grange desirable for comfort. It is possible that higher verticalaccelerations would increase the correlation of the verticalforces.
Components of pedestrian loadingHaving quantified the modal force that causes lateral response,it is of interest to consider how the pedestrians create this exci-tation. A pedestrian generates vertical, lateral and torsionalforces, all of which could potentially excite a bridge.The pedes-trian vertical forces correspond to each footfall, and typicallyoccur at around 2.0Hz. The coupling of lateral and torsionalmodes on the Millennium Bridge make it possible for verticalforces to excite lateral response.However, the modes of interestwere between 0.5 and 1.0Hz, too low to be excited by the 2.0Hzpedestrian vertical forces.
The lateral and torsional forces both arise from alternate
foot forces.They occur at half walking frequency and are likelyto have similar phase and levels of correlation. The forces arerelated in that they are both proportional to the spacing of thefeet. It is therefore possible to assess the relative contributionof the two forces using the associated lateral and roll compo-nents of the modeshapes. Torsional input is estimated toincrease the response of the first lateral mode of the south span,which has the greatest torsional coupling,by 11%.The increas-es for the first lateral modes of the centre and north spans are6% and 3%.It was concluded that the lateral component of loadwas by far the most significant.
Pedestrian vertical loadingBased on the evidence that the vertical pedestrian forces arerandom,the vertical response should be assessed using randomvibration theory. Generally, the expected response y of a linearsystem can be related to the responses yi due to individualinputs i by the relationship:
( ) ( )E y E yi i
22
= ! ... equation 2
Assume that the i-th input force fi is applied at a frequency ωi
and the system has a natural frequency ωn, such that the rela-tive frequency ωi/ωn=ωri. If the force is applied with a modeshapefactor iz the response yi can be expressed:
( )/
yic
Kf H f
ω ωφ φ
1 21
iri ri
i i i i i2=- +
=
( ) ( ) ( )E y H E E fφi i i i2 2 2 2
= ... equation 3
If there are N such inputs with frequencies normally distributedwith a mean µ, standard deviation σ and probability densityfunction p, then the expected number of such input forces in thefrequency band ωi to ωi + dω is:
dNN
p dσ σω µ
ωi -
= d n ... equation 4
Equations 3 and 4 can be used to convert equation 2 from a dis-crete sum to the continuous integral:
( ) ( ) ( )HE y E E fN
p dφ σ σω µ
ωω
ω
0
22 2 2 -=
3
=
# d n
... equation 5
Assuming the pedestrians are uniformly distributed over thewhole span and the modeshape varies sinusoidally spatially andhas been normalised to unity:
( ) .E φ 0 52 =
Fig 17. Typical lateral force versus velocity
Fig 18.Vertical force versusvelocity - all CV5data
Fig 16. Typical vertical force versus velocity
P A P E R : D a l l a r d e t a l
27The Structural Engineer Volume 79/No 22 20 November 2001
Assuming the force varies sinusoidally temporally:
( ) .E f F0 5ω ω2 2
=
Substituting these expressions into equation 5:
( ) . HE yN
F p dσ σω µ
ω0 25
ω
ω
0
222 -
=
3
=
# d n
This is difficult to integrate other than numerically.An approx-imate solution can be obtained by assuming the responsearound the natural frequency is dominant, and taking F and pas constant with their values at the natural frequency:
( ) . dF HE yN
pσ σω µ
ω0 25n
ω
ω2
0
22n
.-
3
=
#d n
This expression includes the standard integral:
H dcK
ωπω4
n
ω 0
22=
3
=
#
Giving:
( )K
FE y
cN
pπ
σω
σω µ ω
16nn2
2n
.-
d cn m
The corresponding acceleration is approximately:
( ) ( )E a E yc
Np
MF
ωπ
σω
σω µ
16nn n ω
2 4 2
2
n. .
-d dn n
Using Fωn= 280N, µ = ωn and σ = ωn /10 this formula conserv-atively predicted the vertical responses seen in the MillenniumBridge tests.Closer agreement could be obtained by allowing forthe reduction in walking force that occurs with the reduction inwalking speed due to increased crowd density.
Pedestrian lateral loadingThe objective of the studies reported here was to provide thedata needed to solve the vibration problem on the MillenniumBridge. The following sections describe the pedestrian lateralloading theory underlying the solution.While much of what waslearnt is applicable to other bridges, aspects of the solution areparticular to the Millennium Bridge.The section discussing thegeneral approach (see later) explains why the solution is notnecessarily appropriate for other bridges and what else wouldneed to be considered in a generalised design approach.
Lateral walking force coefficientThe tests on the Millennium Bridge showed that the lateralforce generated by pedestrians is approximately proportional tothe response of the bridge. The correlated force per person canbe related to the local velocity Vlocal using a lateral walking forcecoefficient k:
F kVα local1 =
The tests indicated the value of k to be approximately300Ns/m over the frequency range 0.5 to 1.0 Hz. The i-th per-son’s contribution to the modal force is Fφ αi 1 and the localvelocity is related to the modal velocity by V Vφilocal = . The i-th person’s contribution to the modal force is therefore:
φ α φ φF kV kVi i i
21 local= =
Hence the modal excitation force generated by N people on thespan is:
kV kVFe φ φiii
i N
i
i N 22
11= =
=
=
=
=!! _ i ... equation 6
This loading model has important implications for bridgedesign, in terms of the damping requirements, the number ofusers and the effective damping that will be achieved.
Damping requirement for stabilityBecause the lateral force is proportional to the bridge response,a certain level of damping is needed if the damping force is toexceed the excitation force. Assuming the damping is linearviscous, the modal damping force is:
D = CVD = cCcritV
C MK Mω2 2crit = =
xD cM Vω2= ... equation 7
If the damping force is to exceed the excitation force:
D > Fe
>cM kω φ2 ii
i N2
1=
=
! ... from 6 and 7
>M
k
c ω
φ
2
ii
i N2
1=
=
!
Converting to frequency in Hz, the required damping is:
>fM
k
c π
φ
4
ii
i N2
1=
=
!... equation 8
This can be evaluated if the modeshape and the distribution ofpedestrians is known. Assuming the people are uniformly dis-tributed over the whole span,the number of people in the lengthdL is:
dNL
NdL=
The summation can be approximated by the continuous inte-gral:
dNL
NdLφ φ φi
i
i NN
L
00
2
1
2 2= ==
=
# #!Assuming the modeshape is sinusoidal and normalised to unity:
L
NdL
Nφ
2
L
0
2 =#
Substituting this expression for the summation in equation 8:
Fig 19.Lateral force versusvelocity - all CL1 data
P A P E R : D a l l a r d e t a l
28 The Structural Engineer Volume 79/No 22 20 November 2001
>cfM
Nk
π8… equation 9
Limiting number of peopleFor a given level of damping, the limiting number of people toavoid instability is:
Nk
cfMπ8L = … from equation 9
This formula has been derived assuming the pedestrians areuniformly distributed over the whole span and the modeshapeis sinusoidal and has been normalised to unity. The numericalcoefficient alters in other circumstances, such as in theMillennium Bridge tests where the walkers were confined toparts of the span. Allowing for the distribution of walkers, thisapproach conservatively predicted the numbers of pedestriansneeded to cause the lateral response to increase rapidly in theMillennium Bridge tests.
Effective dampingThe amplitude related correlated excitation is equivalent tonegative damping, having a critical damping ratio given by:
cfM
k
π
φ
4e
ii
i N
1
2
=- =
=
!… from equation 8
Assuming that the distribution of pedestrians remains thesame, the negative damping varies linearly with N. At NL thenegative damping equals the actual damping,making the effec-tive damping zero.The effective damping is:
c c ceff e= +
c cN
N1eff
L= -c m
If the amplitude related correlated force is the only externalforce, the response of the system will vary exponentially overtime such that the response ratio after n cycles is:
)(expA
Ancπ2
neff
0= -
If the effective damping is positive the response will decay, ifnegative the response will grow until it is limited by some othereffect, such as people deciding to stop walking.
Generalised approachThe Millennium Bridge is expected to get crowded reasonablyfrequently.The modifications are intended to provide dampingsufficient to ensure stability for a crowd density of 2 people/m2,even though the tests indicated that normal walking becomesdifficult at densities above about 1.7 people/m2. Designing forthis extreme density means the bridge should always have sig-nificant positive damping, such that the response will remaincomfortable.The pedestrian test results support this approach.Although lateral vibrations occurred from the onset, increasingwith pedestrian numbers, the acceleration amplitudesremained acceptably small provided the number of pedestrianswas less than NL by a suitable margin.
Designing for an extreme density of pedestrians avoids someof the complications that would need to be researched furtherbefore a generalised design approach could be developed.
The theoretical limiting numbers are for people who arewalking. In normal use some people would be stood still on thebridge, possibly contributing extra damping. This would havethe effect of increasing the limiting numbers that would applyin practice.No advantage has been taken of this effect in design-ing the modifications to the Millennium Bridge,but it might beappropriate to consider it in the design of other bridges.
It would be reasonable to use lower densities to designbridges which were not expected to get crowded. However thepossibility that an increase in the crowd density (either overall
or local to where the lateral modeshape was large) would leadto excessive response or instability would need to be considered.
In addition to amplitude related correlation,allowance shouldbe made for correlation due to people falling into step with eachother,or responding to visual clues such as the movement of peo-ple in front of them. Such correlation will be confined to groupsof people and will not extend over much distance.The effect willnot be significant on structures designed for use by large num-bers of people, such as the Millennium Bridge, but could be ona bridge designed for fewer people.
In addition to the amplitude related correlated force,allowance should be made for an additional random component.The Millennium Bridge is designed for use by large numbers ofpeople, making the random component negligible. Again thiswould not be the case for a bridge designed for fewer people.Onepossible way of allowing for the random component of excitationwould be to use a modified version of the approach described inthe pedestrian vertical loading model for vertical excitation,with the effective damping modified as described in the sectionon effective damping.
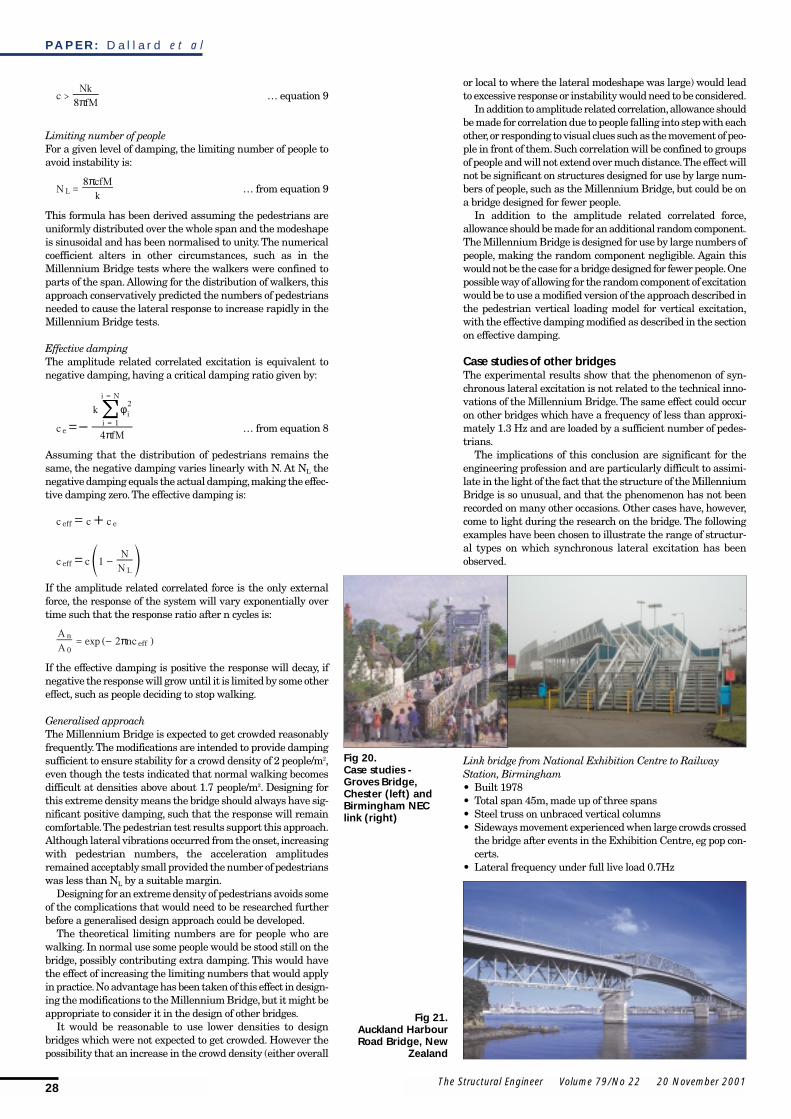
Case studies of other bridgesThe experimental results show that the phenomenon of syn-chronous lateral excitation is not related to the technical inno-vations of the Millennium Bridge. The same effect could occuron other bridges which have a frequency of less than approxi-mately 1.3 Hz and are loaded by a sufficient number of pedes-trians.
The implications of this conclusion are significant for theengineering profession and are particularly difficult to assimi-late in the light of the fact that the structure of the MillenniumBridge is so unusual, and that the phenomenon has not beenrecorded on many other occasions. Other cases have, however,come to light during the research on the bridge. The followingexamples have been chosen to illustrate the range of structur-al types on which synchronous lateral excitation has beenobserved.
Link bridge from National Exhibition Centre to RailwayStation, Birmingham• Built 1978• Total span 45m, made up of three spans • Steel truss on unbraced vertical columns• Sideways movement experienced when large crowds crossed
the bridge after events in the Exhibition Centre, eg pop con-certs.
• Lateral frequency under full live load 0.7Hz
Fig 20.Case studies -Groves Bridge,Chester (left) andBirmingham NEClink (right)
Fig 21.Auckland HarbourRoad Bridge, New
Zealand
P A P E R : D a l l a r d e t a l
29The Structural Engineer Volume 79/No 22 20 November 2001
Groves Suspension Bridge, Chester• Rebuilt in form of original 1923 structure• Total span approximately 100m,• Steel suspension structure, timber deck• Sideways movement experienced in 1977 during Jubilee river
regatta when exceptionally large crowds occupied the bridgeto view the river
North section of Auckland Harbour Road Bridge, NewZealand• Two No.two lane extensions built beside existing road bridge,
completed 1965• Span of north section 190m• Steel box girder• Sideways movement experienced in 1975 during a public
demonstration when one two lane section was closed to vehi-cles and crossed by between 2000 and 4000 demonstrators
• Lateral frequency 0.67Hz
The final example is particularly significant because it is alarge roadbridge with a conventional structure. The receivedreport of this movement could also be corroborated by a film ofthe demonstration obtained by Arup which was taken by theNew Zealand Television Channel,TVNZ.
In all of the above cases, the phenomenon was not fullyresearched or analysed, and its occurrence was not widely dis-seminated within the engineering profession.
Development of retrofit designGeneral considerationsUnless the usage of the bridge was to be greatly restricted,onlytwo generic options to improve its performance were consideredfeasible. The first was to increase the stiffness of the bridge tomove all its lateral natural frequencies out of the range thatcould be excited by the lateral footfall forces,and the second wasto increase the damping of the bridge to reduce the resonantresponse.
Lateral stiffening optionsSynchronous lateral pedestrian loading is now believed to bepossible at any frequency below about 1.3Hz.Therefore,to avoidthe possibility of resonant structural response,a minimum tar-get natural frequency of 1.5Hz for any mode with a significantlateral component was set for our studies into stiffening. Themost difficult mode to stiffen is the first lateral mode of the cen-tre span, which has a natural frequency of 0.49Hz. To achievea threefold increase in natural frequency in theory the lateralstiffness must be increased by a factor of nine, if this can be donewithout increasing the mass at the same time. In practice, any
stiffening scheme will also involve increasing the mass so thestiffening factor required is well in excess of tenfold.
Almost all of the stiffness of the main span is derived fromthe (geometric) tension stiffness of the main cables. Even if thedeck were to be fully braced between the edge tubes and theedge tubes made continuous, the natural frequency of the firstlateral mode of the centre span would only increase by a few per-cent.Making the structure a factor of 10 times stiffer cannot beachieved without considerable additional structures, involvingvery costly works that would also significantly affect the aes-thetics of the bridge.
Further, it was found that even once sufficient structure hadbeen added to move the first central lateral mode to above1.3Hz,there remained lateral-torsional modes at less than 1Hzwhich could only be removed by increasing the vertical or tor-sional stiffness of the structure by the same order as the later-al. This would necessitate a further structure, the addition ofwhich would begin to affect the liveload capacity of the existingbridge.
For these reasons a stiffening option was not favoured whenit became apparent that a much less intrusive damping-basedsolution was feasible.
Damping options Additional damping has often been used to control the resonantresponses of lively structures. A number of types of supple-mental damping are available:
• Tuned mass dampers and tuned slosh dampers• Visco-elastic dampers, fluid-viscous dampers and friction
dampers• Active control
Dampers in these three listed categories work in distinctly dif-ferent ways.Tuned mass and tuned slosh dampers are inertialdevices that are attached to single points on a structure.Visco-elastic, fluid-viscous and friction dampers are energy-dissipat-ing structural elements that operate on relative movements,and are therefore connected between two points on a structure.Active Control uses computer-controlled powered componentsof either an inertial or ‘stiffness’ type to apply forces to thestructure to counteract the vibration. All of these options wereconsidered for the bridge.
Description of schemeThe solution that has been developed is based on an assumedload of 2 active walkers/m2 over the entire bridge. This is con-sidered conservative since our tests showed that at over 1.7walkers/m2, the force from pedestrians reduces owing to the dif-
23 24 25 26
1
12
4325 6 7 8 9 10 11 13
SwissBankHouse
14 15 16 17 18 19 20 21
22
27 28 29 30 31
32
33 34 35 36 37 38 39 40 41 42 43 44
45
1 2 3 4 5 6 7 8 9 10 11
12
13 14 15 16 17 18 19 20 21
22
23 24 25 26 27 28 29 30 31
32
33 34 35 36 37 38 39 40 41 42 43 44 45
Tate Gallery ofTate Gallery ofTModern Art
City ofLondonSchool
ELEVATION
PLAN SHOWING CHEVRON BRACING FOR TRANSVERSE VISCOUS DAMPERS
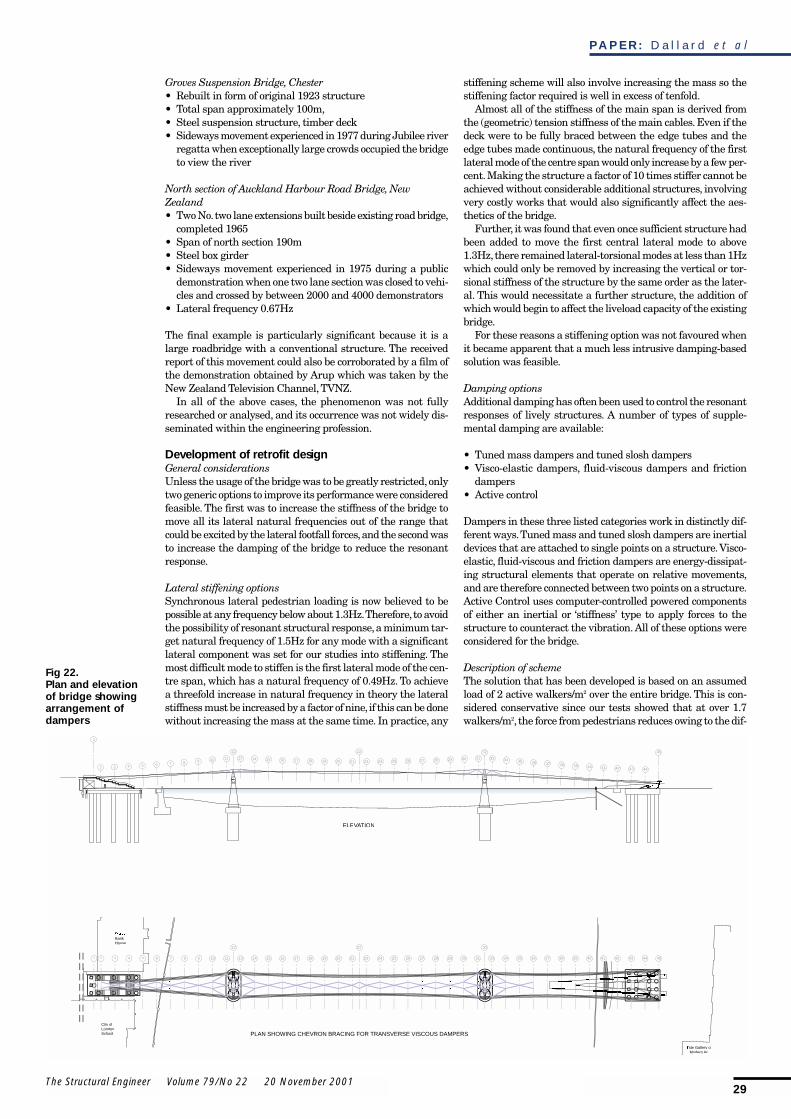
Fig 22.Plan and elevationof bridge showingarrangement ofdampers
P A P E R : D a l l a r d e t a l
30 The Structural Engineer Volume 79/No 22 20 November 2001
ficulty that they have walking in such close proximity.The priorities in finding a solution were:
• To reduce the movements to an acceptable level• To minimise the maintenance implications of the modifica-
tions• To maintain the slim appearance of the bridge, in particular
to keep the slim elevation.
Design issuesThe development of the scheme was driven by a number of spe-cific considerations:
• Achievement of adequate damping levels and small ampli-tudes of bridge
• Limiting weight added to bridge• Durability, fatigue and maintenance.
The impact of these issues is addressed briefly in the followingsections.
The damping levels required were not known at the earlystages of the design, and attention was given to identifying theforms that might lead to the largest achievable damping withminimum impact to the bridge. A broad target was set at15%–20% of critical damping for the lateral and lateral-tor-sional modes based on an estimation of the reduction inresponse that might be required relative to that observed onopening day, and 5-10% for the vertical/torsional modes. The
need for vertical and torsional damping is discussed later.It was found very early in the design process that fluid vis-
cous dampers placed in a ‘bracing’ pattern under the deck pro-vided an efficient source of damping.The components are lightand small, and because they do not need frequency tuning, canprovide damping in several modes at once.The main initial con-cern was whether they would operate in a satisfactory mannerat small amplitudes, given the influence of friction in the seals,compressibility of the damping fluid and possible ‘play’ in thebearings and connecting structure. It was considered essentialthat the required damping should be achieved when the accel-eration response of the bridge was less than 20 milli-g. Formodes at 1Hz this corresponds to a peak span deflection of only10mm, and so the strokes of the individual dampers would beof the order of a millimetre during normal operation.
A number of manufacturers were able to demonstrate thattheir dampers would operate at amplitudes of less that 0.5mm.The damper selected for the final scheme is a low friction fluid-
viscous damper manufactured by Taylor Devices Inc. This is aspecial precision damper, originally developed for space appli-cations where zero friction and zero fluid (and vapour) leakagewere demanded.These attributes are achieved by the incorpo-ration of a metal concertina form of seal between the body andthe pistonrod/actuating rod. Although low friction is advanta-geous in this application, the decision to adopt this device typewas ultimately made on the grounds of its maintenance-freeoperation.
Tuned mass dampers were also examined initially, as theseare a ‘conventional’ fix for bridges with excessive vibration. Anumber of limitations became apparent very quickly.There arein all eight modes (two lateral, four vertical, two torsional) thatwould require damping in the centre span alone. Every modeneeds its own mass tuned to the modal frequency. Large mass-es would be needed and therefore the total weight added to thebridge would be high.Although the mass required might not bea concern for strength,the deflection of the main span would beconsiderable,and navigation clearances would be compromised.
In the final design some tuned mass dampers are used sincethere is no suitable load-path in which to introduce viscousdampers for the vertical modes of the main span.
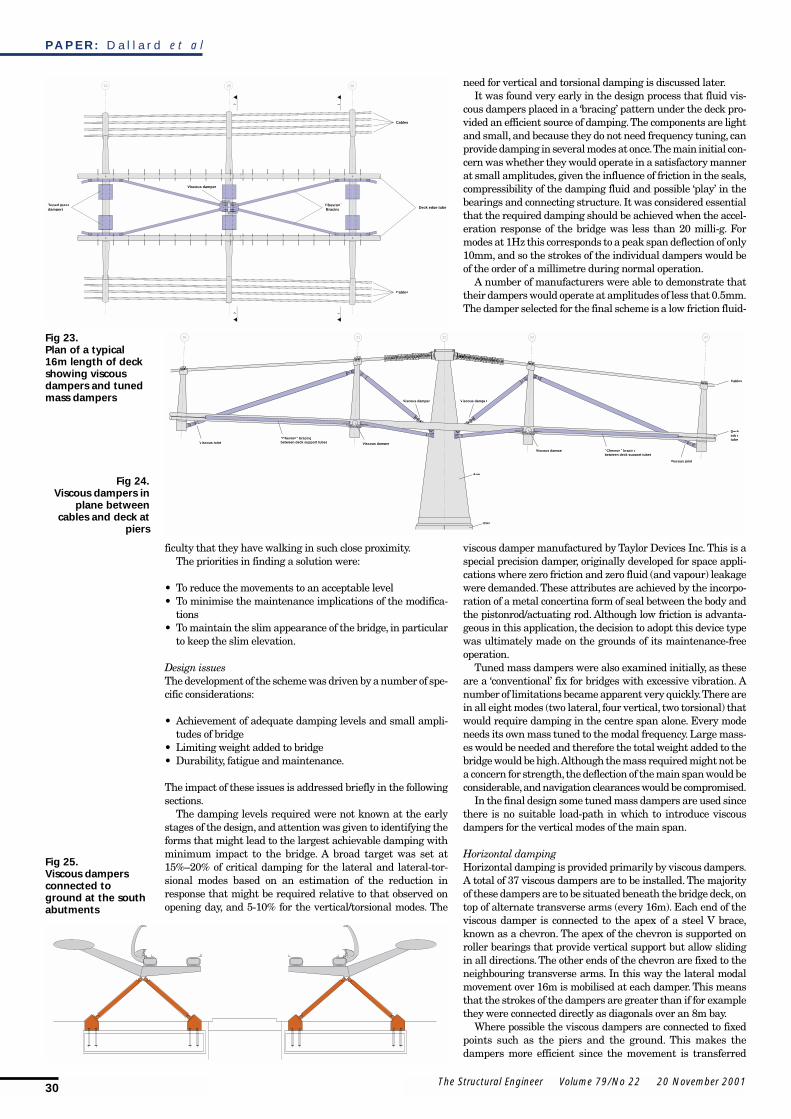
Horizontal dampingHorizontal damping is provided primarily by viscous dampers.A total of 37 viscous dampers are to be installed. The majorityof these dampers are to be situated beneath the bridge deck,ontop of alternate transverse arms (every 16m). Each end of theviscous damper is connected to the apex of a steel V brace,known as a chevron. The apex of the chevron is supported onroller bearings that provide vertical support but allow slidingin all directions. The other ends of the chevron are fixed to theneighbouring transverse arms. In this way the lateral modalmovement over 16m is mobilised at each damper. This meansthat the strokes of the dampers are greater than if for examplethey were connected directly as diagonals over an 8m bay.
Where possible the viscous dampers are connected to fixedpoints such as the piers and the ground. This makes thedampers more efficient since the movement is transferred
3330 31 32 34
Cables
“Chevron” bracingbetween deck support tubes
Deckedgetube
Arm
Pier
“Chevron” bracingbetween deck support tubes
Viscous damper
Viscous damperViscous joint
Viscous damper Viscous damper
Viscous joint
262524
Tuned massdampers
Viscous damper
“Chevron”Bracing
22
11
Deck edge tube
Cables
Cables
Fig 23.Plan of a typical16m length of deckshowing viscousdampers and tunedmass dampers
Fig 24.Viscous dampers in
plane betweencables and deck at
piers
Fig 25.Viscous dampersconnected toground at the southabutments
P A P E R : D a l l a r d e t a l
31The Structural Engineer Volume 79/No 22 20 November 2001
directly into the damper stroke rather than via a structurewhich is itself subject to deformation.There are viscous dampersin the plane between the cables and the deck at the piers.Theseprovide vertical and horizontal damping. In addition, a pair ofdampers are located to each side of the approach ramp on thesouth abutment. These provide damping primarily for the lat-eral and lateral-torsional modes on the south span.
On the assumption that the effective pedestrian input forceis linearly related to the velocity of the bridge, the greatestdamping requirement is for the lowest frequency mode.The firstcentral lateral mode has a frequency of 0.49Hz and this resultsin a damping requirement of over 20% of critical damping forthe loading assumed. In order to achieve this value of dampingit has been necessary to add 4 No. pairs of lateral tuned massdampers to the central span. Each of these dampers comprisesa mass of 2.5t hung by a double pendulum at each corner.A steelpaddle is attached to the mass and this paddle sits in a pot ofviscous fluid which itself is attached to the transverse arm of thebridge. Damping is therefore generated when the mass movesrelative to the transverse arms.
Vertical dampingThe Millennium Bridge did not respond excessively in the ver-tical direction on the opening day, and, as shown above, ourmeasurements during crowd walking tests indicate that verti-cal force input from pedestrians is random rather than corre-lated.Some researchers have nevertheless suggested that syn-chronous pedestrian vertical loading is also possible and hasbeen observed elsewhere.The possibility was therefore consid-ered that, once excessive lateral motions had been suppressedby provision of lateral damping,pedestrians might find the ver-tical motions of the bridge more noticeable, and synchronisewith them.
Stiffening the bridge vertically to raise the first mode fre-quency by a factor of five from 0.5Hz to over 2.5Hz to avoid res-onance with vertical walking forces is even more difficult thanachieving the threefold increase required in the lateral fre-quency. A damping approach was therefore also adopted as aprecaution against possible excessive vertical motions.
Vertical damping is provided primarily by vertical tunedmass dampers. A total of 26 pairs of vertical tuned massdampers will be installed over the three spans of the bridge.These comprise masses of between 1 and 3t supported on com-pression springs.As with the lateral tuned mass dampers, vis-cous damping is provided by the presence of a paddle connect-ed to the mass and suspended in a pot of viscous fluid connectedto the transverse arm.
The tuned mass dampers are situated on top of the trans-verse arms beneath the deck. They are arranged along thelength so that they are at or close to the antinodes of the modesthat they are damping.
MaintenanceThe frequency of inspections for the modifications is the sameas that for the original bridge,and follows the recommendationsset out by the Highways Agency.
The viscous dampers and the tuned mass dampers are locat-ed below sections of the deck that can be removed from above.This enables inspection to take place largely from the deck.
The viscous dampers are covered by a 35-year warranty fortheir internal parts. They require no maintenance during thisperiod,other than repainting which is at the same frequency asthe existing structure.
The tuned mass dampers are warranted for a first mainte-nance after 10 years provided that the 2-yearly spot inspectionsrecommended by the Highways Agency are carried out.The vis-cous damper unit on the tuned mass dampers can be accessedfrom above and lifted out to be maintained or replaced.
Quantification and optimisation of the schemeThe benefit of introducing a scheme of dampers cannot be eval-uated using conventional structural engineering software.Themain viscous dampers and elements of the tuned mass dampersare energy-dissipating components which respond to loadingwith a force proportional to relative velocity between their endsrather than relative displacement. There is an optimum valuefor the damping rate of each component. If the element is too‘soft’ it will clearly not dissipate much energy,but also if it is too‘stiff’, then the deflection across it will be small and it will notdissipate much energy either. The scheme was optimised byexamination of the best locations at which to place dampers,their optimum damping rates, the appropriate stiffnesses forthe additional chevron elements and the best masses,dampingrates and tuning frequencies for the tuned mass dampers.Thedesign development and optimisation was undertaken usingthe MSC-NASTRAN finite element program. The compress-ibility of the damper fluid was modelled as a series spring inNASTRAN. However, the non-linear effects of friction and playin the bearings could not be modelled. These effects wereanalysed separately using an approximate iterative methodand were shown to only be significant at very small bridgeamplitudes.
The optimisation study examined the complex modes (themodeshapes are altered by the viscous components) of thedamped system and the frequency response functions of thebridge under distributed lateral and vertical dynamic pedes-trian loading patterns.
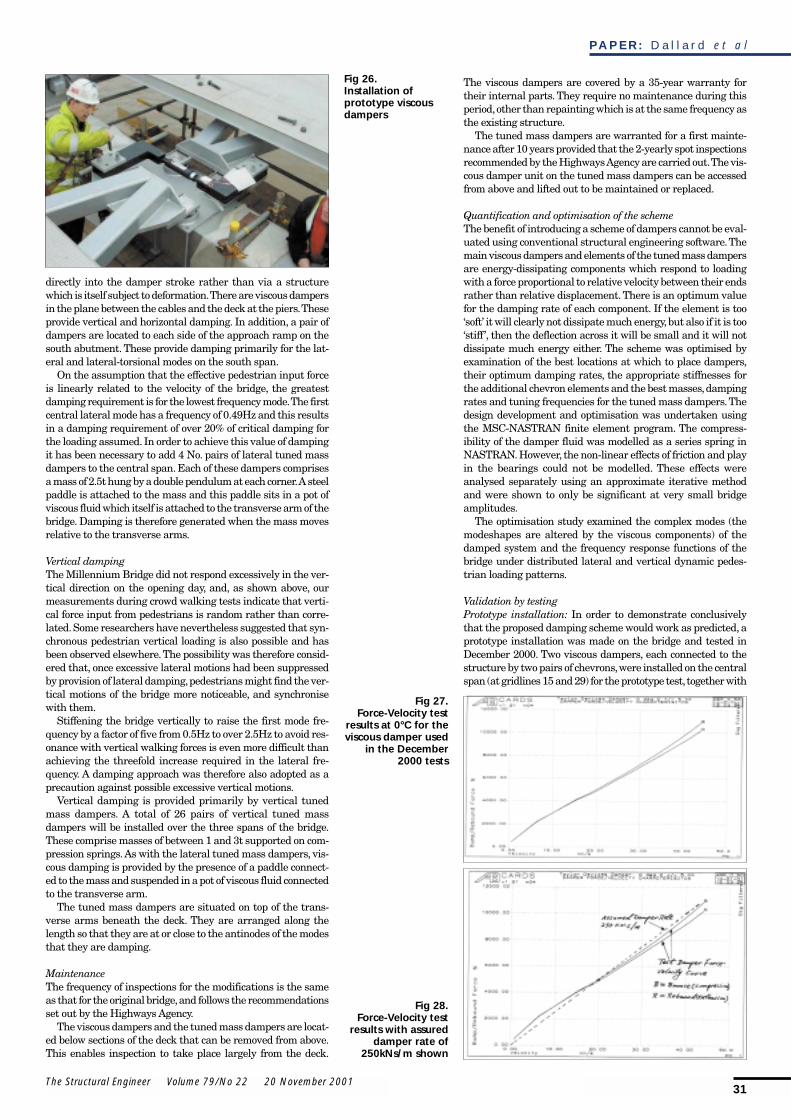
Validation by testingPrototype installation: In order to demonstrate conclusivelythat the proposed damping scheme would work as predicted, aprototype installation was made on the bridge and tested inDecember 2000. Two viscous dampers, each connected to thestructure by two pairs of chevrons,were installed on the centralspan (at gridlines 15 and 29) for the prototype test,together with
Fig 26.Installation ofprototype viscousdampers
Fig 27.Force-Velocity test
results at 0°C for theviscous damper used
in the December2000 tests
Fig 28.Force-Velocity test
results with assureddamper rate of
250kNs/m shown
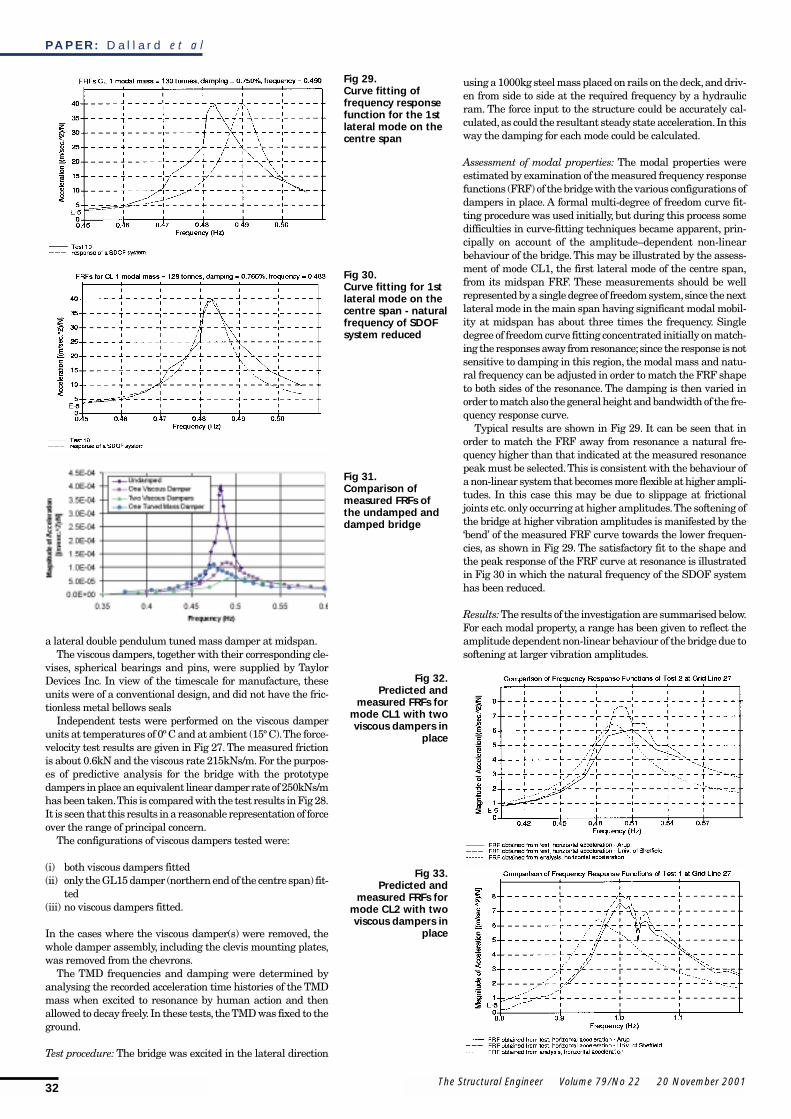
using a 1000kg steel mass placed on rails on the deck,and driv-en from side to side at the required frequency by a hydraulicram. The force input to the structure could be accurately cal-culated,as could the resultant steady state acceleration.In thisway the damping for each mode could be calculated.
Assessment of modal properties: The modal properties wereestimated by examination of the measured frequency responsefunctions (FRF) of the bridge with the various configurations ofdampers in place. A formal multi-degree of freedom curve fit-ting procedure was used initially, but during this process somedifficulties in curve-fitting techniques became apparent, prin-cipally on account of the amplitude–dependent non-linearbehaviour of the bridge. This may be illustrated by the assess-ment of mode CL1, the first lateral mode of the centre span,from its midspan FRF. These measurements should be wellrepresented by a single degree of freedom system,since the nextlateral mode in the main span having significant modal mobil-ity at midspan has about three times the frequency. Singledegree of freedom curve fitting concentrated initially on match-ing the responses away from resonance;since the response is notsensitive to damping in this region, the modal mass and natu-ral frequency can be adjusted in order to match the FRF shapeto both sides of the resonance. The damping is then varied inorder to match also the general height and bandwidth of the fre-quency response curve.
Typical results are shown in Fig 29. It can be seen that inorder to match the FRF away from resonance a natural fre-quency higher than that indicated at the measured resonancepeak must be selected.This is consistent with the behaviour ofa non-linear system that becomes more flexible at higher ampli-tudes. In this case this may be due to slippage at frictionaljoints etc. only occurring at higher amplitudes.The softening ofthe bridge at higher vibration amplitudes is manifested by the‘bend’ of the measured FRF curve towards the lower frequen-cies, as shown in Fig 29. The satisfactory fit to the shape andthe peak response of the FRF curve at resonance is illustratedin Fig 30 in which the natural frequency of the SDOF systemhas been reduced.
Results:The results of the investigation are summarised below.For each modal property, a range has been given to reflect theamplitude dependent non-linear behaviour of the bridge due tosoftening at larger vibration amplitudes.
P A P E R : D a l l a r d e t a l
32 The Structural Engineer Volume 79/No 22 20 November 2001
a lateral double pendulum tuned mass damper at midspan.The viscous dampers, together with their corresponding cle-
vises, spherical bearings and pins, were supplied by TaylorDevices Inc. In view of the timescale for manufacture, theseunits were of a conventional design, and did not have the fric-tionless metal bellows seals
Independent tests were performed on the viscous damperunits at temperatures of 0º C and at ambient (15º C).The force-velocity test results are given in Fig 27. The measured frictionis about 0.6kN and the viscous rate 215kNs/m. For the purpos-es of predictive analysis for the bridge with the prototypedampers in place an equivalent linear damper rate of 250kNs/mhas been taken.This is compared with the test results in Fig 28.It is seen that this results in a reasonable representation of forceover the range of principal concern.
The configurations of viscous dampers tested were:
(i) both viscous dampers fitted(ii) only the GL15 damper (northern end of the centre span) fit-
ted (iii) no viscous dampers fitted.
In the cases where the viscous damper(s) were removed, thewhole damper assembly, including the clevis mounting plates,was removed from the chevrons.
The TMD frequencies and damping were determined byanalysing the recorded acceleration time histories of the TMDmass when excited to resonance by human action and thenallowed to decay freely. In these tests, the TMD was fixed to theground.
Test procedure: The bridge was excited in the lateral direction
Fig 33.Predicted and
measured FRFs formode CL2 with twoviscous dampers in
place
Fig 32.Predicted and
measured FRFs formode CL1 with twoviscous dampers in
place
Fig 29.Curve fitting offrequency responsefunction for the 1stlateral mode on thecentre span
Fig 30.Curve fitting for 1stlateral mode on thecentre span - naturalfrequency of SDOFsystem reduced
Fig 31.Comparison ofmeasured FRFs ofthe undamped anddamped bridge
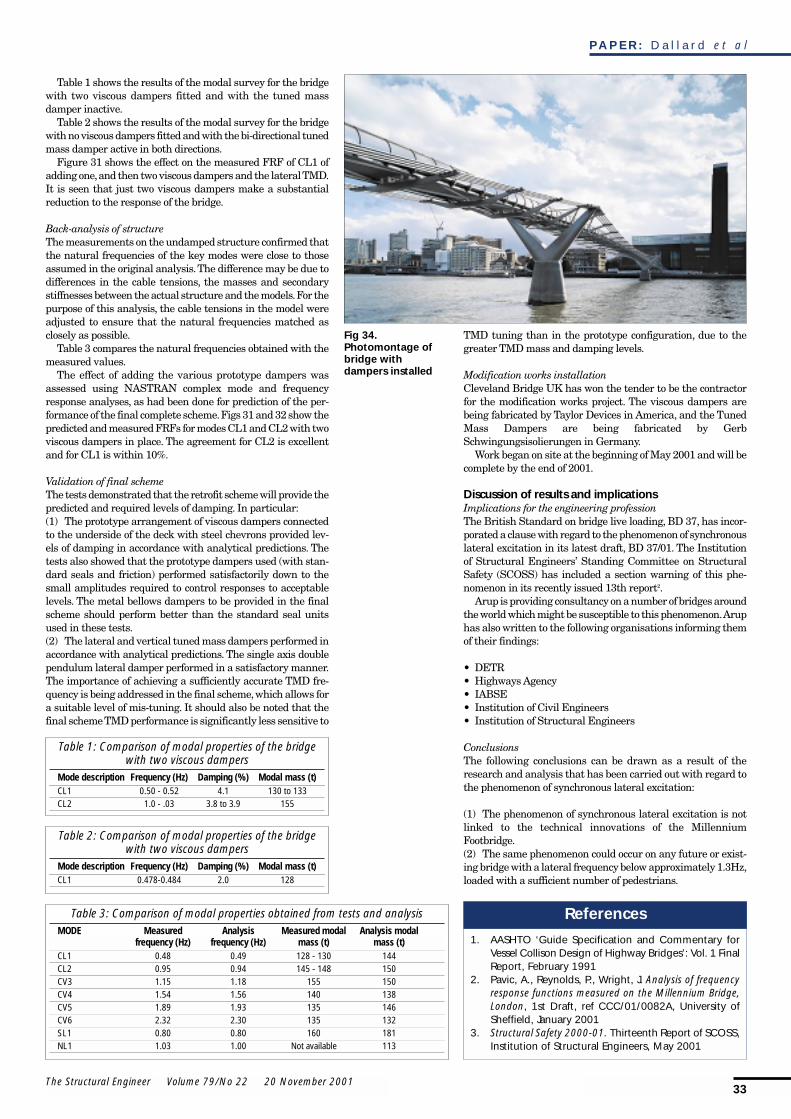
P A P E R : D a l l a r d e t a l
33The Structural Engineer Volume 79/No 22 20 November 2001
Table 1 shows the results of the modal survey for the bridgewith two viscous dampers fitted and with the tuned massdamper inactive.
Table 2 shows the results of the modal survey for the bridgewith no viscous dampers fitted and with the bi-directional tunedmass damper active in both directions.
Figure 31 shows the effect on the measured FRF of CL1 ofadding one,and then two viscous dampers and the lateral TMD.It is seen that just two viscous dampers make a substantialreduction to the response of the bridge.
Back-analysis of structureThe measurements on the undamped structure confirmed thatthe natural frequencies of the key modes were close to thoseassumed in the original analysis.The difference may be due todifferences in the cable tensions, the masses and secondarystiffnesses between the actual structure and the models.For thepurpose of this analysis, the cable tensions in the model wereadjusted to ensure that the natural frequencies matched asclosely as possible.
Table 3 compares the natural frequencies obtained with themeasured values.
The effect of adding the various prototype dampers wasassessed using NASTRAN complex mode and frequencyresponse analyses, as had been done for prediction of the per-formance of the final complete scheme.Figs 31 and 32 show thepredicted and measured FRFs for modes CL1 and CL2 with twoviscous dampers in place. The agreement for CL2 is excellentand for CL1 is within 10%.
Validation of final schemeThe tests demonstrated that the retrofit scheme will provide thepredicted and required levels of damping. In particular:(1) The prototype arrangement of viscous dampers connectedto the underside of the deck with steel chevrons provided lev-els of damping in accordance with analytical predictions. Thetests also showed that the prototype dampers used (with stan-dard seals and friction) performed satisfactorily down to thesmall amplitudes required to control responses to acceptablelevels. The metal bellows dampers to be provided in the finalscheme should perform better than the standard seal unitsused in these tests.(2) The lateral and vertical tuned mass dampers performed inaccordance with analytical predictions. The single axis doublependulum lateral damper performed in a satisfactory manner.The importance of achieving a sufficiently accurate TMD fre-quency is being addressed in the final scheme,which allows fora suitable level of mis-tuning. It should also be noted that thefinal scheme TMD performance is significantly less sensitive to
TMD tuning than in the prototype configuration, due to thegreater TMD mass and damping levels.
Modification works installationCleveland Bridge UK has won the tender to be the contractorfor the modification works project. The viscous dampers arebeing fabricated by Taylor Devices in America, and the TunedMass Dampers are being fabricated by GerbSchwingungsisolierungen in Germany.
Work began on site at the beginning of May 2001 and will becomplete by the end of 2001.
Discussion of results and implicationsImplications for the engineering professionThe British Standard on bridge live loading, BD 37, has incor-porated a clause with regard to the phenomenon of synchronouslateral excitation in its latest draft, BD 37/01. The Institutionof Structural Engineers’ Standing Committee on StructuralSafety (SCOSS) has included a section warning of this phe-nomenon in its recently issued 13th report2.
Arup is providing consultancy on a number of bridges aroundthe world which might be susceptible to this phenomenon.Aruphas also written to the following organisations informing themof their findings:
• DETR• Highways Agency• IABSE• Institution of Civil Engineers• Institution of Structural Engineers
ConclusionsThe following conclusions can be drawn as a result of theresearch and analysis that has been carried out with regard tothe phenomenon of synchronous lateral excitation:
(1) The phenomenon of synchronous lateral excitation is notlinked to the technical innovations of the MillenniumFootbridge.(2) The same phenomenon could occur on any future or exist-ing bridge with a lateral frequency below approximately 1.3Hz,loaded with a sufficient number of pedestrians.
1. AASHTO ‘Guide Specification and Commentary forVessel Collison Design of Highway Bridges’: Vol. 1 FinalReport, February 1991
2. Pavic, A., Reynolds, P., Wright, J. Analysis of frequencyresponse functions measured on the Millennium Bridge,London, 1st Draft, ref CCC/01/0082A, University ofSheffield, January 2001
3. Structural Safety 2000-01. Thirteenth Report of SCOSS,Institution of Structural Engineers, May 2001
ReferencesTable 3: Comparison of modal properties obtained from tests and analysisMODE Measured Analysis Measured modal Analysis modal
frequency (Hz) frequency (Hz) mass (t) mass (t)CL1 0.48 0.49 128 - 130 144CL2 0.95 0.94 145 - 148 150CV3 1.15 1.18 155 150CV4 1.54 1.56 140 138CV5 1.89 1.93 135 146CV6 2.32 2.30 135 132SL1 0.80 0.80 160 181NL1 1.03 1.00 Not available 113
Table 1: Comparison of modal properties of the bridgewith two viscous dampers
Mode description Frequency (Hz) Damping (%) Modal mass (t)CL1 0.50 - 0.52 4.1 130 to 133CL2 1.0 - .03 3.8 to 3.9 155
Table 2: Comparison of modal properties of the bridgewith two viscous dampers
Mode description Frequency (Hz) Damping (%) Modal mass (t)CL1 0.478-0.484 2.0 128
Fig 34.Photomontage ofbridge withdampers installed