The Liveability Index 2010 - indiaenvironmentportal · The Liveability Index 2010 hopes to offer a...
59
Transcript of The Liveability Index 2010 - indiaenvironmentportal · The Liveability Index 2010 hopes to offer a...
The Liveability Index 2010
a mapping of 37 cities of India
A CII – Institute for Competitiveness Report

The Liveability Index 2010
2

Contents
Foreword
Executive Summary
The Liveability Index Report
1.0 Introduction
2.0 Methodology
2.1 Measurement of Index
2.2 Identifying and Grouping Indicators
2.3 Calculating and interpreting the index
3.0 Defining liveability
3.1 Economic Environment and Standard of living
3.2 Socio-Culture Environment
3.3 Education
3.4 Health and Medical standard
3.5 Natural Environment
3.6 Public services
3.7 Recreational Possibilities
3.8 Consumer goods
3.9 Housing Options
4.0 Cities: A Current Case
5.0 Results and Recommendation
Appendices

The Liveability Index 2010
4

Foreword
Cities have strongly emerged as the prime engines of the Indian economy and generators of
national wealth…the future is inescapably urban.
With a total urban population of 285 million and 35 metropolitan cities and metropolises,
India's urban issues with all their related challenges and opportunities demand their firm
place on the national agenda
India is launching her campaign for good urban governance at one of the most radical
turning points in the demographic history of mankind. The entire developing world is
witness to an unprecedented shift of human settlements to the cities. While India’s
population remains substantially rural, she is emerging as one of the fastest urbanizing
countries in the world, and has already a staggeringly large urban population, around 285
million. It is estimated that by the middle of this century or probably earlier, she would
reach the same milestone that the world reached at the beginning of this century - of
becoming more urban than rural. The economic base of the nation through expanding
industries, trade, commerce and services has already shifted to the urban centres. Cities
have strongly emerged as the prime engines of the Indian economy and generators of
national wealth. It is evident, looking at the past fifty years of India, and the empirical
evidence around the world, that the future of India is inescapably urban. As the National
Commission on Urbanization stated, urbanization is the inevitable concomitant of economic
change. It is time for us to treat urbanization as a positive, historical force and care for our
urban centres. It is time that the nation perforce invests in the destined social and
economic functions of cities and ensures that cities deliver a quality of life that would
enable them to become national assets and engines of economic growth.
India’s overall demographic figures of rural-urban divide do not reveal the fact that a
sizeable part of the country has reached levels of urbanization that are much higher than
the national average. Among the larger States, the States of Tamil Nadu and Maharashtra
are very close to the halfway mark and the States of Gujarat and Karnataka are substantially
urbanized. The smaller States of Delhi and Mizoram and Goa are wholly or predominantly
urban, and so are some of the Union Territories. Even Uttar Pradesh, West Bengal, Andhra
Pradesh, Madhya Pradesh, Rajasthan, Bihar and Punjab that are predominantly rural States
have very large urban populations. The graph of metropolitan and mega cities has continued
to climb and 35 such cities now dot the Indian landscape. And scores of cities with
populations in excess of 100,000 are jostling to join the million-plus city club. These
unambiguous facts that stare us in the face clearly demand that the country's urban
portfolio is large enough to merit serious concern. India's urban issues with all their related
challenges and opportunities demand their firm place on the national agenda and the
Nation and urbanized States need to lead in strategizing for cities and their needs.

With 30 per cent of India already living in town and cities, it is projected that in the next 2
decades nearly half of India would be living in urbanized areas. A major challenge would be
to developing new cities especially tier 2 and 3 cities as alternate hubs for commercial
activity and migration. This becomes more important by looking at the fact that the present
metros are reeling under severe resource and infrastructure crunch.
In order to gauge a better understanding of the macro environment of the sector, a study
was conducted by Knowledge partner – Institute of Competitiveness, India to measure the
Liveability Index mapping of 37 Cities of India. The report looks at some of the themes of the
Conference. The conference will take the discussion to a new level in what promises to be
an event that will have an impact for years to come on the urban debate. Some of the
debates would look at urban mobility, diversity, environment, social development, new
business models for making impact on liveability of cities et al.
CII has been actively involved with the Infrastructure sector addressing their key issues
relating to policy matters and developing a road map for the growth of this sector. As part of
its initiatives, CII organises various focused interactions, seminars and conferences to
provide a platform for deliberations. International Conference on Competitive Cities is one
such initiative.
We thank all data authorities associated with the study for their vital inputs. We not only
hope you would find the report enriching and meaningful, but that actionabilities shall arise
as triggered by revelations in the Liveability Index 2010 Report.
I look forward to your views on the report.
Pradeep Singh
Chairman, Infrastructure Sub – Committee, CII Northern Region &
Managing Director, IDFC Projects Ltd

It is time to begin asking questions.
And communicating firmly, through all available fora and platforms, that only genuine
answering would be appreciated.
Question 1: Why are our cities lagging on liveability standards vis-à-vis international cities?
Question 2: What is the understanding of policy makers and those in governance, of issues
besetting our cities? Are they aware of the factual position? Do they have a generic grasp or
an analytical insight into state of the cities?
Question 3: What roadmaps are being evolved to excel on global standards?
The Liveability Index 2010 hopes to offer a structured delving into this vital aspect of our
living. It focuses on presenting a powerful model that comprehensively maps a city's
liveability quality. The multitude of pillars and constituent sub-pillars show the truth,
unmasked and measurable.
The onus is now on the accountable to show appreciation in the various sub-indices. And
this would happen only with realistic soul searching and acknowledging the uniqueness each
city carries in its kernel, in its past and in the expectations of its present denizens.
Happy evolving!
Dr Amit Kapoor
Chairman
Institute for Competitiveness

The Liveability Index 2010
8

Executive Summary
The Liveability Index 2010 is a methodical comment on quality of living conditions our cities
offer. Rather than approach the issue monolithically, the report undertakes a statistically
robust splintering of the liveability into multiple dimensions. It relies on entirely objective
analysis, employing more than 300 indicators on a 10 year time line series. It has no
prejudice color up the findings as usually happens in survey-based analysis; no subjectivity
touches the inputs and processing, even the weights have been computed by application of
Principal Component Analysis, eliminating multi-collinearity.
The model is an evolved adaptation of the world renowned diamond model of Prof Michael
Porter of Harvard University.
The 37 cities studied here have been ranked on these pillars and their 20 constituent sub-
pillars; they can identify nearest performing ones for ameliorating their lot or set truly
aspirational benchmarks. This is the path to India's prosperity.
Natural
Built/Planned
Environment
Economic
Environment
Pillar
Socio-cultural
Political
Environment
Pillar
Housing
Options
Pillar
Safety
Pillar
Health and
Medical
Standards
Pillar
Education
Pillar
Demographics
Pillar
Overall
Liveability
Index

The Liveability Index 2010
1
The Liveability Index Report
1.0 Introduction
In the rush to be among the top in the growth race, development loses its scope as
regions prosper monetarily but leave behind a crucial aspect of their essence. In the
midst of pollution and congestion, cities become the board of machines and
industries while the intended residents suffer in environmental and social neglect.
The liveability of cities is severely challenged as they trace a path of GDP growth
rates forged with a policy that takes the quality of life to extremes leaving little
scope for sustaining the development though a disgruntled residence and hence,
industry.
The Quality of Life Index is an annual study of key factors that determine the degree
of liveability of cities in India. The mission of the Index is to measure significant
drivers of the health and wealth of the community that reach beyond the monetary
value that drive the economy to the overall health and welfare of the residents.
Cities are under constant supervision of people and companies alike. Contrary to
popular belief, the four metropolitans are facing stiff competition as residents and
people are pacing high standards on their requirements. Residents have the requisite
purchasing power at their disposal to look for not just a suitable house but a
desirable location.
Quality of life is being given more importance than before as residents and
businesses search for alternatives giving them an option to cut costs. Expense needs
to be coupled with a good infrastructure and in the Indian cities especially,
continued availability of the basic amenities like water, road and power. Cities in
India may be charting high growth rates; however, living in these cities is not
synonymous to the economic viability of the location. Industries are likewise probing
for regions that keep their cost of business low. Lack of power or congestion not only
increase their operational costs but lead to dissatisfied employees who need to
settle in these regions.
The Index provides insight into the quality of life available to people and provides
evidence on the future state of the city in terms of its liveability. The index is a
composite measure of the social, environmental, economic and civic factors that
directly determine the willingness of a citizen to reside in a city and hence, the
potential of the city to attract human resource and consequently industry.
Liveability has received more emphasis lately due to the degrading condition of
standards of living in the top metropolitans. While they may be the best cities
offered by India, the congestion, pollution, lack of infrastructure, power or even

The Liveability Index 2010
2
water undermine the efforts of the cities to scale on global standards. The Index is a
tool to first gauge this liveability, and then to guide informed decisions to shape the
future of the city.
This index is a novel effort at bringing growth and development into a common
perspective and its novelty is no less given its first appearance in the economic
literature of India. The 2010 Index is made up of the most recent data sets collected
and is reflective of the current state of the economy of the top cities of India. The
true value of the Index is in providing clear, statistical evidence of trends. The Index
primarily sources data from organizations like CMIE.
It is important to note the difference between indexing and ranking. Both indexing
and ranking involve the tracking of consistently measured data. Ranking, however,
compares unique data sets to each other periodically, whereas indexing measures
the change of comparable data sets to each other over time. It is the change factor
of indexing that gives us an accurate view of our position relative to other
comparable cities. Indexing is an excellent tool to monitor change and the purpose
of the index is to create a set of annual studies.
Two of the features of the Index are that it calculates the absolute change as well as
the relative rate of change. This relative rate of change is designed not only to show
whether a measurement increased or decreased, but more importantly, how fast it
changed in comparison to the rate of change in the other cities.
The goal of using this format is to make the Index simple and understandable. The
Index strives to maintain the highest level of data integrity. Behind the charts, there
are a variety of mathematical calculations, and innumerable data sources were used
in the compilation of this report. The purpose of the study is to provide the residents
and the industry with a comprehensive measure to gauge a region on its quality of
life to make a more informed decision when choosing their destinations for housing
or operations. There are options galore but no single criterion to act discriminator
between the various regions. The index is a combination of the various indices and
indicators to assess the cities on all the necessary criteria and aid future settlers to
evaluate each city objectively.
Businesses understand the necessity to measure whatever you want to improve; and
these improvements can be carried on only those factors that are measured. This
truism can be applied at the policy level. The Quality of Life Index is first and
foremost a unique quantitative and qualitative measurement tool that allows for the
measurement of “liveability” annually. It identifies those areas where progress is
being made or maintained and areas where we need to be vigilant and allocate

The Liveability Index 2010
3
resources to improve. The relative rate of change and where we rank is of significant
importance.
2.0 Methodology
People throughout the world expect their local, state, and central governments to
improve the social, economic, and environmental conditions within their
jurisdictions. To this end, government officials and academic researchers have
sought to develop various indices in order to gauge progress, to make comparisons
between and among different cities, regions, and countries, and to measure the
impact of government policies. A Quality of Life index is a system that monitors
quality of life for a given environment using carefully selected social, economic, and
environmental indicators. These indicators ultimately help to measure different
aspects of society. While there is a consensus that improving quality of life at any
geographic scale is a laudable goal, there is no consensus about what constitutes the
most appropriate index or set of indices. Consequently, there is now a veritable
cottage industry for the development of such quality of life or liveability indices.
These indicators must accurately represent the social, environmental, and economic
needs of the community. By monitoring these important indicators, policy makers
and officials can make better-informed decisions about how to address problems
within their domains.
An indicator is “a measurement that reflects the status of some social, economic, or
environmental system over time. Generally, an indicator focuses on a small,
manageable, tangible, and telling piece of a system to give people a sense of the
bigger picture’’. Meaningful and useful indicators reflect both desirable and
measurable outcomes. Indicator creators expect the indicators to simplify complex
data sets and provide a clear perspective of the bigger picture. Indicators
communicate trends in a community and provide an opportunity for a community to
make essential changes. Without indicators, quantitatively measuring the progress
of a community and make the necessary changes to improve the council’s services is
impossible.
Indicators must be relevant to measure a community’s quality of life. The index’s
ability to communicate trends enables the production of positive changes through
public actions and decision-making. The community should be able to alter the
underlying variable or condition that the indicator measures, through such changes
as innovative laws, altered distribution of funds, or public action. A high-quality
indicator should monitor city conditions in order to aid city officials in anticipating
and accommodating for future trends in the attributes index. With strong indicators,
a government has the ability to create positive change. Indicators must have the
ability to communicate quality of life issues to the majority of citizens. People of the
The Liveability Index 2010
4
community need to be able to relate indicator trends to their own lives that allow
them to make constructive changes.
When collecting data for indicators, one must consider the availability and
consistency of the data. The levels of availability and validity of data can often limit
which indicators a community can use. Weak data sources can inhibit indicators from
aiding a government in monitoring important trends. When an indicator meets all
the guidelines, one considers the indicator as a valid measure of quality of life for a
given community. The study uses hard data collected from reliable sources to
eliminate the possibility of personal bias or a sampling error obscuring the reality
and giving a coloured picture based on faulty human perception. To uphold reliability
and validity, the data was collected from public organizations and institutes engaged
in the collection of statistics, information and summations. CMIE and CSO a few
noteworthy names that bring confidence in our assessment of competitiveness. The
conditions of quality of life change from community to community due to diversity.
Therefore, it is important for the community to have the ability to readjust and
change the indicators periodically.
The cities were studied over a decade and where required, the time line series of the
last 6-8 years was utilized to extrapolate and interpolate to plug the gaps in the
absence of data. Gaps in the data line are natural given the proclivity of the city
governance in lacking in the prerequisite databases on the facets of administration
and cities. Also, cities being a narrowly understood region may not receive the right
amount of attention and resources to maintain the requisite data. Some cities have
risen in economic and political prominence recently owing to an inadequate amount
of data present for the studies. The breaks in the data structure were however, filled
with similar size or character entity’s data to prevent the undue bias, due to either
favourable or negatively correlated data being introduced in the conclusion.
Hard facts have allowed robustness and standardization of data across all cities
backed with normalization ensuring consolidation of data across the varied units of
measurement. The myriad of parameter were developed into comprehensive indices
with care to prevent multicollinearity from obstructing the use and the results of the
data. Moreover, even small quantum changes and their effects are easily discernible
on the factors influencing competitiveness if the data follows the hard path. From
the purview of strategy formulation and policy execution, the measure thus
ascertained provides reliability and clarity in the choice of the factors deemed to
determine liveability of a city: the bird’s eye for those targeting to enhance
liveability.
The selection of the parameters and the framework are to serve the purpose of
capturing the overt and the covert dynamics that determine the liveability of any

The Liveability Index 2010
5
city. Inspired by the framework adopted by the leading global units like Mercer, the
Economist Intelligence Unit (EIU), Monocle and several others, it captures the
essence of liveability from a microeconomic perspective to fully gauge the factors
that make a city liveable. The various methodologies have been amalgamated and
modified to suit the Indian context. The measure for liveability is supported by ten
pillars or dimensions that assess the residential potential of a city.
2.1 Measurement of index
The identification of liveability in any city would follow a few steps or a process that
standardise the procedure and the evaluation of liveability for future comparative
endeavours.
Step1: Identification of parameters
It is imperative for a framework for liveability to be developed as the factors
affecting the measure are innumerable but the impact is specific to certain
dimensions. The sub indices evolve out of the effects of the various factors on the
final measure. Every sub index would hence be a function of constituent factors.
Before the data collection, the requisite framework needs to be developed. For the
purpose the model uses data under 10 major domains/dimensions along with their
sub-dimensions, and possible indicators.
Step2: Collection of data
Secondary data from reliable government sources was utilized in developing the
skeleton of the competitiveness model. The data is collected over a period of
stipulated time period to gauge the trends and patterns in the performance of the
various cities. It is imperative for the data to be over a long run period to analyse the
historical trajectory of progress or degeneration and identify the issues and concerns
for the city.
Step3: Identify economic strength of the city
An index on the related and supporting industries and the context for rivalry are
developed to complete the measure of competitiveness. These would include the
activities that the city specializes in and the processes through which the local
endowments of the city are utilized to give it a distinct competitive advantage.
Step4: Identify threats and opportunities
There are external as well as internal dynamics that determine the performance of
the cities. The threats and opportunities are a function of the external dynamics and

The Liveability Index 2010
6
their amalgamation with the internal possibilities and endowments of the city. We
need to identify these factors when finally interpreting the indices and data at hand.
The internal dynamics are subject to the local control of the cities but the external
factors are required to be utilized to the best advantage of the city.
Step5: Calculate the Quality of Life index and the measures to enhance the potential
of the city
The indicators gathered thus need be grouped under various categories to measure
the level and direction of influence on liveability. Most of the grouping is self evident
and hence summated together. However, a few other are categorized based on
discretion and judgement. Some of the indicators cast a negative impact on
liveability and the other pose a positive influence. Hence, understanding the
indicators is consequential for the index to give a realistic picture of the current
condition of the cities.
2.2 Identifying and Grouping Indicators
Identifying the right indicators to gauge a qualitative aspect of life requires economic
intuition and a Herculean effort. A robust study on the quality of life in Indian cities is
still lacking. Indices across the world have adopted multiple approaches to gauge
liveability and the quality of life. This report however, modifies the popular
approaches to suit the Indian context better. For instance, majority of the people
around the world will look for a low crime rate and good schools in the locality they
want to settle, but perhaps only an Indian will consider the presence of a sabzi
mandi where you can get fresh seasonal fruits and vegetables at a reasonable price
or look into the availability of abundant water supply in the area. Thus, while the
general definition of quality of life does not vary a great deal, the Indian definition
will demand slight modifications. Appropriately, these peculiar indicators have also
been selected and given suitable weights to effectively assess quality of life for the
above.
The selection of the factors is based on the impact that these factors have on the
liveability. A direct or an indirect influence on these factors qualifies the factor as an
indicator of liveability. Appropriately, the index is derived from an integrated
approach on meticulous academic constructs and objective empiricism. The expanse
of data was intended to provide fine granularity to the results. The indicators
subsequently provide a vast assessment on the particulate formation and
significance of potential emanating from the ground level. Quality of life in a city is
not a growth concept only covering the city as a whole but a function of various
other factors that aggregate from the basal to the visible. Thus, scores emanate for
ten pillars of liveability with each pillar factored at sub-index levels.

The Liveability Index 2010
7
Each of the sub indices are developed based on the indicators, grouped together on
theoretical constructs as well as self evident inclination. Each of the ten pillars has
sub indices that aggregate to formulate the more overt phenomenon of
competitiveness for each city.
2.3 Calculating and interpreting the index
Every indicator was pivotal in determining the final index for liveability. However,
every indicator does not play an equitable role in the productive potential of the city.
Calibrated weights have been attached to each indicator to generate a value for each
category as well as the final score. Competitiveness hence becomes an
amalgamation of various factors influencing liveability and the mere size of a city
would not ensure a higher measure of liveability.
The purpose of the index is to gauge liveability as a measure of prosperity and
development for the state and hence, per capita figures ensure that the relative size
of each figure is taken as an indicator rather than the absolute number. It focuses on
the quality of the factors rather than just the quantity and hence provides a more
comprehensive measure of hitherto misunderstood concept of development.
3.0 Defining Liveability
Quality of life is a subjective notion. People differ in their notion with different
incomes, influences and cultures governing their decisions. Nevertheless, the basic
notion behind a good lifestyle must fulfil certain necessary though not sufficient
conditions. For all residents, a city must offer basic amenities and infrastructure at a
cost that makes living convenient and hassle free. The best of cities will attract more
people and congestion and distances will increase for the residents. However, severe
water shortage in Pune makes living a nightmare as residents contend with no water
supply for days together.
Liveability has been an important aspect of the western cities or the regions in the
developed world for long now. To the residents, good educational systems, spacious
and safe environment and convenience of markets and stores is important. The
regions compete therefore, to improve the quality of life offered to make the city or
the regions more liveable for the people. India is fast following the same trend.
Urbanization and increase in the disposable income of the people has brought alive
options for people. It is no longer adequate for cities to be mere employment
rounds. There are multiple options available for people to choose from. Residents
seek value for money as they look for costs that conform to the convenience and
luxury that the city has to offer. Hence, the first aspect is to define liveability.

The Liveability Index 2010
8
A liveable city is not just an urbanized area in an urbanized region defined by the
presence of a municipality. Certain elements compose a liveable city and become the
prerequisites for a city to become a desirable place to live in. The quality of life
experienced by citizens living in a city is tied to their ability to access infrastructure
(transportation, communication, water, and sanitation); food; clean air; affordable
housing; meaningful employment; and green space and parks. The differential access
of people within a city to the infrastructure and amenities highlights questions of
equity. For the purposes of this paper, liveability will be defined as ‘quality of life’ as
experienced by the residents within a city or region. In this context sustainability is
the ability to sustain the quality of life we value or to which we aspire. In operational
terms it is often viewed as enhancing the economic, social, cultural and
environmental well-being of current and future residents.
Liveability refers to an urban system that contributes to the physical, social and
mental well being and personal development of all its inhabitants. It is about
delightful and desirable urban spaces that offer and reflect cultural and sacred
enrichment. Key principles that give substance to this theme are equity, dignity,
accessibility, conviviality, participation and empowerment. The Indian context
however, differs from the conventional sense of quality of life.
The developed cities take certain things as given while the presence of the same
becomes important for the Indian cities. A suburb in USA does not expect a grocery
store within walking distance of their houses. It is assumed that people have cars
and prefer large grocery stores like Wal-Mart to take care of their needs rather than
a kirana (mom and pop store) around the corner who would be willing to even come
personally to your house to deliver the goods. A vegetable haat or mandi is a
necessity near the houses and would greatly influence the perception of the people,
raising issues concerning the liveability of the area in case of no vegetable vendor
within walking distance of the housing colony.
Therefore, liveability in India is a far more comprehensive and diverse issue than the
western definition of liveability. The Indian context offers diverse religions, cultures
and people in the same region. Therefore, to fully gauge liveability, the index needs
to measure not just the apparent but the latent aspects of quality of life as well. The
intention of the report is to judge how people would perceive liveability and make a
measure for future decision makers to assess. Hence, its important when measuring
liveability, certain key elements are kept in mind.
In a liveable city, people can see and hear each other. People cannot be segregated
and isolated and put with miles from each other as dialogue is important. A city

The Liveability Index 2010
9
cannot be liveable in India or any other part of the world if people do not have the
avenue to talk to each other. The public realm offers many activities, celebrations,
festivals that bring all of its inhabitants together, events that bring opportunities for
its citizens to be together, not in the specialized roles and functions that they usually
occupy. A good city is not dominated by fear, not by a conception of fellow human
beings as evil and subhuman. It offers the public realm as a place of social learning
and socialization that is indispensable for children and young people. All of the
inhabitants of the community serve as models and teachers. Cities must meet many
functions – economic, social and cultural. In so doing, however, there has been a
trend for the modern city to over-specialize in one or two functions; other functions
are being sacrificed. All inhabitants confirm and value each other. Aesthetic
considerations, beauty, and meaning of the physical environment must have high
priority. The physical environment and social environment are two aspects of the
same reality. Just as it was a mistake to think that city inhabitants can have a good
civic and social life in an ugly, brutal and physically inhospitable city. Finally, the
wisdom and knowledge of all inhabitants are appreciated and used. People are not
intimidated by experts, whether architects or planners, but show a sense of caution
and distrust of those who make decisions about their lives.
Accessibility to basic amenities is a central factor in achieving liveability. Instead of
urban sprawl that separates housing from other functions, complete communities
mix housing with other uses such as shops, businesses, restaurants, public spaces,
offices, schools, parks, libraries, police stations, and entertainment venues. The
ability for people to live a well-rounded life without having to travel distances in a
vehicle is essential for creating strong communities with local character. By placing
these amenities within walking distance, streets become social spaces that enable
easy regular human contact in addition to the usual role of streets for moving people
and goods. Through building structures such as shop/houses, the shops on the
ground floor provide public space for interaction, while the inclusion of private
housing on the floors above ensures that there are ‘eyes on the street’ that monitor
and encourage appropriate social behaviour. The neighbourhoods are decentralized
units that are vital for weaving people’s public and private lives together. When
complete communities are designed to be safe, healthy and liveable for all, the city
(and larger region) becomes a community of communities.

The Liveability Index 2010
10
3.1 Economic Environment and Standard of Living
The average per capita income of cities as a larger per capita income represents a
stronger economy. The employment levels that the city can offer apart from the
local business environment and the economic growth patterns make the city a more
attractive place to reside. Cost of living makes a big difference to the decision of the
people and the industry as the costs are an important aspect of people’s lifestyle
now. The industry would also prefer to keep its operational costs low and a city
providing the same would also be easy to attract the target skill set to. The four
metropolitans in India are largely expensive. Mumbai may offer a wide arena for jobs
and opportunities. However, living in Mumbai is far too expensive.
There is typically an inverse relationship of labour and income sources, especially in
resort-based economies. For example, high-labour demand in service industries
traditionally reflects lower paying positions. Therefore, it is necessary to track these
two indicators independently to isolate the elements, which have an impact on
income and industry distribution.
3.2 Socio-Cultural Environment
India is unique on this indicator as Indian cities see a wider mix of ethnicity and
cultural mix than most other countries. For a city to be liveable, acceptance of this
diversity becomes a crucial aspect. The freedoms of the people are curbed when
religious functions or cultural festivals find no space in the paradigm of the city.
People need to express themselves freely, in the language they want and the way
they choose. Any city that shows low tolerance for diversity would either become a
dictatorial setup for anarchy and internal clashes and disturbances between groups
of different ethnicities. Therefore, through media related exchanges or multicultural
function, cities need to portray a more secular set up that welcomes people and not
religions.
3.3 Education
The indicator may seem cliché but proves to be an important consideration for all
residents. The future of their families and their career growth are dependent on the
number of schools, colleges and universities in and around the city. Industries are
attracted to cities with a readymade work force available rather than depend on
migrants from other regions to fulfil the needs. It is important for the city as well as
it would mean less congestion. People from within the region can supply the human
resource requirements and little scope and space is left for migrants looking for
housing and share in amenities.
The Liveability Index 2010
11
3.4 Health and Medical Standards
The indicator asserts all residents should have access to health care options.
However, the number of beds available per person, hours required to reach a
hospital and distance between the nearest health professional cast a major influence
on the people and the liveability of the city. The life expectancy and mortality of the
people apart from incidents of infectious diseases have a major effect on the
productivity of the people and a city cannot prosper within the confines of lack of
medical attention or low productivity due to a high incidence of diseases.
3.5 Natural environment
As population growth and the availability, use and consumption of our energy
impact our global environment, the Index attempts to answer the question: What
makes a county the place that it is through an ecological eye?
The Index uses the history of natural calamities and general climate conditions as a
measure to track effectiveness at reducing pollution in general. Lower numbers
reflect a lower amount of environmental misbalance. Global warming, carbon
footprint and energy conservation are often daily news topics nationwide. The Index
attempts to raise the question: What are we doing on a daily basis in our
communities to improve our environmental liveability?
Ambient Conditions are defined by traffic, noises, light and any other human-
generated elements emitted into our atmosphere that might impact the enjoyment
of our community. A common term associated with ambient conditions is “night sky
viewing,” or being able to see stars at night without light pollution. Cities usually lack
in the natural ambience as the pollution increases. The increasing number of natural
disasters and the break in the seasonal patterns has far flung effects on the
sustainability of the city.
3.6 Public Service
The number of hours of power per person, cost of electricity in cities and even the
amount of water available per person has huge implication on the cost of living of
the people. Cities suffer as the basic civic amenities are available scantily to the
people owing to large immigration and density of population in the cities.
Employment opportunities are proportionate to the human resource entering the
city. However, the intake of the city is limited by the resource and infrastructure
constraints and the liveability for the residents is adversely affected. Apart from just
power and water, modern cities require a stable communication system and well
connected transportation network to ensure business and residential convenience.
The Liveability Index 2010
12
3.7 Recreational possibilities
All work and no play, makes Jack a dull boy. Cities need a recreational break from
their activities and restaurants, music and theatre options ad sports and leisure
alternatives are important for the economy of the city as well as the sustenance of
the people. These are revenue generating avenues for the city, increasing
employment and growth and have a positive influence on the productivity of the
people. A person would go rejuvenated to office or back home after a weekend of
activities of his/ her choice.
3.8 Consumer Goods
Every city in this world would require a basic market for shopping for daily
consumption items and durables. Indian context differs as the shopping alternative
needs to be present in different retiling formats. A grocery store near the house is a
necessity while a huge mart for the same would not be considered convenient at a
distance. Small cities sometimes fail to provide for an automobile market or even an
electronics items store in close proximity.
3.9 Housing Option
The indicator depicts the relationship between household incomes and housing
prices, which reflects the ability for the average wage earner to afford or rent a
home. Every community must have the ability to house its work force. Lower values
represent greater housing affordability. Urban planning and development play a
major role to prevent crowding. Also a modern city requires that the housing option
includes household appliances and maintenance and hence, the availability of
markets and the labour force for household chores is important.
The development of complete communities is important and a balance needs to be
struck at the regional level between the effectiveness and efficiency of
decentralization and maintaining certain amenities in a centralized location within a
city. Although cultural spaces can be created at the neighbourhood level, art
galleries, symphony halls, sports stadiums and museums are better suited to be
centralized. Similarly, a centralized downtown economic core of activity is important
for the development of a liveable city. Economic development in a city may also
require certain industrial activities to be clustered. The provision of energy at the
neighbourhood scale may be less efficient than centralizing an energy system within
a region. In order to be resilient to possible problems and malfunction, these
centralized energy systems will need to build in a level of redundancy to ensure that
if there are problems with the main energy infrastructure the region has back-up
systems to supply energy. The tension between decentralization and centralization is

The Liveability Index 2010
13
one of the balancing acts facing the cities. Part of resolving this tension lies in
creating nodes or organs within the region in the form of growth concentration areas
and compact communities.
4.0 Cities: A Current Case
Through our research of the databases within different Cities, many of these
databases are inconsistent and difficult to relate. The inconsistency and the
complexity are due to the various indicators used or very few indicators being
actually measured. The assorted departments often collect their data over different
time intervals and geographical areas. The data may also be difficult to obtain,
acquirable only by request, and incomplete. Furthermore, some of the databases are
difficult to function and filter, leaving only experts to operate the systems.
This lack of a central information system affected the development of our composite
index. The report has provided cities with a foundation for creating a composite
liveability enhancement plan. The construction of the composite index modelling our
sub-indices will not only enhance communication in the council but also improve the
city services. Moreover, the flexibility of our model has provided a means for the
policy makers to change aspects of the index in order to meet the changing demands
and concerns of the public.
5.0 Results and recommendations:
In Overall quality of life, Delhi outscores on Mumbai, Chennai, Bengaluru, Kolkata,
Hyderabad, Ahmedabad, Pune, and Gurgaon which take up respective ranks 2nd to
9th. Faridabad (32nd), Ludhiana (33rd), Lucknow (34th), Patna (35th),
Vishakhapatnam (36th) and Jamshedpur (37th) are last five raked cities on Overall
quality of life. Chandigarh is a surprising 14th on this, proving that a city needs much
more than apparent beauty to be truly liveable.
The Demographic advantage is aced by Mumbai, followed closely by Kolkata,
Chennai, Coimbatore, Hyderabad, Ahmedabad and Delhi in order. The last five
laggards are Jammu, Srinagar, Patna, Chandigarh and Indore (37th). Bengaluru is
12th.
On education, the winners are Delhi, Mumbai, Bengaluru, Chennai, Pune, Gurgaon,
Kolkata, Hyderabad, and Chandigarh. Hyderabad, much touted for its education
access is 8th. Bhubaneswar though growing in this regard, is 34th followed by
The Liveability Index 2010
14
Kanpur, Lucknow and Patna (37th). Apparently having one IIT alone to showcase
isn't enough for Kanpur to win the battle.
Health and Medical Standards are most notable for Kozhikode, Trivandrum and
Kochi; a straight win for Kerela. Mumbai is 12th while this is Delhi's Achilles heel
(17th) with Bengaluru 18th. Lucknow, Noida and Patna (37th) are the last three
ranked cities.
On Safety, contrary to negative press against Delhi, it turns out be the safest;
followed by Bhopal, Bengaluru, Mumbai, Chennai, Hyderabad and Pune in sequence.
Jammu (33rd), Srinagar (34th), Dehradun (35th), Gurgaon (36th) and NOIDA (37th)
have the worst record. Jammu and Srinagar could be such ranked since terrorism is
major cause of concern. Delhi could be a simple victim of devils like Gurgaon and
Noida bearing proximity.
Despite real estate spirals, Gurgaon leads in costs and availabilities; with Delhi,
Bengaluru, Chandigarh, Chennai, Hyderabad, and Ahmedabad coming next. Surat
(34th), Coimbatore (35th), Nagpur (36th), and Vishakapatnam (37th) have the most
dismal record in this pillar on liveability.
The Socio-cultural Politico environment is healthiest, in order, for Mumbai, Delhi,
Kolkata, Goa, Chennai, Bengaluru, Pune and Hyderabad. Ludhiana (36th) and
Faridabad (37th) come up at the tail. Oddly, Chandigarh is a poor 19th on this
showing its hyped image appeals only to one particular culture.
Delhi wins against Mumbai on Economic environment, with 3rd ranked Bengaluru,
4th ranked Kolkata, 5th ranked Chennai, 6th ranked Pune following with 7th ranked
Hyderabad. Patna and Vishakhapatnam are the 36th and 37th cities.
Natural-Built/Planned Environment crown goes to metros: Mumbai, Chennai, Delhi,
Bengaluru, Hyderabad, and Kolkata (6th). Attention is deserved by Faridabad (34th),
Jammu (35th), Dehradun (36th) and 37th ranked Jamshedpur. Gurgaon is a painful
24th on this pillar.
Best Facet Of Pride:
As many as 10 cities have shown their best rank on Safety (Bengaluru, Bhopal, Delhi,
Faridabad, Jaipur, Jamshedpur, Kanpur, Lucknow, and Patna).
9 have done it on Demographics (Ahmedabad, Coimbatore, Hyderabad, Kolkata,
Mumbai, Mysore, Nashik, Vadodra, and Vishakhapatnam) and on Housing options
(Bengaluru, Bhubaneswar, Chandigarh, Dehradun, Gurgaon, Guwahati, Jammy,
Noida, and Srinagar).

The Liveability Index 2010
15
Naturally, the recommendation for these cities would be to build on these strengths.
Worst Ranks:
Health and Medical Standards are issue of gravest concern for 11 cities: Ahmedabad,
Bengaluru, Bhopal, Chennai, Delhi, Hyderabad, Jaipur, Mumbai, Noida, Patna and
Pune.
8 cities have their lowest ranks on Housing issues – Coimbatore, Jaipur, Kochi,
Kolkata, Nagpur, Nashik, Vadodara, and Vishakhapatnam); 7 have it on Education
(Bhubaneswar, Guwahati, Jaipur, Kanpur, Lucknow, Patna, and Vadodara).
It would take intense soul-searching for these cities to redress this malperformance;
and be prepared to take courageous and right steps for moving upwards.
The Liveability Index 2010
16
Reach us via our Membership Helpline:
00-91-11-435 46244 / 00-91-99104 46244
CII Helpline Toll free No: 1800-103-1244
About CII
The Confederation of Indian Industry (CII) works to create and sustain an environment
conducive to the growth of industry in India, partnering industry and government alike
through advisory and consultative processes.
CII is a non-government, not-for-profit, industry led and industry managed organisation,
playing a proactive role in India’s development process. Founded over 115 years ago, it is
India’s premier business association, with a direct membership of over 7800 organisations
from the private as well as public sectors, including SMEs and MNCs, and an indirect
membership of over 90,000 companies from around 385 national and regional sectoral
associations.
CII catalyses change by working closely with government on policy issues, enhancing
efficiency, competitiveness and expanding business opportunities for industry through a
range of specialised services and global linkages. It also provides a platform for sectoral
consensus building and networking. Major emphasis is laid on projecting a positive image of
business, assisting industry to identify and execute corporate citizenship programmes.
Partnerships with over 120 NGOs across the country carry forward our initiatives in
integrated and inclusive development, which include health, education, livelihood, diversity
management, skill development and water, to name a few.
Complementing this vision, CII’s theme for 2009-10 is ‘India@75: Economy, Infrastructure
and Governance.’ Within the overarching agenda to facilitate India’s transformation into an
economically vital, technologically innovative, socially and ethically vibrant global leader by
year 2022, CII’s focus this year is on revival of the Economy, fast tracking Infrastructure
and improved Governance.
With 65 offices in India, 9 overseas in Australia, Austria, China, France, Germany, Japan,
Singapore, UK, and USA, and institutional partnerships with 221 counterpart organisations
in 90 countries, CII serves as a reference point for Indian industry and the international
business community.
Confederation of Indian Industry
Northern Region
Block No. 3, Sector 31-A
Chandigarh 160 030
Phone: 0091-172-6510187, 2607228
Fax: 0091-172-2606259, 2614974
Email: [email protected]
Website: www.cii.in

The Liveability Index 2010
17
About Institute for Competitiveness
Institute for Competitiveness, India is the Indian knot in the global network of the Institute
for Strategy and Competitiveness at Harvard Business School. Institute for Competitiveness,
India is an international initiative centred in India, dedicated to enlarging and disseminating
the body of research and knowledge on competition and strategy, pioneered over the last
25 years by Professor M.E. Porter of the Institute for Strategy and Competitiveness at
Harvard Business School. Institute for Competitiveness offers academic and executive
courses, conducts and supports indigenous research and provides advisory services to
Corporate and Government. The institute studies competition and its implications for
company strategy; the competitiveness of nations, regions & cities; suggests and provides
solutions for social problems. For further information on our publications, research,
advisory, research funding and executive programs visit our website at
www.competitiveness.in.

The Liveability Index 2010
18
Acknowledgement
Dr. Amit Kapoor
Amit Kapoor is Honorary Chairman of Institute for Competitiveness, India and Professor of
Strategy and Industrial Economics at Management Development Institute, Gurgaon, India.
He is an affiliate faculty for the Microeconomics of Competitiveness course of Institute of
Strategy and Competitiveness, Harvard Business School. He focuses on research, advisory
work and speaking engagements in the area of enhancing competitiveness of firms,
industries and locations. He can be contacted at [email protected].
Sandeep Mann
Sandeep Mann's key domain is Competitiveness of firms, industries, clusters and the BRICS
city/state economies. He has witnessed global strategy of many Fortune 500 firms from
close quarters, facilitating Mergers and Acquisitions, besides anchoring a multitude of SMEs.
He facilitates Foreign Direct Investment flow into specific sectors and specific locations
across various Economic Zones. He is Founder-Mentor, Off The Grid Business School and a
Member, Advisory Board, Institute for Competitiveness. He can be reached
Copyright © 2010 Institute for Competitiveness, India
All rights reserved

The Liveability Index 2010
19
Appendices
Quality of Life – Overall Liveability Index
City Score Rank
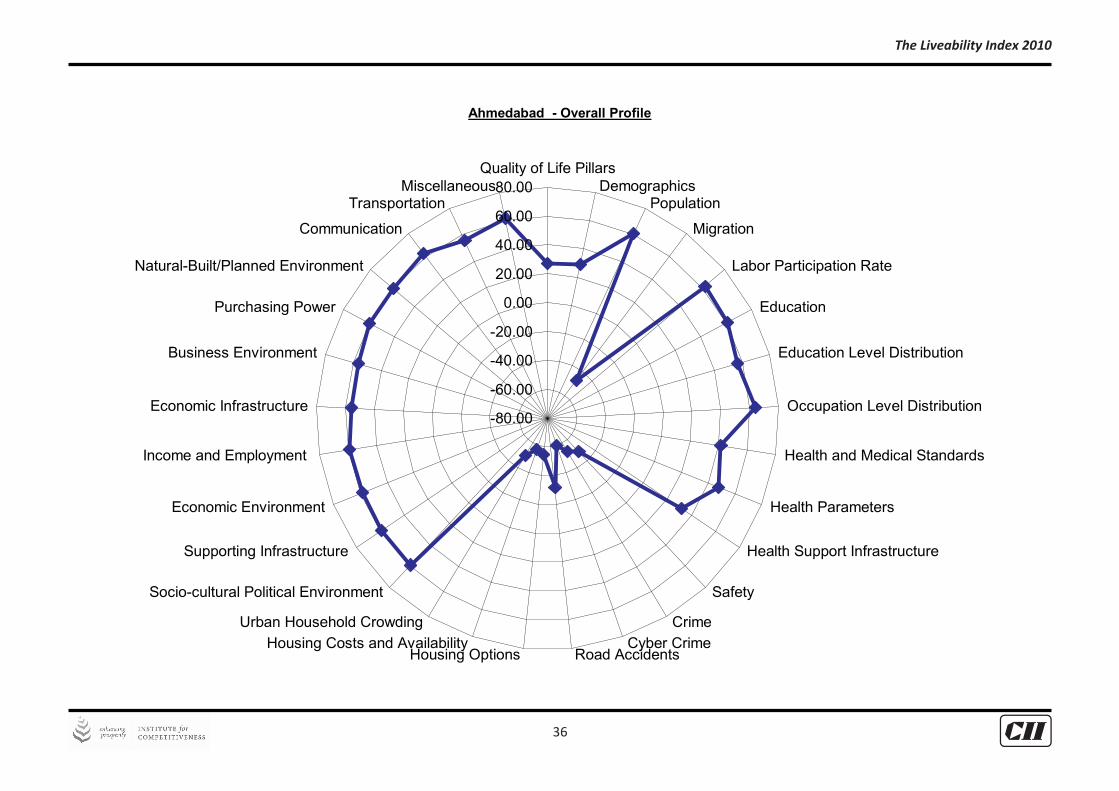
Ahmedabad 27.03 7
Bengaluru 32.06 4
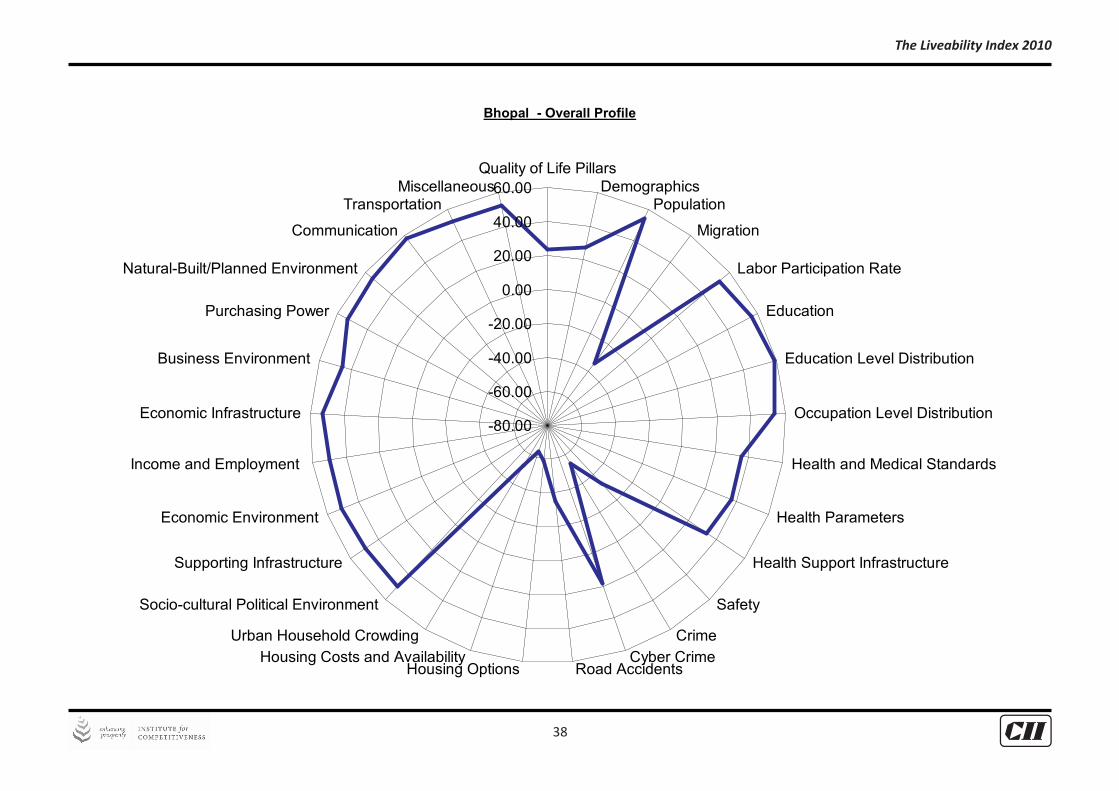
Bhopal 23.72 13
Bhubaneshwar 20.36 25
Chandigarh 23.45 14
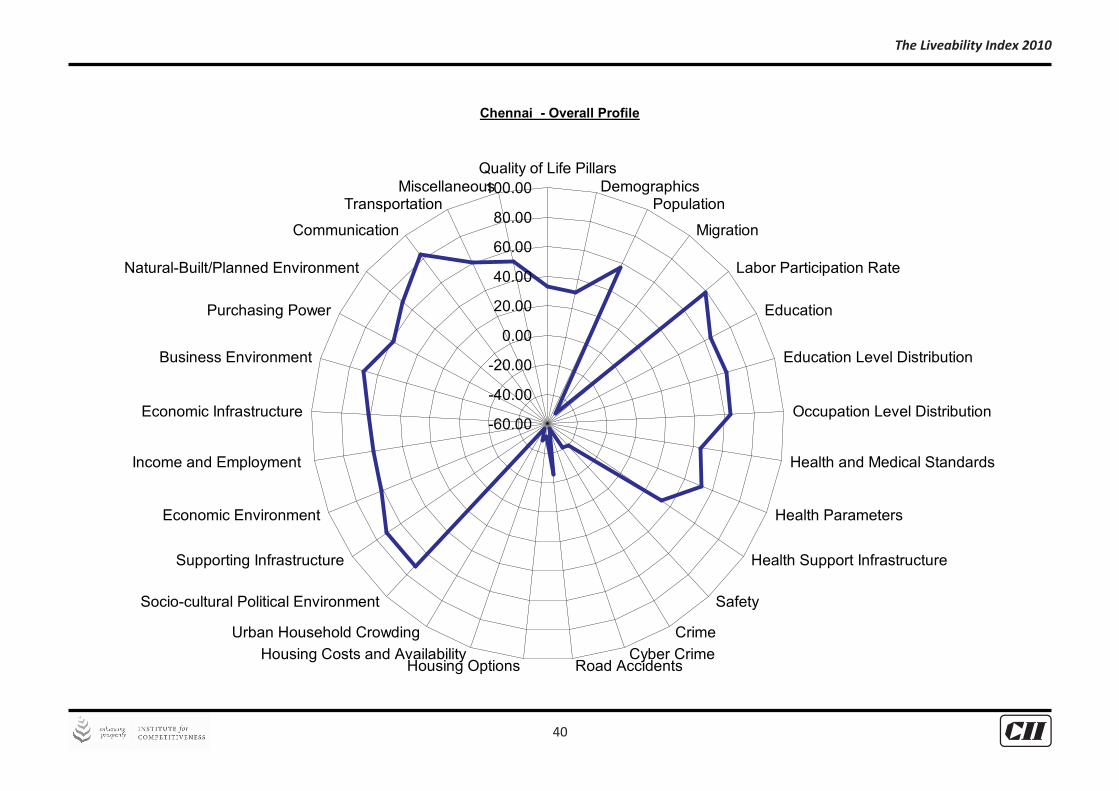
Chennai 32.91 3
Coimbatore 20.41 24
Dehradun 20.42 23
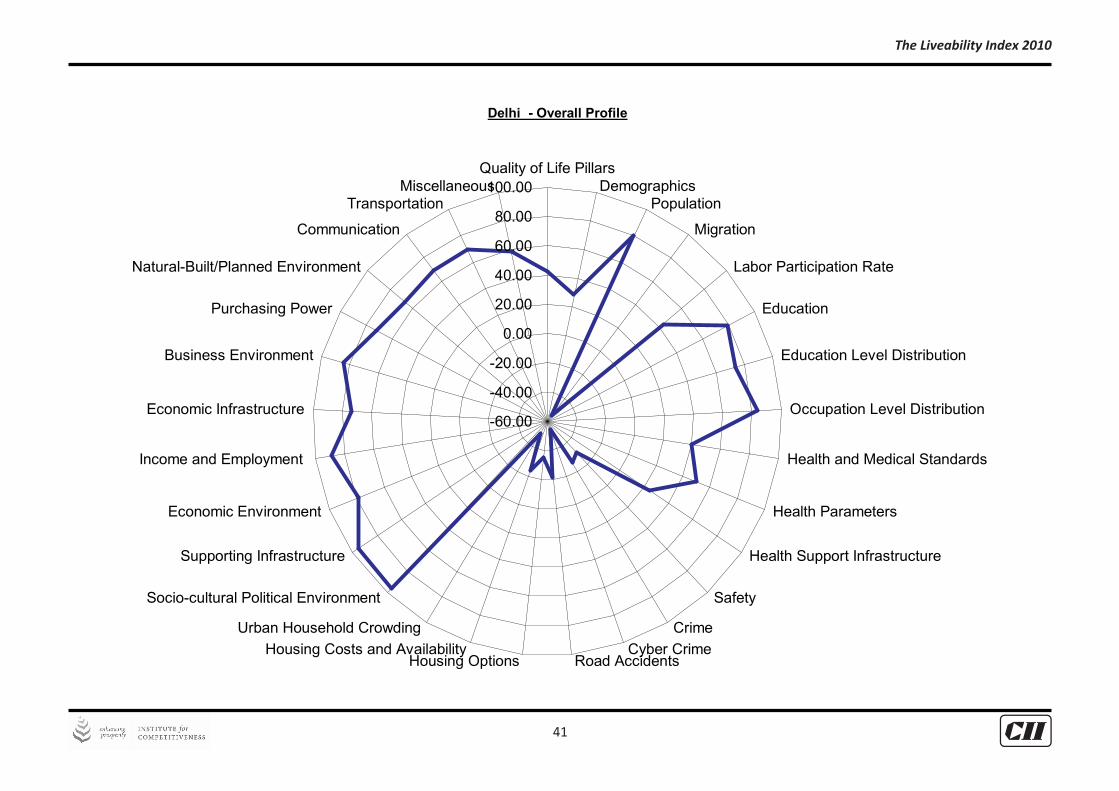
Delhi 42.15 1
Faridabad 19.58 32
Goa 24.90 10
Gurgaon 25.42 9
Guwahati 19.99 29
Hyderabad 27.83 6
Indore 19.65 31
Jaipur 22.09 18
Jammu 20.86 20
Jamshedpur 17.30 37
Kanpur 20.08 28
Kochi 23.89 12
Kolkata 30.57 5
Kozhikode 23.12 15
Lucknow 19.25 34
Ludhiana 19.38 33
Mumbai 41.21 2
Mysore 22.35 17
Nagpur 22.05 19
Nashik 19.98 30
NOIDA 20.13 27
Patna 18.06 35
Pune 26.28 8
Shimla 24.14 11
Srinagar 20.63 22
Surat 20.81 21
Trivandrum 22.65 16
Vadodara 20.34 26
Vishakapatnam 17.73 36

The Liveability Index 2010
20
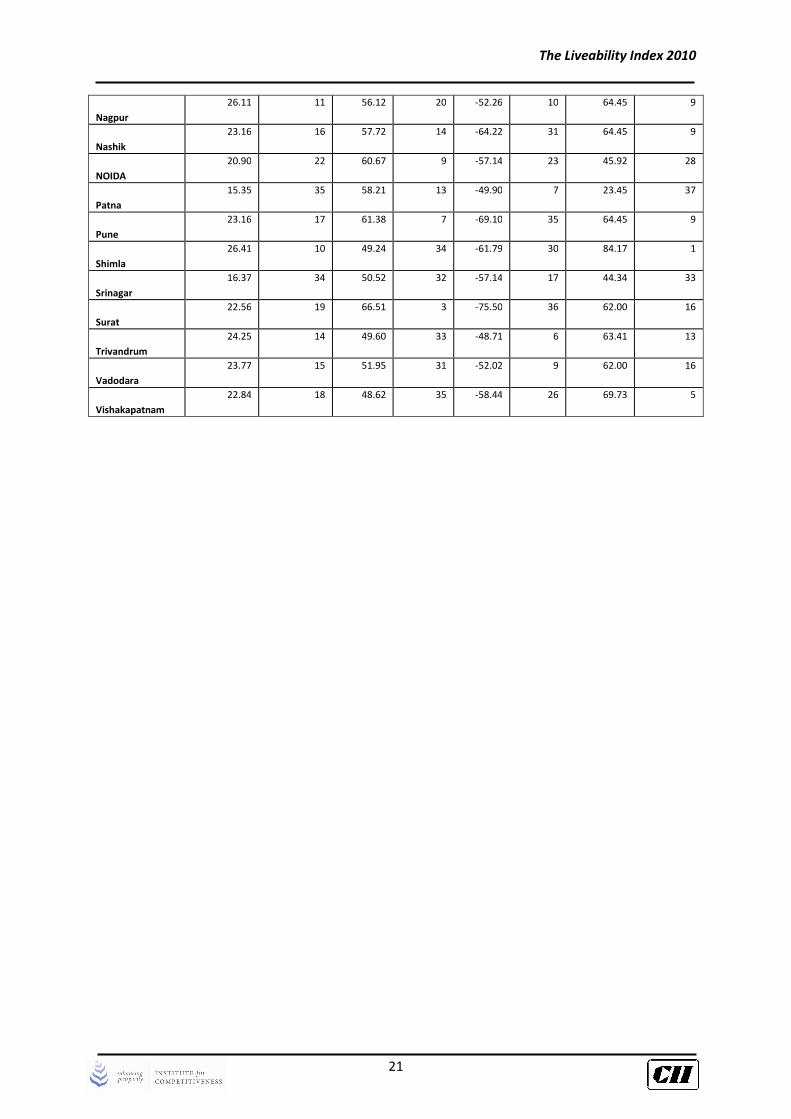
Pillar Demographics & Constituents
Demographics Population Migration Labor Participation Rate
City
Score Rank Score Rank Score Rank Score Rank
Ahmedabad
28.84 6 60.96 8 -47.14 5 62.00 16
Bengaluru
25.26 12 62.68 5 -65.61 32 66.26 7
Bhopal
26.88 9 54.16 24 -34.46 1 51.86 22
Bhubaneshwar
19.03 30 55.38 21 -57.14 17 46.73 26
Chandigarh
15.30 36 53.73 25 -68.05 34 47.40 25
Chennai
31.18 3 57.10 18 -51.18 8 78.97 2
Coimbatore
30.94 4 59.68 11 -55.42 16 78.97 2
Dehradun
18.11 32 53.29 27 -57.14 17 46.47 27
Delhi
28.58 7 79.97 1 -54.97 12 43.61 35
Faridabad
19.06 29 59.39 12 -61.29 28 45.65 31
Goa
19.00 31 52.95 29 -66.21 33 58.94 19
Gurgaon
19.42 27 57.17 17 -57.14 17 45.65 31
Guwahati
19.23 28 53.70 26 -57.57 24 50.08 24
Hyderabad
28.96 5 61.41 6 -55.06 13 69.73 5
Indore
11.30 37 57.43 15 -90.79 37 51.86 22
Jaipur
21.49 20 60.01 10 -61.49 29 53.12 21
Jammu
17.29 33 52.84 30 -57.14 17 44.34 33
Jamshedpur
19.64 26 54.30 23 -45.09 4 38.16 36
Kanpur
20.09 24 57.28 16 -55.32 14 45.92 28
Kochi
24.99 13 47.60 36 -43.57 3 63.41 13
Kolkata
32.40 2 64.06 4 -43.42 2 66.02 8
Kozhikode
20.57 23 46.73 37 -57.14 17 63.41 13
Lucknow
19.70 25 56.32 19 -55.35 15 45.92 28
Ludhiana
21.15 21 54.72 22 -60.48 27 58.00 20
Mumbai
34.70 1 77.65 2 -52.32 11 64.45 9
Mysore
27.73 8 53.26 28 -57.57 24 78.97 2
The Liveability Index 2010
21
Nagpur
26.11 11 56.12 20 -52.26 10 64.45 9
Nashik
23.16 16 57.72 14 -64.22 31 64.45 9
NOIDA
20.90 22 60.67 9 -57.14 23 45.92 28
Patna
15.35 35 58.21 13 -49.90 7 23.45 37
Pune
23.16 17 61.38 7 -69.10 35 64.45 9
Shimla
26.41 10 49.24 34 -61.79 30 84.17 1
Srinagar
16.37 34 50.52 32 -57.14 17 44.34 33
Surat
22.56 19 66.51 3 -75.50 36 62.00 16
Trivandrum
24.25 14 49.60 33 -48.71 6 63.41 13
Vadodara
23.77 15 51.95 31 -52.02 9 62.00 16
Vishakapatnam
22.84 18 48.62 35 -58.44 26 69.73 5

The Liveability Index 2010
22
Pillar Education & Constituents
Education
Education Level
Distribution
Occupation Level
Distribution
City
Score Rank Score Rank Score Rank
Ahmedabad
61.13 10 57.00 20 63.88 6
Bengaluru
65.51 3 62.70 9 67.39 3
Bhopal
56.08 16 59.30 17 53.94 18
Bhubaneshwar
51.76 34 49.56 35 53.23 24
Chandigarh
61.98 9 63.49 6 60.97 9
Chennai
64.62 4 65.73 3 63.88 7
Coimbatore
56.26 14 58.43 18 54.81 16
Dehradun
54.25 25 56.42 22 52.81 26
Delhi
79.72 1 73.53 1 83.86 1
Faridabad
54.25 24 57.21 19 52.29 30
Goa
57.92 13 61.32 11 55.64 12
Gurgaon
63.24 6 59.65 15 65.64 4
Guwahati
52.54 33 53.12 28 52.16 31
Hyderabad
62.36 8 64.60 4 60.87 10
Indore
53.36 28 52.49 32 53.93 19
Jaipur
52.88 30 53.54 27 52.43 28
Jammu
58.90 11 62.52 10 56.48 11
Jamshedpur
53.70 26 52.68 31 54.38 17
Kanpur
51.52 35 50.93 34 51.92 35
Kochi
56.21 15 62.73 7 51.86 36
Kolkata
62.62 7 59.30 16 64.84 5
Kozhikode
55.12 20 59.90 14 51.93 34
Lucknow
50.76 36 48.89 36 52.00 32
Ludhiana
53.50 27 55.08 26 52.45 27
Mumbai
75.52 2 70.70 2 78.73 2
Mysore
54.59 23 55.67 25 53.87 20
Nagpur
55.73 17 56.96 21 54.90 14

The Liveability Index 2010
23
Nashik
55.20 19 55.72 24 54.86 15
NOIDA
52.60 32 52.99 29 52.33 29
Patna
49.85 37 45.26 37 52.92 25
Pune
64.00 5 64.40 5 63.73 8
Shimla
55.05 21 60.91 12 51.15 37
Srinagar
58.34 12 62.72 8 55.42 13
Surat
52.64 31 51.17 33 53.62 22
Trivandrum
55.34 18 60.45 13 51.93 33
Vadodara
53.31 29 52.75 30 53.69 21
Vishakapatnam
54.59 22 56.18 23 53.53 23

The Liveability Index 2010
24
Pillar Health & Constituents
Health and Medical
Standards Health Parameters Health Support Infrastructure
City
Score Rank Score Rank Score Rank
Ahmedabad
41.45 12 47.67 15 32.13 14
Bengaluru
39.63 18 46.45 22 29.39 20
Bhopal
35.38 31 36.91 33 33.07 9
Bhubaneshwar
37.18 28 39.85 30 33.18 8
Chandigarh
42.05 10 50.05 11 30.06 19
Chennai
44.73 6 52.66 6 32.84 11
Coimbatore
43.00 9 50.49 10 31.76 15
Dehradun
37.22 27 45.51 25 24.79 27
Delhi
39.80 17 50.05 11 24.43 28
Faridabad
37.61 25 47.51 18 22.76 29
Goa
44.04 7 49.11 13 36.45 2
Gurgaon
36.98 29 47.51 18 21.17 33
Guwahati
38.84 20 42.49 28 33.35 7
Hyderabad
37.28 26 41.13 29 31.51 16
Indore
43.81 8 51.11 9 32.87 10
Jaipur
36.96 30 42.66 27 28.41 23
Jammu
37.97 23 51.62 7 17.50 36
Jamshedpur
31.91 32 38.56 32 21.94 31
Kanpur
31.09 34 36.83 34 22.47 30
Kochi
47.56 3 56.76 2 33.77 6
Kolkata
46.63 4 58.97 1 28.12 24
Kozhikode
49.20 1 56.76 2 37.84 1
Lucknow
30.71 35 36.83 34 21.52 32
Ludhiana
31.32 33 39.40 31 19.21 35
Mumbai
41.52 11 47.74 14 32.19 13
Mysore
40.94 13 46.45 22 32.68 12
Nagpur
40.87 14 45.54 24 33.87 5

The Liveability Index 2010
25
Nashik
39.53 19 46.54 20 29.02 22
NOIDA
29.85 36 36.83 34 19.36 34
Patna
27.81 37 29.42 37 25.38 26
Pune
38.83 21 46.54 20 27.27 25
Shimla
45.51 5 53.01 5 34.26 4
Srinagar
37.97 23 51.62 7 17.50 36
Surat
40.65 16 47.67 15 30.12 18
Trivandrum
48.10 2 56.76 2 35.09 3
Vadodara
40.85 15 47.67 15 30.63 17
Vishakapatnam
38.78 22 45.14 26 29.23 21

The Liveability Index 2010
26
Pillar safety & Constituents
Safety Crime Cyber Crime Road Accidents
City
Score
Ra
nk Score
Ra
nk Score Rank Score Rank
Ahmedabad
-48.11 9 -53.27 7 -60.09 14 -31.54 9
Bengaluru
-35.99 3 -37.11 2 -45.37 2 -27.88 4
Bhopal
-33.68 2 -53.62 8 18.73 1 -35.37 17
Bhubaneshwar
-55.08 28 -64.20 28 -60.65 15 -36.17 19
Chandigarh
-55.11 29 -64.60 36 -59.33 10 -36.47 20
Chennai
-39.37 5 -40.96 3 -56.69 6 -25.16 3
Coimbatore
-54.07 24 -61.30 24 -60.65 15 -37.64 26
Dehradun
-55.99 32 -64.20 28 -60.65 15 -39.19 31
Delhi
-30.69 1 -26.81 1 -53.86 3 -21.70 2
Faridabad
-52.24 18 -57.36 16 -60.65 15 -38.09 28
Goa
-53.09 22 -63.77 27 -60.65 15 -30.24 7
Gurgaon
-55.99 32 -64.20 28 -60.65 15 -39.19 31
Guwahati
-54.08 25 -63.76 26 -60.65 15 -33.54 12
Hyderabad
-45.38 6 -47.81 5 -60.65 15 -31.15 8
Indore
-51.69 16 -57.17 15 -60.65 15 -36.59 21
Jaipur
-50.01 11 -55.67 11 -60.65 15 -33.48 11
Jammu
-55.99 32 -64.20 28 -60.65 15 -39.19 31
Jamshedpur
-52.98 21 -58.58 18 -60.65 15 -38.53 30
Kanpur
-48.04 8 -53.92 9 -60.65 15 -29.83 6
Kochi
-52.49 19 -60.77 22 -57.73 9 -35.19 16
Kolkata
-51.27 14 -59.39 21 -56.41 5 -34.31 14
Kozhikode
-55.99 32 -64.20 28 -60.65 15 -39.19 31
Lucknow
-51.29 15 -55.89 12 -60.65 15 -37.39 24
Ludhiana
-53.26 23 -59.27 20 -60.65 15 -38.33 29
Mumbai
-36.69 4 -45.20 4 -56.69 6 -9.17 1
Mysore
-54.29 27 -60.80 23 -60.65 15 -39.19 31
Nagpur
-49.11 10 -55.46 10 -57.24 8 -33.10 10
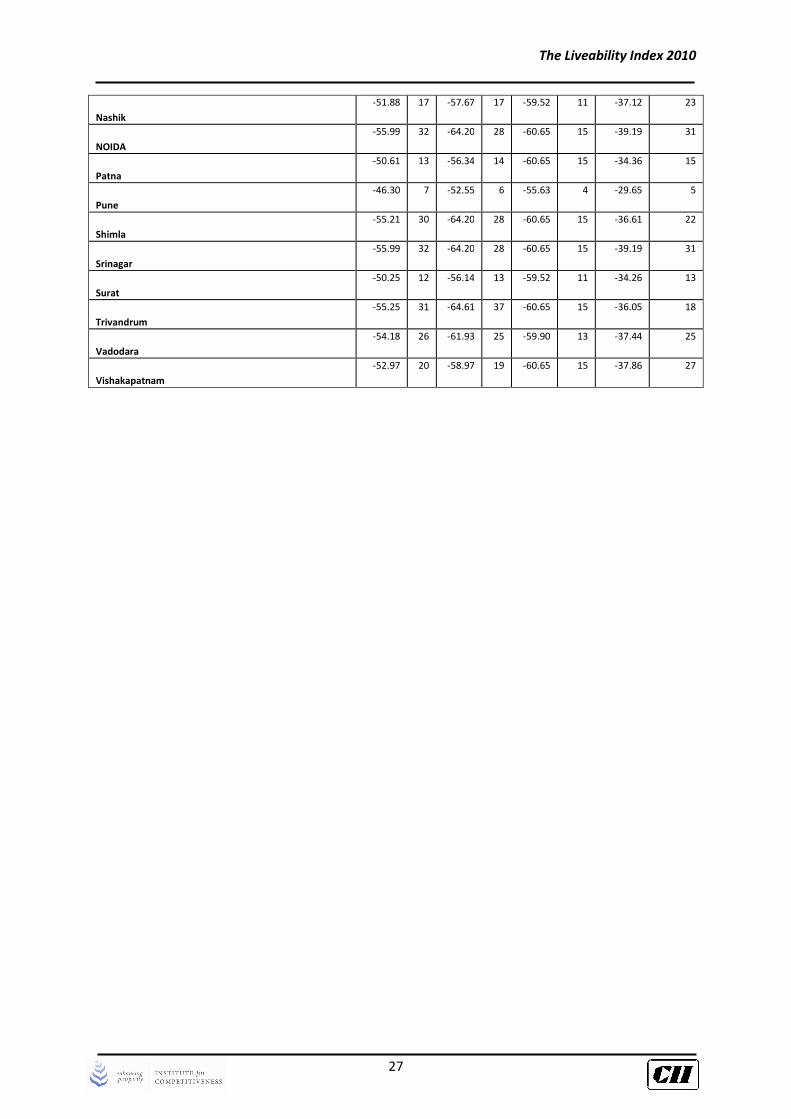
The Liveability Index 2010
27
Nashik
-51.88 17 -57.67 17 -59.52 11 -37.12 23
NOIDA
-55.99 32 -64.20 28 -60.65 15 -39.19 31
Patna
-50.61 13 -56.34 14 -60.65 15 -34.36 15
Pune
-46.30 7 -52.55 6 -55.63 4 -29.65 5
Shimla
-55.21 30 -64.20 28 -60.65 15 -36.61 22
Srinagar
-55.99 32 -64.20 28 -60.65 15 -39.19 31
Surat
-50.25 12 -56.14 13 -59.52 11 -34.26 13
Trivandrum
-55.25 31 -64.61 37 -60.65 15 -36.05 18
Vadodara
-54.18 26 -61.93 25 -59.90 13 -37.44 25
Vishakapatnam
-52.97 20 -58.97 19 -60.65 15 -37.86 27
The Liveability Index 2010
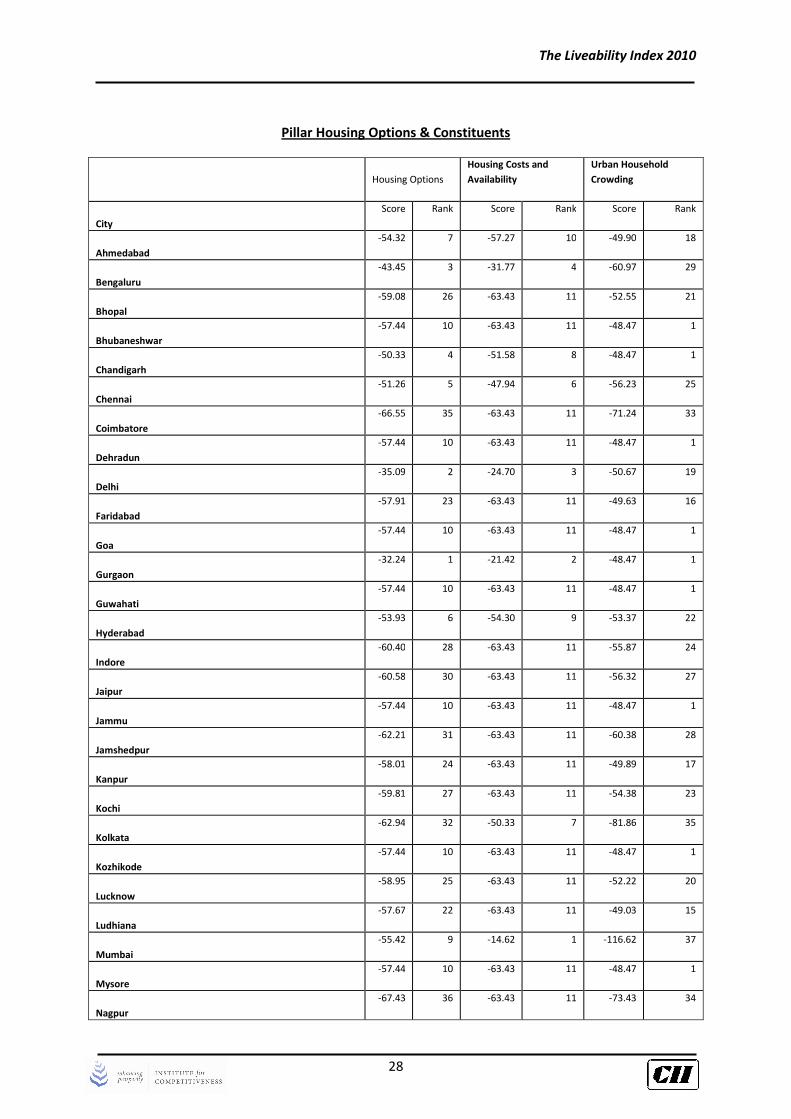
28
Pillar Housing Options & Constituents
Housing Options
Housing Costs and
Availability
Urban Household
Crowding
City
Score Rank Score Rank Score Rank
Ahmedabad
-54.32 7 -57.27 10 -49.90 18
Bengaluru
-43.45 3 -31.77 4 -60.97 29
Bhopal
-59.08 26 -63.43 11 -52.55 21
Bhubaneshwar
-57.44 10 -63.43 11 -48.47 1
Chandigarh
-50.33 4 -51.58 8 -48.47 1
Chennai
-51.26 5 -47.94 6 -56.23 25
Coimbatore
-66.55 35 -63.43 11 -71.24 33
Dehradun
-57.44 10 -63.43 11 -48.47 1
Delhi
-35.09 2 -24.70 3 -50.67 19
Faridabad
-57.91 23 -63.43 11 -49.63 16
Goa
-57.44 10 -63.43 11 -48.47 1
Gurgaon
-32.24 1 -21.42 2 -48.47 1
Guwahati
-57.44 10 -63.43 11 -48.47 1
Hyderabad
-53.93 6 -54.30 9 -53.37 22
Indore
-60.40 28 -63.43 11 -55.87 24
Jaipur
-60.58 30 -63.43 11 -56.32 27
Jammu
-57.44 10 -63.43 11 -48.47 1
Jamshedpur
-62.21 31 -63.43 11 -60.38 28
Kanpur
-58.01 24 -63.43 11 -49.89 17
Kochi
-59.81 27 -63.43 11 -54.38 23
Kolkata
-62.94 32 -50.33 7 -81.86 35
Kozhikode
-57.44 10 -63.43 11 -48.47 1
Lucknow
-58.95 25 -63.43 11 -52.22 20
Ludhiana
-57.67 22 -63.43 11 -49.03 15
Mumbai
-55.42 9 -14.62 1 -116.62 37
Mysore
-57.44 10 -63.43 11 -48.47 1
Nagpur
-67.43 36 -63.43 11 -73.43 34
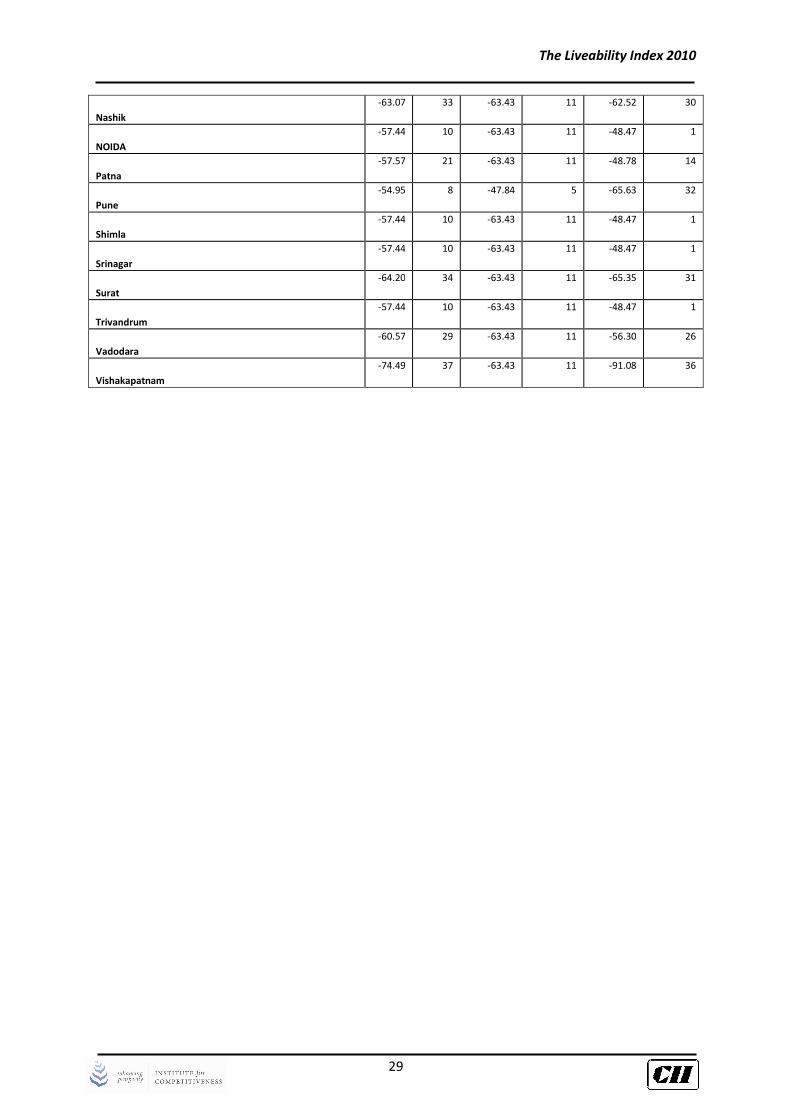
The Liveability Index 2010
29
Nashik
-63.07 33 -63.43 11 -62.52 30
NOIDA
-57.44 10 -63.43 11 -48.47 1
Patna
-57.57 21 -63.43 11 -48.78 14
Pune
-54.95 8 -47.84 5 -65.63 32
Shimla
-57.44 10 -63.43 11 -48.47 1
Srinagar
-57.44 10 -63.43 11 -48.47 1
Surat
-64.20 34 -63.43 11 -65.35 31
Trivandrum
-57.44 10 -63.43 11 -48.47 1
Vadodara
-60.57 29 -63.43 11 -56.30 26
Vishakapatnam
-74.49 37 -63.43 11 -91.08 36
The Liveability Index 2010
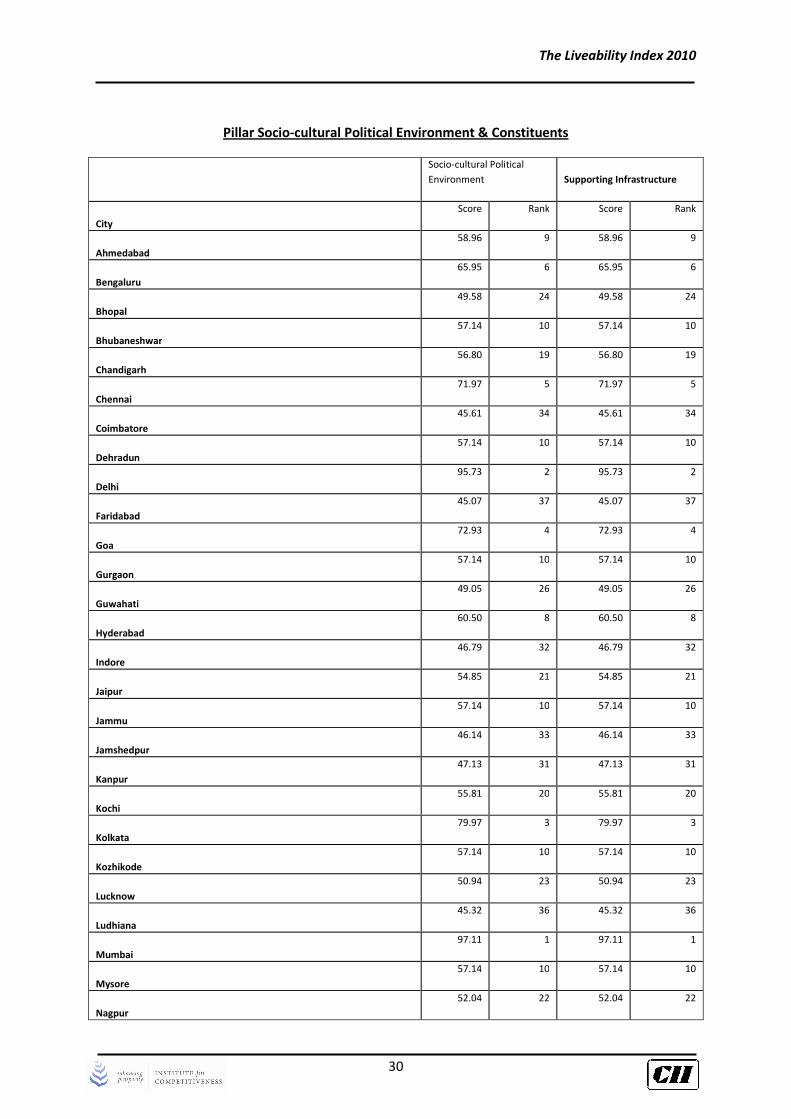
30
Pillar Socio-cultural Political Environment & Constituents
Socio-cultural Political
Environment Supporting Infrastructure
City
Score Rank Score Rank
Ahmedabad
58.96 9 58.96 9
Bengaluru
65.95 6 65.95 6
Bhopal
49.58 24 49.58 24
Bhubaneshwar
57.14 10 57.14 10
Chandigarh
56.80 19 56.80 19
Chennai
71.97 5 71.97 5
Coimbatore
45.61 34 45.61 34
Dehradun
57.14 10 57.14 10
Delhi
95.73 2 95.73 2
Faridabad
45.07 37 45.07 37
Goa
72.93 4 72.93 4
Gurgaon
57.14 10 57.14 10
Guwahati
49.05 26 49.05 26
Hyderabad
60.50 8 60.50 8
Indore
46.79 32 46.79 32
Jaipur
54.85 21 54.85 21
Jammu
57.14 10 57.14 10
Jamshedpur
46.14 33 46.14 33
Kanpur
47.13 31 47.13 31
Kochi
55.81 20 55.81 20
Kolkata
79.97 3 79.97 3
Kozhikode
57.14 10 57.14 10
Lucknow
50.94 23 50.94 23
Ludhiana
45.32 36 45.32 36
Mumbai
97.11 1 97.11 1
Mysore
57.14 10 57.14 10
Nagpur
52.04 22 52.04 22

The Liveability Index 2010
31
Nashik
47.77 30 47.77 30
NOIDA
57.14 10 57.14 10
Patna
48.10 29 48.10 29
Pune
61.25 7 61.25 7
Shimla
57.14 10 57.14 10
Srinagar
57.14 10 57.14 10
Surat
45.51 35 45.51 35
Trivandrum
49.36 25 49.36 25
Vadodara
48.12 28 48.12 28
Vishakapatnam
48.25 27 48.25 27
The Liveability Index 2010
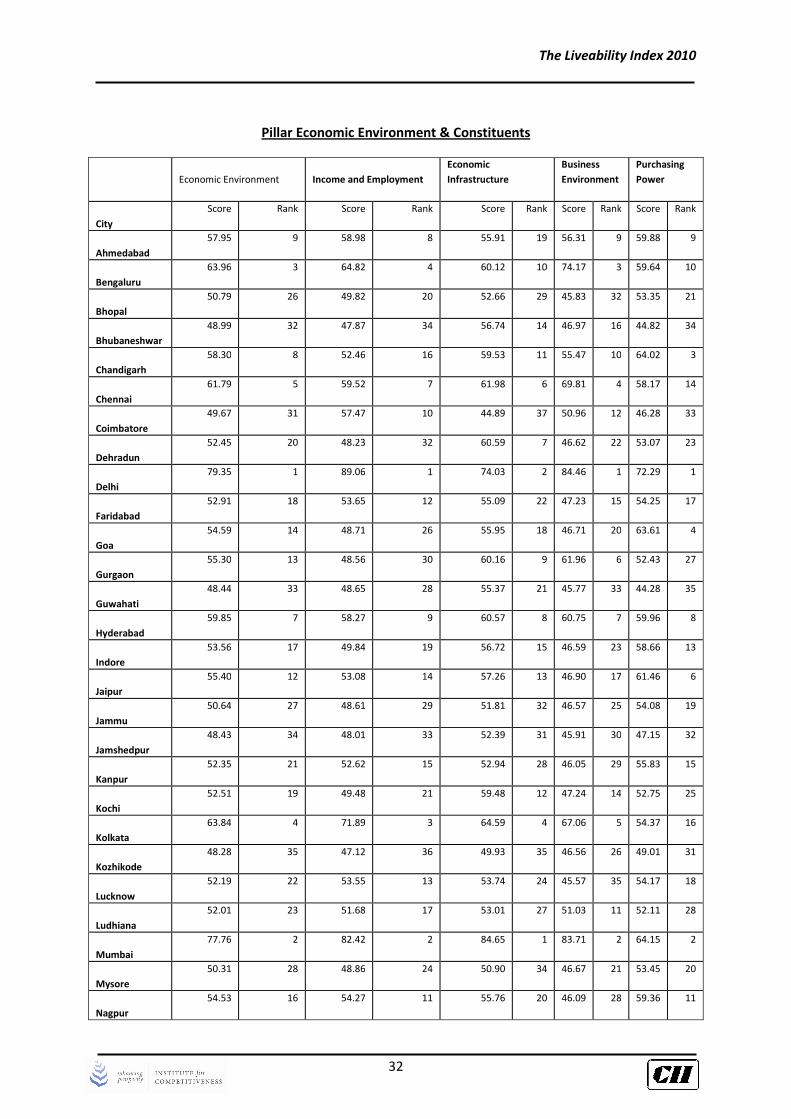
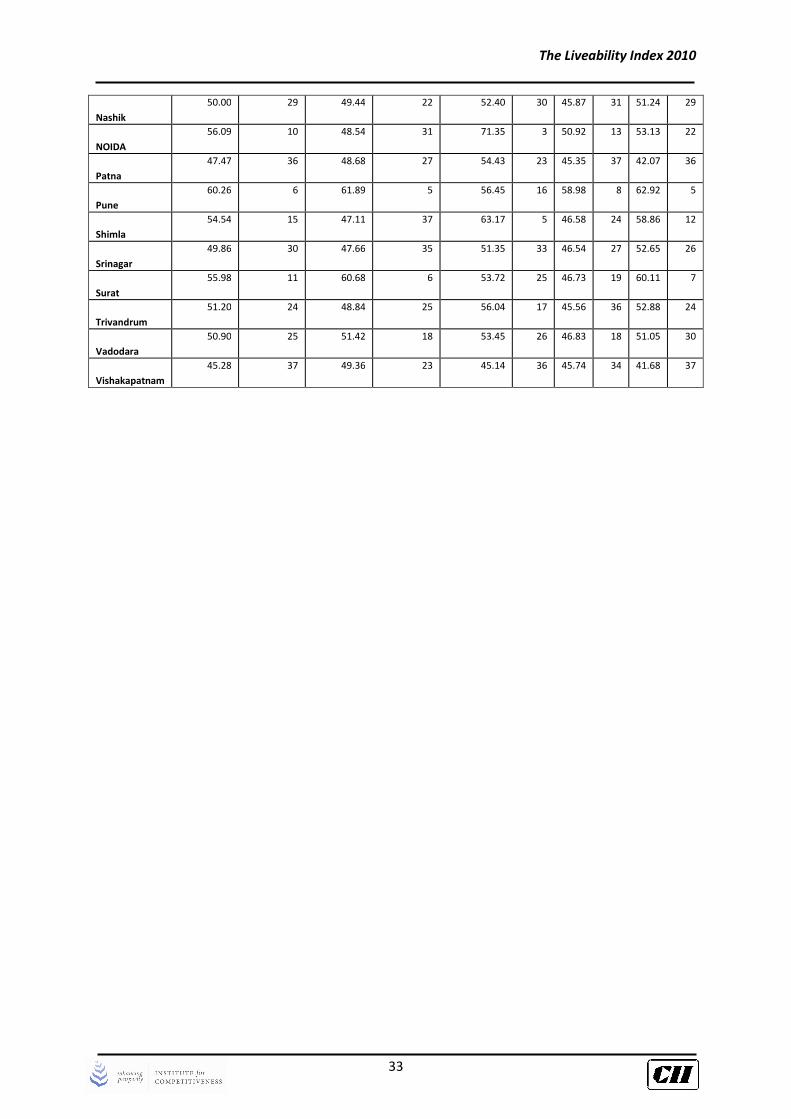
32
Pillar Economic Environment & Constituents
Economic Environment Income and Employment
Economic
Infrastructure
Business
Environment
Purchasing
Power
City
Score Rank Score Rank Score Rank Score Rank Score Rank
Ahmedabad
57.95 9 58.98 8 55.91 19 56.31 9 59.88 9
Bengaluru
63.96 3 64.82 4 60.12 10 74.17 3 59.64 10
Bhopal
50.79 26 49.82 20 52.66 29 45.83 32 53.35 21
Bhubaneshwar
48.99 32 47.87 34 56.74 14 46.97 16 44.82 34
Chandigarh
58.30 8 52.46 16 59.53 11 55.47 10 64.02 3
Chennai
61.79 5 59.52 7 61.98 6 69.81 4 58.17 14
Coimbatore
49.67 31 57.47 10 44.89 37 50.96 12 46.28 33
Dehradun
52.45 20 48.23 32 60.59 7 46.62 22 53.07 23
Delhi
79.35 1 89.06 1 74.03 2 84.46 1 72.29 1
Faridabad
52.91 18 53.65 12 55.09 22 47.23 15 54.25 17
Goa
54.59 14 48.71 26 55.95 18 46.71 20 63.61 4
Gurgaon
55.30 13 48.56 30 60.16 9 61.96 6 52.43 27
Guwahati
48.44 33 48.65 28 55.37 21 45.77 33 44.28 35
Hyderabad
59.85 7 58.27 9 60.57 8 60.75 7 59.96 8
Indore
53.56 17 49.84 19 56.72 15 46.59 23 58.66 13
Jaipur
55.40 12 53.08 14 57.26 13 46.90 17 61.46 6
Jammu
50.64 27 48.61 29 51.81 32 46.57 25 54.08 19
Jamshedpur
48.43 34 48.01 33 52.39 31 45.91 30 47.15 32
Kanpur
52.35 21 52.62 15 52.94 28 46.05 29 55.83 15
Kochi
52.51 19 49.48 21 59.48 12 47.24 14 52.75 25
Kolkata
63.84 4 71.89 3 64.59 4 67.06 5 54.37 16
Kozhikode
48.28 35 47.12 36 49.93 35 46.56 26 49.01 31
Lucknow
52.19 22 53.55 13 53.74 24 45.57 35 54.17 18
Ludhiana
52.01 23 51.68 17 53.01 27 51.03 11 52.11 28
Mumbai
77.76 2 82.42 2 84.65 1 83.71 2 64.15 2
Mysore
50.31 28 48.86 24 50.90 34 46.67 21 53.45 20
Nagpur
54.53 16 54.27 11 55.76 20 46.09 28 59.36 11
The Liveability Index 2010
33
Nashik
50.00 29 49.44 22 52.40 30 45.87 31 51.24 29
NOIDA
56.09 10 48.54 31 71.35 3 50.92 13 53.13 22
Patna
47.47 36 48.68 27 54.43 23 45.35 37 42.07 36
Pune
60.26 6 61.89 5 56.45 16 58.98 8 62.92 5
Shimla
54.54 15 47.11 37 63.17 5 46.58 24 58.86 12
Srinagar
49.86 30 47.66 35 51.35 33 46.54 27 52.65 26
Surat
55.98 11 60.68 6 53.72 25 46.73 19 60.11 7
Trivandrum
51.20 24 48.84 25 56.04 17 45.56 36 52.88 24
Vadodara
50.90 25 51.42 18 53.45 26 46.83 18 51.05 30
Vishakapatnam
45.28 37 49.36 23 45.14 36 45.74 34 41.68 37

The Liveability Index 2010
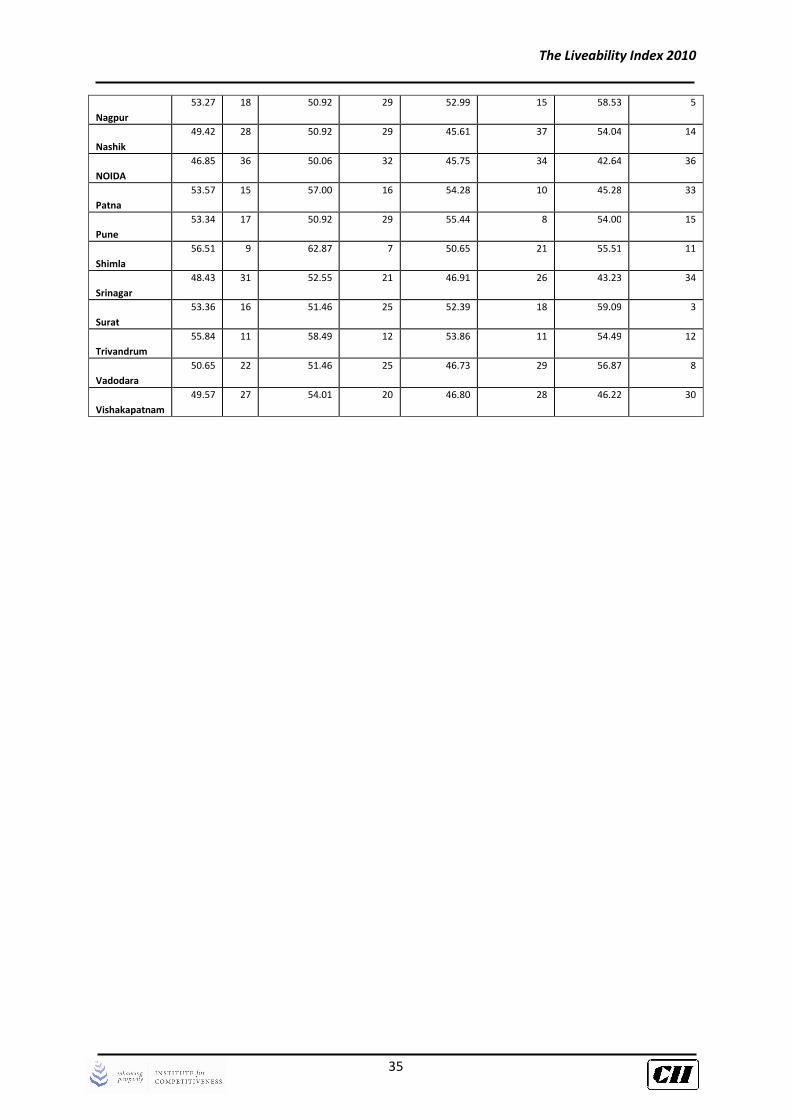
34
Pillar Natural-Built/Planned Environment & Constituents
Natural-
Built/Planned
Environment Communication Transportation Miscellaneous
City
Score Rank Score Rank Score Rank Score Rank
Ahmedabad
59.74 7 62.78 9 55.72 7 61.68 2
Bengaluru
64.67 4 72.02 3 64.62 3 50.07 22
Bhopal
54.53 13 57.83 14 52.48 17 52.02 19
Bhubaneshwar
50.66 21 52.32 22 51.36 20 45.95 32
Chandigarh
48.26 32 41.05 36 53.76 12 51.67 20
Chennai
68.14 2 83.54 2 60.68 5 52.28 17
Coimbatore
49.16 30 51.21 28 47.14 25 49.10 26
Dehradun
47.03 35 45.42 34 47.57 23 49.14 25
Delhi
66.93 3 68.73 5 69.35 1 58.50 6
Faridabad
48.18 33 51.37 27 45.75 34 46.65 29
Goa
49.82 25 41.05 36 54.54 9 57.92 7
Gurgaon
49.92 24 54.52 18 45.99 32 48.58 28
Guwahati
53.23 19 54.92 17 53.17 14 49.98 23
Hyderabad
62.01 5 68.58 6 57.06 6 58.78 4
Indore
50.30 23 51.49 24 47.16 24 54.19 13
Jaipur
54.72 12 57.26 15 52.64 16 53.81 16
Jammu
48.02 34 51.68 23 46.89 27 42.94 35
Jamshedpur
44.14 37 43.09 35 46.33 31 41.88 37
Kanpur
54.14 14 58.67 11 52.08 19 49.21 24
Kochi
56.03 10 58.49 12 53.52 13 56.13 10
Kolkata
60.77 6 62.87 8 62.93 4 52.25 18
Kozhikode
57.65 8 69.44 4 46.44 30 56.50 9
Lucknow
49.39 29 50.06 32 48.11 22 50.63 21
Ludhiana
52.48 20 62.43 10 45.69 36 46.16 31
Mumbai
80.55 1 98.62 1 69.16 2 67.21 1
Mysore
49.82 26 54.18 19 45.88 33 48.96 27
The Liveability Index 2010
35
Nagpur
53.27 18 50.92 29 52.99 15 58.53 5
Nashik
49.42 28 50.92 29 45.61 37 54.04 14
NOIDA
46.85 36 50.06 32 45.75 34 42.64 36
Patna
53.57 15 57.00 16 54.28 10 45.28 33
Pune
53.34 17 50.92 29 55.44 8 54.00 15
Shimla
56.51 9 62.87 7 50.65 21 55.51 11
Srinagar
48.43 31 52.55 21 46.91 26 43.23 34
Surat
53.36 16 51.46 25 52.39 18 59.09 3
Trivandrum
55.84 11 58.49 12 53.86 11 54.49 12
Vadodara
50.65 22 51.46 25 46.73 29 56.87 8
Vishakapatnam
49.57 27 54.01 20 46.80 28 46.22 30
36

37
38

39
40
41

42

43

44
45

46

47