The Light at the End of the Tunnel - Green Growth … Light at the End of the Tunnel The Impact of...
32
The Light at the End of the Tunnel The Impact of Policy on the Global Diffusion of Fluorescent Lamps Presented by Suchita Srinivasan Ph.D Candidate in International Economics, The Graduate Institute (Geneva, Switzerland)
-
Upload
truongdien -
Category
Documents
-
view
219 -
download
2
Transcript of The Light at the End of the Tunnel - Green Growth … Light at the End of the Tunnel The Impact of...
The Light at the End of the Tunnel
The Impact of Policy on the Global Diffusion of Fluorescent Lamps
Presented by Suchita Srinivasan
Ph.D Candidate in International Economics, The Graduate
Institute (Geneva, Switzerland)
Agenda
• Introduction
• Objective
• Empirical Model and Results
• Policy Implications
• Conclusion

Introduction-I
• Light production accounts for about 19% of global electricity use p.a, and 70% of the CO2emissions of
all the world’s passenger vehicles (IEA, 2005)
• Main types of lamps compared in the paper:
• Incandescent lamps- inefficient (90% of electrical energy wasted as heat)
• Fluorescent lamps (FL, includes CFL)-higher initial price, but lower operating costs than
incandescents
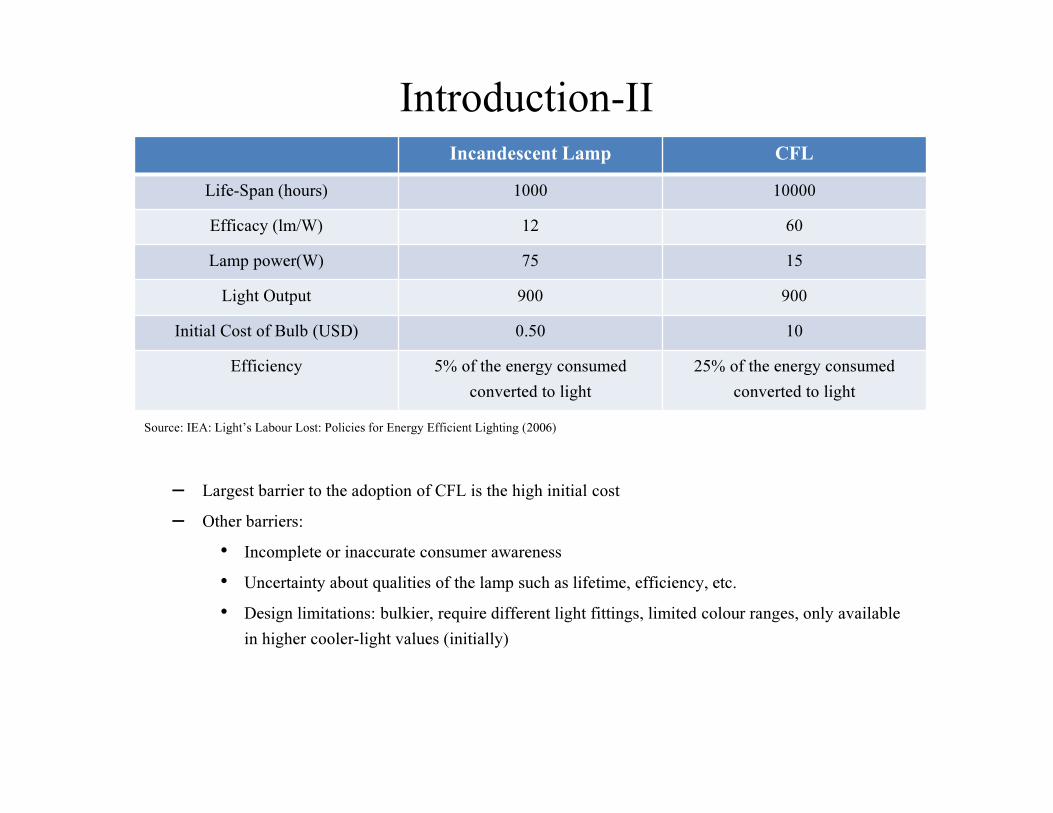
Introduction-II
– Largest barrier to the adoption of CFL is the high initial cost
– Other barriers:
• Incomplete or inaccurate consumer awareness
• Uncertainty about qualities of the lamp such as lifetime, efficiency, etc.
• Design limitations: bulkier, require different light fittings, limited colour ranges, only available
in higher cooler-light values (initially)
Incandescent Lamp CFL
Life-Span (hours) 1000 10000
Efficacy (lm/W) 12 60
Lamp power(W) 75 15
Light Output 900 900
Initial Cost of Bulb (USD) 0.50 10
Efficiency 5% of the energy consumed
converted to light
25% of the energy consumed
converted to light
Source: IEA: Light’s Labour Lost: Policies for Energy Efficient Lighting (2006)

Introduction-IIIType of policy (focus on the residential sector) Example
Ban on Incandescent Bulbs Cuba: Banned the import of incandescent lamps since April 2005. Incandescent
lamp replacement program starting in August 2005 & replaced all 9.4 million
incandescent lamps with CFL
Minimum Energy Performance Standards (MEPS) Brazil: CFL bulbs with power between 15 and 25 W should have a minimum
luminous efficacy of 60 lm/W
Mandatory Labelling Costa Rica: Since 1996, labels displaying the energy consumption and the
MEPS mandatory
Voluntary Labelling Thailand: Since 2002, CFLs with a life of more than 8000 hours may be
labelled based on performance and energy data
Awareness Raising and Promotional Campaigns Ghana: ‘Lighting Africa’ campaign, which carries out road shows, door-to-door
consumer engagement, retailer education drives, etc.
Free CFL Distribution Schemes Rwanda: First efficient light distribution CDM project in Africa: 50000 lamps
distributed for free, then 150000 distributed at subsidised price of 0.30 USD
Subsidies, tax incentives, rebates Egypt: UNDP/GEF Project involving the Ministry of Electricity and Energy,
which will distribute 3-4 million CFL, at a 50% subsidy to low-income families
Ghana eliminated tariffs and VAT on CFLs, Tunisia introduced a progressive
consumption tax (from 10% in 2007 to 50% in 2011) on the sale of
incandescent lamps

Objective
• To explain the role of:
– Domestic policies
– Trade policy
– Nature of governance
in the diffusion of compact fluorescent lamps into a sample of low and
middle-income countries
• Questions:
• How important, relatively, are the different policies for this sample of countries?
• Should some policies be prioritized over others, at least in the beginning?
• How important are factors such as instruments of trade policy and nature of governance in
influencing technology diffusion?

Data SourcesVariable Data Source Notes
Dependent variableShare of value of net CFL
imports UN COMTRADE
Defined as the value of net imports of
CFL as a proportion of net imports of
CFL and net imports of incandescent
lamps
RegulationIncandescent Ban
UNEP en.lighten Country Lighting Assessments/ other
country-level reports
Dummies which are manually coded
(take the value 1 when the policy is in
place) using the UNEP en.lighten
Global Policy Map
MEPS
Information
Mandatory and Voluntary
Labels
Awareness Programs
Price IncentivesFree CFL Distribution
Subsidies
Ratio of Tariffs on CFL to
Tariffs on IBWITS (TRAINS) Tariff Data
Trade to GDP World Bank Database
Trade Agreement IndicatorDe Sousa, J.(2012) , “ The currency union effect on trade is
decreasing over time”, Economic Letters, 117(3), 917-920
Dummy which takes the value 1 if the
county is in a trade agreement with
one of the top 5 CFL exporters in a
given year
Distance times the share of
CFL exports of the 5
largest exporters
Centre d’Etudes Prospectives et d’Informations
Internationales (CEPII) Database; UN COMTRADE
Polity Index Polity IV DatasetVaries from -10 to 10: -10 for a strict
autocracy, 10 for a strict democracy
Sum of LightsNational Oceanic and Atmospheric Administration (NOAA)
National Climatic Data Center Data (Satellite Data)Sum of night-time lights (measure of
development of the country)
GDP Per Capita World Bank Database

Countries in the Data Sample (1993-2013)
Albania Costa Rica Guatemala Madagascar Pakistan Suriname
Argentina Cote d'Ivoire Guinea-Bissau Malawi Panama Swaziland
Bangladesh Cuba Guyana Malaysia Peru Tajikistan
Belarus
Democratic Republic of Congo
(Zaire) Haiti Mali Philippines Timor-Leste
Belize Dominica Honduras Mauritius Romania Togo
Benin Dominican Republic India Mexico Rwanda Tunisia
Bolivia Egypt Iran Morocco Saint Lucia Turkey
Brazil El Salvador Jamaica Mozambique Senegal Uganda
Bulgaria Ecuador Jordan Namibia Seychelles Ukraine
Cape Verde Ethiopia Kazakhastan Nepal South Africa Venezuela
Central African Republic Gambia Kenya Nicaragua Sri Lanka Vietnam
Colombia Ghana Lebanon Nigeria Sudan Zambia
Zimbabwe
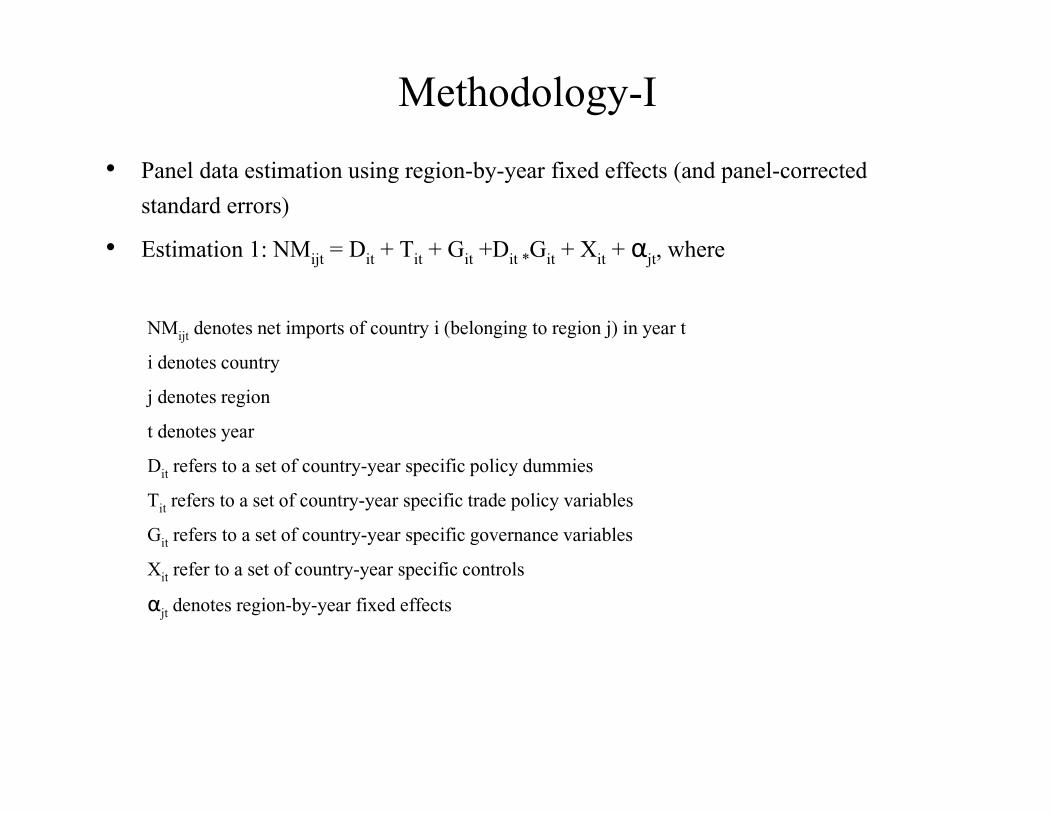
Methodology-I
• Panel data estimation using region-by-year fixed effects (and panel-corrected
standard errors)
• Estimation 1: NMijt= D
it+ T
it+ G
it+D
it *G
it+ X
it+ α
jt, where
NMijt
denotes net imports of country i (belonging to region j) in year t
i denotes country
j denotes region
t denotes year
Ditrefers to a set of country-year specific policy dummies
Titrefers to a set of country-year specific trade policy variables
Gitrefers to a set of country-year specific governance variables
Xitrefer to a set of country-year specific controls
αjtdenotes region-by-year fixed effects
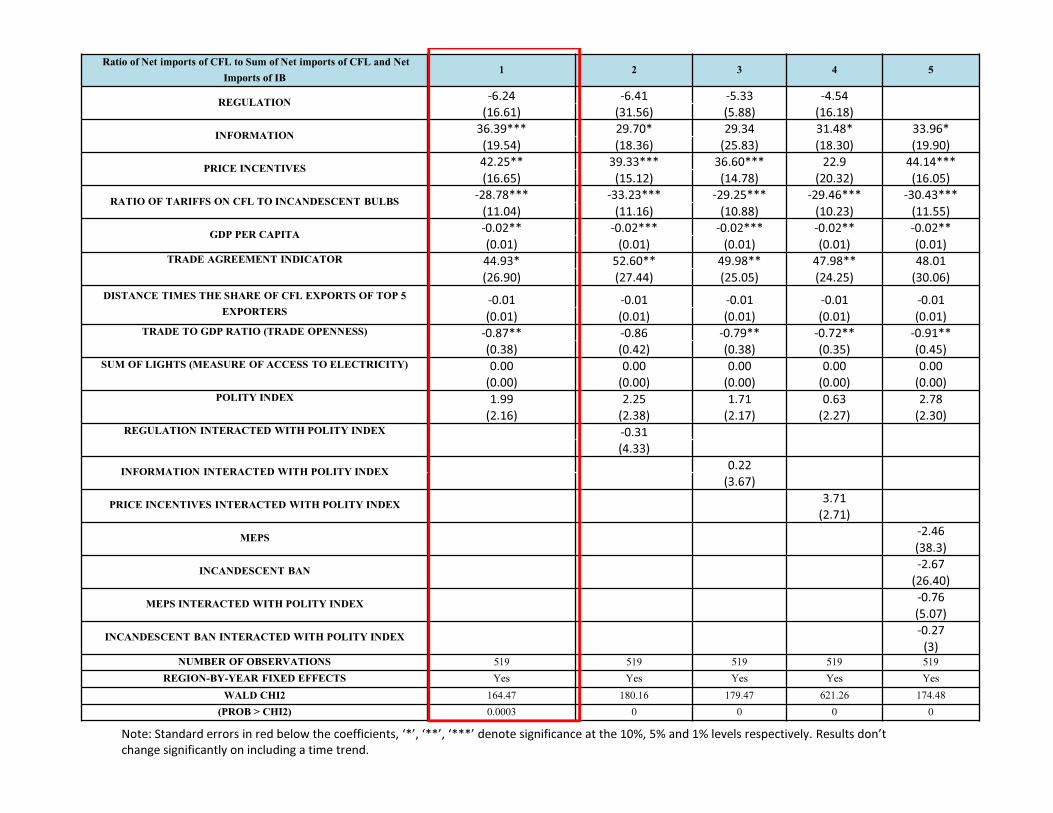
Note: Standard errors in red below the coefficients, ‘*’, ‘**’, ‘***’ denote significance at the 10%, 5% and 1% levels respectively. Results don’t
change significantly on including a time trend.
Ratio of Net imports of CFL to Sum of Net imports of CFL and Net
Imports of IB1 2 3 4 5
REGULATION-6.24 -6.41 -5.33 -4.54
(16.61) (31.56) (5.88) (16.18)
INFORMATION36.39*** 29.70* 29.34 31.48* 33.96*
(19.54) (18.36) (25.83) (18.30) (19.90)
PRICE INCENTIVES42.25** 39.33*** 36.60*** 22.9 44.14***
(16.65) (15.12) (14.78) (20.32) (16.05)
RATIO OF TARIFFS ON CFL TO INCANDESCENT BULBS-28.78*** -33.23*** -29.25*** -29.46*** -30.43***
(11.04) (11.16) (10.88) (10.23) (11.55)
GDP PER CAPITA-0.02** -0.02*** -0.02*** -0.02** -0.02**
(0.01) (0.01) (0.01) (0.01) (0.01)TRADE AGREEMENT INDICATOR 44.93* 52.60** 49.98** 47.98** 48.01
(26.90) (27.44) (25.05) (24.25) (30.06)
DISTANCE TIMES THE SHARE OF CFL EXPORTS OF TOP 5
EXPORTERS-0.01 -0.01 -0.01 -0.01 -0.01
(0.01) (0.01) (0.01) (0.01) (0.01)TRADE TO GDP RATIO (TRADE OPENNESS) -0.87** -0.86 -0.79** -0.72** -0.91**
(0.38) (0.42) (0.38) (0.35) (0.45)SUM OF LIGHTS (MEASURE OF ACCESS TO ELECTRICITY) 0.00 0.00 0.00 0.00 0.00
(0.00) (0.00) (0.00) (0.00) (0.00)POLITY INDEX 1.99 2.25 1.71 0.63 2.78
(2.16) (2.38) (2.17) (2.27) (2.30)REGULATION INTERACTED WITH POLITY INDEX -0.31
(4.33)
INFORMATION INTERACTED WITH POLITY INDEX0.22
(3.67)
PRICE INCENTIVES INTERACTED WITH POLITY INDEX3.71
(2.71)
MEPS-2.46
(38.3)
INCANDESCENT BAN-2.67
(26.40)
MEPS INTERACTED WITH POLITY INDEX-0.76
(5.07)
INCANDESCENT BAN INTERACTED WITH POLITY INDEX-0.27
(3)NUMBER OF OBSERVATIONS 519 519 519 519 519
REGION-BY-YEAR FIXED EFFECTS Yes Yes Yes Yes Yes
WALD CHI2 164.47 180.16 179.47 621.26 174.48
(PROB > CHI2) 0.0003 0 0 0 0
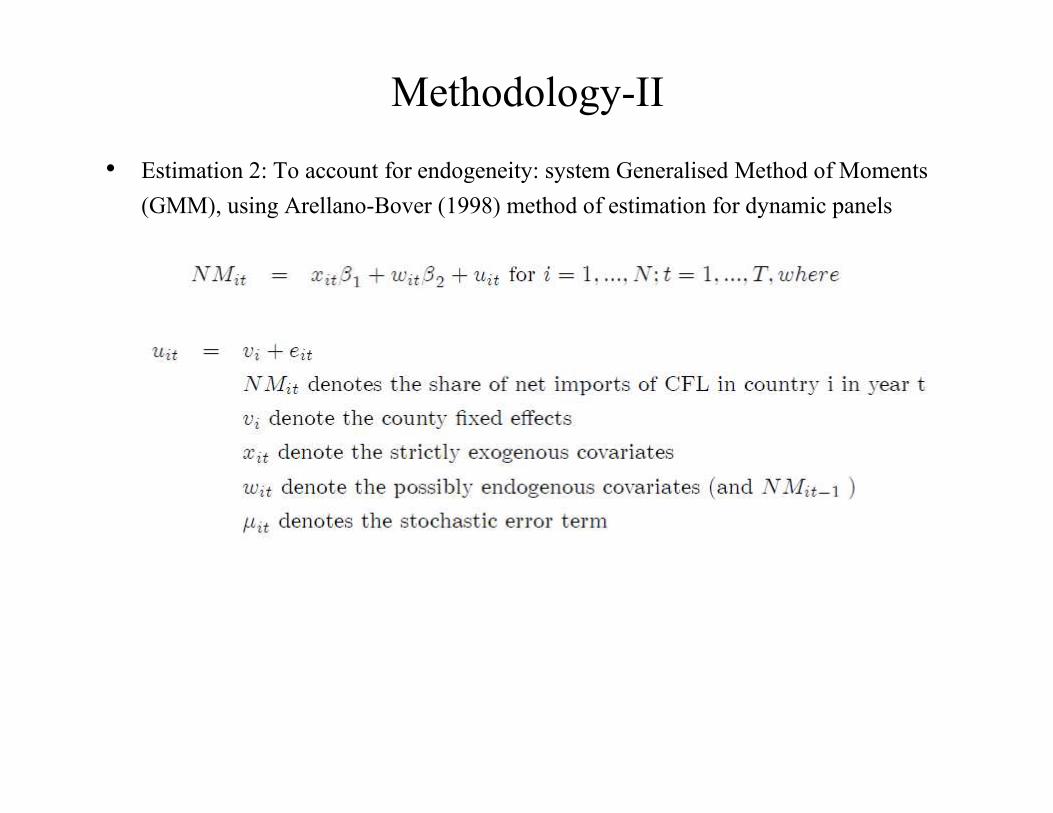
Methodology-II
• Estimation 2: To account for endogeneity: system Generalised Method of Moments
(GMM), using Arellano-Bover (1998) method of estimation for dynamic panels

Ratio of Net imports of CFL to Sum of Net imports of CFL and Net Imports of
IB1 2 3 4 5
LAG OF RATIO OF NET IMPORTS OF CFL0.15*** 0.16*** 0.16*** 0.16*** 0.16***(0.03) (0.04) (0.04) (0.04) (0.04)
REGULATION35.43 50.30* 40.8 38.62
(32.72) (28.48) (31.60) (33.51)
INFORMATION34.12** 32.80** 29.68* 28.29* 28.86**
(17.33) (15.80) (17.46) (16.03) (14.44)
PRICE INCENTIVES43.67** 37.71** 39.30** 25.19* 39.15**
(17.80) (18.61) (17.49) (13.55) (19.47)
RATIO OF TARIFF ON CFL TO TARIFF ON INCANDESCENT BULBS-12.32 -11.37 -9.46 -7.25 -9.44
(12.56) (12.58) (11.15) (11.43) (11.57)
GDP PER CAPITA-0.01 -0.01 -0.01 -0.01 -0.01
(0.01) (0.01) (0.01) (0.01) (0.01)
TRADE AGREEMENT INDICATOR39.95 43.40 39.94 35.68 39.13
(33.16) (31.08) (32.23) (31.58) (28.73)
DISTANCE TIMES THE SHARE OF CFL EXPORTS OF TOP 5 EXPORTERS-0.01 -0.01 -0.01 -0.01 -0.01
(0.01) (0.01) (0.01) (0.01) (0.01)TRADE TO GDP RATIO (TRADE OPENNESS) 0.06 -0.01 0.03 0.05 0.00
(0.13) (0.10) (0.12) (0.12) (0.10)
POLITY INDEX2.80* 2.80** 2.41 1.24 2.61*
(1.66) (1.42) (1.58) (1.25) (1.41)
REGULATION INTERACTED WITH POLITY INDEX-2.28(3.07)
INFORMATION INTERACTED WITH POLITY INDEX-0.05
(2.14)
PRICE INCENTIVES INTERACTED WITH POLITY INDEX2.17
(1.58)
MEPS45.06
(28.09)
INCANDESCENT BAN8.67
(14.66)
MEPS INTERACTED WITH POLITY INDEX-1.03
(4.46)
INCANDESCENT BAN INTERACTED WITH POLITY INDEX-4.67
(5.90)NUMBER OF OBSERVATIONS 486 486 486 486 486
YEAR FIXED EFFECTS Yes Yes Yes Yes Yes
F-STATISTIC 100.54 108.5 105.44 107.02 103.01
(PROB > F) 0 0 0 0 0
SARGAN TEST 0.984 0.991 0.992 0.992 0.992

Caveats
• There may be differences in consumer behavior between announcement
and implementation of policies
• Use of dummies for policies doesn’t account for scale of policies,
distributional impacts of policies, etc.
• Model proxies diffusion with net imports
• Analysis doesn’t factor for differences in operating costs between both
types of lamps
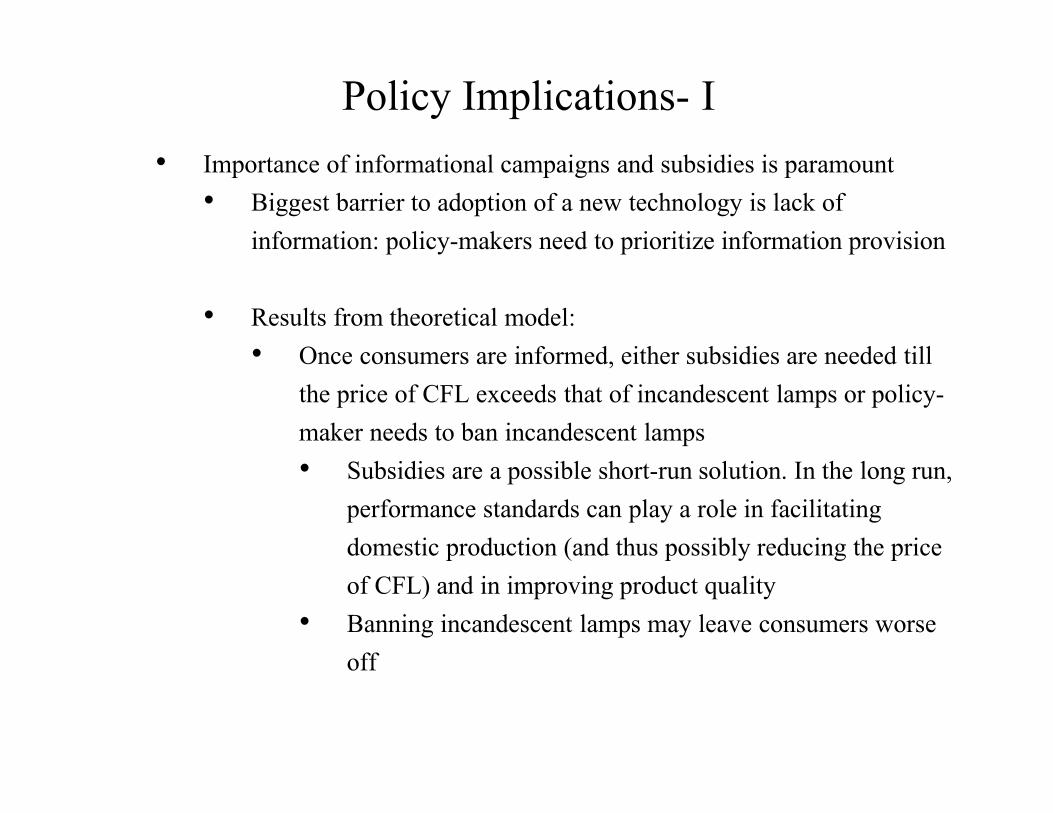
Policy Implications- I
• Importance of informational campaigns and subsidies is paramount
• Biggest barrier to adoption of a new technology is lack of
information: policy-makers need to prioritize information provision
• Results from theoretical model:
• Once consumers are informed, either subsidies are needed till
the price of CFL exceeds that of incandescent lamps or policy-
maker needs to ban incandescent lamps
• Subsidies are a possible short-run solution. In the long run,
performance standards can play a role in facilitating
domestic production (and thus possibly reducing the price
of CFL) and in improving product quality
• Banning incandescent lamps may leave consumers worse
off
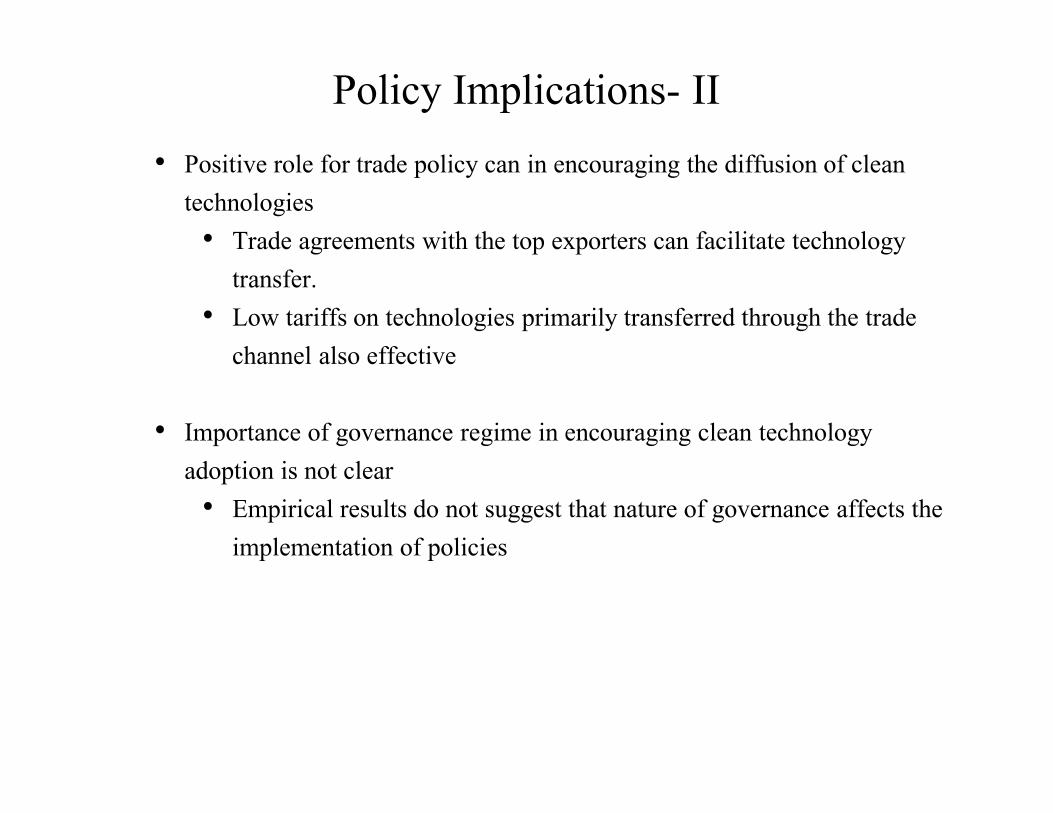
Policy Implications- II
• Positive role for trade policy can in encouraging the diffusion of clean
technologies
• Trade agreements with the top exporters can facilitate technology
transfer.
• Low tariffs on technologies primarily transferred through the trade
channel also effective
• Importance of governance regime in encouraging clean technology
adoption is not clear
• Empirical results do not suggest that nature of governance affects the
implementation of policies

Policy Implications- III
• Governments need to make coordinated efforts to ensure that quality-
control standards are maintained by firms
• For example, countries can coordinate in setting performance
standards to ensure that manufacturers follow quality-control
guidelines.
• Many countries have resorted to domestic production as a means of
mitigating the uncertainty that arises from the imports of low-quality CFL
(examples include Poland and Hungary).
• This offers another channel through which the government can
influence CFL adoption: providing incentives to domestic firms to
produce these lamps.

Conclusion
• Information and subsidies incentivize consumers to switch to using cleaner
technologies
• Regulatory measures such as performance standards and banning
incandescent lamps may also be effective in the long-run
• Trade policy matters- tariff and participation in trade agreements work in
expected ways
• Nature of government may matter, but the channel is not clear
• Possible extensions:
– Role of ‘policy leader’ in influencing adoption in other countries (for
example, Cuba in 2005)
– Importance of product quality
– Are there differences between autocracies and democracies in the type of
policies they use?

Thank You For Your Attention.

Appendix

Literature Review
• Role of policies in explaining the adoption of clean lighting (evidence from
country-level studies):
- Germany: Demographic characteristics (Mills and Schleich (2008, 2013)
- India: Informational campaigns (Kumar et. Al (2003))
- US: Information, subsidies and standards (Alcott and Taubinsky (2013))
• Technology Diffusion:
- Trade as a channel of technology diffusion( Coe , Helpman and Hoffmaister (1995), Eaton and Kortum(2002), Keller (2004))
- Use of imports as a proxy for technology adoption (Caselli and Coleman II (2001) and Papageorgiou et. al. (2006))
• Effect of domestic policies, trade policy, and governance (regimes and
government effectiveness) on innovation and diffusion :
- Effect of domestic policies on innovation (Johnstone et al (2008))
- Effect of domestic policies on diffusion (Bosetti and Verdolini (2013))
- Effect of trade policy on technology adoption (Reppelin-Hill(1999) , Comin, Dmitriev and Rossi-Hansberg (2013))
- Effect of governance on international trade (Aidt and Gassebner (2010), Levchenko (2007), Mansfield et. al. (2000))
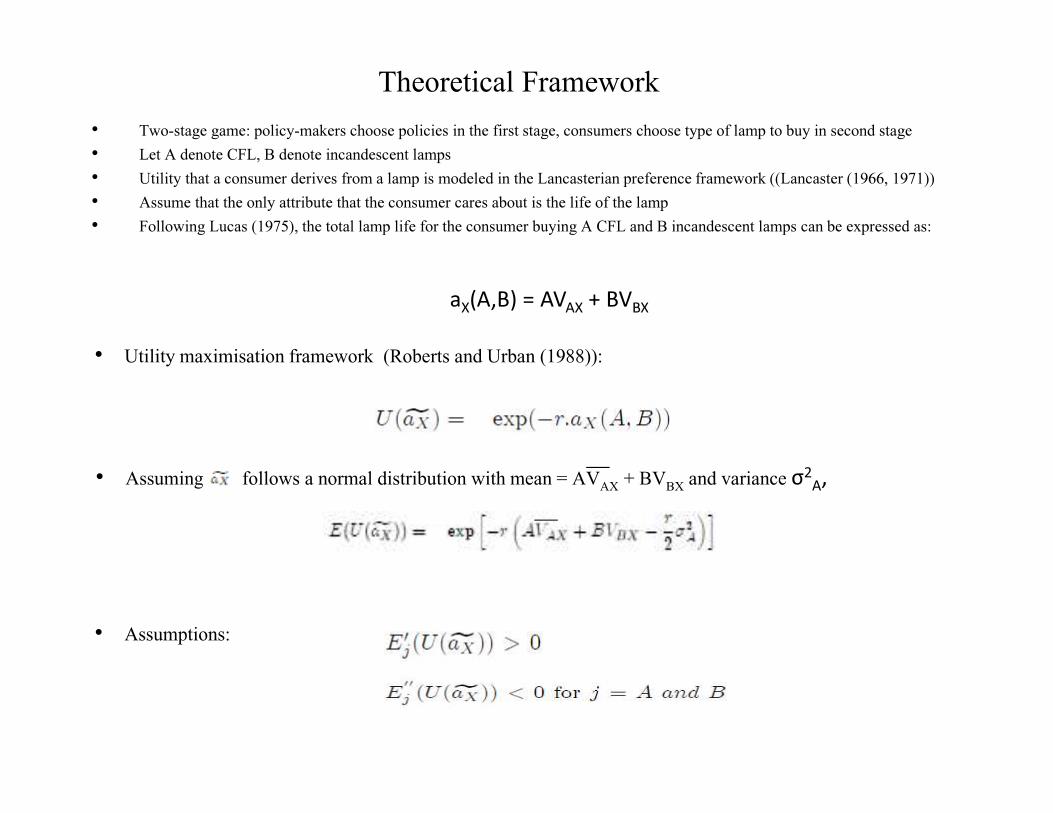
Theoretical Framework
• Two-stage game: policy-makers choose policies in the first stage, consumers choose type of lamp to buy in second stage
• Let A denote CFL, B denote incandescent lamps
• Utility that a consumer derives from a lamp is modeled in the Lancasterian preference framework ((Lancaster (1966, 1971))
• Assume that the only attribute that the consumer cares about is the life of the lamp
• Following Lucas (1975), the total lamp life for the consumer buying A CFL and B incandescent lamps can be expressed as:
• Utility maximisation framework (Roberts and Urban (1988)):
• Assuming follows a normal distribution with mean = AVAX
+ BVBX
and variance σ2
A,
• Assumptions:
aX(A,B) = AV
AX+ BV
BX

Representative Consumer’s Problem (Second-Stage)
• Representative consumer only chooses one type of lamp (A or B): for him to choose A over B,
• This condition can be re-written as:
• This implies that

Role of Policy-maker (First Stage)
• The choices of the government are the subsidy τ, and the following parameters (R and θ) where R and θ
are given by:
• θ represents the government’s ‘effectiveness’ in providing information to consumers
• L is dummy which takes the value 1 if a label (or awareness campaign) is present, and g represents the level
of government effectiveness (depends positively on protection of property rights, low levels of bureaucracy
etc.)
• Also, assume that α= α(a), α’>0, where a represents the level of autocracy of the government
α,β > 0
0<γ<1

Policy-maker’s problem-I
where
subject to a budget constraint
• Proposition: social welfare is higher when B=0 rather than when A=0, i.e.
S(A=0)<S(B=0).
Proof: follows from convexity assumption on damage function, i.e.
• The policy-maker thus maximises social welfare (S), where
and
(1)
(2)

Policy-maker’s problem-II
• Solving using Kuhn-Tucker conditions:

Policy-maker’s problem-III
Proposition: Once the consumer is perfectly informed about the life of a CFL, he will be indifferent between the two
lamps, i.e. CFL and incandescent lamps become perfect substitutes. To ensure sustained CFL consumption, the
government would either need to ensure the existence of subsidies, or impose a ban on incandescent lamps.
• Proof: the consumer’s problem becomes
• The consumer’s choice then becomes
(PA-τ)/P
B< μ/V
BX
(PA-τ)/P
B> μ/V
BX
(PA-τ)/P
B= μ/V
BX
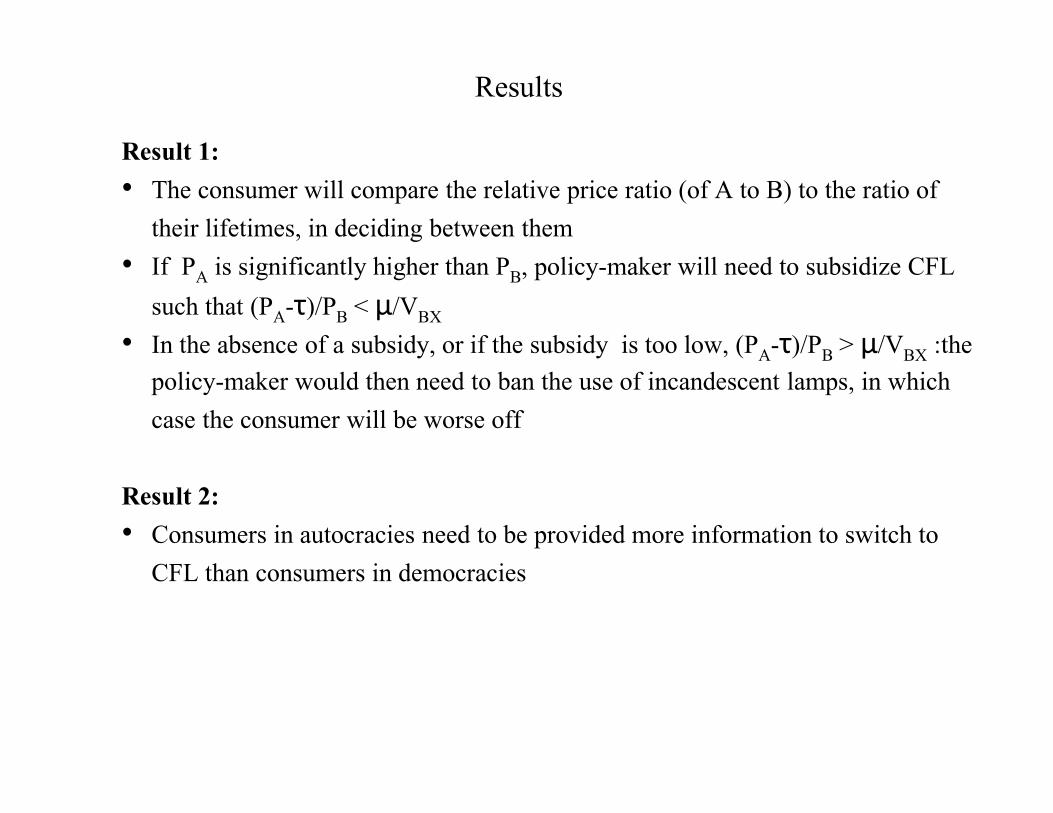
Results
Result 1:
• The consumer will compare the relative price ratio (of A to B) to the ratio of
their lifetimes, in deciding between them
• If PA
is significantly higher than PB, policy-maker will need to subsidize CFL
such that (PA-τ)/P
B< μ/V
BX
• In the absence of a subsidy, or if the subsidy is too low, (PA-τ)/P
B> μ/V
BX:the
policy-maker would then need to ban the use of incandescent lamps, in which
case the consumer will be worse off
Result 2:
• Consumers in autocracies need to be provided more information to switch to
CFL than consumers in democracies

Policy Adoption Rates (By Year)
0
0.1
0.2
0.3
0.4
0.5
0.6
0.7
Poli
cy A
dop
tion
Rate
(%
)
Year
Average Policy Adoption Rates (By Year)
Incandescent Ban
Free CFL Distribution
Price Incentives
Awareness Campaigns
Disposa/Recycling
Requirements
Voluntary labelling
MEPS on CFL

Summary Statistics on the Dependent Variable
0
10
20
30
40
50
60
70
80
90
Sh
are o
f Im
ports
an
d E
xp
orts
of
CF
L (
By
Valu
e)
Year
Average Shares of Imports and Exports of CFL
(By Value)
Average Share of
Imports of CFL to
Total Imports of
CFL and IB
Average Share of
Exports of CFL to
Total Exports of
CFL and IB0
20
40
60
80
100
120
1993
1994
1995
1996
1997
1998
1999
2000
2001
2002
2003
2004
2005
2006
2007
2008
2009
2010
2011
2012
2013
Sh
are o
f N
et
Imp
orts
of
CF
L (
By v
alu
e)
Year
Average Share of Net Imports of CFL
(By Value)
Variable (All defined in terms of value) Observations Mean Std Dev Missing
(Net Imports of CFL)/(Net Imports of CFL + Net Imports of Incandescents) 1061 67.02 138.85 427
(Imports of CFL)/(Imports of CFL + Imports of Incandescents) 1059 64.16 22.34 429
(Exports of CFL)/(Exports of CFL + Exports of Incandescents) 610 54.07 34.35 828
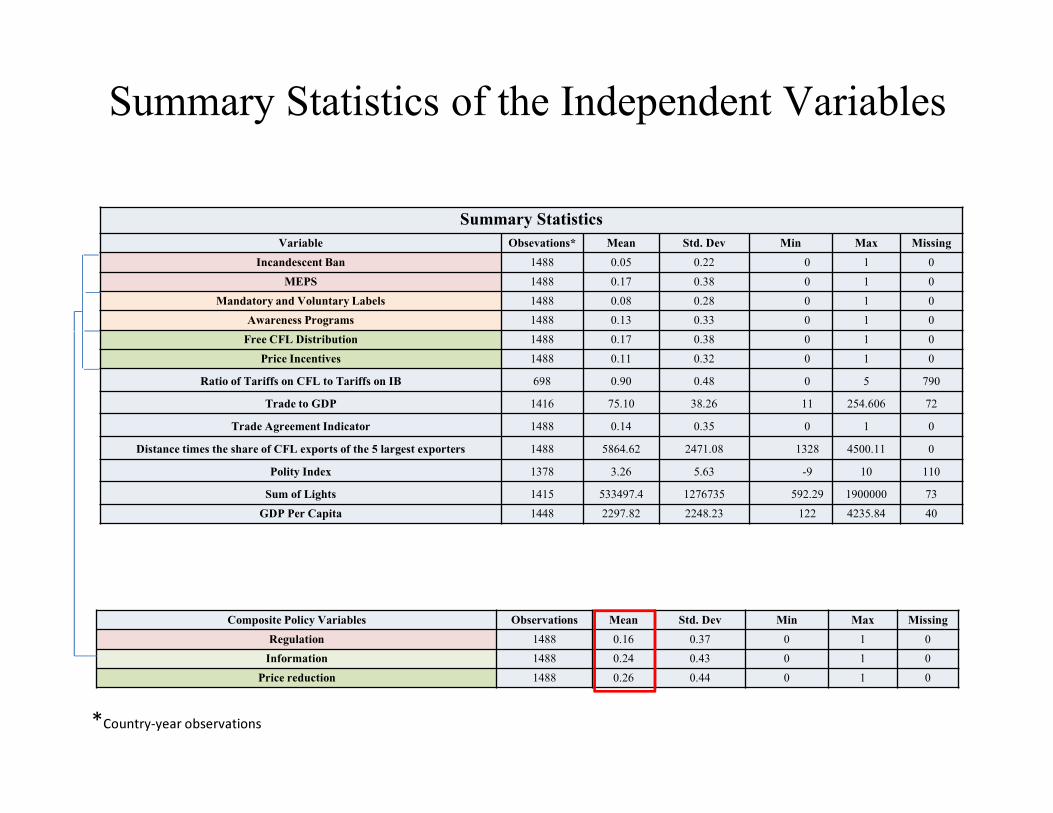
Summary Statistics of the Independent Variables
Summary Statistics
Variable Obsevations* Mean Std. Dev Min Max Missing
Incandescent Ban 1488 0.05 0.22 0 1 0
MEPS 1488 0.17 0.38 0 1 0
Mandatory and Voluntary Labels 1488 0.08 0.28 0 1 0
Awareness Programs 1488 0.13 0.33 0 1 0
Free CFL Distribution 1488 0.17 0.38 0 1 0
Price Incentives 1488 0.11 0.32 0 1 0
Ratio of Tariffs on CFL to Tariffs on IB 698 0.90 0.48 0 5 790
Trade to GDP 1416 75.10 38.26 11 254.606 72
Trade Agreement Indicator 1488 0.14 0.35 0 1 0
Distance times the share of CFL exports of the 5 largest exporters 1488 5864.62 2471.08 1328 4500.11 0
Polity Index 1378 3.26 5.63 -9 10 110
Sum of Lights 1415 533497.4 1276735 592.29 1900000 73
GDP Per Capita 1448 2297.82 2248.23 122 4235.84 40
Composite Policy Variables Observations Mean Std. Dev Min Max Missing
Regulation 1488 0.16 0.37 0 1 0
Information 1488 0.24 0.43 0 1 0
Price reduction 1488 0.26 0.44 0 1 0
*Country-year observations
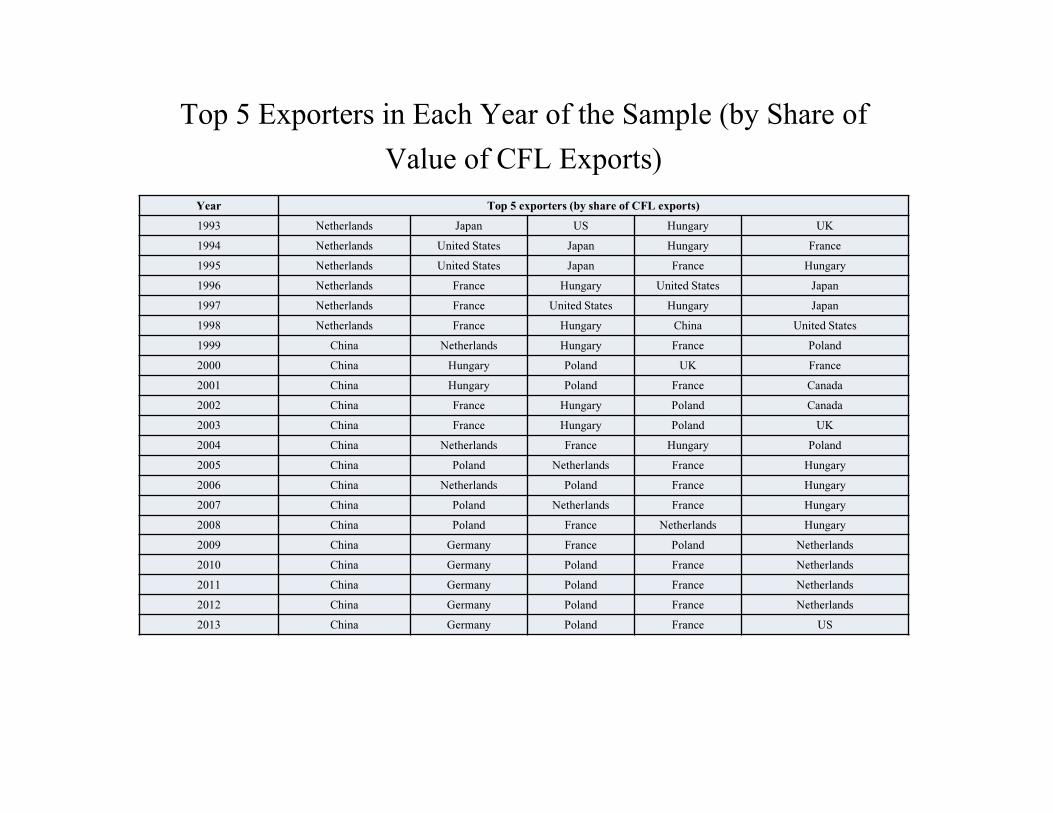
Year Top 5 exporters (by share of CFL exports)
1993 Netherlands Japan US Hungary UK
1994 Netherlands United States Japan Hungary France
1995 Netherlands United States Japan France Hungary
1996 Netherlands France Hungary United States Japan
1997 Netherlands France United States Hungary Japan
1998 Netherlands France Hungary China United States
1999 China Netherlands Hungary France Poland
2000 China Hungary Poland UK France
2001 China Hungary Poland France Canada
2002 China France Hungary Poland Canada
2003 China France Hungary Poland UK
2004 China Netherlands France Hungary Poland
2005 China Poland Netherlands France Hungary
2006 China Netherlands Poland France Hungary
2007 China Poland Netherlands France Hungary
2008 China Poland France Netherlands Hungary
2009 China Germany France Poland Netherlands
2010 China Germany Poland France Netherlands
2011 China Germany Poland France Netherlands
2012 China Germany Poland France Netherlands
2013 China Germany Poland France US
Top 5 Exporters in Each Year of the Sample (by Share of
Value of CFL Exports)

Light Production by Lamp Type