The Leeds Cab Drivers Project - Leeds Beckett University · The Leeds Cab Drivers Project...
30
The Leeds Cab Drivers Project EVALUATION REPORT Karl Witty Dr Gary Raine Prof Steve Robertson November 2013
Transcript of The Leeds Cab Drivers Project - Leeds Beckett University · The Leeds Cab Drivers Project...

The Leeds Cab Drivers Project
EVALUATION REPORT
Karl Witty
Dr Gary Raine
Prof Steve Robertson
November 2013

1
Reader Information
Leeds Metropolitan University were commissioned to undertake the evaluation of the
Leeds Cab Drivers project by Hamara Healthy Living Centre, who themselves received
funding from the Pfizer UK foundation.
This report was prepared by Karl Witty Dr. Gary Raine and Professor Steve Robertson,
Centre for Men’s Health, Institute for Health and Wellbeing, Leeds Metropolitan
University.
The report was produced using data collected by Starr Zaman, Darren O’Donovan and
Shanaz Gul from Hamara Healthy Living Centre.
Report Reference:
Witty, K. Raine, G & Robertson, S. (2013). Leeds Cab Drivers Project: Evaluation
Summary Report. Centre for Men’s Health, Leeds Metropolitan University.
Contact Details:
Karl Witty
Centre for Men’s Health
Institute for Health and Wellbeing
Leeds Metropolitan University
80 Woodhouse Lane
Leeds, LS2 8NU
Phone: 0113 812 1968
Email: [email protected]

2
Acknowledgements
The Centre for Men’s Health would like to thank the following individuals and
organisations for donating their time and supporting the research team throughout
the evaluation project.
Firstly we would like to thank each person who consented to take part in the
evaluation study and supplied us with the data. Secondly, the staff at Hamara for
their considerable support throughout the course of the study. Finally we would like
to thank our colleagues at Leeds Metropolitan University who have supported us
throughout this project.

3
Contents
Reader Information 1
Acknowledgements 2
Contents 3
Background 4
Previous work 6
The Intervention 7
Evaluation Methods 9
Results 11
Discussion 24
Next Steps 25
References 26

4
Background
This publication reports findings from the evaluation of the Leeds Cab Drivers (LCD)
Project, a culturally sensitive health intervention designed to improve the health and
wellbeing of taxi drivers working in Leeds. The intervention was funded by the Pfizer
UK foundation and was delivered by staff from Hamara Healthy Living Centre. The
evaluation was jointly conducted by Hamara and Leeds Metropolitan University.
Taxi drivers, as a group suffer high levels of chronic disease linked to sedentary
lifestyles, poor diet and the stressful nature of their work (McCullagh, 2008). Taxi
drivers can experience difficult working conditions in which they work long, unsociable
hours, take on the financial risk of ownership of capital, low custom; as well as the
increased risk of illness and violent attack (Facey, 2010, McEvoy and Hafeez, 2009).
A recent European review of good practice guidelines for taxi drivers also highlighted
occupational health hazards (including chemical and biological contamination) which
may negatively impact on the health of professional taxi drivers. (EU-OSHA., 2010).
The most recent Joint Strategic Needs Assessment (JSNA) highlighted the strong link
between deprivation and poor health and wellbeing in Leeds (NHS Leeds & Leeds City
Council, 2012). Rates of deprivation in Leeds are high, with 150,000 inhabitants in
the city ranked in the most deprived 10% in England (NHS Leeds & Leeds City
Council, 2012). People in Leeds experience disproportionate levels of ill health and
early mortality compared to England as a whole (Public Health England, 2013). Male
mortality in Leeds is a key concern particularly when taking into account the health
inequalities experienced by men living in the most deprived areas of the city (NHS
Leeds & Leeds City Council, 2012). The average life expectancy for men in Leeds is
77.9 years (82.2 for women) however, in the most deprived areas of the city men can
expect to live just 65.5 years (74.0 years for women) (Leeds City Council, 2012).
Leeds has a large South Asian1 population; including a Pakistani population of over
15,000 and an Indian population of over 12,000. 7.8% of the population of the Inner
South Area of Leeds, in which Hamara Healthy Living Centre is located are of South
Asian heritage (compared to 5.9% of the population of Leeds) (Leeds Observatory,
2012). Whilst heterogeneous in terms of culture and heritage the South Asian
population shares common health issues (NHS Choices, 2012), including a higher risk
of premature death from coronary heart disease compared to the general population
(British Heart Foundation, 2011) and between 5 and 6 times greater likelihood of
being diagnosed with diabetes (British Heart Foundation, 2009).
South Asian pupils consistently perform well below the national average in our schools
and 32% of Pakistanis and 44% of Bangladeshi adults have no recognised
qualifications (national average = 15%). This disparity can be compounded when
English is spoken as a second language. This poor performance in education may
bolster inequitable access to jobs. South Asian men are strongly represented in
transport and communication industries with taxi driving being the predominant
1 The term ‘South Asian’ is, in the context of this report used in reference to anyone with
a Pakistani, Indian, Bangladeshi or Sri Lankan ethnic origin, or decent

5
activity (McEvoy and Hafeez, 2009). With limited access to the labour market, taxi
driving can often be the only viable form of employment for some South Asian men.
One source estimates 25% of Pakistani men are primarily taxi drivers (Equality and
Human Rights Commission, 2013), many of whom will be the sole income earner in
the family.
Current data (Department for Transport, 2013) tells us that 5,807 taxi licenses were
issued in Leeds in 2013, the vast majority of these will be male and a significant
proportion will be of South Asian heritage.
6
Previous work
A rapid review of literature revealed a number of UK projects targeting taxi drivers.
The number of projects with accessible evaluation reports was however limited and on
the whole evaluations lacked rigour.
A project addressing the unmet cardiology needs of taxi drivers in Dundee used a pilot
questionnaire to gauge taxi driver’s interest in cardiovascular health checks, before
inviting groups of drivers to attend health checks in a range of settings. Taxi drivers
were found to have an ASSIGN2 calculated risk of 20% or greater were referred to
their GP for further assessment. Taxi drivers presenting symptoms suggestive of
undiagnosed coronary heart disease were invited to attend a community based
cardiology clinic. Of the drivers receiving health checks 53% (n=83) required further
investigation or management, and four drivers described symptoms which suggested
the presence of cardiac disease (Dryden et al., 2008).
The ‘Colin the Cabbie Programme’ was an NHS Sefton supported project which aimed
to reduce the risk of taxi drivers developing chronic conditions such as diabetes,
cancer and chronic heart disease. Project aims were to be achieved through the
distribution of a lifestyle brochure, stop smoking postcards, free gym passes, launch
of a cooking and nutrition group and provision of a peer mentoring scheme. Reported
outcomes from the project included a 4% increase in the number of men attending
stop smoking services, an increase in rates of exercise, and healthier diets amongst
those engaged with the intervention compared to those who had not (McCullagh,
2008).
‘Taxi!’, was a pilot intervention developed by Walsall Council Creative Development
Team to encourage local taxi drivers to review and make positive changes to their
lifestyle. In order to achieve this, drivers were shown a film illustrating how they
could be active during ‘idle time’. It also involved health messages disseminated
through car accessories, distribution of men’s health manuals and support for taxi
firms to make structural changes which were perceived to benefit the health of their
drivers. Evaluation of project outcomes was sought through semi-structured
interviews with 15 drivers who had watched the film. Drivers reported increased
levels of physical activity, positive changes in diet, but also highlighted existing
barriers to achieve better health within the target population (NSMC, 2009).
The Champions for Achieving Better Health in Sheffield (CABS) project involved
training a core group of South Asian taxi drivers as ‘health champions’ to conduct
health promotion within their community. This included encouraging colleagues to
access cardiovascular disease screening. Monitoring data and semi-structured
interviews were used to assess the impact of the project. Of the 80 health checks
initially administered, 50% were identified as being at risk of cardiovascular disease,
with 35% requiring a follow-up appointment (Willis and Dhoot, 2012)
2 See http://assign-score.com/ for details of the ASSIGN score

7
The Intervention
The LCD Project was designed and delivered by staff at Hamara Healthy Living Centre
in collaboration with Leeds Metropolitan University. Established in 2004, the Hamara
Healthy Living centre is located in Beeston, South Leeds. Hamara seeks to ‘bring
communities together’ tackling social exclusion within what is a multi-ethnic
community. Hamara aims to achieve this through the provision of culturally
appropriate services. (South, 2008). A significant proportion of Hamara’s service
users are from the local South Asian community.
Aims & Objectives: The overarching aim of the LCD Project was to improve the
health and wellbeing of taxi drivers, and their families working within the Leeds area.
Specifically, the intervention sought to:
Improve diet and increase physical activity and thus help to reduce the
likelihood of long term illnesses which particularly affect the health of men
employed as taxi drivers.
Use sports and cultural activities to disseminate health awareness information to
participants.
Develop a multiagency approach to maximise the benefits of the programme
and aid sustainability of the project.
Implement a ‘health champion model’ of health promotion within each firm by
training peer mentors, so they can offer lifestyle advice and information to
fellow taxi drivers.
Primary intervention setting: Hamara Healthy Living Centre, Beeston, Leeds
Intervention length: Each participant was engaged in the intervention for a 12
week period. The project was delivered over a period of approximately one year.
Overview: In order to achieve these aims it was anticipated that the following
activities would be delivered:
Recruitment and training of ‘health champions’ within taxi firms across the
region.
Use of ‘health champions’ to raise awareness of the project and promote the
potential health benefits of joining the project.
Organisation of weekly 5-a-side football matches.
Work with local GP practices to identify people who may benefit from joining the
project.
Distribution of free 12 week gym memberships for one of five gyms in Leeds or
Dewsbury. As part of this membership each driver would receive:
o A personalised gym programme and one-to-one support from a gym
instructor.

8
o Offer of a weekly circuit training class.
Those attending the healthy living centre would receive the following support:
An initial one-to-one health assessment for each participant, followed up at the
end of the 12 weeks. Anybody showing signs of an undiagnosed health concern
would be referred to GP services.
Guidance on healthy eating and physical activity, delivered verbally with
supporting paper resources.
Recruitment of wives and partners of taxi drivers.
o A review of shopping lists and cooking habits.
o Advice and recommendations as to how wives and partners could improve
the families’ diet.
Delivery: The project was designed to be delivered through a multi-agency approach,
with Hamara as the lead agency and support from Leeds Metropolitan University, NHS
Leeds, Local GP Practices and taxi firms.
Fidelity: Budgetary restrictions and reflective learning meant that some aspects of
the intervention were not delivered as initially planned. Specifically, it was
anticipated that intervention participants would be recruited from local GP surgeries,
however, this was not found to be an effective means of engaging the target
population and therefore this strategy was not pursued over the duration of the
project. Promotional events were also scaled back in order to meet the amended
budget.
9
Evaluation Methods
The Institute for Health and Wellbeing at Leeds Metropolitan University were
employed to conduct an evaluation to measure the success of the project in
collaboration with Hamara.
Aims of the study
The primary aim of the study was to identify changes in taxi drivers’ health and
lifestyle over the course of the project.
Secondary aims of the study were to:
Monitor the sharing of information during participation in the intervention.
Examine the extent to which the intervention meets participants’ expectations.
Collate participant feedback
Evaluation design and instrumentation
A non-experimental evaluation, before and after design was employed. The primary
data collection tool was a questionnaire (available on request) administered before
and after each participant had engaged with the intervention. The questionnaire,
collected data on each participants’ perceived health status, levels of physical activity,
diet, lifestyle, support, use of services as well as background information.
Recruitment and sampling
A non-probability sample of service users was sought. No upper or lower limit was on
numbers was set, no other recruitment criteria was imposed.
Recruitment to the evaluation study ran concurrently with recruitment to the
intervention. Each taxi driver choosing to engage in the intervention was presented
with a recruitment pack containing:
A Participant Information sheet
A consent form
A health passport
An evaluation questionnaire
Recruitment of participants to the evaluation study was conducted solely by Hamara
staff.

10
Data collection
The questionnaire was administered by Hamara staff members at baseline (before
participants had engaged in any intervention activities) and 12 weeks later, when
intervention activities had been completed. Hamara staff were able to provide
assistance with translation of questions and answers to any participants who required
support.
Analysis
The data were analysed using the statistical software package SPSS. Percentage
responses were calculated from the total number of valid answers given for each
question. For some questions, additional analytical tests were performed on the data
to investigate whether the change from the start (baseline) to the end of the
programme (follow-up) was statistically significant. A paired t-test was used in
relation to measures of weight, waist circumference, BMI, systolic & diastolic blood
pressure, sitting time and hours worked. A Wilcoxon Paired Signed-Rank Test was
used for the questions related to self-reported health rating, frequency of physical
activity, frequency of fruit & vegetable consumption, social support, GP use and use of
health advice & information services. For all these tests a p value of 0.05 was taken
to be statistically significant. For some analyses a confidence interval is reported. A
confidence interval provides an indication of the range within which the true effect is
likely to be. The width of a confidence interval is affected by the size of the sample,
with smaller samples tending to have larger confidence intervals than bigger ones. A
confidence interval of a mean difference that does not pass through 0 is indicative of
a statistically significant change.
11
Results
This section of the report provides a detailed overview of questionnaire data provided
at baseline and 12 week follow-up. Data in this section is presented both as a
frequency and also a percentage of those providing a legible response to that
question. For clarity the number of responses on which the percentages were
calculated is displayed (n =). In some cases, the percentages may not add up to
exactly 100% due to rounding. Incomplete or illegible responses are not included in
the analysis.
Description of Participants
In total, 66 questionnaires were returned for analysis. All (100%) of the 66
respondents were male. Of those providing information on ethnicity (n=65) the
majority (91%, n=59) were Asian/Asian British Pakistani, and a further 5% (n=3)
Asian/Asian Indian. Three per cent were White British (n=2) and one respondent
(approximately 1%) was Asian/Asian British Bangladeshi.
All but two respondents (97%, n=63) lived with family. One respondent lived alone
and another lived with friends. In total, 99% (n=65) of respondents were taxi
drivers. One person was a family member of a taxi driver. The mean (average)
number of people who were dependent on participants income given was 4 (SD=1.5).
The highest number was 8 and the lowest was 0, with 72% of respondents having
between 3 to 5 people dependent on their income.
The Health of Participants
Self-Reported Health Status
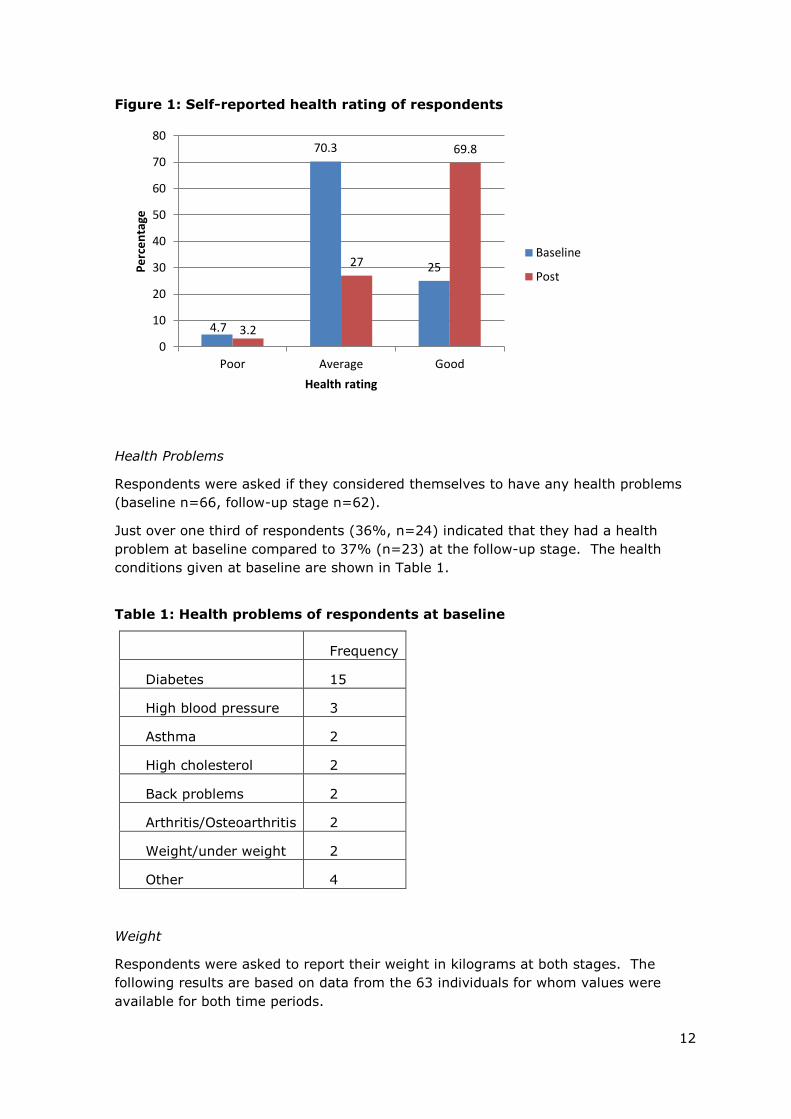
Respondents were asked to describe their own health at the start and the end of the
intervention (baseline n=64, follow-up n=63). As Figure 1 shows the proportion of
respondents who rated their health as `good’ increased from 25% (n=16) at baseline
to 70% (n=44) at follow-up. Conversely, the proportion of individuals stating
`average’ decreased from 70% (n=45) to 27% (n=17) between the stages. The
proportion of respondents rating their health as `poor’ remained similar at both
stages (5%, n=3 at baseline & 3%, n=2 at follow-up stage). Further analysis
revealed that health ratings at follow-up were significantly better than at baseline
(T=2, p<0.001).
12
Figure 1: Self-reported health rating of respondents
Health Problems
Respondents were asked if they considered themselves to have any health problems
(baseline n=66, follow-up stage n=62).
Just over one third of respondents (36%, n=24) indicated that they had a health
problem at baseline compared to 37% (n=23) at the follow-up stage. The health
conditions given at baseline are shown in Table 1.
Table 1: Health problems of respondents at baseline
Frequency
Diabetes 15
High blood pressure 3
Asthma 2
High cholesterol 2
Back problems 2
Arthritis/Osteoarthritis 2
Weight/under weight 2
Other 4
Weight
Respondents were asked to report their weight in kilograms at both stages. The
following results are based on data from the 63 individuals for whom values were
available for both time periods.
4.7
70.3
25
3.2
27
69.8
0
10
20
30
40
50
60
70
80
Poor Average Good
Pe
rce
nta
ge
Health rating
Baseline
Post

13
The mean weight of respondents at baseline was 84.6Kg (SD = 12.01). The
highest weight was 120.7Kg and the lowest was 57.2Kg.
The mean weight of respondents at the follow-up stage was 83.9Kg (SD= 11.8).
The highest weight was 118Kg and the lowest was 58.5Kg3.
The mean change in weight was -0.7Kg (SD= 2.6). The 95% confidence interval
was -0.9Kg to -1.4Kg, which is indicative of a statistically significant change.
This was supported by additional analysis that revealed the weight of
participants at the end of the intervention was significantly lower than at the
start (t=-2.26, df=62, p=0.027).
Weight change ranged from -5.1Kg to +8Kg.
Waist Circumference
Respondents were asked to report their waist circumference in inches at both
stages. The following results are based on data from the 63 individuals for whom
values were available for both time periods.
The mean waist circumference of respondents at baseline was 38.6 inches (SD
=4.4). The largest waist circumference was 48.8 inches and the smallest was 28
inches.
The mean waist circumference of respondents at the follow-up stage was 37.9
inches (SD= 4.2). The largest waist circumference was 50.4 inches and the
smallest was 29 inches.
The mean change in waist circumference was -0.7 inches (SD= 1.6). The 95%
confidence interval was -0.28 inches to -1.1 inches, which is indicative of a
statistically significant change. This is supported by additional analysis that
revealed the waist circumference of participants at the end of the intervention
was significantly lower than at the start (t=-3.34, df=62 p=0.001).
Change in waist circumference ranged from -5 inches to +6.5 inches.
Body Mass Index
Using height and weight data available for participants their BMI at baseline and
the follow-up stage (n=63) was calculated using the formula weight (kg)/height
(m)2.
The mean BMI of respondents at baseline was 28.2 (SD=4.1). The highest BMI
was 38.2 and the lowest was 18.1.
3 Some participants expressed a wish to gain weight.

14
The mean BMI of respondents at the follow-up stage was 28 (SD=4.0). The
highest BMI was 39.2 and the lowest was 18.5.
The mean change in BMI was -0.2 (SD=0.8). The 95% confidence interval was -
0.3 to -0.5 which is indicative of a statistically significant change. This was
supported by additional analysis that revealed the BMI of participants at the end
of the intervention was significantly lower than at the start (t=-2.25 df=62,
p=0.028).
BMI change ranged from -1.9 to +2.7.
Blood Pressure
At each stage respondents had their blood pressure measured by a trained
member of the Hamara team. Sixty-one respondents provided measures at both
stages.
Systolic Blood Pressure
The mean systolic blood pressure of respondents at baseline was 137.3 mmHg
(SD =13.8). The highest systolic blood pressure was 178 mmHg and the lowest
was 114 mmHg.
The mean systolic blood pressure of respondents at the follow-up stage was
135.5 mmHg (SD=14.9). The highest systolic blood pressure was 186 mmHg
and the lowest was 110 mmHg.
The mean change in systolic blood pressure was -1.7 mmHg (SD= 9.3). The
95% confidence interval was 0.7 to -4.1 which is indicative of no significant
change. This is supported by additional analysis that revealed the systolic blood
pressure of participants at the end of the intervention was not significantly
higher or lower than at the start (t=-1.44 df=60, p=0.154).
Change in systolic blood pressure ranged from -32 mmHg to +29 mmHg.
Diastolic Blood Pressure
The mean diastolic blood pressure of respondents at baseline was 84.6 mmHg
(SD =12.9). The highest diastolic blood pressure was 113 mmHg and the
lowest was 45 mmHg.
The mean diastolic blood pressure of respondents at the follow-up stage was
81.2mmHg (SD=10.8). The highest diastolic blood pressure was 104 mmHg
and the lowest was 37 mmHg.
The mean change in diastolic blood pressure was -3.5 mmHg (SD=8.1). The
95% confidence interval was -1.4 mmHg to -5.6 mmHg which is indicative of a
statistically significant change. This is supported by additional analysis that
revealed the diastolic blood pressure of participants at the end of the
intervention was significantly lower than at the start (t=-3.37 df=60, p=0.001).
Change in diastolic blood pressure ranged from -26 mmHg to +22 mmHg.
15
At baseline, 27 participants provided a high blood pressure reading of 140 or above
(systolic) or 90 above (diastolic). At follow-up, there were 16 who had a blood
pressure of 140 or above (systolic) or 90 above (diastolic). Therefore 11 provided
high blood pressure readings at baseline but not follow-up. Conversely, there were
3 who had a blood pressure of less than 140 and less than 90 at baseline, but at
follow-up had a blood pressure of 140 or above or 90 above. i.e. 3 did not have
high blood pressure at baseline but did at follow-up.
Physical Activity
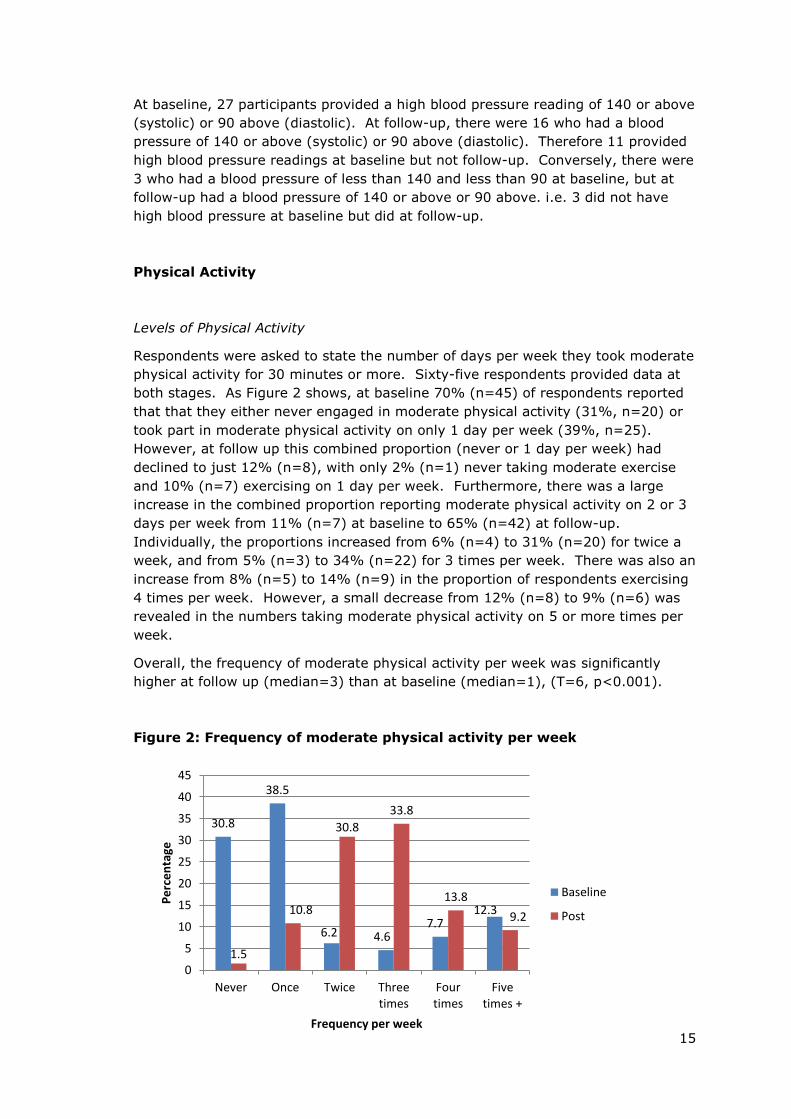
Levels of Physical Activity
Respondents were asked to state the number of days per week they took moderate
physical activity for 30 minutes or more. Sixty-five respondents provided data at
both stages. As Figure 2 shows, at baseline 70% (n=45) of respondents reported
that that they either never engaged in moderate physical activity (31%, n=20) or
took part in moderate physical activity on only 1 day per week (39%, n=25).
However, at follow up this combined proportion (never or 1 day per week) had
declined to just 12% (n=8), with only 2% (n=1) never taking moderate exercise
and 10% (n=7) exercising on 1 day per week. Furthermore, there was a large
increase in the combined proportion reporting moderate physical activity on 2 or 3
days per week from 11% (n=7) at baseline to 65% (n=42) at follow-up.
Individually, the proportions increased from 6% (n=4) to 31% (n=20) for twice a
week, and from 5% (n=3) to 34% (n=22) for 3 times per week. There was also an
increase from 8% (n=5) to 14% (n=9) in the proportion of respondents exercising
4 times per week. However, a small decrease from 12% (n=8) to 9% (n=6) was
revealed in the numbers taking moderate physical activity on 5 or more times per
week.
Overall, the frequency of moderate physical activity per week was significantly
higher at follow up (median=3) than at baseline (median=1), (T=6, p<0.001).
Figure 2: Frequency of moderate physical activity per week
30.8
38.5
6.2 4.6 7.7
12.3
1.5
10.8
30.8
33.8
13.8
9.2
0
5
10
15
20
25
30
35
40
45
Never Once Twice Threetimes
Fourtimes
Fivetimes +
Pe
rce
nta
ge
Frequency per week
Baseline
Post

16
Intention to Increase Levels of Physical Activity
At baseline 91% (n=60) of respondents intended to increase the amount of
physical activity taken compared to 52% (n=34) at the follow-up stage.
Reasons for Not Taking Physical Activity4
Respondents were asked to state what had prevented them from taking part in
physical activity in the past. Table 2 shows that the most common responses at
baseline were ‘work’ and a ‘lack of time’, which were given by 74% and 55% of
individuals respectively. The same two reasons remained by far the most
frequently given at the follow-up stage, although the proportions of respondents
citing each decreased to 65% for work and 46% for lack of time. In addition, there
was a notable decline in the proportion of individuals who lacked interest in
exercising from 19% at baseline to just 3% at the follow up point. Three per cent
of respondents lacked facilities at the follow-up stage compared to 11% at
baseline.
Table 1: Reasons for not taking physical activity
Baseline Follow-up stage
Work 74% (n=48) 65% (n=43)
Lack of time 55% (n=36) 46% (n=30)
Lack of interest 19% (n=12) 3% (n=2)
Lack of money 15% (n=10) 9% (n=6)
Health issues 12% (n=8) 14% (n=9)
Household duties 11% (n=7) 12% (n=8)
Childcare 11% (n=7) 9% (n=6)
Lack of facilities 11% (n=7) 3% (n=2)
Weather 11% (n=7) 8% (n=5)
Other 8% (n=5) 0% (n=0)
Stress 5% (n=3) 8% (n=5)
Partner 2% (n=1) 2% (n=1)
Lack of partner 0% (n=0) 2% (n=1)
Lack of transport 0% (n=0) 0% (n=0)
Social activities 0% (n=0) 0% (n=0)
4 Respondents could tick more than one answer
17
Daily Sitting Time
Respondents were asked to estimate the amount of time they spent sitting,
including the time they spent sitting driving their taxi, each day.
The mean sitting time of respondents at baseline was 526.3 minutes (8hrs 48
mins) (SD=115.2 mins). The longest sitting time was 12hrs 30 mins and the
shortest was 5 hrs.
The mean sitting time of respondents at the follow-up stage was 518.1 minutes
(8hrs 36mins) (SD=113.2 mins). The longest sitting time was 12 hrs and the
shortest was 3 hrs.
The mean change in sitting time was -8.1 mins (SD=64mins). The 95%
confidence interval was 8.5 minutes to -24.8 minutes which is indicative of no
statistically significant change. This was supported by additional analysis that
revealed the sitting time of participants at the end of the intervention was not
significantly longer or shorter than at the start (t=-.977, df=58, p=0.33).
Change in sitting time ranged from -5 hrs to +2 hrs.
Diet
Consumption of Fruit & Vegetables
Respondents were asked how many times each day they ate fruit and vegetables.
Sixty-five respondents provided data at both stages. As Figure 3 reveals at
baseline just under two thirds of respondents (62%, n=40) reported that they
either never ate fruit or vegetables (11%, n=7) or ate fruit and vegetables just
once a day (51%, n=33). At follow up, nobody stated `never’ and just 12% (n=8)
said once a day, which represents a combined decrease of 50%. The proportion of
respondents stating `three times’ increased 21% from 14% (n=9) at baseline to
35% (n=23) after the programme. Similarly, there was a notable increase in the
proportion of respondents who stated ‘4 times’ from 3% (n=2) to 20% (n=13). In
total, 26% (n=17) of respondents ate fruit & vegetables either 4 or 5 times per day
at follow up compared with just 6% (n=4) at baseline.
Overall, the frequency of fruit & vegetable consumption per day was significantly
higher at follow up (median= 1) than at baseline (median=3), (T=3, p <0.001).

18
Figure 3: Frequency of fruit & vegetable consumption per day
Intention to Increase Consumption of Fruit & Vegetables
At baseline 92% of the 66 respondents intended to increase the amount of fruit &
vegetables consumed in the next 6 months, compared to 53% at the follow-up
stage.
Lifestyle
Working Hours
Respondents were asked to state how many hours per week they worked and 63
respondents provided responses at both stages.
The mean number of hours per week respondents worked on average at
baseline was 40.4 hours (SD= 10.7). The highest number of hours was 70 and
the lowest 16.
The mean number of hours per week respondents worked on average at the
follow-up stage was 41.8 hours (SD= 11.5). The highest number of hours was
70 and the lowest 7.
The mean change in number of hours worked was +1.3 hours (SD=6.4). The
95% confidence interval was – 0.3 hours to +2.9 hours which is indicative of no
statistically significant change. This was supported by additional analysis that
revealed the amount of hours worked by participants at the end of the
intervention was not significantly longer or shorter than at the start (t=1.64,
df=62, p=0.106).
Change in number of hours worked ranged from -33 hours to +15hrs.
10.8
50.8
18.5
13.8
3.1 3.1 0
12.3
26.2
35.4
20
6.2
0
10
20
30
40
50
60
Never Once Twice Threetimes
Four times Fivetimes+
Pe
rce
nta
ge
Frequency per day
Baseline
Post

19
Feeling Under Strain
Respondents were asked how often in the last month had they felt under so much
strain that their health was likely to suffer. Sixty-four respondents provided data
at the first stage of data collection and 63 at the second stage. The responses at
both stages were similar. In total, 72% (n=46) at baseline and 73% (n=46) at the
follow-up stage stated `never’. Approximately 22% (n=14) at both stages said
`sometimes’ and 6% (n=4) at baseline and 5% (n=3) at the follow-up point stated
`often’.
Smoking
Respondents were asked whether they were a current smoker, and whether they
intended to reduce or stop smoking. All 66 respondents provided data at both
stages.
At baseline, 9% (n=6) of respondents currently smoked compared to 8% (n=5) at
follow up. Out of the 6 smokers at baseline, 4 said they intended to reduce or stop
smoking in the next 6 months. Similarly, 3 out of the 5 respondents who were still
smoking at the end of the programme said they intended to reduce or stop
smoking in the next 6 months.
Consumption of alcohol
Respondents were asked how much alcohol they consumed each week. All 66
respondents provided data at both stages.
Just 1 respondent reported that they drank any alcohol at baseline which was 1
pint of lager/beer and 1 shot of spirits per week on average. At follow up none of
the respondents indicated they drank alcohol.
Support
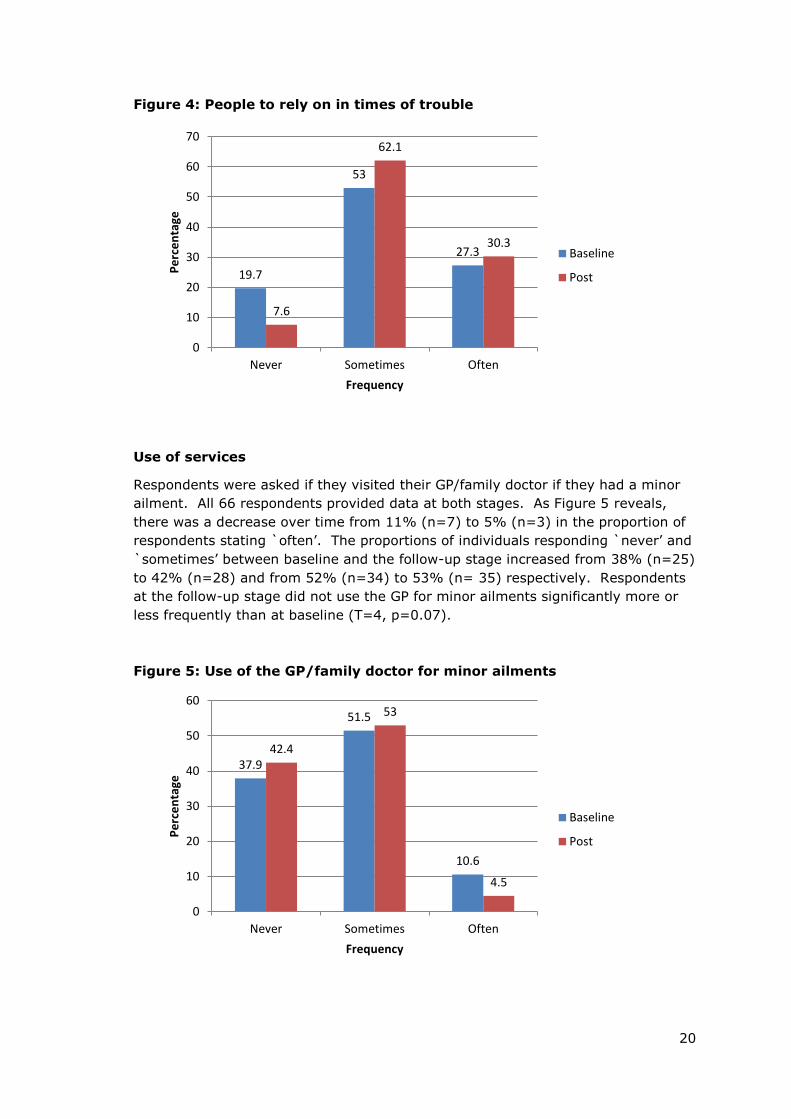
People to Rely on in Times of Trouble
Respondents were asked whether they had people to rely on in times of trouble.
All 66 respondents provided data at both stages. As shown in Figure 4 the most
frequent response at both stages was ‘sometimes’ followed by ‘often’. The
proportion of individuals stating `sometimes’ increased from 53% (n=35) at
baseline to 62% (n=41) at the follow-up stage. Similarly, there was also a small
increase from 27% (n=18) to 30% (n=20) in the proportion of respondents stating
`often’ between the 2 stages. In contrast, the proportion of individuals who never
had anyone to rely on decreased over time from 20% (n=13) at baseline to 8%
(n=5) at follow-up. Additional tests found that respondents relied on other people
significantly more frequently at the follow-up stage than at baseline (T =3,
P=0.012).
20
37.9
51.5
10.6
42.4
53
4.5
0
10
20
30
40
50
60
Never Sometimes Often
Pe
rce
nta
ge
Frequency
Baseline
Post
Figure 4: People to rely on in times of trouble
Use of services
Respondents were asked if they visited their GP/family doctor if they had a minor
ailment. All 66 respondents provided data at both stages. As Figure 5 reveals,
there was a decrease over time from 11% (n=7) to 5% (n=3) in the proportion of
respondents stating `often’. The proportions of individuals responding `never’ and
`sometimes’ between baseline and the follow-up stage increased from 38% (n=25)
to 42% (n=28) and from 52% (n=34) to 53% (n= 35) respectively. Respondents
at the follow-up stage did not use the GP for minor ailments significantly more or
less frequently than at baseline (T=4, p=0.07).
Figure 5: Use of the GP/family doctor for minor ailments
19.7
53
27.3
7.6
62.1
30.3
0
10
20
30
40
50
60
70
Never Sometimes Often
Pe
rce
nta
ge
Frequency
Baseline
Post

21
Use of Health Advice & Information Services
Respondents were asked if they made use of health advice and information
services such as NHS direct. All 66 respondents provided data at both stages. As
shown in Figure 6, at baseline 58% (n=38) stated they `never’ used health advice
& information services such as NHS Direct. However, at the follow-up stage the
proportion of individuals giving this answer had decreased to just under a third
(32%, n=21). Conversely, those respondents who answered `sometimes’
increased from 39% (n=26) at baseline to 64% (n=42) at follow-up. Overall,
respondents made use of health advice and information services significantly more
frequently at the follow-up stage than at baseline (T=4, p=0.001).
Figure 6: Use of health advice & information services
Involvement in Any Other Community Health Projects
Respondents were asked if they were involved in other community health projects
at both stages of data collection. Of the 66 respondents providing data at baseline
0 were involved in other community health projects. Three (5%) of the 63
respondents at follow-up had been at the follow-up stage, but no further details
were given.
Project Reach
Sharing of Information from the Project
At follow-up respondents were asked if they had shared information they had
received in the project with anyone else. Fifty-eight respondents provided data for
this question. In total, 31% (n=18) of respondents had shared information they
learnt through the project with someone else. The 18 individuals who answered
positively then indicated with whom they had shared information, and the results
are presented in Table 3.
57.6
39.4
3
31.8
63.6
4.5
0
10
20
30
40
50
60
70
Never Sometimes Often
Pe
rce
nta
ge
Frequency
Baseline
Post

22
Table 3: Individuals with whom respondents had shared learning from the
programme5
Reflections on the project
What Benefits Participants Hoped to Gain From the Project
Respondents were asked at baseline what they hoped to gain from attending the
project, fifty-five provided responses. The responses were grouped into 2 main
categories. The largest number of individuals (n=35) hoped to improve fitness,
and/or become healthier. A similar proportion (n=30) mentioned hoping to lose
weight. Several respondents (n=4) mentioned improvements to specific
conditions: managing diabetes, lowering blood pressure and reducing back pain.
Five individuals saw participation as a way to get back into exercise or training and
1 other saw it as a way to try out the gym. In addition, 4 participants hoped to
gain health advice/information. Other responses included eat healthy, increased
confidence, alertness, and weight gain.
Gains from Attending the Project
At follow up participants were asked what they actually gained if anything from
attending the project, sixty-four respondents provided data. Twenty four
individuals indicated they felt better/ more healthy, or had more energy or
improved health. Slightly less (n=21) said that attendance had improved their
knowledge or awareness of health or specific elements of positive health such as
healthy eating/diet, blood pressure or exercise. Nine indicated they now exercised
more regularly, and 9 also said they now ate healthier or ate more fruit and
vegetables. Eleven individuals specifically mentioned losing weight and 7 said their
blood pressure had decreased. Other benefits included increased confidence,
muscle tone, feeling stronger, desired weight gain, learning how to use the gym
and improved sleep.
5 Respondents could tick more than one answer
Frequency
Friend 12
Wife/partner 9
Other family member 4
Colleague 4
Other 0
23
Improvements to the Project
At follow up respondents were asked to give suggestions about how the
programme could be improved. Thirty-nine respondents provided data for this
question. Eighteen participants thought the programme should be longer, typical
comments included “do project for longer” “longer duration”, “run longer” and
another said “It would have been nice to have the project for a duration of 6
months to see more improvement”. Fourteen participants made general positive
comments such as “brilliant”, “great scheme” “it was very good”. Comments about
the gyms were given by four participants, with two suggesting longer gym opening
hours, and two others a greater number of participating gyms. Three participants
made comments related to the content of the project. One would like to see more
group classes, but conversely another suggested one to one training. ‘A greater
number of sessions’ was suggested by one respondent. Others suggestions made
included: “free gifts” and “get more drivers involved”.

24
Discussion
Demographic information on those who participated in the Leeds Cab Drivers
project indicated a good adherence with the target group. Baseline measures of
health and lifestyle showed that participants presented with sedentary lifestyles
and limited consumption of fruit and vegetables. For example, just 12% of
participants engaged in the recommended 150+ minutes of moderate intensity
physical activity per week and just 3% reported consuming the recommended
amount of fruit and vegetables of at least five portions of fruit and vegetables per
week. Thirty-seven per cent (n=23) of participants submitted systolic blood
pressure readings of 140 or over, and 31% (n=19) submitted a diastolic blood
pressure of 90 or above thus presenting with high blood pressure.
With the exception of systolic blood pressure, all measures of participants’ health
showed statistically significant improvements over the course of the intervention.
Improvements were particularly pronounced in participants’ self-reported ratings of
health, waist circumference and diastolic blood pressure. Potentially contributing
to these improvements in health, participants reported significant increases in
physical activity and in the frequency of daily fruit and vegetable consumption.
In common with previous work, evaluation data indicated that there are a number
of barriers to changing the behaviours of taxi drivers. Data showed less profound
change in participants’ lifestyle measures including, no significant change in
participants sitting time, hours worked and limited change in ‘reasons for not
taking physical activity’, unsurprising given the professional demands of being a
taxi driver. However, there was some indication that the intervention may have
affected participants’ use of health advice and information services, as well as their
perceptions of support available to them in times of trouble. Further research
would be required to determine the nature of this relationship and whether the
intervention offers an appropriate and sustainable means of improving the health
of the target population. Specifically, further investigation is needed into how taxi
drivers and taxi firms can improve diet and levels of exercise within the constraints
which the profession presents. Suggestions for improvement provided by
participants such as more flexible hours for accessing services and a greater range
of activities to meet the preferences of individuals could be examined to determine
feasibility.
Data did indicate that several participants shared information which they had
received through the intervention to others, mainly friends and their wife/partner,
thus suggesting that the intervention may provide an effective means of
disseminating health information to the South Asian community. Future work
should aim to determine the most effective and culturally appropriate ways of
engaging the wider South Asian community in health promotion activities, including
‘hard to reach’ groups who do not engage in mainstream health care provision.
Results must however be viewed with caution. Budgetary constraints meant that
the evaluation team were unable to examine the processes involved in delivering
the project as was initially planned. As a result, the evaluation was unable to
examine perceived barriers and facilitators to implementation, delivery and

25
sustainability of the project and the health champion model. The evaluation
questionnaire only provided information on those who fully engaged in the
intervention, and therefore did not provide information on taxi-drivers who did not
complete the intervention. Whilst those completing the intervention provided much
positive feedback about the project, those referred to the project but did not attend
were not followed up therefore the evaluation was not able to provide information
on the barriers to engaging the target group. Furthermore the questionnaire was
administered by a member of Hamara staff, therefore threatening the validity of
the data.
Whilst acknowledging the aforementioned methodological limitations of the study,
data does suggest that intervention activities may contribute to positive change in
taxi driver’s health status.
Next Steps
Further research is needed to examine the potential of the intervention for
engaging other groups presenting sedentary lifestyles and the longer term effect
of participation in the project.
Further research is needed, looking at the broader impact of the intervention,
beyond bio-medical measures of health, on the lives of targeted groups, their
families and the wider community.
Further research is needed around the processes involved in implementing and
delivering the LCD project and the health barriers and facilitators to engaging
with the target group and examining the role of diversity within the target group
in influencing engagement. Routine follow-up of all referrals is required to
determine the specific barriers to engaging hard to reach members of the target
group.
Further investigation should be conducted around the potential for collaboration
with local NHS services.
26
References
BRITISH HEART FOUNDATION 2009. Diabetes and How it Afftects Your Heart. London: British
Heart Foundation.
BRITISH HEART FOUNDATION. 2011. South Asians and Heart Disease [Online]. Available:
https://www.bhf.org.uk/publications/south-asian-publications.aspx [Accessed October, 2013].
DEPARTMENT FOR TRANSPORT. 2013. Taxi and private hire vehicle statistics: England and Wales
2013 [Online]. Available: https://www.gov.uk/government/publications/taxi-and-private-hire-
vehicle-statistics-england-and-wales-2013 [Accessed October, 2013].
DRYDEN, R., HUME, A., PRINGLE, S., BYRES, P., BELCHER, M., DODDY, J., MARTIN, C. &
WILLIAMS, B. 2008. Addressing the cardiology unmet needs of taxi drivers in Dundee - A
'Community Heart' Project. Dundee: University of Dundee.
EQUALITY AND HUMAN RIGHTS COMMISSION. 2013. Employment [Online]. Available:
http://www.equalityhumanrights.com/key-projects/how-fair-is-britain/online-
summary/employment/ [Accessed October, 2013].
EU-OSHA. 2010. Taxi Drivers' Safety and Health: A European Review of Good Practice Guidelines.
Luxembourg.
FACEY, M. 2010. 'Maintaining Talk' among taxi drivers: accomplishing health-protective behaviour in
precarious workplaces. Health Place, 16, 1259-67.
LEEDS CITY COUNCIL 2012. State of the city: Our vision to be the best city in the UK. Leeds: Leeds
City Council.
LEEDS OBSERVATORY. 2012. Area Profile: Inner South Leeds [Online]. Available:
http://westyorkshireobservatory.org/resource/view?resourceId=1465. [Accessed October,
2013].
MCCULLAGH, J. 2008. Men's Health: Driving home a healthy message [Online]. Available:
http://www.personneltoday.com/articles/08/09/2008/46047/mens-health-driving-home-a-
healthy-message.htm [Accessed October, 2013].
MCEVOY, D. & HAFEEZ, K. 2009. Ethnic minority entrepreneurship in Britain. Management &
Marketing, 4, 10.
NHS CHOICES. 2012. South Asian Health Issues [Online]. Available:
http://www.nhs.uk/Livewell/SouthAsianhealth/Pages/Overview.aspx [Accessed October,
2013].
NHS LEEDS & LEEDS CITY COUNCIL 2012. Leeds Joint Strategic Needs Assessment 2012. Leeds.
NSMC. 2009. Taxi! Full case study [Online]. Available:
http://www.thensmc.com/sites/default/files/Taxi!%20FULL%20case%20study.pdf [Accessed
October, 2013].
PUBLIC HEALTH ENGLAND 2013. Leeds Health Profile 2013. Public Health England.
SOUTH, J. 2008. Hamara Health Living Centre: 'Bringing Communities Together'. . Leeds: Leeds
Metropolitan University.
WILLIS, L. & DHOOT, P. 2012. Case study of the CABS project: Champions for Achieving Better
Health in Sheffield [Online]. Available: http://clahrc-sy.nihr.ac.uk/resources-project-
reports.html [Accessed October, 2013].

27

28