The LCA: Implementing a Quality Assurance and Informatics Strategy to Enhance Cancer Care Dr Shelley...
12
The LCA: Implementing a Quality Assurance and Informatics Strategy to Enhance Cancer Care Dr Shelley Dolan LCA Clinical Director
-
Upload
michael-kelley -
Category
Documents
-
view
213 -
download
0
Transcript of The LCA: Implementing a Quality Assurance and Informatics Strategy to Enhance Cancer Care Dr Shelley...
The LCA: Implementing a Quality Assurance and Informatics Strategy to Enhance Cancer Care
Dr Shelley DolanLCA Clinical Director
The London Cancer Alliance West and South
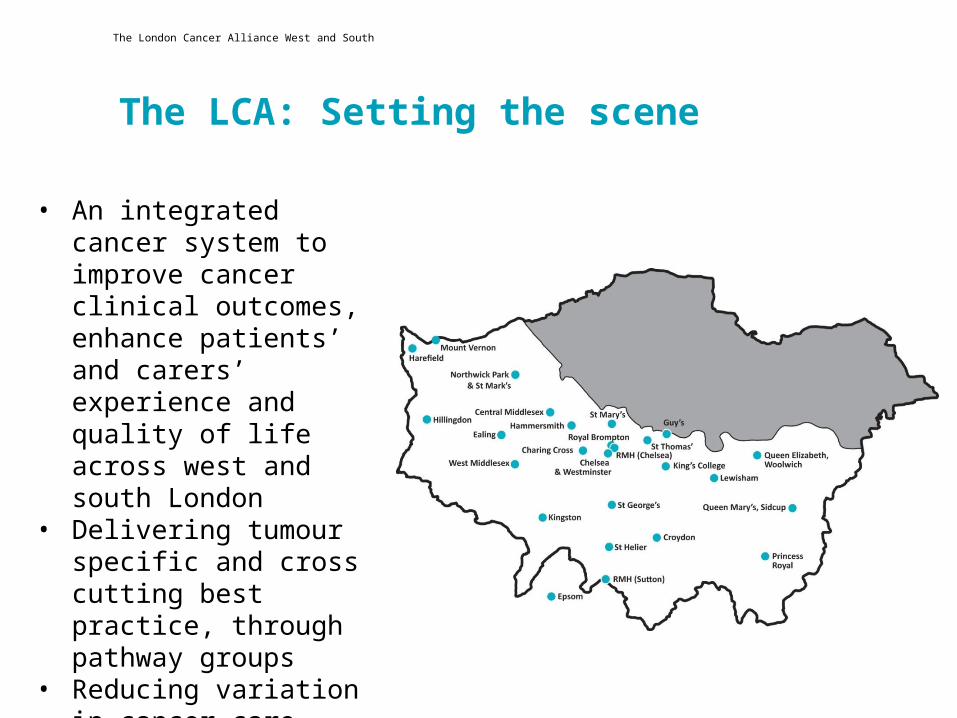
The LCA: Setting the scene
• An integrated cancer system to improve cancer clinical outcomes, enhance patients’ and carers’ experience and quality of life across west and south London
• Delivering tumour specific and cross cutting best practice, through pathway groups
• Reducing variation in cancer care provision
2

The London Cancer Alliance West and South
•
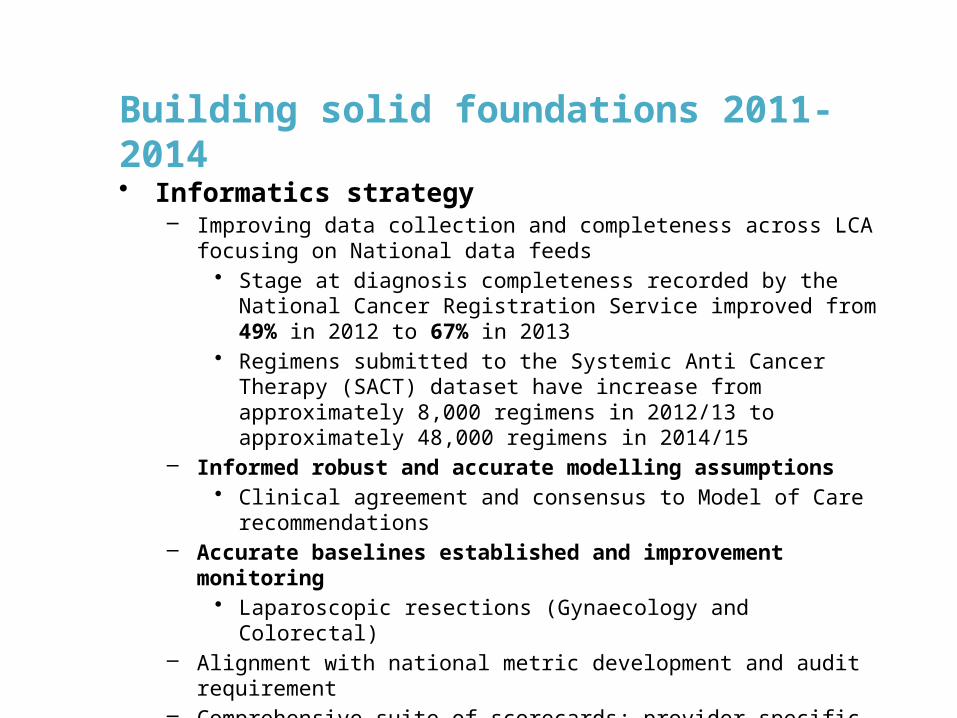
Building solid foundations 2011-2014• Informatics strategy
– Improving data collection and completeness across LCA focusing on National data feeds
• Stage at diagnosis completeness recorded by the National Cancer Registration Service improved from 49% in 2012 to 67% in 2013
• Regimens submitted to the Systemic Anti Cancer Therapy (SACT) dataset have increase from approximately 8,000 regimens in 2012/13 to approximately 48,000 regimens in 2014/15
– Informed robust and accurate modelling assumptions• Clinical agreement and consensus to Model of Care
recommendations – Accurate baselines established and improvement monitoring
• Laparoscopic resections (Gynaecology and Colorectal) – Alignment with national metric development and audit requirement – Comprehensive suite of scorecards; provider specific, tumour specific– Provider, regional and national benchmarking
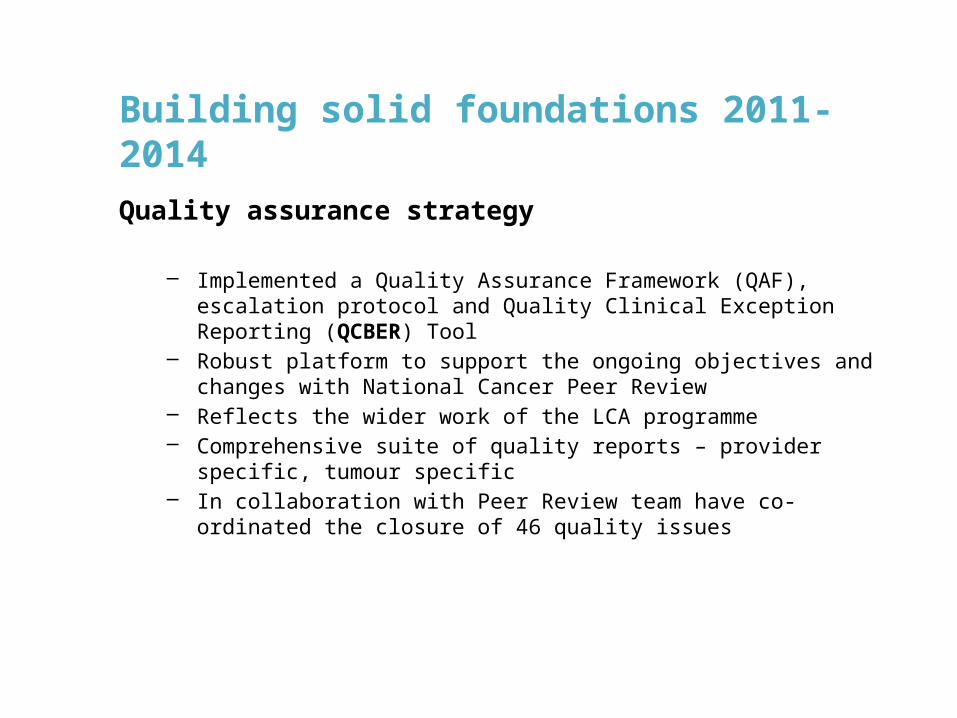
Building solid foundations 2011-2014
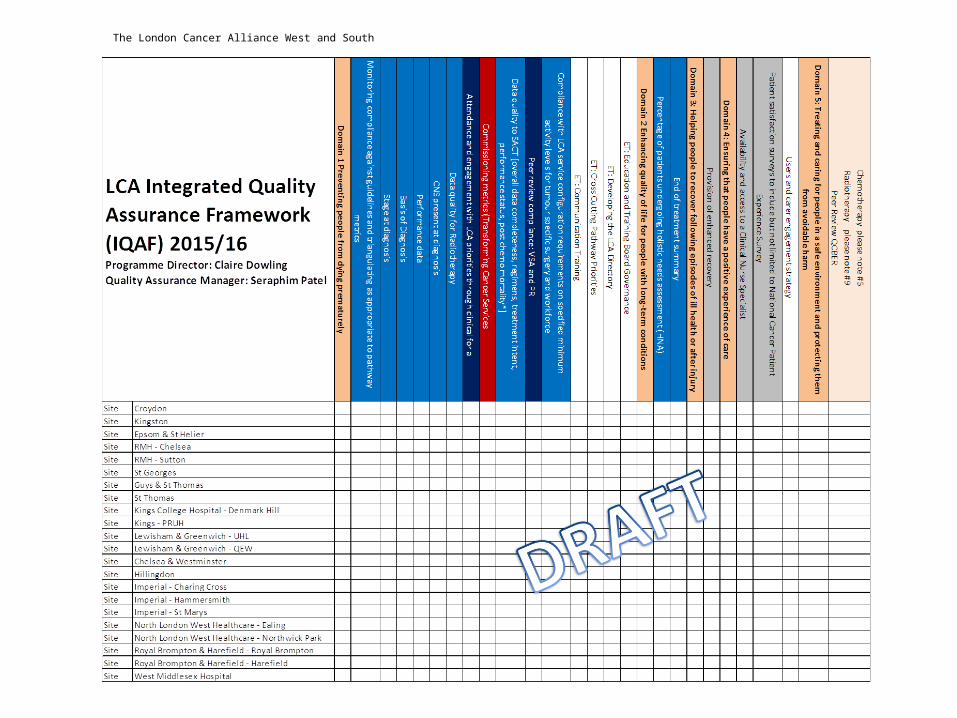
Quality assurance strategy
– Implemented a Quality Assurance Framework (QAF), escalation protocol and Quality Clinical Exception Reporting (QCBER) Tool
– Robust platform to support the ongoing objectives and changes with National Cancer Peer Review
– Reflects the wider work of the LCA programme– Comprehensive suite of quality reports – provider specific, tumour
specific– In collaboration with Peer Review team have co-ordinated the closure of
46 quality issues
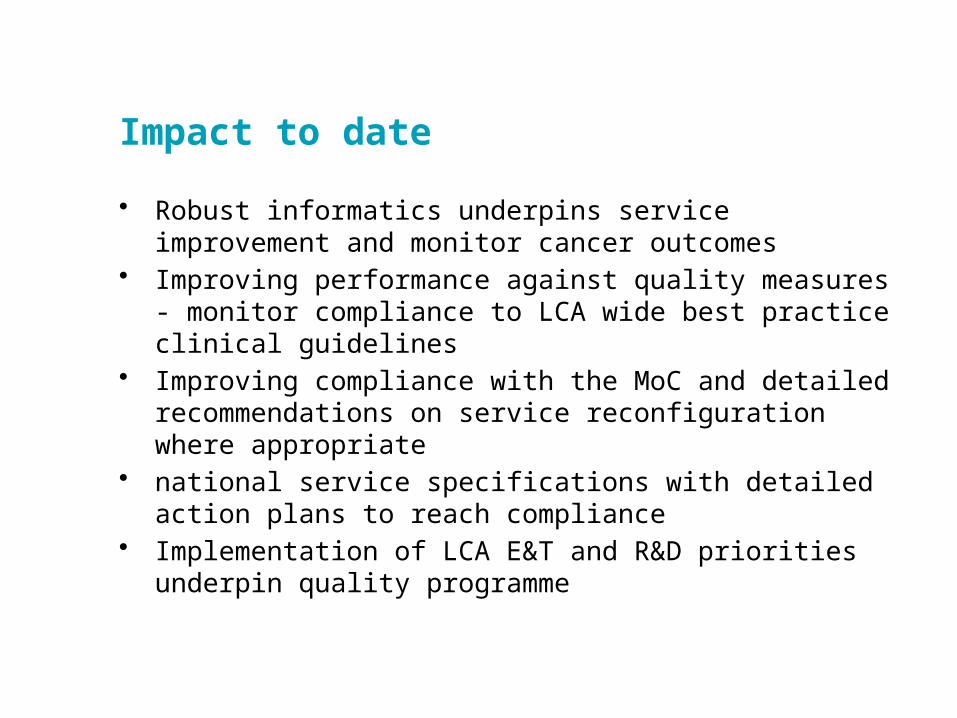
Impact to date
• Robust informatics underpins service improvement and monitor cancer outcomes
• Improving performance against quality measures - monitor compliance to LCA wide best practice clinical guidelines
• Improving compliance with the MoC and detailed recommendations on service reconfiguration where appropriate
• national service specifications with detailed action plans to reach compliance
• Implementation of LCA E&T and R&D priorities underpin quality programme
The London Cancer Alliance West and South
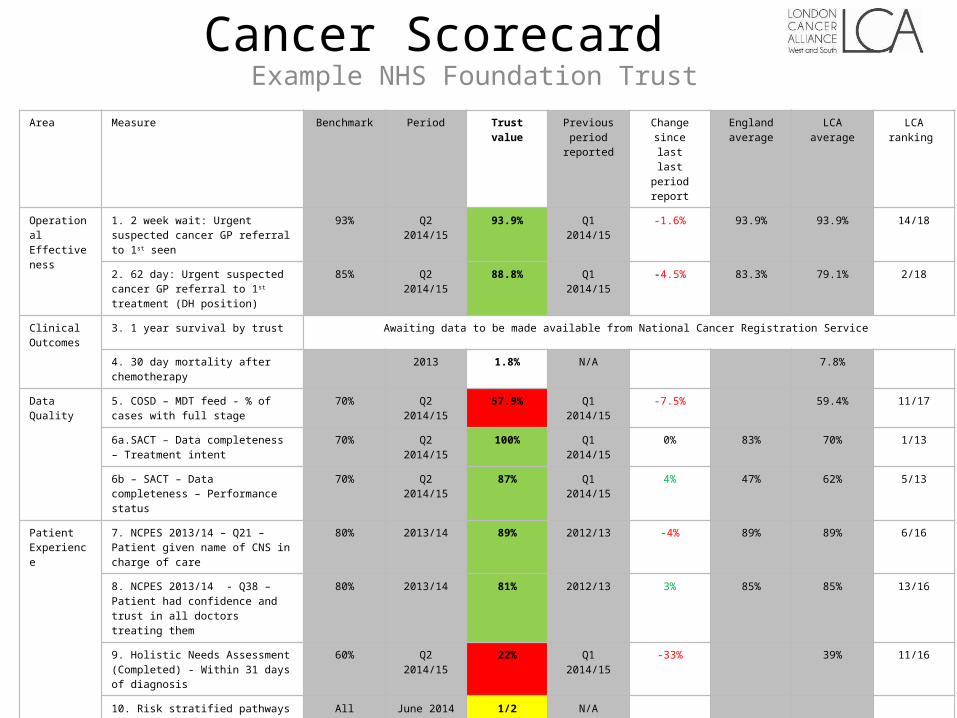
Cancer ScorecardExample NHS Foundation Trust
Area Measure Benchmark Period Trust value Previous period
reported
Change since last
last period report
England average
LCA average LCA ranking
Operational Effectiveness
1. 2 week wait: Urgent suspected cancer GP referral to 1st seen
93% Q2 2014/15 93.9% Q1 2014/15 -1.6% 93.9% 93.9% 14/18
2. 62 day: Urgent suspected cancer GP referral to 1st treatment (DH position)
85% Q2 2014/15 88.8% Q1 2014/15 -4.5% 83.3% 79.1% 2/18
Clinical Outcomes
3. 1 year survival by trust Awaiting data to be made available from National Cancer Registration Service
4. 30 day mortality after chemotherapy 2013 1.8% N/A 7.8%
Data Quality 5. COSD – MDT feed - % of cases with full stage
70% Q2 2014/15 57.9% Q1 2014/15 -7.5% 59.4% 11/17
6a.SACT – Data completeness – Treatment intent
70% Q2 2014/15 100% Q1 2014/15 0% 83% 70% 1/13
6b – SACT – Data completeness – Performance status
70% Q2 2014/15 87% Q1 2014/15 4% 47% 62% 5/13
Patient Experience
7. NCPES 2013/14 – Q21 – Patient given name of CNS in charge of care
80% 2013/14 89% 2012/13 -4% 89% 89% 6/16
8. NCPES 2013/14 - Q38 – Patient had confidence and trust in all doctors treating them
80% 2013/14 81% 2012/13 3% 85% 85% 13/16
9. Holistic Needs Assessment (Completed) - Within 31 days of diagnosis
60% Q2 2014/15 22% Q1 2014/15 -33% 39% 11/16
10. Risk stratified pathways implemented –Breast/Colorectal/Prostate (number of services implemented)
All June 2014 1/2 N/A
Research 11. NCPES 2013/14 – Q30 – Taking part in cancer research discussed with patients
30% 2013/14 27% 2012/13 -6% 31% 41% 11/16
Workforce 12. COSD – MDT feed – % of cases seeing a CNS
70% Q2 2014/15 22.5% Q1 2014/15 -12% 28.1% 9/17
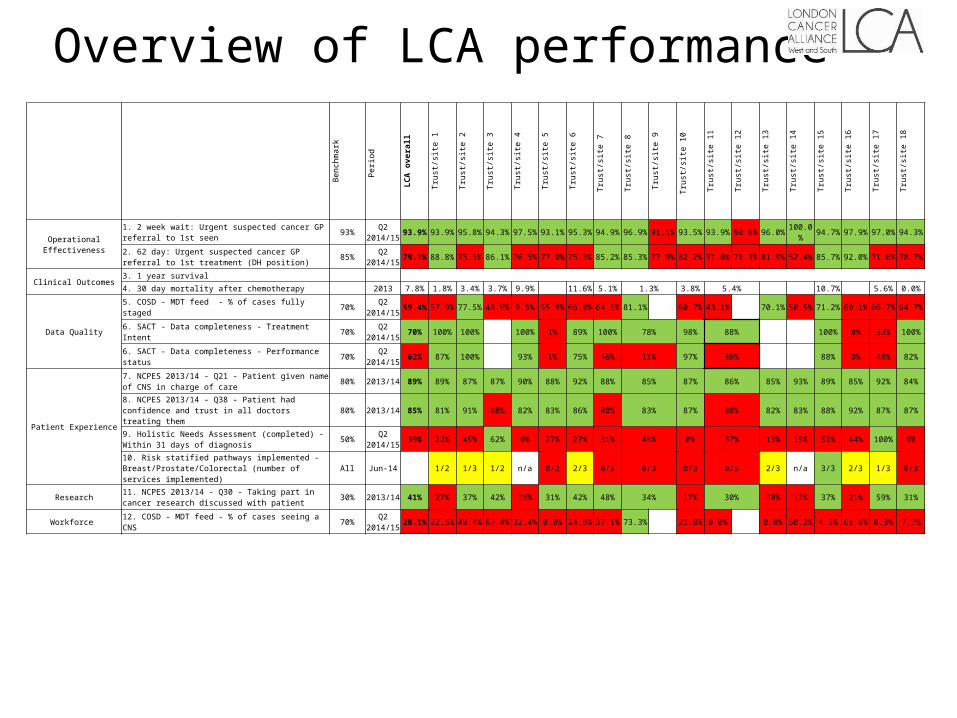
Overview of LCA performance
Benchmark Period LCA
overall
Trust/site 1
Trust/site 2
Trust/site 3
Trust/site 4
Trust/site 5
Trust/site 6
Trust/site 7
Trust/site 8
Trust/site 9
Trust/site 10
Trust/site 11
Trust/site 12
Trust/site 13
Trust/site 14
Trust/site 15
Trust/site 16
Trust/site 17
Trust/site 18
Operational Effectiveness
1. 2 week wait: Urgent suspected cancer GP referral to 1st seen 93% Q2 2014/15 93.9% 93.9% 95.8% 94.3% 97.5% 93.1% 95.3% 94.9% 96.9% 91.1% 93.5% 93.9% 80.8% 96.0% 100.0% 94.7% 97.9% 97.0% 94.3%
2. 62 day: Urgent suspected cancer GP referral to 1st treatment (DH position) 85% Q2
2014/15 79.1% 88.8% 75.5% 86.1% 76.5% 77.0% 75.3% 85.2% 85.3% 77.9% 82.2% 71.0% 71.3% 81.9% 52.4% 85.7% 92.0% 71.6% 78.7%
Clinical Outcomes3. 1 year survival
4. 30 day mortality after chemotherapy 2013 7.8% 1.8% 3.4% 3.7% 9.9% 11.6% 5.1% 1.3% 3.8% 5.4% 10.7% 5.6% 0.0%
Data Quality
5. COSD - MDT feed - % of cases fully staged 70% Q2 2014/15 59.4% 57.9% 77.5% 48.9% 9.5% 55.8% 66.0% 64.5% 81.1% 60.7% 43.1% 70.1% 50.5% 71.2% 60.1% 66.7% 64.7%
6. SACT - Data completeness - Treatment Intent 70% Q2 2014/15 70% 100% 100% 100% 1% 89% 100% 78% 98% 88% 100% 0% 33% 100%
6. SACT - Data completeness - Performance status 70% Q2 2014/15 62% 87% 100% 93% 1% 75% 46% 11% 97% 36% 88% 0% 48% 82%
Patient Experience
7. NCPES 2013/14 - Q21 - Patient given name of CNS in charge of care 80% 2013/14 89% 89% 87% 87% 90% 88% 92% 88% 85% 87% 86% 85% 93% 89% 85% 92% 84%
8. NCPES 2013/14 - Q38 - Patient had confidence and trust in all doctors treating them 80% 2013/14 85% 81% 91% 68% 82% 83% 86% 80% 83% 87% 80% 82% 83% 88% 92% 87% 87%
9. Holistic Needs Assessment (completed) - Within 31 days of diagnosis 50% Q2
2014/15 39% 22% 45% 62% 0% 27% 27% 31% 46% 0% 37% 13% 15% 51% 44% 100% 0%
10. Risk statified pathways implemented - Breast/Prostate/Colorectal (number of services implemented) All Jun-14 1/2 1/3 1/2 n/a 0/2 2/3 0/3 0/3 0/3 0/3 2/3 n/a 3/3 2/3 1/3 0/3
Research 11. NCPES 2013/14 - Q30 - Taking part in cancer research discussed with patient 30% 2013/14 41% 27% 37% 42% 26% 31% 42% 48% 34% 17% 30% 30% 13% 37% 21% 59% 31%
Workforce 12. COSD - MDT feed - % of cases seeing a CNS 70% Q2 2014/15 28.1% 22.5% 48.4% 67.4% 32.4% 0.0% 24.8% 37.1% 73.3% 21.8% 0.0% 0.0% 60.2% 4.3% 61.8% 0.3% 7.7%
Impact: Examples
1. Access to laparoscopic gynae-cancer surgery – MoC compliance – 1 major provider non compliant raised through Clinical Board to Members Board – result: additional operating time found + employment of additional Surgeon and compliance achieved. 2. Mental health and Psychological wellbeing: Dr. Andrew Hodgkiss and Dr. Amanda Ramirez responded to MoC with a hub and spoke model for expert services for people with cancer across the LCA. Initially focused in SW London SGH model just agreed with support from Macmillan.3. Best practice guidelines – compliance framework.

Looking forward
• Tumour specific national clinical headlines indicators are currently being developed, LCA informatics metrics will closely align.
• The national audits will increasingly use COSD as their data source and the key audit metrics are likely to be included in these national indicators.
• The clinical headline indicators are likely to be used to inform the peer review process i.e. who is doing “better” than others which will in turn inform the CQC

Conclusion: LCA integration of quality and informatics in 2015
• High quality timely cancer data is critical to improving cancer services and outcomes
• LCA has integrated quality and informatics reporting to underpin the transformation programme
• LCA has a well developed governance structure that includes clinical leads and the CEOs of all organisations
• LCA has patients and carers on each of its pathway groups and on its Clinical Board
• LCA has well developed clinical engagement with over 3,000 cancer clinicians regularly contributing to pathway groups and clinical fora
• The integrated cancer system model is the ideal vehicle for wide spread clinical and managerial engagement at pathway, provider and regional level