MATILDA: Multi-AnnoTator multi-language Interactive Light ...

The Language of Light


Cont
ents
Contents
What is light and what can be measured
Radiometry & basic concepts (Radiant Flux, Radiant Intensity, Irradiance, Radiance)
Spectroradiometry and Photometry concepts (Lu-minous Flux, Luminous Intensity, Illuminance, Lumi-nance)
Photopic and Scotopic vision and the S/P ratio
Colorimetry and Colour PerceptionMixing ColoursTristimulus Colorimetry
Colour Space CIE1931 Chromacity ChartCIE 1976 UCS Chromacity ChartHelmholtz Coordinates
Colour temperatureCCT Colour and Spectral Distribution
Colour Rendering PropertiesAddressing the weakness of CRI
Instruments, Applications and TermsLuminance MeterIlluminance MeterPWM Controlled LightingANSI Luminous FluxLuminous IntensityThree Filter ColorimeterSpectroradiometer
Summary & Conclusion
4
5
6&7
8&9
101011
12121213
141415
1619
202122232425252528
29
1

The Language of Light
2

The Language of LightThe following resource has been developed
to provide readers with an overview into the
measurement of light, some of the terminology
used and the types of instrumentation that is
available to produce accurate and repeatable
measurements of light sources, fixtures
or environments. The resource cannot be
considered in any way exhaustive however if
you have a question which is not answered by
the following resource please contact your local
Konica Minolta office where our experienced
product specialists will be happy to help.
Intro
duct
ion
3

What is Light?
WHAT CAN BE MEASURED?
The total light energy emitted from a source or falling on a surface can be measured. This total energy can cover a portion of the visible spectrum including ultraviolet and infrared energy. Energy at an individual wavelength or over a range of wavelengths can be measured.
Another area of interest is colour. Colour is a property of light and can be measured and quantified.
The science of light measurement is known as photometry and is a subset of the broader field of radiometry - the measurement of radiation outside the visible spectrum.
WHAT IS LIGHT?Light is necessary for vision, the world around us is only visible when light reflected or emitted by objects us reaches our eye and triggers the sensation of sight.
Light is a form of energy and is part of a broader range of the electromagnetic spectrum. Electrical, radio waves and microwaves to gamma rays form this electromagnetic spectrum. The visible light spectrum is a relatively small portion of this spectrum, between 380 nm and 760 nm. In general, light is often defined as including the infrared and ultraviolet regions too.
There are many applications for measuring and understanding the characteristics of light. Konica Minolta with decades of experience in the technology of light produce a range of market leading instruments to satisfy the many approaches and units used in the industry.
The measurement of light can be a challenge especially in deciding what to measure and how to measure.
Fig.1 Electromagnetic spectrum including visible light
4

Radi
omet
ry
RADIOMETRY
Radiometry is the science of the measurement of electromagnetic (EM) radiation. The broader spectrum covered by the science of radiometry is based on physical constants.
The properties of concern to us here are radiated power and its spatial and angular distributions. The four basic concepts are:
• Radiant Flux• Radiant Intensity• Radiance• Irradiance
RADIANT FLUX
This is the total radiant power emitted from a source or received by a surface. It can also be defined as the rate of flow of radiant energy through a certain area or out of a certain solid angle. The SI unit of radiant flux is the Watt.
RADIANT INTENSITY
It is defined as the directed angular density of radiation from a source.
Radiant FluxTotal Power (watts)
Plane normal to rays
Radiant IntensityPower/Solid Angle
Plane normal to rays
The radiant intensity in a given direction is the sum of the power contained in all the rays (cones) emitted in that direction by the entire source (i.e., power per solid angle).
The SI unit for radiant intensity is Watt/Steradian (Watt/sr). IRRADIANCE
This is a measure of radiant flux incident on an object’s surface (radiant flux per unit area).
The SI units for irradiance is Watt/square meter (Watt/m2)
RADIANCE
This is a measure of the total radiant intensity per unit projected area.
The SI units for radiance is Watt/square meter Steradian (Watt/m2 sr)
IrradiancePower/Unit Area
Plane normal to rays
RadiancePower/Solid Angle/Projected Area
Plane normal to raysPlane normal to rays
5

Spectroradiometry and Photom
etry
Fig. 2 Approximate relative sensitivity of the average
human eye to different wavelengths
Photometry became a modern science in 1942, when the Commission Internationale de l’Eclairage (CIE) met to define the response of the average human eye. CIE measured the light-adapted eyes of a sizeable sample group, and compiled the data into the CIE Standard Luminosity Function (widely known as photopic curve - chromatic perception at normal state, and scotopic curve - achromatic perception at low level of illuminance. – see Fig.2).
The photometric quantities are related to the corresponding radiometric quantities by the CIE Standard Luminosity Function. We can think of the luminosity function as the transfer function of a filter which approximates the behaviours of the average human eye (Fig. 2).
RadiometricQuantity CIE Standard Luminosity Function (Vλ)Filter Photometric Quantity Fig. 3 Relationship between radiometric units and
photometric units
SPECTRORADIOMETRY
Spectroradiometry is the measurement of light energy at individual wavelengths within the electromagnetic spectrum. It can be measured over the entire spectrum or within a specific band of wavelengths.
SPECTRAL RADIANCE
The radiance of a light source is a single value which is the sum of all energy measured over a spectrum. The individual energy values at a particular wavelength in nanometer (nm) can be determined by a spectral radiance measurement.
The SI units for spectral radiance is Watt/square meter Steradian nanometer (Watt/m2 sr nm).
SPECTRAL IRRADIANCE
This is a measure of radiant flux at particular wavelength incident on per unit area.
The SI units for spectral radiance is Watt/square meter nanometer (Watt/m2 nm).
PHOTOMETRY
Photometry involves measurement of the psychophysical attributes of electromagnetic energy that is visible to the human eye. The use of the term ‘luminous’, which refers to visible light, defines photometry in terms of human perception.
6

Phot
omet
ry
Photometry consists of four basic concepts:• luminous flux• luminous intensity • illuminance• luminance
LUMINOUS FLUX
A source of light radiates energy in the form of electromagnetic waves. We speak of light energy as ‘flux’ and luminous flux is a measure of the flow of light energy emitted by a source, or received by a surface. The quantity is derived from the radiant flux, W (in Watts), by evaluating the radiation in accordance with the relative luminous efficiency of the ‘standard eye’ (CIE Standard Luminosity Function, Vλ).
The unit is lumen (lm).lm = 683 x W (Watt) x Vλ
LUMINOUS INTENSITY
This expresses the power of a light source. It is defined as the quantity of luminous flux emitted in a given direction per solid angle (in steradian).
Plane normal to rays
Luminous FluxTotal Power (lumen)“Light Power”
Plane normal to rays
Luminous IntensityTotal Power/Solid Angle“Candle Power”
The unit is candela (cd).1 cd = 1 lumen per steradian. (For practical pur-poses, one candela power.)
ILLUMINANCE
This is a measure of the concentration of luminous flux falling upon a surface. It is expressed in lumens per unit area.
The unit is lux (lx).1 lx = 1 lumen per square meter (lm/m2)The original non-metric British unit is the foot-candle.1 foot-candle = 1 lumen per square foot (lm/ft2) LUMINANCE
Also known as photometric brightness, luminance is a measure of the flux emitted from, or reflected by, a relatively flat and uniform surface. Luminance may be thought of as luminous intensity per unit area.
The unit is candelas per square meter (cd/m2), or nit. The original non-metric British unit is the footlambert (fL)1 fL = (1/π) 1 candela/ft2
Plane normal to rays
IlluminanceTotal Power/Unit Area“Illumination”
LuminanceTotal Power/Solid Angle/Projected Area“Brightness”
Plane normal to raysPlane normal to rays
7

Photopic and Scotopic Vision
Within the human eye, the rods and cones do not work exclusive of one another, indeed, low luminance conditions somewhere between indoor lighting and the light of a full moon will have both rods and cones working together, this is termed mesopic vision occurring from luminances of approximately 0.03 to 3 cd/m2.
The human eye uses scotopic vision in the range below 0.03 cd/m2, and photopic vision in the range above 3.0 cd/m2.
Standards for Public lighting are based on how the human eye reacts in good light (photopic vision), when in fact outside in the evenings when we need streetlights, our eyes are actually using mesopic (low light) or scotopic (no light) vision, with a shift in the peak wavelength from 555nm to 507nm. This shift can actually mean that a large error is noticed between measured values and visual judgement, It is not unheard of for a modern LED light installation to fail inspection when in fact if measured against scotopic vision, would be providing a vastly improved quality of light.
Fig. 4 Photopic (Blue) and Scotopic (Red) luminous efficiency with a bar (yellow) illustrating the
Wavelengths at which LPS lamps peak.
Within the near future European Standards will be updated to reflect these requirements and as public installations of newer technologies become increasingly common so too will next generation lux meters (with an F1 Value better than 3%) provide accurate readings to make correct assessments of newer lighting technologies possible.
S/P RATIO
Until Luxmeters with a function to measure scotopic conditions are common place, lighting designers/ inspectors can use the S/P ratio. The manufacturer of the light source should provide the S/P ratio (calculated using a Spectroradiometer) which can then be simply multiplied by the measured photopic value to give a converted reading of the scotopic value.
0.6
0.8
1
Scotopic
Photopic
0
0.2
0.4
380 420 470 510 555 600 650 700 750
λ’m = 507nm
λm = 555nm
PHoToPIc And ScoToPIc VISIonThe human eye adapts to changing brightness and colour conditions, a luxmeter does not. Luxmeters measure light compared to the relative sensitivity of the human eye for daylight conditions (photopic vision) whereas often, particularly for public lighting such as road lighting the sensitivity of the human eye actually shifts toward the blue end of the spectrum as the rods become active (Scotopic vision). If you examine the Peak wavelengths in the diagram in the section on Photometry you will see that the peak wavelength at photopic vision is approximately only half as effective when scotopic vision is active.
8

Phot
opic
and
Sco
topi
c Vi
sion
Fig. 5 A residential street lit by LED street lighting
Fig. 6 A road lit by Low Pressure Sodium light
The preceding section has shown how the eye works in different situations and the important knowledge required to measure light correctly. The above photos serve to illustrate an example relating to measurement of light under photopic and scotopic luminous efficiency.
Fig. 6 is a road lit by Low Pressure Sodium lamp, you can see that the colour rendering is not very good, the entire picture looks monotone. If measuring this lighting using a traditional lux meter (that doesn’t consider the scotopic lu-minous efficiency) measurement results would show far higher light levels than correspond with
image by meltedplastic
visual perception. If you consider the photopic and scotopic luminous efficiency curves on page 8 you will see that the wavelengths at which LPS is active fall right at the edge of the scotopic curve. Not only is the relatively narrow bandwidth of the source bad for colour but it also provides reduced perceived brightness.
Whereas fig.5 is a residential street lit by LED streetlight, the range of colours in the picture is far greater, reflecting the broader spectral curve of the light source and higher Colour rendering properties. The perceived brightness is greatly improved but this would not be reflected in the measurements if measured by a lux meter that matches the luminous efficiency of photopic vision, in some cases failing inspection to the contrary of the visual assessment.
9

Colorimetry and colour perception
Fig. 7 Human Eye
MIXING OF COLOURS
Isaac Newton first demonstrated and explained the composition of white light, by refracting it through a glass prism into its constituent spectral colours. If coloured lights are added, this implies that different lights with different spectral colours composition are added. The resultant effect on the brain can be any of the spectral colours located in the visible spectrum, for example, yellow, or a non-spectral colour which does not appear in the spectrum as monochromatic light, for example, purple. Creation of colours by addition of coloured lights is known as additive mixing. The human eye behaves as though the ‘outputs’ of the three types of cones are additive.
Figure 8 illustrates the resultant colour effect of mixing three coloured lights, red, green, and blue. The red, green, and blue can be called the primaries and the resulting yellow, cyan, and magenta the secondaries.
Fig. 8 Additive Mixing
Fig. 9 Simple Subtractive Mixing
coLoRIMETRY Colour is a characteristic of light determined by the light’s spectral composition and the interaction with the human eye. Hence, colour is a psychophysical phenomenon, and perception of colour is subjective.
coLoUR PERcEPTIonThe eye acts much like a camera, with the lens forming the image of the scene on the light-sensitive retina. There are several kinds of light detectors, called rods and cones. The cones are grouped into three types, each responds to a portion of the spectrum, with peak responses corresponding to blue, green, and red light. The interaction of these groups is then responsible for the stimulus which is interpreted by the brain as colour. This widely accepted theory on colour vision is known as Trichromatic Theory.
10

Trist
imul
us C
olor
imet
ry
The colour of an object is determined by pigments. These are chemicals which create a given colour by subtracting parts of the spectrum of the incident light. The remaining light is reflected and perceived by the observer giving the object its colour characteristic.
Making colours by mixing paint pigments may therefore be described as a process of subtractive mixing (refer to fig. 9), since each pigment that is added subtracts more from the incident light and leaves less to be reflected into the eye. Following are some examples (the incident light in this example is white):
YELLOW = WHITE – BLUE
MAGENTA = WHITE – GREEN
CYAN = WHITE – RED
LIGHT SOURCE COLOUR SPECIFICATION
Several methods have been devised to quantify colour so that communication of colour becomes easier and more accurate. These methods attempt to provide a way of expressing colour numerically, in much the same way we express length and weight.
Light source colour specification and measurement can be categorised into thre following major colorimetric methods:
• Tristimulus colorimetry• Colour temperature• Spectroradiometry• Dominant Wavelength
TRISTIMULUS COLORIMETRY
Tristimulus colorimetry is based on the three component theory of colour vision, which states that the eye possesses receptors for three primary colours (red, green, blue) and that all colours are seen as mixtures of these three primary colours. The most important system is the CIE (Commission Internationale I’Eclairage) 1931 2° Standard Observer system, which defined the Standard Observer to have colour-matching functions x(λ), y(λ), and z(λ) as shownin Fig. 10 The XYZ tristimulus values are calculated from the spectral distribution of the lightsource, the spectral reflection of the object and using these three Standard Observer colour matching functions. XYZ tristimulus values and the associated Yxy colour space form the foundation of the present CIE colour space.
Colour-matching functions
Fig. 10 Colour Matching Functions
0.8
1
1.2
1.4
1.6
1.8
2
Tristim
ulus value
s
0
0.2
0.4
0.6
0.8
360 460 560 660 760Wavelength (nm)
11

Colour Space
CIE 1931 Yxy CHROMATICITY CHART
Fig. 11 1931 x,y Chromaticity Diagram
The tristimulus values XYZ are useful for defining a colour, but the results are not easily visualised. Because of this, CIE defined a colour space in 1931 for graphing colour into two dimensions independent of lightness; this is the Yxy colour space, in which Y is the lightness and x and y are the chromaticity coordinates calculated from the tristimulus value XYZ. The x and y chromaticity coordinates are calculated from the XYZ tristimulus values according to the following formulae: X Y x = y = X + Y + Z X + Y + Z
The principal drawback of the 1931 system is that equal distances on the chart do not represent equal perceived colour differences because of non-linearities in the human eye.
x
y
0.9
0.8
0.7
0.6
0.5
0.4
0.3
0.2
0.1
0.00.0 0.1 0.2 0.3 0.4 0.5 0.6 0.7 0.8
520
560
540
580
600
620
700
500
490
480
470460 380
CIE 1976 UCS CHROMATICITY CHART
Fig. 12 1976 UCS Diagram
The Uniform Chromaticity Scale (UCS) was developed to minimise the limitations of the 1931 system. It was intended to provide a perceptually more uniform colour spacing for colours at approximately the same luminance. The 1976 CIE- UCS chart uses u’ and v’ coordinates. The symbols u’ and v’ were chosen to differentiate from the u and v coordinates of the similar but short lived 1960 CIE-UCS system. The u’ and v’ chromaticity coordinates are also calculated from the XYZ tristimulus values according to the following formulae: 4X 9Yu’ = v’ = X + 15Y + 3Z X + 15Y + 3Z
12

Spec
trora
diom
etry
HELMHOLTZ COORDINATES
Fig. 13 Helmholtz Coordinates
An alternative set of coordinates in the CIE system, Dominant Wavelength and Purity (also known as Helmholtz coordinates), correlate more closely with the visual aspects of hue and chro-ma. The dominant wavelength (DW) of a colour is the wavelength of the spectrum colour whose chromaticity is on the same straight line as the sample point (S) and the illuminant point (N) (for light source measurement, the illuminant point is x=0.333 and y=0.333). Purity, also known as excitation purity, is the distance from the illumi-nant point (N) to the sample point (S), divided by that from the illuminant point (N) to the spectrum locus (DW).
Purity = (N—S) / (N—DW)
The above method is only applicable to spectral colour, that is colour which appears in visible spectrum. When measurement of non-spectral colour, that is colour which does not appear in visible spectrum and is located within the triangle area encompassed by the 3 points N, R and B, is concerned (purple colours), Complementary Dominant Wavelength (CDW) is used. This is because the interception point P, which is sup-
CDW
DW
N
S’
R
B
P
posed to be the Dominant Wavelength has no corresponding wavelength. The line from N to P is extended backward in order to determine the Complementary Dominant Wavelength (CDW). Purity for non-spectral colour is calculated from:
Purity = (N—S’) / (N—P)
Dominant wavelength and purity are commonly used in LEDs’ colour specification.
CL-200A CHROMA METER
Similar in design, features and operation to the popular T-10A illuminance meter, the CL-200A Chroma Meter is an Illuminance meter that can also provide readings of dominant wavelength-colour temperature etc. The CL-200A is a highly portable meter with numerous applications including tests for both amount and ambience of lit environments, inspection and development of projection systems and ensuring uniformity of modules used in LED billboards.
The CL-200A includes Data Management Software CL-S10w which enables users to store, manage and analyse measurement data, determine correlated colour temperature and use the CL-200A in multipoint mode of up to 30 measurement heads.
13

Colour Temperature
In particular, an ideal blackbody glows with a colour which depends on its temperature. The range of hues may be shown on the CIE dia-gram by a line which is referred to as a blackbody locus (or, Planckian locus). The colour progresses from a very deep red through orange, yellow, white and finally bluish-white as the temperature increases. Most natural light sources, such as the sun, stars, and fire fall very close to the Planckian locus.
Fig. 14 Planckian locus plotted on the CIE x,y Chromaticity Diagram.
The colour of some light sources corresponds to that of a full radiator when the latter is held at a particular temperature. For some purposes, it is convenient to classify a light source by quoting its colour temperature (measured in Kelvins). As long as the light being measured closely approximates a blackbody source, the results are quite accurate. Hence, the locus is particularly useful in the classification of ‘whites’. Colour
0.50
0.40
0.45
0.35
0.30
0.25
0.200.25 0.30 0.35 0.40 0.45 0.50 0.55
50000
+0.02uv
+0.01uv
±0.00uv
-0.01uv
-0.02uv
30000 200
00
15000 13000 10000 9000
8000
7000
6000
5000
4500
4000
3500
3000
2500
y0.90
0.80
0.70
0.60
0.50
0.40
0.30
0.20
0.10
0.00 0.10 0.20 0.30 0.40 0.50 0.60 0.70 x
520 530
540
550
560
570
590600610620650
680~780
510
500
490
480
470460450 380~440
2000250030003500
40004500
10000
* *
*
***
BC
AD55
D65D75
580
1500
temperature is widely used among lamp and display manufacturers.
CORRELATED COLOUR TEMPERATURE
Colour temperature is strictly applicable to light sources which may be precisely matched by a full radiator. The concept is extended to include sources which emit light that can be closely - but not exactly – matched by a full radiator. The expression Correlated Colour Temperature (CCT) is used to describe the light from such sources. This is the temperature at which a full radiator produces a light that most nearly matches the light from the given source. CCT is calculated by determining the isotemperature line on which the colour of the light source is positioned. Isotemperature lines are straight lines for which all colours on the line appear visually equal. Δuv is used to specify the deviation from the blackbody locus. The maximum deviation for Δuv is set at ±0.02 Δuv.
Fig. 15 xy chromaticity chart indicating the blackbody locus, the isotemperature lines and equal Δuv lines.
0.50
0.40
0.45
0.35
0.30
0.25
0.200.25 0.30 0.35 0.40 0.45 0.50 0.55
50000
+0.02uv
+0.01uv
±0.00uv
-0.01uv
-0.02uv
30000 200
00
15000 13000 10000 9000
8000
7000
6000
5000
4500
4000
3500
3000
2500
y0.90
0.80
0.70
0.60
0.50
0.40
0.30
0.20
0.10
0.00 0.10 0.20 0.30 0.40 0.50 0.60 0.70 x
520 530
540
550
560
570
590600610620650
680~780
510
500
490
480
470460450 380~440
2000250030003500
40004500
10000
* *
*
***
BC
AD55
D65D75
580
1500
coLoUR TEMPERATUREThe concept of colour temperature arises from the apparent colour changes that occur when an object is heated. When the temperature of an object increases, the radiation that is emitted changes which results in the change of colour. A special class of incandescent (glows when hot) object emits radiation with 100 percent efficiency when heated; scientists call this ideal full radiator a blackbody radiator.
14

Spec
trora
diom
etry
CCT is not suitable for measuring light sources which have narrow-band spectral emittance curves that do not approximate any blackbody curve (for example, LED).
COLOUR TEMPERATURE MEASURED USING A PHOTOGRAPHIC COLORIMETER
Photographic colorimeters function differently from industrial-grade measuring instruments. Although they claim to measure colour temperature, the purpose is to determine the appropriate filter values for taking pictures. The colour temperature taken with photographic colorimeters is called “photographic colour temperature.” The sensors used in the industrial instruments are intended to closely match the sensitivity of the human eye, the sensors of photographic colorimeters are similar to the sensitivity of colour photographic film.
Fig.16 Colour sensitivity of photo film
Fig. 10 on page 11 shows the sensitivity of the human eye, and Fig. 16 above shows the sensitivity of colour photographic film. Due to these differences between the two instruments, if the colour temperature of a light source was measured with a Chroma Meter and a photographic colorimeter, the result would be two completely different values.
SPECTRORADIOMETRY
The colour of a light source does not tell us the nature of its spectral power distribution, two
different light sources which have the same colour in x,y or colour temperature might not exhibit the same spectral power distribution. The reverse, however, is true: knowledge of spectral power distribution of light will enable us to describe the colour (see below different spectral power distribution curves of some common CIE illuminants).
The spectroradiometric method is the most accurate and complete method of specifying colour. The spectral data can be analysed visually and/or compared to data from another light source. However, the best use of spectral data is to calculate the CIE tristimulus values by mathematically integrating the data with the CIE colour-matching function. The tristimulus values are then used to compute CIE chromaticity coordinates and luminosity, which provide a complete description of the colour.
Standard Illuminant D65: Average daylight (including ultraviolet wavelength region) with a correlated colour temperature of 6504K.
Standard Illuminant C: Average daylight (not including ultraviolet wavelength region) with a correlated colour temperature of 6774K.
Standard Illuminant A: Incandescent light with a correlated colour temperature of 2856K.
E(λ)
λ nm
A
D65
CD65
C
Fig. 17 Spectral Distribution of CIE illuminants
15

coLoUR-REndERInG PRoPERTIESIllumination can be provided by hundreds of different types of light source, both natural and man-made. For assessment or comparison of colour it has always been standard practice to compare colours under natural light, either genuine or simulated using fluorescent lamps. In addition to fluorescent lamps, next generation light sources such as LEDs (light emitting diodes) are increasingly being adopted as illuminating lamps. When comparing how objects look under different lamps against how they look under natural light, how closely they match is called the “colour-rendering property.” A lamp that produces a hue similar to that of natural light is said to have a good (high) colour-rendering property.
There are many types of lamps commercially available (incandescent, fluorescent, LED, etc), each labelled with descriptions such as “white,” “warm white,” etc.
In the following examples, an object has been illuminated with a D65 fluorescent lamp with good colour-rendering property, a fluorescent lamp that was labelled as “Natural white” and an LED lamp.
To the eye, a D65 fluorescent lamp, a natural white fluorescent lamp and a white LED lamp all seem white. However, the natural white fluorescent lamp actually has a slightly higher colour temperature and may appear slightly bluer than the others.
We measured the three different light sources by mounting a luminance adapter on the Konica Minolta CS-2000 Spectroradiometer. If you compare the Blue and Green measured points on the xy chromaticity diagram to the right, you can see that the tones are similar to the D65 and in the visible range.
Colour Rendering Properties
2000
1500
250030003500
40004500
10000
D55
A
B
CD65
D75
520
510
500
490
480
470460
450
530
540
550
560
570
580
590
600
610620
650
380~440
680~780
0.10 0.20 0.30 0.40 0.50 0.60 0.70 0.80
1.00
0.90
0.80
0.70
0.60
0.50
0.40
0.30
0.20
0.10
D65 fluorescent lamp Natural white fluorescent lamp LED lamp
= LED lamp= Natural White Fluorescent lamp
xx
xx
Fig.18 xy chromaticity diagram comparing the colour temperature of an LED white and Natural White Fluorescent16

D65 Fluorescent Lamp Natural white fluorescent lamp
LED lamp
x 0.3128 0.3372 0.3465y 0.3290 0.3496 0.3662
Correlated colour temperature (k)
6504 5308 5004
* Because of its low colour-rendering index, the LED lamp used this time made the meat and plate look dark, but the meat would look fresher with an LED lamp having a higher colour- rendering index.
Colo
ur R
ende
ring
Prop
ertie
s
The photographs above show a plate of meat under the three light sources .
Under the D65 fluorescent lamp, the meat and the plate look like they would under natural light. Under the natural white fluorescent lamp, the colour temperature is slightly higher and both the meat and the plate look slightly paler. Under the LED lamp, the meat and plate look darker.
• The luminance at the sample surface was adjusted to be about 1600 lux for all three light sources.
• When a sample is illuminated with different light sources, the colour may look different.
• The difference in colour rendering performance is called “colour-rendering index” or CRI
• The CRI indicates how 15 test colours look under a particular light.
• When comparing a light source against a stipulated reference light source, an index of 100 is the best.
D65 fluorescent lamp
Natural white fluorescent lamp
LED lamp
THE CL-500A
The CL-500A Illuminance Spectrophotometer from Konica Minolta Sensing is designed for measurement of illuminance and colour rendering index particularly suited to ‘next generation’ light sources such as LED and EL Lighting.
• The first illuminance spectrophotometer that conforms to both JIS and DIN standards
• Two standard tripod mounting sockets
• Free SDK (Software Development Kit) gives you control of the software
• Excel® software add-in as standard provides user friendly analysis functions
• Spectral irradiance waveform display to facilitate grading and classification of light sources
• Can perform CRI, CCT, peak wavelength etc without PC connection
• LED binning function
17

We obtained the following colour-rendering indexes using the Konica Minolta CL-500A Illuminance Spectrophotometer. You could also measure these indexes using an illuminance adapted CS-2000A and the Data Management Software CS-S10w. With D65 being the standard, below are the two other light sources.
Ra is the “mean colour-rendering index.” It is the average of indexes R1 ~ R8 and is a representative value of colour-rendering indexes.
R9 ~ R15 are termed “special colour-rendering indexes,” with particular interest often being shown in R9 (highly vivid red) and in R15.
R9 is used for evaluation of the reproduction of red, and the big differences in values between the three types of light sources also give an indication of how much the colour of the meat seen under the different light sources will vary.
The graphics to the left are visual representations of colour rendering index measured using a Konica Minolta CL-500A.
Colour Rendering Index
Ra
79
68
R1
89
65
R2
89
74
R3
54
79
R4
82
68
R5
81
65
R6
72
62
R7
86
81
R8
76
54
R9
16
-39
R10
40
36
R11
63
61
R12
55
31
R13
92
66
R14
70
88
R15
92
59
Natural white fluorescent lamp
LED lamp
Natural white fluorescent lamp
LED lamp
0 20 40 60 80 100
Ra
R1
R2
R3
R4
R5
R6
R7
R8
R9
R10
R11
R12
R13
R14
R15
0
100 R1
R2
R3
R4
R5
R6
R7
R8R9
R10
R11
R12
R13
R14
R15
Fig.19 Values for each of the CRI tones (R1-R8) and special CRI tones (R9-R15) under LED White and Natural White Fluorescent
Fig. 20 Graphical Representations of Colour Rendering Index generated by the CL-500A and standard software CL-S10w18

The
Wea
knes
ses
of C
RI
ADDRESSING THE WEAKNESSES OF CRI
CRI (Ra) only uses the R1-R8 tones not the special CRI tones from R9-R15, it covers only non saturated colours and is weak on Red Colours (colourspace U*V*W* used for CRI is not Uniform in red). It is therefore possible for a lamp to have a high CRI but due to this deficiency the visual assessment actually shows that colour rendering is poor, LED lighting can be particularly susceptible to this phenomenon.
There are several alternative approaches to replacing CRI under consideration by the CIE including CQS (Colour quality Scale), MCRI (Memory Colour Rendering Index), CAM02UCS (Colour Appearance Model Universal Colour Space), CCI (Colour Category Index) etc. At this stage none of these alternatives have been adopted, however the most likely scenario as things stand is that CQS will be implemented into standards in the medium term future.
CQS was developed by NIST and functions in a similar way to CRI, providing an overall average figure (Qa) based on relative evaluation with differences between a test and reference light source. However, CQS uses the L*a*b* Colourspace and 15 highly saturated colours and the addition of a saturation factor.
The Konica Minolta CL-500A will be suitable for assessing colour rendering by whatever method is eventually adopted as it measures the full spectral curve of any light source. A simple firmware update can be made by the user, making the CL-500A a future proof instrument for lighting designers or inspectors.
CRI CQS
Ra
Example
The spectral power curve of an RGB LED with the following information is displayed below:
Tcp = 3300KΔuv = 0.000CRI (Ra) = 80
However when you include R9-R15, the score for R9 is -114 meaning that skin tones under this light source would appear pale and unhealthy.
RGB LED
Fig. 21 A comparison of CRI and CQS Tones
19

Photographic Colorimeters
SENSORS
The sensor of the photometer, which decides the conformity to the CIE Vλ curve, is critical to the accurate performance of the photometer.
Non-filtered sensors, such as the selenium and cadmium sulfide, inherit a natural spectral response which approximate the Vλ curve. However, its deviation from the Vλ curve makes it impractical for accurate photometry measurement and it is more commonly used in automatic light switches and other similar applications. Most modern filtered photometers use silicon
photodiodes which incorporate optical filters in front of the sensor so that the transmission of the filter and the spectral response of the sensor can be combined to closely match the CIE Vλ curve.
CIE recognised the need for a meaningful and internationally applicable method of specifying the quality of a photometric sensor and developed the f1 value. The f1 value, specified in percentage error, represents the degree to which the relative spectral responsivity matches CIE Vλ curve.
Fig.22 Relative Spectral Response
CALIBRATION METHOD
Beside f1 value, the calibration method of the photometer is also an important factor when deciding its suitability to a specific application. For example, a photometer with a relative large f1 value can still achieve good accuracy when the measured light source and the standard lamp used during the calibration process is similar.
There are two basic methods of calibrating photometers. The first and the most common method is using a standard lamp (usually tungsten). These lamps are certified and traceable to national standard laboratories/institutions. The photometers will be adjusted until the measurement reading matches the certified output of the standard lamp. The second calibration method is to use standard detectors. Such detectors have built-in sensors where the
Instruments Applications and Term
s
PHoToMETERA photometer can be defined as an instrument for measurement of visible light. Luminance and il-luminance meters are the most common photometers and are easily available as turnkey systems. Luminous flux meters and luminous intensity meters are not widely available and usually have to be customised to the specific light measurement application due to the geometry of measurement involved.
The basic difference between radiometer and photometer, is that the latter must respond to light as the CIE standard observer. In other words, the spectral response of the photometer must follow the CIE Standard Luminosity Function Vλ curve.
20

spectral responses perfectly match the CIE Vλ curve. In such calibrations, a lamp is still required but output can be varied but must be stable. The standard detector first measures the output of the lamp, and is substituted by the photometer and will be adjusted until the measurement give similar readings as the standard detector. Such detectors can also be certified and traceable to national standards.
COLOUR CORRECTION FACTOR
The correction of the detector-filter combination to the CIE Vλ curve is generally poor at the end of the visible spectral range. Hence, the colour temperature of the lamp used during calibration is critical. As most of the photometers are calibrated by a tungsten lamp, measurement of incandescent, halogen searchlights and sunlight generally give good accuracy. However, these photometers are not suitable for measurement of monochromatic light or narrowband emitters, e.g., blue and white LEDs. Measurement error will also be significant in discharge lamps, e.g., luminescent tubes, which show clear peaks (i.e. spectral lines) in the visible spectrum.
Modern photometers utilise a Colour Correction Factor feature to compensate the error caused by this spectral response difference between the sensor and the CIE Vλ curve. The CCF value can be calculated when both the spectral response of the sensor and the spectral power distribution of the light source is known. An alternate and easier method is to transfer the measurement data of a primary standard (for example, data taken from a spectroradiometer) to the photometer by varying the CCF value. CCF can also be used as a user-calibration feature, which is particularly useful if traceability of in-house standards’ is necessary.
APPLICATIONS OF PHOTOMETERS
Not surprisingly, misapplication of photometric instruments by the user is a common source of error. For many users, the main obstacle to effective light measurement is a lack of understanding of the characteristics of the type of measurement required. Attempts to convert between units will lead to gross errors. For example, the most common mistake encountered is attempting to use an illuminance meter (lumen/m2) to determine luminous flux (lumen), or, to use a luminance meter (candela/m2) to determine the luminous intensity (candela).
There are four main photometric instruments, namely the luminance meter, illuminance meter, luminous flux meter, and luminous intensity meter.
LUMINANCE METER
The visible energy output of a light source can be determined with a luminance measurement. Luminance is a directional quantity and in order to communicate measurements effectively we must specify the acceptance angle, measured area and measurement geometry. These factors are important as most light sources are not perfect lambertian sources (luminance is the same in all direction).
Since measurement is targeted at the source, such measurement can be achieved by using a optical lens system. Both the angular field of view and the angle subtended by the objective lens should be limited to avoid collecting light from parts of the display at slightly different angles.
Fig. 23 Luminance measurement technique involving the use of lens.
Measurement Geometry
Acceptance Angle
Measuring Area
Luminance Meter
Sensor
Lens
CCF
and
Lum
inan
ce M
eter
s
21

Photographic Colorimeters
Luminance measurement are important for products, such as traffic lights, televisions, and tail lights of automobiles.
THE LS-100,110 AND CS-100A
The LS-100 and 110 are portable luminance meters designed with a user friendly SLR design, and narrow acceptance angles to allow users to accurately measure even small specimen areas (LS-100 1° areas down to Ø1.3mm and LS-110 1/3° down to Ø0.4mm). The LS-100 and LS-110 provide a close match to CIE spectral luminous efficiency V(λ) the human eye under photopic vision conditions.
The CS-100A is a luminance meter that also provides measurements of chromacity, the CS-100A can also be used to make non contact colour measurements or assess colour difference by non contact methods where the surface is distant, just painted or cannot be touched for sanitary reasons. Similar to the LS-100 and 110 the CS-100A features a narrow measurement angle of 1° to measure subjects as small as Ø14.4mm (at a distance of 1014mm) or Ø1.3mm using optional close up lenses. The CS-100A is ideal for measuring CRT displays, projectors and the luminance and chromacity of all manner of light sources including for example signal lamps.
ILLUMINANCE METER
Illuminance is a measure of visible energy falling upon an object’s surface. Illuminance measurements are particularly susceptible to errors caused by off-axis light. By definition, light at the measurement plane should be proportional to the cosine of the angle at which the light is incident. However, due to total integration of the sensor into the detector head or the illuminance meter itself, many illuminance meters do not naturally collect light correctly according to the cosine law.
Cosine correction feature is included in the illuminance meter by means of a cosine diffuser which is placed over the sensor and filter. It is important to note that different systems will generate different cosine responses which result in different cosine errors at different incident angles due to the nature of the system geometry. Therefore, it is important to understand the system cosine response when comparing illuminance measurements from different illuminance meters, especially when off-axis light measurement is concerned.
Fig. 24 An example of the cosine response of an
illuminance meter
Illuminance measurement is widely used in ambient lighting measurement to determine how well the room is lit for ease of reading or working. For example, the standard in Europe for a comfortably lit desk is 500 lx.
Ideal Curve
Illuminance Meter
Illuminance M
eter
22

PWM CONTROLLED LIGHTING
A white LED is produced by a short wavelength LED (blue) and a phosphor which absorbs some of the blue light and emits a broader spectrum of visible light.
The current supplied can have a significant effect on the Correlated Colour Temperature produced by an LED lamp, with low current producing a more yellow light and high current a blue cast. This shift in colour is noticeable to the human eye which is why analog dimming is considered unsuitable for use in LED lamps.
PWM (pulse-width modulation) control is used to provide a dimming facility to LED lamps, largely to prevent shifts in colour temperature. Current is suppressed during portions of each cycle of the AC line voltage. The fluctuation happens faster than the human eye can notice, perceiving only the average intensity of the lamp.
To achieve a lower light intensity, the ‘off’ periods are extended, and the average brightness perceived is reduced but the current at the LED is constant.
PWM controlled lighting is an invaluable tool for Lighting Designers to control CCT and achieve reliable dimming to lower levels.
The imperceptible flicker relies on the human flicker fusion threshold, (a psychophysical threshold) which makes it difficult to measure the illuminance of these light sources with a conventional illuminance meter.
T-10A ILLUMINANCE METER
The T-10A is the successor to the popular T-10 Illuminance meter with the addition of USB connectivity and the ability to measure PWM controlled lighting. Conventional Illuminance meters are not designed to compensate for the flicker fusion threshold, and therefore may not provide accurate measurements of PWM controlled lamps.
The T-10 A conforms to both JIS AA Class and DIN Class B and is available with a range of options including a waterproof receptor and mini receptor for measurement in narrow or hard to access areas. The T-10A can also be used in a cost effective multi-point system for measurement of Illuminance distribution (for example street lighting, architectural lighting or projectors)
The Konica Minolta T-10A
PWM
Con
trolle
d Li
ghtin
g
23

Photographic Colorimeters
ANSI
An Illuminance meter is sometimes used to measure ANSI lumen. ANSI Standards IT7.227 & IT7.228-1997 specify 3 methods for evaluation of surface illuminance: ANSI lumen, uniformity and contrast. For evaluation of the performance of a LCD projector etc., the illuminance on the projector screen is measured by a matrix of receptor heads and a calculation is performed on the measured data using mathematical formula detailed below.
ANSI lumen multiplies the average illuminance of 9 units by the measuring area.
Measuring area S (m2) = S1 x S2
ANSI lumen E = (1/9 Σ Ei) x S
ANSI uniformity finds the brightest and darkest units from the average illuminance of 9 units and illuminance at each point and corner.
Average illuminance of nine units E (lx) = 1/9 Σ Ei
Ai (%): Ratio of illuminance Eii at each point to the average illuminance EAi(%) = ((Eci - E)/E) x 100
Bi(%): Ratio of illuminance ECi at each corner to the average illuminance EBi(%) = ((Eci - E)/E) x 100
E1
E9E8E7
E6E5E4
E3E2
S2
S1
E1
E9E8E7
E6E5E4
E3E2
EC1 EC2
EC3 EC4
B1
B6W5B5
W4B3W3
B2W1 W2
B4
W6
W7 B7 W8 B8
Ai and Bi are calculated for every 9 point and 4 corner to obtain the maximum and minimum values.
ANSI contrast calculates the ratio to the black background (as “1”) using the average illumi-nance of units in the black and white areas as shown below.
Average illuminance of 8 units in the black ground B(lx) = 1/8 Σ Bi
Average illuminance of 8 units in the white ground W(lx) = 1/8 Σ Bi
The results are expressed in the ratio W:B (B as 1). for example when W=1000(lx) and B=5(lx): ANSI contrast = 200:1
E1
E9E8E7
E6E5E4
E3E2
S2
S1
E1
E9E8E7
E6E5E4
E3E2
EC1 EC2
EC3 EC4
B1
B6W5B5
W4B3W3
B2W1 W2
B4
W6
W7 B7 W8 B8ANSI
E1
E9E8E7
E6E5E4
E3E2
S2
S1
E1
E9E8E7
E6E5E4
E3E2
EC1 EC2
EC3 EC4
B1
B6W5B5
W4B3W3
B2W1 W2
B4
W6
W7 B7 W8 B8
9
i=1
9
i=1
8
i=1
8
i=1
24

LUMINOUS FLUX METER
Luminous flux measurement is used to determine the total visible energy emitted by a light source. An integrating sphere is often used to converge all the power emitted by the source to the detector head.
Fig. 25 Total luminous flux measurement using an
integrating sphere
The integrating sphere has to be large enough to encompass the light source being measured, and as a general rule, the larger the sphere, the smaller the errors in measuring luminous flux for different light sources. As a rough example, calibrating a 1.5m tubular lamp in a 2.5m diameter sphere against a small incandescent standard will produce half the error that would result from calibration of the same lamp in a 2m sphere. Calibration of an integrating sphere can be carried out by means of transfer lamp standards which are traceable to recognised national standards. A good quality integrating sphere which postulates the performance of an ideally spherical, evenly coated interior requires a huge investment and usually has to be customised to the light measurement application. Hence, the existence of general purpose luminous flux meters is very limited.
LUMINOUS INTENSITY METER
Luminous intensity represents the flux flowing out of a source in a given direction per solid angle and it is used to quantify the power
Detector
Light source under measurement
Integrating Sphere
Lum
inou
s Fl
ux
of a light source. As the definition implies, luminous intensity measurement involves several geometrical intricacies, such as measurement direction and amount of solid angle. Light sources are rarely spatially homogeneous, leading to the questions on which direction and how much solid angle should be used to carry out the measurement. To measure the luminous intensity of a light source meaningfully, an agreed-upon fixture that defines the solid angle encompassed by the measurement and that orients the light source repeatably in an specified direction must be used. In other words, such meters have to be configured for the geometry of the source under test.
Basically, there are no off-the-shelf luminous intensity meters and comparison of measured data from two different luminous intensity meters serves no purpose, unless their measurement geometries are identical.
Fig.26 An example of luminous intensity meter set-up
Note: Solid angle can be calculated from the known detector’s area and measurement dis-tance. Detector is used to measure the flux read-ing in lumen.
THREE-FILTER COLORIMETER
Instruments designed for measuring coloured
Measurement Distance (D)
Light Source
Solid Angle (*) Detector
Fixture
25

light, which make use of three filters whose spectral sensitivity are matched to the CIE tri-stimulus colour matching functions, are known as three-filter colorimeters. Besides chromaticity measurement, these meters usually include one of the four basic photometric measurements, i.e., luminance, illuminance, luminous intensity, or luminous flux measurement.
These instruments use detectors which comprise high quality photodiodes with series-connected filters. The incident light is converted by the detector into signals which directly yield the standard XYZ tristimulus values.
Nevertheless, matching to the standard CIE tristimulus curves can be achieved only with finite accuracy. Deviations will occur in the defined CIE curves and in the sensitivity curves of the measuring instrument. These differences are negligible as long as the light to be measured exhibits a continuous energy output over the entire visible spectrum. However, the error may be significant if steep edges or spectral lines occur in the spectrum. Hence, three-filter colorimeters are not usually suited to measure light sources with spectral lines, e.g., discharge lamps (refer to Fig.28), or with narrow spectral energy distributions, e.g., LEDS (refer to Fig.29). THE CS-200 LUMINANCE CHROMAMETER
The CS-200 is a tristimulus chromameter that uses a spectral fitting method to provide luminance and chromacity measurement, the CS-200 uses 40 sensors to calculate spectral response closely corresponding to human eye sensitivity and provides accuracy comparable to some spectroradiometers.
The CS-200 can measure luminances ranging from 0.01 cd/m2 to 20,000,000 cd/m2 (with a
Three-Filter Colorimeter
measuring angle of 0.1°) and can be used for measurement of displays and light sources. The instrument can be used to measure either 1°, 0.2°, 0.1° covering everything from full displays down to individual pixels or distant light sources such as signal lights.
The CS-200 offers users a cost effective solution for measurement in an instrument that is portable and can be used with batteries or power chord as a standalone meter or partnered with a PC and software. Multiple CS-200 units could also be used in conjunction with a reference instrument such as a CS-2000A.
Fig. 27 Error in measurement caused by deviation
between CIE tristimulus curve and instrument’s
spectral response.
26
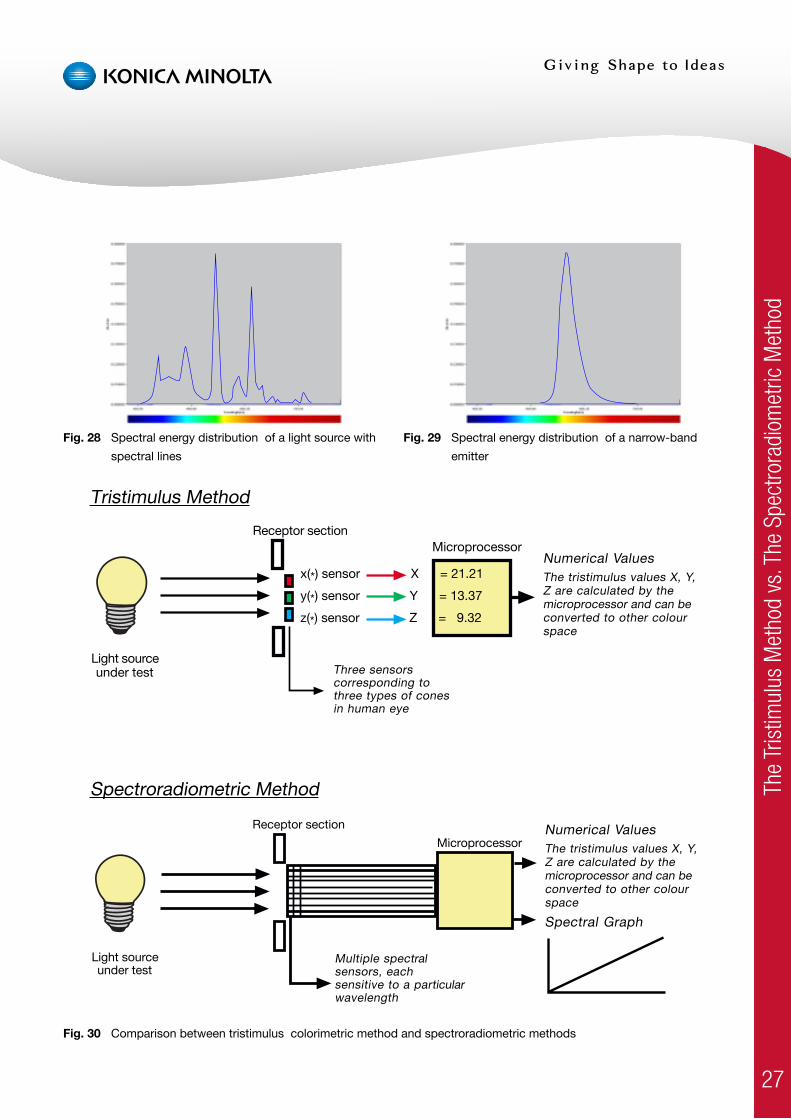
Fig. 30 Comparison between tristimulus colorimetric method and spectroradiometric methods
Tristimulus Method
Numerical ValuesThe tristimulus values X, Y,Z are calculated by themicroprocessor and can beconverted to other colourspace
Spectroradiometric Method
Receptor sectionMicroprocessor
x(*) sensor X = 21.21
y(*) sensor Y = 13.37
z(*) sensor Z = 9.32
Three sensorscorresponding tothree types of conesin human eye
Light sourceunder test
Receptor section
Microprocessor
Multiple spectralsensors, eachsensitive to a particularwavelength
Light sourceunder test
Numerical ValuesThe tristimulus values X, Y,Z are calculated by themicroprocessor and can beconverted to other colourspace
Spectral Graph
Fig. 29 Spectral energy distribution of a narrow-band
emitter
Fig. 28 Spectral energy distribution of a light source with
spectral lines
The
Trist
imul
us M
etho
d vs
. The
Spe
ctro
radi
omet
ric M
etho
d
27

Spectroradiometers
SPECTRORADIOMETER
Spectroradiometers are used to measure the spectral energy distribution of the light source, measuring both the radiometric and photometric quantities and the colorimetric quantities of light. These instruments record the radiation spectrum of the light source and calculate the desired parameters, such as chromaticity and luminance. Dispersion of light is usually accomplished in a spectroradiometer by means of prisms or diffraction gratings.
The exact CIE Vλ curve and CIE colour matching curves are stored in the software and are used to process the data from the measured spectral energy distribution of the light source under test. Hence, the measurement error associated with photometers and filter colorimeters is avoided in spectroradiometers. However, adequate sensitivity, high linearity, low stray light, low polarisation error, and a spectral bandpass resolution of 5 nm or less are essential for obtaining good accuracy.
Non-thermal radiators, such as discharge lamps (which can be characterised by their non-continuous spectral energy distribution), and narrow-band emitters can only be measured with precision by a spectroradiometer or illuminance spectrophotometer. When compared to three-filter colorimeters, spectroradiometers do have their limitations, in terms of speed of measurement, price and portability.
CS-2000A SPECTRORADIOMETER
The CS-2000A is an advanced Spectroradiometer capable of measuring extremely low luminance levels (down to 0.0005 cd/m2) can take measurements in as little as 2 seconds over a wavelength range of 380-
780nm the CS-2000A is the ideal instrument for measuring optical displays where contrast ratio (the CS-2000A can measure to 1,000,000:1) is a key criteria.
For assessment of light sources where accurate spectral data is required the CS-2000A maintains less than 5nm half bandwidth throughout the entire measurement wavelength range and can also be used with an optional adapter to take illuminance measurements. In terms of Scotopic luminous efficiency discussed earlier in this resource (page 8).
The CS-S10W software included with the CS-2000A includes the data for the spectral luminous efficiency of spectral vision, enabling the user to take highly accurate measurements corresponding to Scotopic vision. The software also enables the user to measure dominant wavelength, ideal for quality control of LEDs.
28

SUMMARY
If precise measurement of light is required, the spectroradiometric method is the most ideal and comprehensive method as it records the spectral characteristics of light and further processes them mathematically to obtain radiometric, spectroradiometric, photometric, and colorimetric data.
When portability, speed of measurement, and cost of investment, is of priority, filter photometers are still preferred. However, one should have a good understanding of the f1’ value of the photometer and its calibration method. This information is important to ascertain whether the photometer is appropriate to measure the light source under test, considering its spectral energy distribution.
Finally, one should choose an instrument which can make direct measurements of light characteristics, such as luminance, illuminance, luminous intensity, luminous flux and should not attempt any form of conversions across measurement geometries.
CONCLUSION
A good understanding of the measurable characteristics of light, and exactly which of those characteristics of light need to be quantified for a particular situation, will ensure that the radiometric and/or photometric characteristics of an application are described correctly.
This publication makes no claim to completeness but simply describes what the user needs to know about measurement of light. The pointers described are based on problems which are frequently mentioned in discussion between suppliers and customers.
Sum
mar
y an
d Co
nclu
sion
29

Konica Minolta Sensing Europe B.V.Headquarters
Edisonbaan 14-F 3439MN NieuwegeinNetherlands
Tel: +31 (0) 30/248-1200
Belgium BranchExcelsiorlaan 101930 Zaventem
BelgiumTel: +32 (0) 2 717 09 33
German BranchWerner-Eckert-Strasse 2, D-81829 Münich
GermanyTel: +49 (0) 89-4357 156 0
Switzerland Branch OfficeRiedstrasse 6 CH-8953 Dietikon
SwitzerlandTel: +41 (0) 43 322 98 00
French Branch OfficeZI Paris Nord 2 / Le Parc des Reflets, Bât. J
165 Avenue du Bois de la PieF-95940 ROISSY C.D.G. CEDEX
FranceTel: +33 (0) 1 8011 1070
UK Branch OfficeUnit 9, Webster Court, Westbtrook Crescent
Warrington, WA5 8WDEngland
Tel: +44 (0)1925 467 300
Nordic Branch OfficeOlof Asklunds gata 6 SE-421 30 Västra Frölunda
SwedenTel: +46 (0) 31 7099464
Italy Branch OfficeVia G. Gentile, 7 20157 Milano - MI
ItalyTel: +39 (0)2 390111
Poland Branch Officeul. Nowa 2a, 50-082 Wroclaw
PolandTel: +48 (0) 225603300
• [email protected] • www.konicaminolta.eu/measuring-instruments •
250313RFKMUK