The Language Attitude Survey of Jamaica - Linguistics
97
The Language Attitude Survey of Jamaica Data Analysis The Jamaican Language Unit Department of Language, Linguistics & Philosophy Faculty of Humanities & Education University of the West Indies, Mona
Transcript of The Language Attitude Survey of Jamaica - Linguistics

The Language Attitude Survey of
Jamaica
Data Analysis
The Jamaican Language Unit Department of Language, Linguistics & Philosophy
Faculty of Humanities & Education University of the West Indies, Mona
November 2005
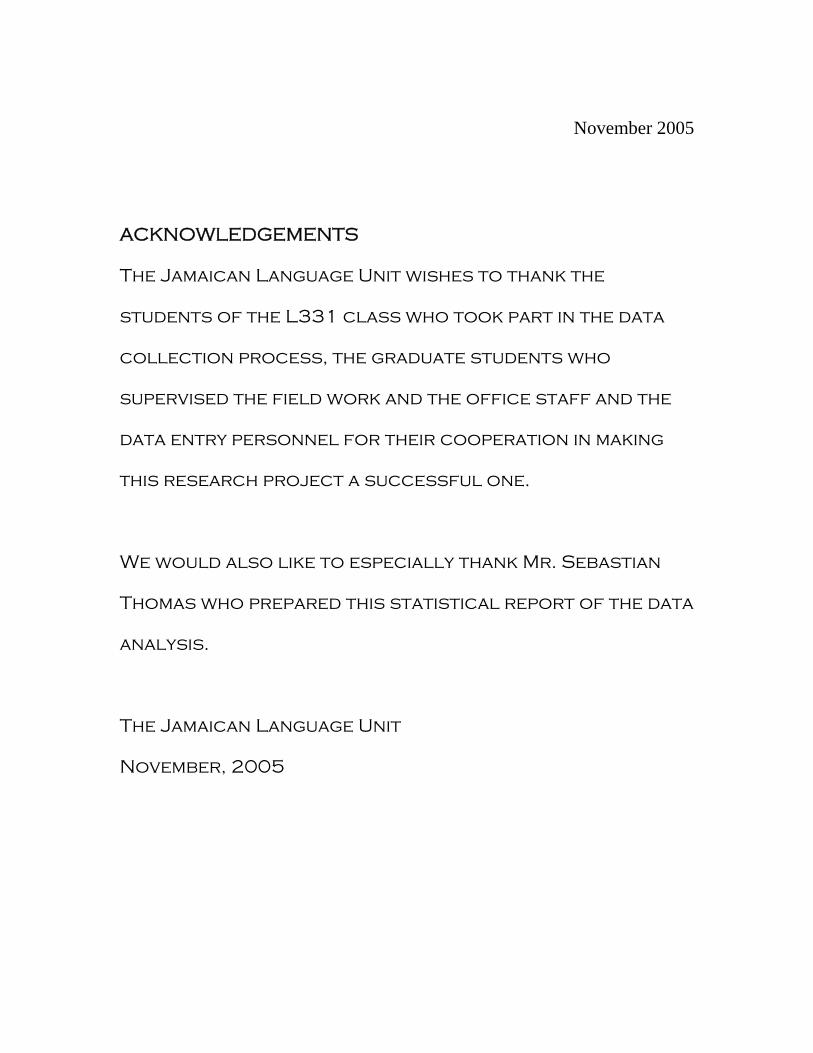
ACKNOWLEDGEMENTS
The Jamaican Language Unit wishes to thank the
students of the L331 class who took part in the data
collection process, the graduate students who
supervised the field work and the office staff and the
data entry personnel for their cooperation in making
this research project a successful one.
We would also like to especially thank Mr. Sebastian
Thomas who prepared this statistical report of the data
analysis.
The Jamaican Language Unit
November, 2005

2
Table of Contents
List of Tables 3
Executive Summary 5
Data Presentation and Report for Language Attitude Survey of Jamaica 6
• A. Profile of the Sample 6
• B. Language Awareness 8
• C. Government/Public Use 14
• D. Language Use and Social Stereotypes 15
• E. Education 30
• F. Writing in a Standard Form 33
• G. Occupation 37
Appendix 50
• Questionnaires 50
• SPSS Output 52
3
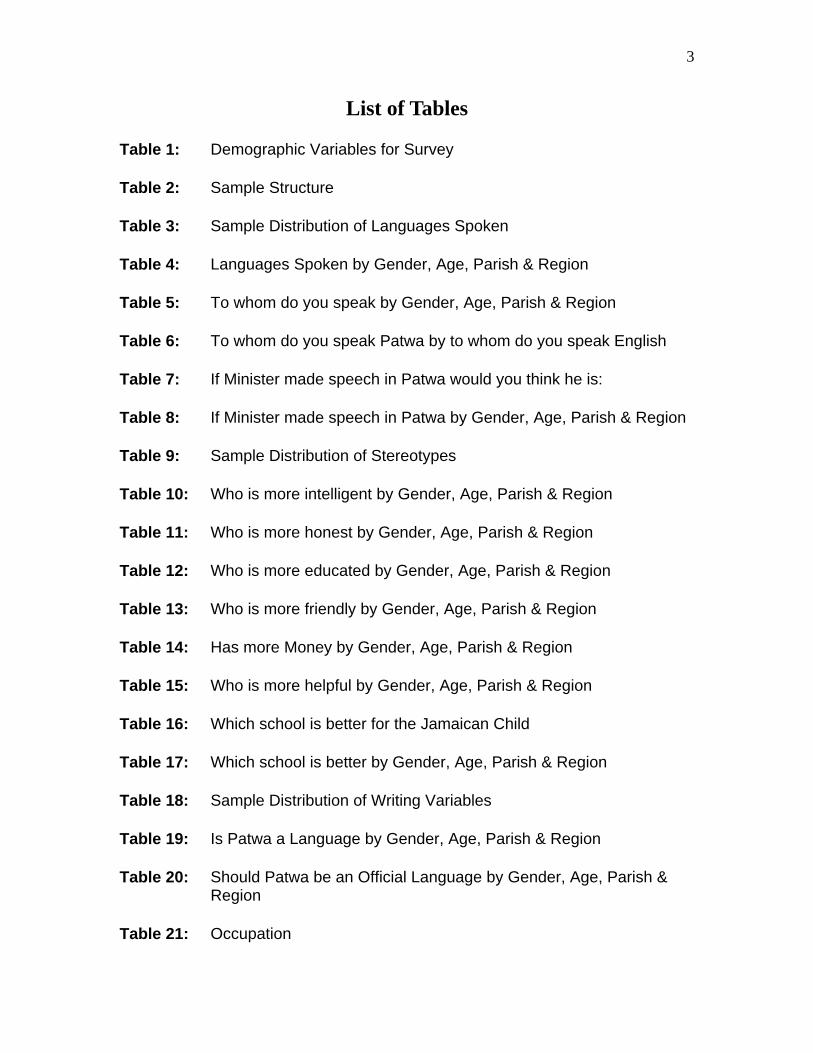
List of Tables
Table 1: Demographic Variables for Survey
Table 2: Sample Structure
Table 3: Sample Distribution of Languages Spoken
Table 4: Languages Spoken by Gender, Age, Parish & Region
Table 5: To whom do you speak by Gender, Age, Parish & Region
Table 6: To whom do you speak Patwa by to whom do you speak English
Table 7: If Minister made speech in Patwa would you think he is:
Table 8: If Minister made speech in Patwa by Gender, Age, Parish & Region
Table 9: Sample Distribution of Stereotypes
Table 10: Who is more intelligent by Gender, Age, Parish & Region
Table 11: Who is more honest by Gender, Age, Parish & Region
Table 12: Who is more educated by Gender, Age, Parish & Region
Table 13: Who is more friendly by Gender, Age, Parish & Region
Table 14: Has more Money by Gender, Age, Parish & Region
Table 15: Who is more helpful by Gender, Age, Parish & Region
Table 16: Which school is better for the Jamaican Child
Table 17: Which school is better by Gender, Age, Parish & Region
Table 18: Sample Distribution of Writing Variables
Table 19: Is Patwa a Language by Gender, Age, Parish & Region
Table 20: Should Patwa be an Official Language by Gender, Age, Parish & Region
Table 21: Occupation
4
Table 22: Languages Spoken by Occupation
Table 23: To whom do you speak by Occupation
Table 24: Government/Public Use by Occupation
Table 25: Who is more Intelligent by Occupation
Table 26: Who is more Honest by Occupation
Table 27: Who is more Educated by Occupation
Table 28: Who is more Friendly by Occupation
Table 29: Who is has more Money by Occupation
Table 30: Who is more Helpful by Occupation
Table 31: Which school would be better by Occupation
Table 32: Is Patwa a Language by Occupation
Table 33: Should Patwa be an Official Language by Occupation

5
Executive Summary The Language Attitude Survey of Jamaica (LAS) was an island wide study conducted by
the Jamaican Language Unit (JLU) to assess the views of Jamaicans towards Patwa
(Jamaican Creole) as a language. The sample consisted of 1,000 Jamaicans, stratified
along the variables of region (western, central and eastern), area (urban and rural), age
(18-30yrs, 31-50yrs and 51yrs and older) and gender.
The sample, in general, had a fairly positive view of Patwa. The majority felt that Patwa
was a language and that parliament should make it an official language alongside
English. Most indicated that they spoke Patwa with family and friends but not with
strangers and co-workers. A significant majority of the sample also felt that a school that
taught in English and Patwa would be better than an English only school for Jamaican
children.
Despite this, several stereotypical views of Patwa were held by a number of respondents
in the sample. For instance, most people felt that an English speaker was more intelligent
and educated. Additionally, less than 10% of the sample thought, that a Patwa speaker
would have more money than an English speaker.
Several significant relationships were found between the demographic and language
variables. The oldest age group (51 years and older) tended to have more negative or
conservative views of Patwa when compared with the younger age groups.
Occupation also seemed to have a significant impact on language variables. Though still
relatively positive, unskilled/housewives and unemployed individuals tended to be more
likely to have negative attitudes towards Patwa.
6
Data Presentation and Report for Language Attitude Survey of Jamaica
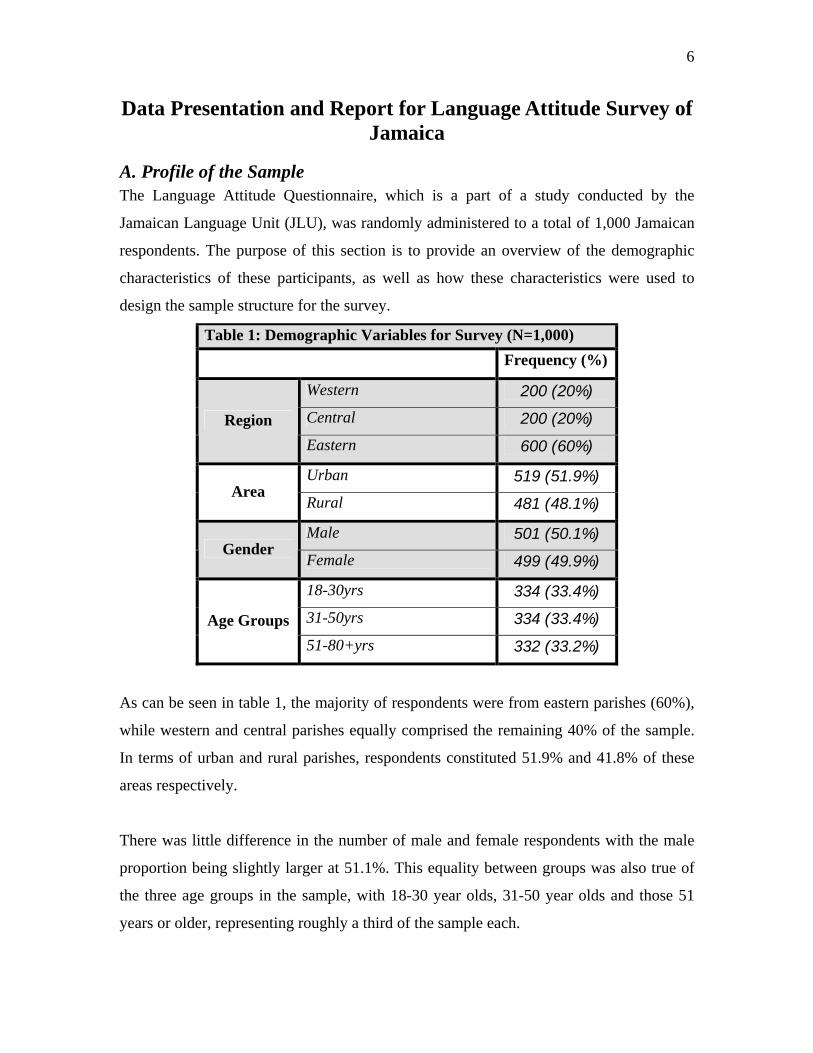
A. Profile of the Sample The Language Attitude Questionnaire, which is a part of a study conducted by the
Jamaican Language Unit (JLU), was randomly administered to a total of 1,000 Jamaican
respondents. The purpose of this section is to provide an overview of the demographic
characteristics of these participants, as well as how these characteristics were used to
design the sample structure for the survey.
Table 1: Demographic Variables for Survey (N=1,000)
Frequency (%)
Western 200 (20%) Central 200 (20%) Region Eastern 600 (60%)
Urban 519 (51.9%) Area
Rural 481 (48.1%)
Male 501 (50.1%) Gender
Female 499 (49.9%)
18-30yrs 334 (33.4%) 31-50yrs 334 (33.4%) Age Groups 51-80+yrs 332 (33.2%)
As can be seen in table 1, the majority of respondents were from eastern parishes (60%),
while western and central parishes equally comprised the remaining 40% of the sample.
In terms of urban and rural parishes, respondents constituted 51.9% and 41.8% of these
areas respectively.
There was little difference in the number of male and female respondents with the male
proportion being slightly larger at 51.1%. This equality between groups was also true of
the three age groups in the sample, with 18-30 year olds, 31-50 year olds and those 51
years or older, representing roughly a third of the sample each.

7
Table 2: Sample Structure (N=1,000) Age Groups
18-30yrs 31-50yrs 51-80+yrsMales 17 (50%) 17 (50%) 17 (51.5%) Females 17 (50%) 17 (50%) 16 (48.5%)
Urban
All Sexes 34 34 33 Males 17 (51.5%) 17 (51.5%) 16 (48.5%) Females 16 (48.5%) 16 (48.5%) 17 (51.5%) Rural All Sexes 33 33 33
Western
All Areas 67 67 66 Males 17 (50%) 17 (51.5%) 16 (37.2%) Females 17 (50%) 16 (48.5%) 27 (62.8%) Urban All Sexes 34 33 43 Males 17 (51.5%) 16 (47.1%) 17 (73.9%) Females 16 (48.5%) 18 (52.9%) 6 (26.1%) Rural All Sexes 33 34 23
Central
All Areas 67 67 66 Males 50 (50%) 50 (50%) 58 (53.7%) Females 50 (50%) 50 (50%) 50 (46.3%) Urban All Sexes 100 100 108 Males 50 (50%) 50 (50%) 42 (45.7%) Females 50 (50%) 50 (50%) 50 (54.3%) Rural All Sexes 100 100 92
Eastern
All Areas 200 200 200 Total 334 334 332
Region (western, central and eastern), area (urban and rural), age (18-30yrs, 31-50yrs and
51yrs and older) and gender were the variables used to design the stratified sample for the
LAS. In the final analysis 36 individual strata broken down by the four key variables
were formed.
As has been previously indicated the majority of the sample came from the eastern
region, this meant that the twelve strata found in this region were significantly larger than
the twenty four found in the other regions. The strata in the western and central regions
were more less equal to each other, with the exception of the central region’s, rural, 51
years and older female group (which was relatively smaller) and the central region’s,
urban, 51 years and older female group (which was relatively larger).

8
B. Language Awareness Having gathered demographic information, the second major subsection of the Language
Attitude questionnaire was Language Awareness. This section had questions on what
languages respondents declared themselves speakers of, and to whom respondents spoke
English and Patwa. It should be noted that the languages of focus for this project were
English and Patwa, this meant that any other languages that participants declared they
spoke outside of these languages were ignored.
Table 3: Sample Distribution of Languages Spoken (N=1,000)
What Languages do you Speak? Frequency (%) English 109 (89.3%)
Patwa 105 (88.9%)
Both 784 (78.4%)
To whom do you speak? Frequency (%)
Friends/Family only 79 7.9%
Strangers/Co-workers 571 57.1%
Everyone 262 26.2% English
No One 88 8.8%
Friends/Family only 629 62.9%
Strangers /Co-workers 32 3.2%
Everyone 285 28.5% Patwa
No One 54 5.4%
As can be seen from table 3, the majority of the sample stated that they spoke both
English and Patwa (78.4%). Those who spoke English or Patwa only, were fewer than
11% of the sample each.
Several significant differences were observed with respect to whom respondents were
most likely to speak English to as opposed to Patwa. Fifty seven per cent of the sample
reported that they were most likely to speak English to strangers and co-workers. This is
in sharp contrast to the 3.2% of the sample that said they were most likely to speak Patwa
to the same group. The most likely group that respondents said they would speak Patwa

9
to, were friends and family at 62.9%. Again this is very different to the percentage of the
sample that indicated they were most likely to speak English to friends and family
(7.9%).

10
Table 4: Languages Spoken by Gender, Age, Area & Region
Languages Spoken Gender
χ2(2) =11.94; p = 0.003
English Count(%)
Patwa Count(%)
Both Count(%)
TOTAL
Male 59 (11.8%) 68 (13.6%) 372 (74.5%) n = 499 100%
Female 50 (10%) 37 (7.4%) 412 (82.6%) n = 499 100%
Age Groups χ2(4) =19.35; p = 0.001
English Count(%)
Patwa Count(%)
Both Count(%) TOTAL
18-30yrs 26 (7.8%) 22 (6.6%) 285 (85.6%) n = 333 100%
31-50yrs 34 (10.2%) 39 (11.7%) 261 (78.1%) n = 334 100%
51-80+yrs 49 (14.8%) 44 (13.3%) 238 (71.9%) n = 331 100%
Area χ2(2) =6.52; p =0.038
English Count(%)
Patwa Count(%)
Both Count(%) TOTAL
Urban 69 (13.3%) 52 (10.1%) 396 (76.6%) n =517 100%
Rural 40 (8.3%) 53 (11%) 388 (80.7%) n = 481 100%
Region χ2(4) =13.92; p =0.008
English Count(%)
Patwa Count(%)
Both Count(%) TOTAL
Western 13 (6.5%) 22 (11.1%) 164 (82.4%) n =199 100%
Central 18 (9%) 31 (15.5%) 151 (75.5%) n =200 100%
Eastern 78 (13%) 52 (8.7%) 469 (78.3%) n =599 100%
Table 4 summarizes a chi-square (χ2) analysis of the languages spoken by the key
demographic variables in the study. All four tests found statistically significant
relationships between languages spoken and the variables (p<0.05).
With regards to gender, men were more likely than women to speak Patwa only (13.6%
versus 7.4%). Women on the other hand, were 8% more likely than men to speak both
11
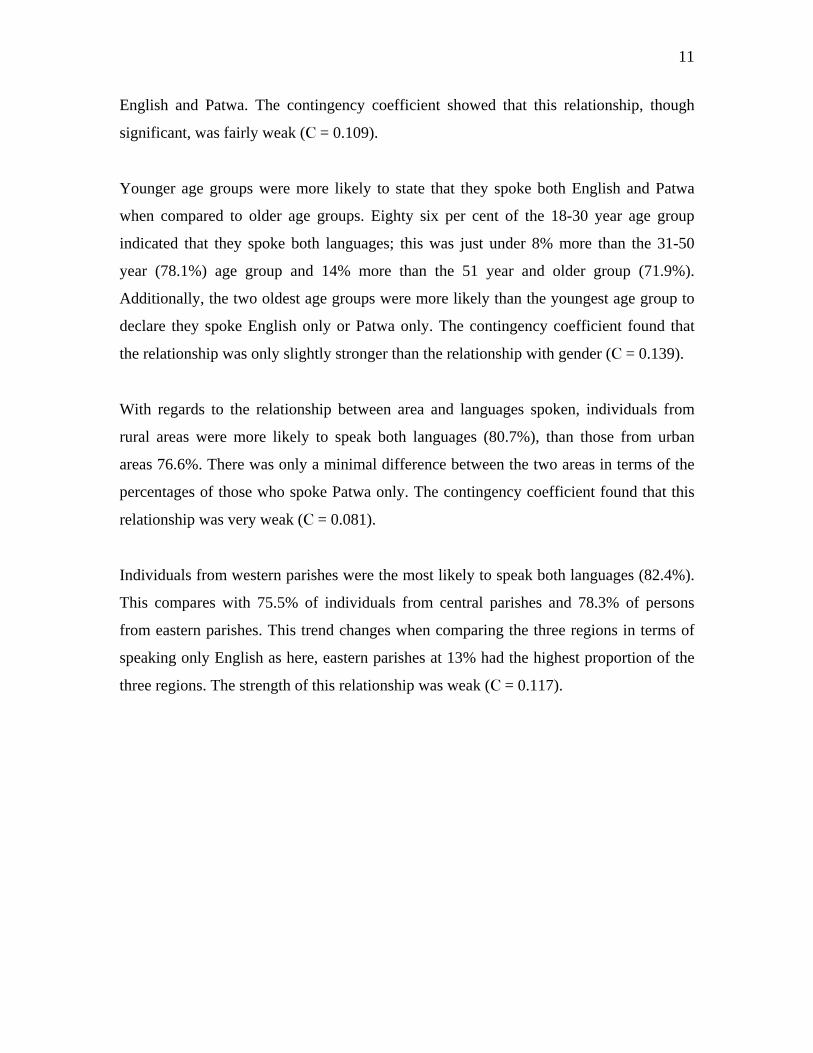
English and Patwa. The contingency coefficient showed that this relationship, though
significant, was fairly weak (C = 0.109).
Younger age groups were more likely to state that they spoke both English and Patwa
when compared to older age groups. Eighty six per cent of the 18-30 year age group
indicated that they spoke both languages; this was just under 8% more than the 31-50
year (78.1%) age group and 14% more than the 51 year and older group (71.9%).
Additionally, the two oldest age groups were more likely than the youngest age group to
declare they spoke English only or Patwa only. The contingency coefficient found that
the relationship was only slightly stronger than the relationship with gender (C = 0.139).
With regards to the relationship between area and languages spoken, individuals from
rural areas were more likely to speak both languages (80.7%), than those from urban
areas 76.6%. There was only a minimal difference between the two areas in terms of the
percentages of those who spoke Patwa only. The contingency coefficient found that this
relationship was very weak (C = 0.081).
Individuals from western parishes were the most likely to speak both languages (82.4%).
This compares with 75.5% of individuals from central parishes and 78.3% of persons
from eastern parishes. This trend changes when comparing the three regions in terms of
speaking only English as here, eastern parishes at 13% had the highest proportion of the
three regions. The strength of this relationship was weak (C = 0.117).

12
Table 5: To whom do you speak by Gender, Age, Area & Region 1English 2Patwa Gender
1χ2(3) =18.773; p =0.000 2 χ2(3) =31.68; p =0.000
Family Count(%)
Strangers Count(%)
Everyone Count(%)
No One Count(%)
Family Count(%)
StrangersCount(%)
Everyone Count(%)
No One Count (%)
Male 42 (8.4%) 258 (51.5%) 141 (28.1%) 60 (12%) 274 (54.7%) 23 (4.6%) 168 (33.5%) 36 (7.2%) Female 37 (7.4%) 313 (62.7%) 121 (24.2%) 28 (5.6%) 355 (71.1%) 9 (1.8%) 117 (23.4%) 18 (3.6%)
Age Groups 1χ2(6) =29.39; p =0.000 2 χ2(6) =36.17; p =0.000
Family Count(%)
Strangers Count(%)
Everyone Count(%)
No One Count(%)
Family Count(%)
StrangersCount(%)
Everyone Count(%)
No One Count(%)
18-30yrs 25 (7.5%) 222 (66.5%) 73 (21.9%) 14 (4.2%) 245 (73.4%) 6 (1.8%) 75 (22.5%) 8 (2.4%) 31-50yrs 25 (7.5%) 190 (56.9%) 87 (26%) 32 (9.6%) 206 (61.7%) 12 (3.6%) 101 (30.2%) 15 (4.5%)
51-80+yrs 29 (8.7%) 159 (47.9%) 102 (30.7%) 42 (12.7%) 178 (53.6%) 14 (4.2%) 109 (32.8%) 31 (9.3%) Area
1χ2(3) =11.50; p =0.009 2 χ2(3) =19.75; p =0.000
Family Count(%)
Strangers Count(%)
Everyone Count(%)
No One Count(%)
Family Count(%)
StrangersCount(%)
Everyone Count(%)
No One Count(%)
Urban 52 (10%) 299 (57.6%) 133 (25.6%) 35 (6.7%) 349 (67.2%) 22 (4.2%) 118 (22.7%) 30 (5.8%) Rural 27 (5.6%) 272 (56.5%) 129 (26.8%) 53 (11%) 280 (58.2%) 10 (2.1%) 167 (34.7%) 24 (5%)
Region 1χ2(6) =11.49; p =0.074 2 χ2(6) =11.51; p =0.074
Family Count(%)
Strangers Count(%)
Everyone Count(%)
No One Count(%)
Family Count(%)
StrangersCount(%)
Everyone Count(%)
No One Count(%)
Western 14 (7%) 125 (62.5%) 38 (19%) 23 (11.5%) 121 (60.5%) 9 (4.5%) 65 (32.5%) 5 (2.5%) Central 16 (8%) 110 (55%) 52 (26%) 22 (11%) 127 (63.5%) 8 (4%) 58 (29%) 7 (3.5%) Eastern 49 (8.2%) 336 (56%) 172 (28.7%) 43 (7.2%) 381 (63.5%) 15 (2.5%) 162 (27.5%) 42 (7%)
Table 5 displays crosstabulations done with the key demographic variables and to whom individuals were most likely to speak Patwa
and English. Males at 12% were most likely to speak English with no one when compared to females (5.6%).
13
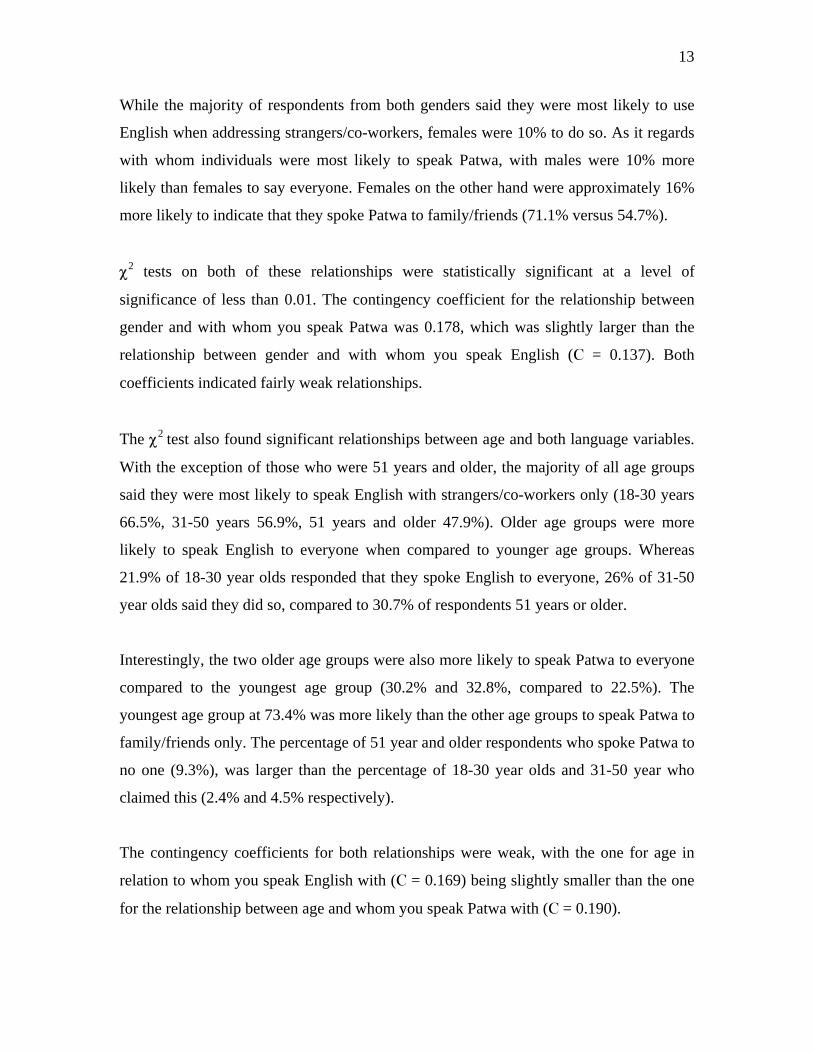
While the majority of respondents from both genders said they were most likely to use
English when addressing strangers/co-workers, females were 10% to do so. As it regards
with whom individuals were most likely to speak Patwa, with males were 10% more
likely than females to say everyone. Females on the other hand were approximately 16%
more likely to indicate that they spoke Patwa to family/friends (71.1% versus 54.7%).
χ2 tests on both of these relationships were statistically significant at a level of
significance of less than 0.01. The contingency coefficient for the relationship between
gender and with whom you speak Patwa was 0.178, which was slightly larger than the
relationship between gender and with whom you speak English (C = 0.137). Both
coefficients indicated fairly weak relationships.
The χ2 test also found significant relationships between age and both language variables.
With the exception of those who were 51 years and older, the majority of all age groups
said they were most likely to speak English with strangers/co-workers only (18-30 years
66.5%, 31-50 years 56.9%, 51 years and older 47.9%). Older age groups were more
likely to speak English to everyone when compared to younger age groups. Whereas
21.9% of 18-30 year olds responded that they spoke English to everyone, 26% of 31-50
year olds said they did so, compared to 30.7% of respondents 51 years or older.
Interestingly, the two older age groups were also more likely to speak Patwa to everyone
compared to the youngest age group (30.2% and 32.8%, compared to 22.5%). The
youngest age group at 73.4% was more likely than the other age groups to speak Patwa to
family/friends only. The percentage of 51 year and older respondents who spoke Patwa to
no one (9.3%), was larger than the percentage of 18-30 year olds and 31-50 year who
claimed this (2.4% and 4.5% respectively).
The contingency coefficients for both relationships were weak, with the one for age in
relation to whom you speak English with (C = 0.169) being slightly smaller than the one
for the relationship between age and whom you speak Patwa with (C = 0.190).

14
The relationships between area and with whom you speak English and Patwa were both
statistically significant. Both were however weak as the contingency coefficient for the
relationship between area and with whom you speak English was 0.107, and the one for
area and with whom you speak Patwa was 0.141.
A fairly equal majority of both urban and rural respondents stated that they were most
likely to speak English to strangers/co-workers only (57.6% and 56.5% respectively).
Urban participants were just under 5% more likely to speak English with family/friends
only than individuals from rural areas.
At 67.2% urban individuals were also almost 10% more likely than rural participants
(58.2%) to speak Patwa with family/friends only. However, rural respondents were 12%
more likely to speak Patwa with everyone when compared to urban respondents.
χ2 tests on both language variables and region found no significant relationships. The
majority of respondents in all regions were most likely to speak English to strangers/co-
workers only, while the majority in all three regions spoke Patwa to family/friends only.

15
Table 6: To whom do you speak Patwa by to whom do you speak English
To whom do you speak Patwa To whom do you speak English
χ2(9) =409.44; p =0.000
Family Count(%)
Strangers Count(%)
Everyone Count(%)
No One Count(%) TOTAL
Family 59 (9.4%)
6 (18.8%)
10 (3.5%)
4 (7.4%)
n =79 100%
Strangers 482 (76.6%)
13 (40.6%)
74 (26%)
2 (3.7%)
n =571 100%
Everyone 75 (11.9%)
12 (37.5%)
130 (45.6%)
45 (83.3%)
n = 262 100%
No One 13 (2.1%)
1 (3.1%)
71 (24.9%)
3 (5.6%)
n =88 100%
Table 7 shows the relationship between whom individuals spoke Patwa with and those
they spoke English with. A chi-square test found this to be statistically significant
relationship and the contingency coefficient showed that the relationship was a fairly
strong one (C = 0.539).
Those who spoke Patwa to family were the most likely group to speak English to
strangers (76.6%). Additionally, 40.6% those who spoke Patwa to strangers were also
likely to speak English to strangers. Unsurprisingly, the majority of respondents who said
that they spoke Patwa to no one (83.3%) said that they spoke English to everyone.
16
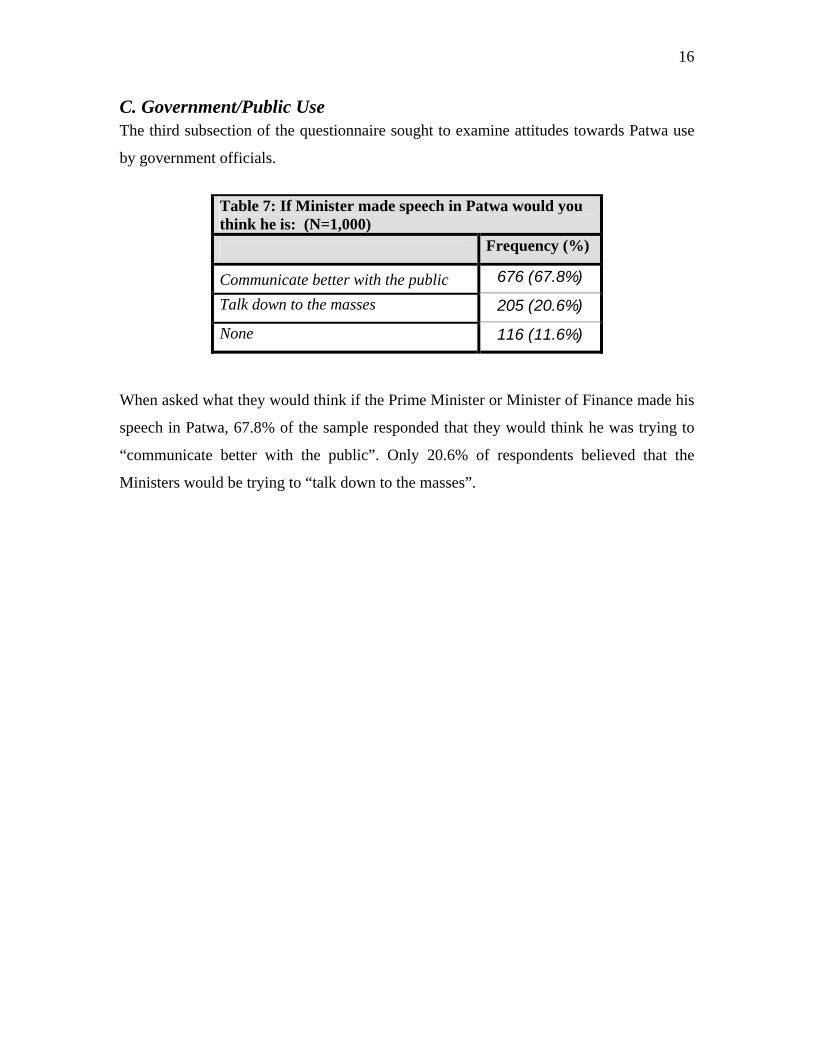
C. Government/Public Use The third subsection of the questionnaire sought to examine attitudes towards Patwa use
by government officials.
Table 7: If Minister made speech in Patwa would you think he is: (N=1,000) Frequency (%)
Communicate better with the public 676 (67.8%)
Talk down to the masses 205 (20.6%)
None 116 (11.6%)
When asked what they would think if the Prime Minister or Minister of Finance made his
speech in Patwa, 67.8% of the sample responded that they would think he was trying to
“communicate better with the public”. Only 20.6% of respondents believed that the
Ministers would be trying to “talk down to the masses”.

17
Table 8: If Minister made speech in Patwa by Gender, Age, Area & Region
If Minister made speech in Patwa Gender
χ2(2) =3.43; p =0.180
Communicate better with public Count(%)
Talk down to the masses Count(%)
None Count(%)
TOTAL
Male 349 (69.8%) 91 (18.2%) 60 (12%) n =500 100%
Female 327 (65.8%) 114 (22.9%) 56 (11.3%) n =497 100%
Age Groups
χ2(4) =1.47; p =0.832
Communicate better with public Count(%)
Talk down to the masses Count(%)
None Count(%) TOTAL
18-30yrs 225 (67.4%) 71 (21.3%) 38 (11.4%) n = 334 100%
31-50yrs 219 (66%) 71 (21.4%) 42 (12.7%) n = 332 100%
51-80+yrs 232 (70.1%) 63 (19%) 36 (10.9%) n = 331 100%
Area
χ2(2) =3.22; p =0.200
Communicate better with public Count(%)
Talk down to the masses Count(%)
None Count(%) TOTAL
Urban 338 (65.3%) 115 (22.2%) 65 (12.5%) n = 518 100%
Rural 338 (70.6%) 90 (18.8%) 51 (10.6%) n = 479 100%
Region
χ2(4) =12.45; p =0.014
Communicate better with public Count(%)
Talk down to the masses Count(%)
None Count(%) TOTAL
Western 152 (76.8%) 28 (14.1%) 18 (9.1%) n = 198 100%
Central 133 (66.5%) 49 (24.5%) 18 (9%) n = 200 100%
Eastern 391 (65.3%) 128 (21.4%) 80 (13.4%) n = 599 100%
Table 7 shows how this government use variable was related to the key demographic
variables. No statistical significance was observed for the relationships between
government use and gender, age or area.

18
A χ2 analysis of government use in relation to region was however significant.
Respondents from western parishes at 76.8% were more than 10% more likely than
individuals from central (66.5%) and eastern regions (65.3%) to think the ministers
would be trying to “communicate better with the public”. By extension, people from
central and eastern regions were more likely to view the ministers as “talking down to the
masses” than those from western regions. The contingency coefficient showed that this
was a weak relationship (C = 0.111).

19
D. Language Use and Social Stereotypes This represented the fourth section of the survey instrument and it sought to identify
stereotype notions individuals hold about speakers of one language versus the other.
Table 9: Sample Distribution of Stereotypes (N=1,000)
Which Speaker do you think: Frequency (%)
Patwa 73 7.7%
English 550 57.8% Is more Intelligent
Neither/Both 329 34.6%
Patwa 283 31%
English 278 30.4% Is more Honest
Neither/Both 353 38.6%
Patwa 59 6.2%
English 591 61.7% Is more Educated
Neither/Both 308 32.2%
Patwa 379 39.8%
English 240 25.2% Is more Friendly
Neither/Both 333 35%
Patwa 77 8.8%
English 390 44.7% Has more Money
Neither/Both 406 46.5%
Patwa 300 31.9%
English 292 31.1% Is more Helpful
Neither/Both 348 37%
More Intelligent/More Honest
Only 7.7% of the sample believed that a person speaking Patwa would be more intelligent
than a person speaking English. Just over a third of the sample (34.6%) thought neither
would be more intelligent. There were no major differences between the number of
people who thought that either one of the speakers would be more honest. Thirty one per

20
cent felt that the Patwa speaker would be more honest, compared to 30.4% who thought
the English speaker would be more honest.
More Educated/More Friendly
Unsurprisingly, the pattern for the speaker who respondents thought would be more
educated was very similar to the one observed for intelligence. Only 6.6% of the sample
believed that the Patwa speaker would be more educated compared with 61.7% who
thought the English speaker would be more educated. A larger proportion of the sample
(39.8%) thought that the Patwa speaker was friendlier. This is in contrast to the 25.2%
who thought that the English speaker was friendlier.
More Money/More Helpful
Only 8.8% of the sample thought that the Patwa speaker would have more money. It
should be noted however that 46.5% of the sample felt that neither would have more
money. There were no major differences in the number of people who thought the Patwa
speaker would be more helpful versus those who thought the English speaker would be
more helpful.

21
Table 10: Who is more Intelligent by Gender, Age, Area & Region
Which speaker is more Intelligent Gender
χ2(2) =6.78; p =0.034
English Count(%)
Patwa Count(%)
Neither Count(%)
TOTAL
Male 260 (53.9%) 44 (9.1%) 178 (36.9%) n =482 100%
Female 290 (61.7%) 29 (6.2%) 151 (32.1%) n =470 100%
Age Groups χ2(4) =5.01; p =0.286
English Count(%)
Patwa Count(%)
Neither Count(%) TOTAL
18-30yrs 182 (56.7%) 24 (7.5%) 115 (35.8%) n =321 100%
31-50yrs 172 (55.3%) 21 (6.8%) 118 (37.9%) n =311 100%
51-80+yrs 196 (61.3%) 28 (8.8%) 96 (30%) n =320 100%
Area χ2(2) =9.85; p =0.007
English Count(%)
Patwa Count(%)
Neither Count(%) TOTAL
Urban 272 (56.2%) 27 (5.6%) 185 (38.2%) n =484 100%
Rural 278 (59.4%) 46 (9.8%) 144 (30.8%) n =468 100%
Region χ2(4) =15.73; p =0.003
English Count(%)
Patwa Count(%)
Neither Count(%) TOTAL
Western 127 (66.1%) 10 (5.2%) 55 (28.6%) n = 192 100%
Central 121 (62.1%) 20 (10.3%) 54 (27.7%) n = 195 100%
Eastern 302 (53.5%) 43 (7.6%) 220(38.9%) n = 565 100%
A χ2 analysis of intelligence with the demographic variables found significant
relationships for all of the variables, except age.
More Intelligent by Gender
Approximately 62% of female respondents thought that the English speaker would be
more intelligent compared to 54% of males. Males were slightly more likely than females

22
to think that either the Patwa speaker was more intelligent or that neither speaker was
more intelligent. The contingency coefficient showed that this relationship was very weak
(C = 0.084).
More Intelligent by Area
Urban respondents were somewhat more likely than rural respondents to think that
neither the English nor the Patwa speaker was more intelligent (38.2% versus 30.8%). On
the other hand, rural residents were slightly more likely to think that the Patwa speaker
was more intelligent. The contingency coefficient found a weak relationship between
intelligence and area (C = 0.101).
More Intelligent by Region
There was also a significant relationship between region and intelligence. Individuals
from eastern regions were up to 13% less likely than individuals from western and central
regions to think that the English speaker was more intelligent (53.5% compared to 66.1%
and 62.1%). Eastern regions were more likely to think that neither speaker was more
intelligent (38.9% compared to 28.6% and 27.7%). The relationship between region and
intelligence was found to be a fairly weak one (C = 0.128).

23
Table 11: Who is more Honest by Gender, Age, Area & Region
Which speaker is more Honest Gender
χ2(2) =3.14; p =0.208
English Count(%)
Patwa Count(%)
Neither Count(%)
TOTAL
Male 133 (28.5%) 156 (33.5%) 177 (38%) n =466 100%
Female 145 (32.4%) 127 (28.3%) 176 (39.3%) n =488 100%
Age Groups χ2(4) =9.44; p =0.051
English Count(%)
Patwa Count(%)
Neither Count(%) TOTAL
18-30yrs 79 (25.5%) 108 (34.8%) 123 (39.7%) n =310 100%
31-50yrs 93 (30.3%) 87 (28.3%) 127 (41.4%) n =307 100%
51-80+yrs 106 (35.7%) 88 (29.6%) 103 (34.7%) n =297 100%
Area χ2(2) =11.61; p= 0.003
English Count(%)
Patwa Count(%)
Neither Count(%) TOTAL
Urban 124 (27%) 133 (29%) 202 (44%) n =459 100%
Rural 154 (33.8%) 150 (33%) 151 (33.2%) n =455 100%
Region χ2(4) =11.92; p =0.018
English Count(%)
Patwa Count(%)
Neither Count(%) TOTAL
Western 70 (37%) 55 (29.1%) 64 (33.9%) n =189 100%
Central 67 (36.2%) 54 (29.2%) 64 (34.6%) n =185 100%
Eastern 141 (26.1%) 174 (32.2%) 225 (41.7%) n =540 100%
More Honest by Age
No significant relationship was found between honesty and gender or age. With regard to
age however, a sizeable difference was observed between the youngest and oldest age
groups as the 51 year and older group was more than 10% more likely to think that the
English speaker was more honest (35.7%) than the younger age group (25.5%). The

24
youngest age group also had the highest percentage of those who thought that the Patwa
speaker would be more honest.
More Honest by Area
Urban respondents were significantly more likely to think that neither the Patwa nor the
English speaker would be more honest (44%) compared to 33.2% of rural respondents.
Rural participants were marginally more likely to think that one or the other of the two
speakers would be more intelligent. The strength of the relationship between these two
variables was weak (C = 0.128).
More Honest by Region
Individuals from western and central regions were more likely than those from eastern
regions to think that the English speaker would be more honest (37% and 36.2% versus
26.1%). Eastern respondents were the most likely group to think that neither speaker
would be more honest. They were also marginally more likely to think that the Patwa
speaker would be more honest (32.2% compared to 29.1% western parishes and 29.2%
central parishes). The contingency coefficient for this relationship was equal to 0.113.
This indicates that perceptions of honesty are only weakly related to region.

25
Table 12: Who is more Educated by Gender, Age, Area & Region
Which speaker is more Educated Gender
χ2(2) =1.59; p =0.452
English Count(%)
Patwa Count(%)
Neither Count(%)
TOTAL
Male 291 (60.4%) 34 (7.1%) 157 (32.6%) n =482 100%
Female 300 (63%) 25 (5.3%) 151 (31.7%) n =476 100%
Age Groups χ2(4) =22.07; p =0.000
English Count(%)
Patwa Count(%)
Neither Count(%) TOTAL
18-30yrs 179 (55.6%) 17 (5.3%) 126 (39.1%) n =322 100%
31-50yrs 188 (58.8%) 21 (6.6%) 111 (34.7%) n =320 100%
51-80+yrs 224 (70.9%) 21 (6.6%) 71 (22.5%) n =316 100%
Area χ2(2) =6.36; p =0.042
English Count(%)
Patwa Count(%)
Neither Count(%) TOTAL
Urban 298 (60.9%) 22 (4.5%) 169 (34.6%) n =489 100%
Rural 293 (62.5%) 37 (7.9%) 139 (29.6%) n =469 100%
Region χ2(4) =2.31; p =0.679
English Count(%)
Patwa Count(%)
Neither Count(%) TOTAL
Western 129 (65.5%) 12 (6.1%) 56 (28.4%) n =197 100%
Central 121 (62.7%) 10 (5.2%) 62 (32.1%) n =193 100%
Eastern 341 (60%) 37 (6.5%) 190 (33.5%) n =568 100%
χ2 tests found no significant relationship between stereotypes of education and gender or
region. Neither of these variables had any noteworthy impact on the general sample’s
perception that the English speaker would be more educated.

26
More Educated by Age
With regards to age and the speaker who participants felt was more educated, while the
majority of all age groups felt that the English speaker would be more educated, the 51
and older age group was overwhelmingly the most likely group to believe this. Seventy
one per cent of the 51 and older age group indicated that the English speaker would be
more educated. This compares with 55.6% of the 18-30year age group and 58.8% of the
31 – 50 year age group. It is also interesting to note that the youngest age group at 39.1%
were the most likely group to think neither speaker would be more educated when
compared to the other two age groups. The contingency coefficient at 0.15 indicated that
the relationship between perceptions of education and age was somewhat weak.
More Educated by Area
The χ2 test of the relationship between area and which speaker is more educated, also
proved to be significant. This relationship was only a marginal one however, as the
strength of the relationship was found to be very weak (C = 0.081).
Respondents from rural areas were slightly more likely to think that the Patwa speaker
would be more educated (7.9% versus 4.5%). This trend was also observed in terms of
those who thought the English speaker was more educated. Again rural respondents were
slightly ahead of urban respondents (62. 5% compared to 60.9%).

27
Table 13: Who is more Friendly by Gender, Age, Area & Region
Which speaker is more Friendly Gender
χ2(2) =0.45; p =0.80
English Count(%)
Patwa Count(%)
Neither Count(%)
TOTAL
Male 126 (26.1%) 189 (39.2%) 167 (34.6%) n =482 100%
Female 114 (24.3%) 190 (40.4%) 166 (35.3%) n =333 100%
Age Groups χ2(4) =7.95; p =0.093
English Count(%)
Patwa Count(%)
Neither Count(%) TOTAL
18-30yrs 75 (23.3%) 123 (38.2%) 124 (38.5%) n =322 100%
31-50yrs 71 (22.3%) 134 (42.1%) 113 (35.5%) n =318 100%
51-80+yrs 94 (30.1%) 122 (39.1%) 96 (30.8%) n =312 100%
Area χ2(2) =15.87; p =0.000
English Count(%)
Patwa Count(%)
Neither Count(%) TOTAL
Urban 106 (21.9%) 180 (37.2%) 198 (40.9%) n =484 100%
Rural 134 (28.6%) 199 (42.5%) 135 (28.8%) n =468 100%
Region χ2(4) =7.19; p =0.126
English Count(%)
Patwa Count(%)
Neither Count(%) TOTAL
Western 59 (30.4%) 66 (34%) 69 (35.6%) n =194 100%
Central 54 (28.1%) 76 (39.6%) 62 (32.3%) n =192 100%
Eastern 127 (22.4%) 237 (41.9%) 202 (35.7%) n =566 100%
Of the four demographic variables, only area was significantly related to respondents’
perception of which speaker was friendlier.

28
More Friendly by Area
Forty one per cent of urban participants stated that they believed neither speaker would
be friendlier. This was more than 12% higher than rural residents who were of this
opinion. This relationship was found to be weak (C = 0.128).
Table 14: Has more Money by Gender, Age, Area & Region
Which speaker has more Money Gender
χ2(2) =1.75; p=0.417
English Count(%)
Patwa Count(%)
Neither Count(%)
TOTAL
Male 201 (43.7%) 46 (10%) 213 (46.3%) n =460 100%
Female 189 (45.8%) 31 (7.5%) 193 (46.7%) n =413 100%
Age Groups χ2(4) =15.88; p =0.003
English Count(%)
Patwa Count(%)
Neither Count(%) TOTAL
18-30yrs 124 (40.4%) 24 (7.8%) 159 (51.8%) n =307 100%
31-50yrs 116 (40.8%) 25 (8.8%) 143 (50.4%) n =284 100%
51-80+yrs 150 (53.2%) 28 (9.9%) 104 (36.9%) n =282 100%
Area χ2(2) =2.17; p =0.339
English Count(%)
Patwa Count(%)
Neither Count(%) TOTAL
Urban 194 (43.5%) 35 (7.8%) 217 (48.7%) n =446 100%
Rural 196 (45.9%) 42 (9.8%) 189 (44.3%) n =427 100%
Region χ2(4) = 5.21; p =0.266
English Count(%)
Patwa Count(%)
Neither Count(%) TOTAL
Western 89 (49.2%) 14 (7.7%) 78 (43.1%) n =181 100%
Central 86 (49.1%) 16 (9.1%) 73 (41.7%) n =175 100%
Eastern 215 (41.6%) 47 (9.1%) 255 (49.3%) n =517 100%
29
More Money by Age
Only age was significantly related to the speaker respondents thought had more money.
The majority of the 51year and older group felt that the speaker of English would have
more money (53.2%), this compares with 40.4% of the 18-30year group and 40.8% of the
31-50year group. The majority of the two younger age groups believed that neither
speaker would have more money (51.8% and 50.4%). Only 36.9% of respondents from
the oldest age group felt that neither the Patwa nor the English speaker was more likely to
have more money.
The contingency coefficient of 0.134, showed that this was a fairly weak relationship.
30
Table 15: Who is more Helpful by Gender, Age, Area & Region
Which speaker is more Helpful Gender
χ2(2) =3.44; p =0.179
English Count(%)
Patwa Count(%)
Neither Count(%)
TOTAL
Male 140 (29.4%) 165 (34.7%) 171 (35.9%) n =476 100%
Female 152 (32.8%) 135 (29.1%) 177 (38.1%) n =464 100%
Age Groups χ2(4) =12.68; p =0.013
English Count(%)
Patwa Count(%)
Neither Count(%) TOTAL
18-30yrs 84 (26.3%) 96 (30.1%) 139 (43.6%) n =319 100%
31-50yrs 101 (32.5%) 95 (30.5%) 115 (37%) n =311 100%
51-80+yrs 107 (34.5%) 109 (35.2%) 94 (30.3%) n =310 100%
Area χ2(2) =8.31; p =0.016
English Count(%)
Patwa Count(%)
Neither Count(%) TOTAL
Urban 132 (27.4%) 152 (31.6%) 197 (41%) n =481 100%
Rural 160 (34.9%) 148 (32.2%) 151 (32.9%) n =348 100%
Region χ2(4) =6.66; p =0.155
English Count(%)
Patwa Count(%)
Neither Count(%) TOTAL
Western 68 (36%) 57 (30.2%) 64 (33.9%) n =189 100%
Central 67 (35.6%) 56 (29.8%) 65 (34.6%) n = 188 100%
Eastern 157 (27.9%) 187 (33.2%) 219 (38.9%) n = 563 100%
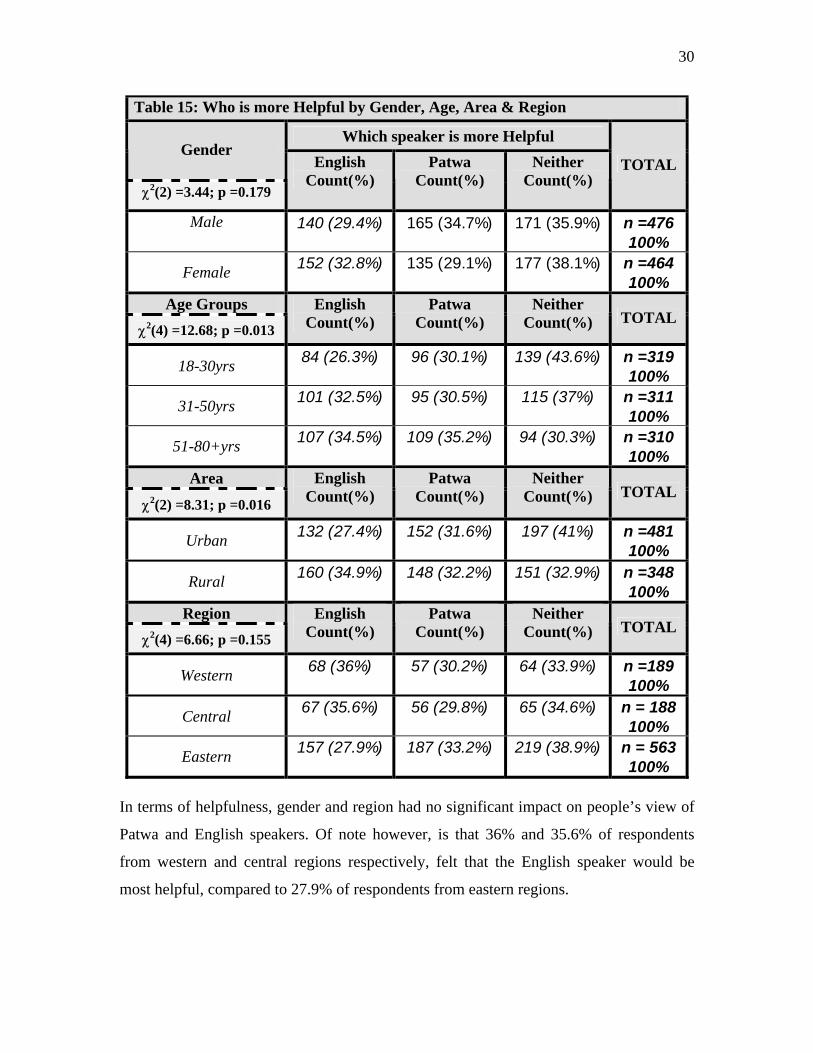
In terms of helpfulness, gender and region had no significant impact on people’s view of
Patwa and English speakers. Of note however, is that 36% and 35.6% of respondents
from western and central regions respectively, felt that the English speaker would be
most helpful, compared to 27.9% of respondents from eastern regions.
31
More Helpful by Age
The crosstabulation of age and helpfulness showed that the youngest age group was most
likely to think that neither of the two speakers would be more helpful. Approximately
44% of the 18-30year age group felt this way compared to 37% of the 31-50year olds and
30.3% of the 51-80year olds. The youngest age group at 26.3% was also the least likely
to think that the English speaker would be more helpful when compared to the 31-50year
olds (32.5%) and the 51year and older group (34.5%). The relationship between age and
perceptions of helpfulness was a weak one (C = 0.115).
More Helpful by Area
There was a significant relationship between helpfulness and area. Forty one per cent of
urban participants indicated that they believed neither of the two speakers would be more
helpful. This was just under 9% higher than the percentage of rural participants that
thought this. Rural individuals were somewhat more likely to state that the English
speaker would be more helpful than those individuals from urban areas (34.9% versus
27.4%). The contingency coefficient of 0.094 showed this to be a very weak relationship.

32
E. Education The fifth subsection of the questionnaire had to do with Jamaican’s impressions of the
use of Patwa in educational institutions.
Table 16: Which school would be better for the Jamaican Child (N=1,000) Frequency (%)
The English Only School 288 (28.9%)
The English and Patwa School 708 (71.1%)
A frequency table of the question “Which school do you think would be better for a
Jamaican child” showed that the overwhelming majority (71.1%) of the sample thought
that a school where children were taught to read and write in English and Patwa would be
better than an English only school.

33
Table 17: Which school would be better by Gender, Age, Area & Region
Type of School Gender
χ2(1) =2.63; p =0.106
English Only Count(%)
English & Patwa Count(%)
TOTAL
Male 133 (26.6%) 367 (73.4%) n =288 100%
Female 155 (31.3%) 341 (68.8%) n =496 100%
Age Groups
χ2(2) =15.76; p =0.000
English Only Count(%)
English & Patwa Count(%) TOTAL
18-30yrs 83 (24.9%) 250 (75.1%) n =333 100%
31-50yrs 83 (24.9%) 250 (75.1%) n = 333 100%
51-80+yrs 122 (37%) 208 (63%) n = 330 100%
Area
χ2(1) =3.80; p =0.051
English Only Count(%)
English & Patwa Count(%) TOTAL
Urban 164 (31.6%) 355 (68.4%) n =519 100%
Rural 124 (26%) 353 (74%) n =477 100%
Region
χ2(2) =1.62; p =0.445
English Only Count(%)
English & Patwa Count(%) TOTAL
Western 63 (31.5%) 137 (68.5%) n =200 100%
Central 51 (25.8%) 147 (74.2%) n =198 100%
Eastern 174 (29.1%) 424 (70.9%) n =598 100%
Of the demographic variables, only age was significantly related to type of school. While
there were no differences between the two younger age groups, the 51 and older group
was far less likely than both of the younger groups to have a favourable view of the
English and Patwa school. While 63% of this group felt this school would be better, this

34
was well below the 75.1% of the other two age groups that held this view. This
relationship turned out to be weak.
35
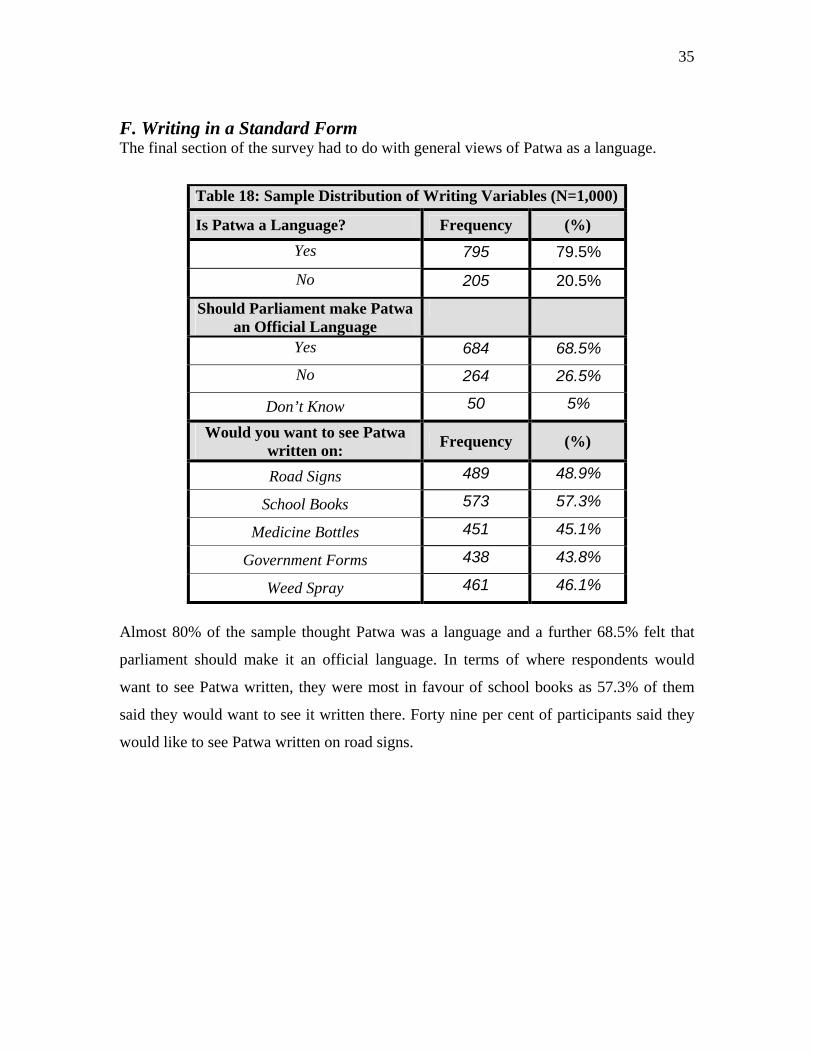
F. Writing in a Standard Form The final section of the survey had to do with general views of Patwa as a language.
Table 18: Sample Distribution of Writing Variables (N=1,000)
Is Patwa a Language? Frequency (%) Yes 795 79.5%
No 205 20.5%
Should Parliament make Patwa an Official Language
Yes 684 68.5% No 264 26.5%
Don’t Know 50 5%
Would you want to see Patwa written on: Frequency (%)
Road Signs 489 48.9%
School Books 573 57.3%
Medicine Bottles 451 45.1%
Government Forms 438 43.8%
Weed Spray 461 46.1%
Almost 80% of the sample thought Patwa was a language and a further 68.5% felt that
parliament should make it an official language. In terms of where respondents would
want to see Patwa written, they were most in favour of school books as 57.3% of them
said they would want to see it written there. Forty nine per cent of participants said they
would like to see Patwa written on road signs.
36
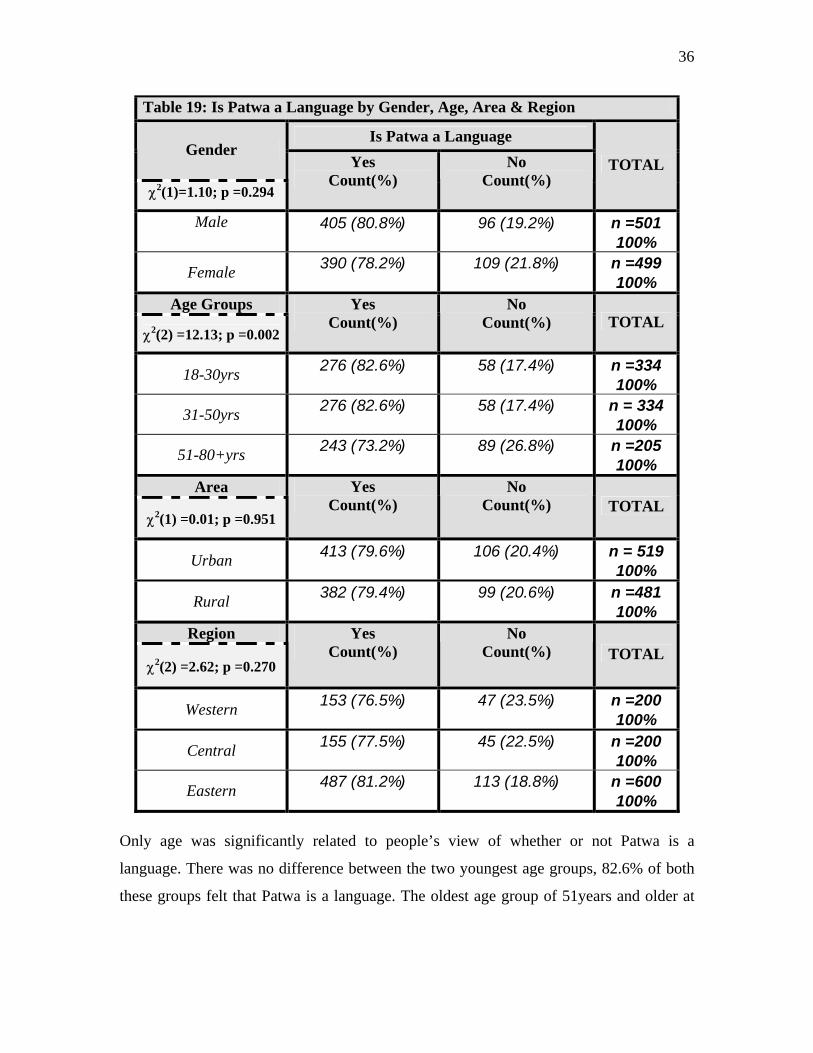
Table 19: Is Patwa a Language by Gender, Age, Area & Region
Is Patwa a Language Gender
χ2(1)=1.10; p =0.294
Yes Count(%)
No Count(%)
TOTAL
Male 405 (80.8%) 96 (19.2%) n =501 100%
Female 390 (78.2%) 109 (21.8%) n =499 100%
Age Groups
χ2(2) =12.13; p =0.002
Yes Count(%)
No Count(%) TOTAL
18-30yrs 276 (82.6%) 58 (17.4%) n =334 100%
31-50yrs 276 (82.6%) 58 (17.4%) n = 334 100%
51-80+yrs 243 (73.2%) 89 (26.8%) n =205 100%
Area
χ2(1) =0.01; p =0.951
Yes Count(%)
No Count(%) TOTAL
Urban 413 (79.6%) 106 (20.4%) n = 519 100%
Rural 382 (79.4%) 99 (20.6%) n =481 100%
Region
χ2(2) =2.62; p =0.270
Yes Count(%)
No Count(%) TOTAL
Western 153 (76.5%) 47 (23.5%) n =200 100%
Central 155 (77.5%) 45 (22.5%) n =200 100%
Eastern 487 (81.2%) 113 (18.8%) n =600 100%
Only age was significantly related to people’s view of whether or not Patwa is a
language. There was no difference between the two youngest age groups, 82.6% of both
these groups felt that Patwa is a language. The oldest age group of 51years and older at

37
only 73.2% was less likely to think Patwa is a language. This relationship was weak (C =
0.109).
Table 20:Should Patwa be an Official Language by Gender, Age, Area & Region
Should Patwa be an Official Language Gender
χ2(2) =6.64; p =0.036
Yes Count(%)
No Count(%)
Don’t Know Count(%)
TOTAL
Male 358 (71.7%) 123 (24.6%) 18 (3.6%) n =499 100%
Female 326 (65.3%) 141 (28.3%) 32 (6.45) n = 499 100%
Age Groups
χ2(4) =4.42; p =0.352
Yes Count(%)
No Count(%)
Don’t Know Count(%) TOTAL
18-30yrs 240 (72.1%) 77 (23.1%) 16 (4.8%) n =333 100%
31-50yrs 229 (68.8%) 89 (26.7%) 15 (4.5%) n =333 100%
51-80+yrs 215 (64.8%) 98 (29.5%) 19 (5.7%) n =50 100%
Area
χ2(2) =6.57; p =0.037
Yes Count(%)
No Count(%)
Don’t Know Count(%) TOTAL
Urban 336 (65%) 154 (29.8%) 27 (5.2%) n =517 100%
Rural 348 (72.3%) 110 (22.9%) 23 (4.8%) n = 481 100%
Region
χ2(4) =2.67; p =0.615
Yes Count(%)
No Count(%)
Don’t Know Count(%) TOTAL
Western 127 (64.1) 60 (30.3%) 11 (5.6%) n =198 100%
Central 143 (71.5%) 48 (24%) 9 (4.5%) n = 200 100%
Eastern 414 (69%) 156 (26%) 30 (5%) n = 600 100%

38
Although both relationships were weak both gender and area were significantly related to
respondent’s opinion on making Patwa an official language. Males were more likely than
females to think Patwa should be an official language (71.7% compared to 65.3%).
Individuals from rural areas were more likely than urban individuals to think that Patwa
should be made an official language (72.3% versus 65%).
39
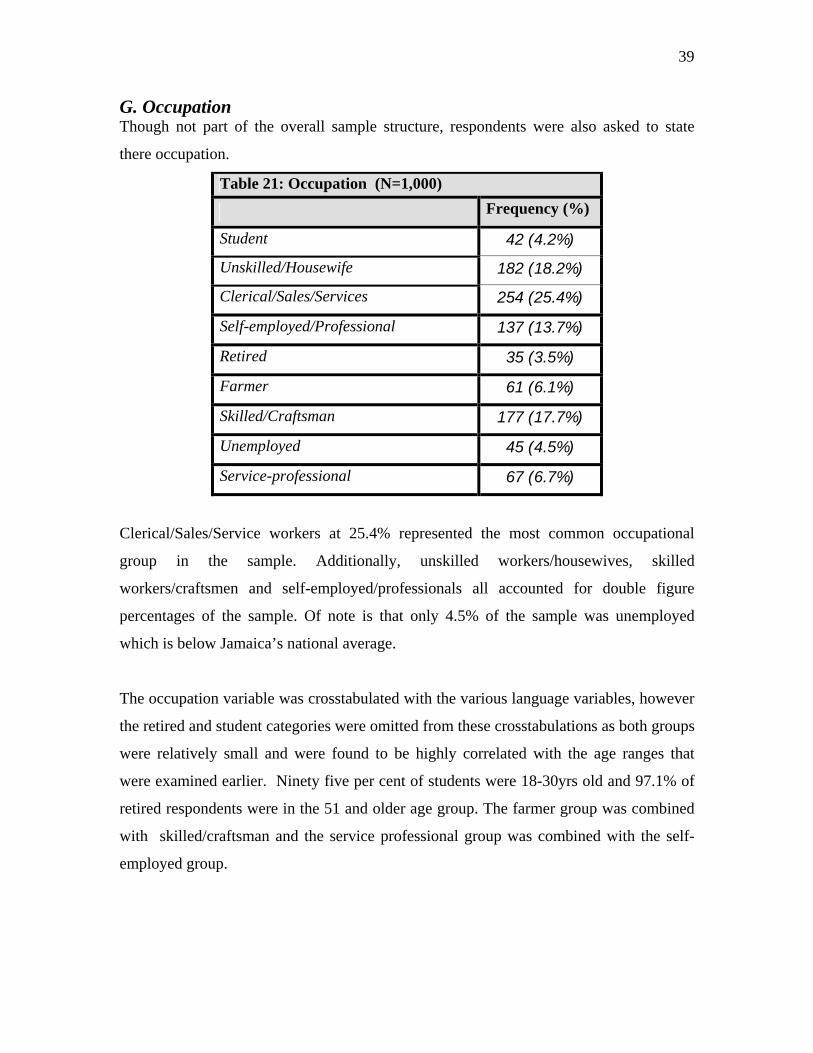
G. Occupation Though not part of the overall sample structure, respondents were also asked to state
there occupation.
Table 21: Occupation (N=1,000)
Frequency (%)
Student 42 (4.2%)
Unskilled/Housewife 182 (18.2%)
Clerical/Sales/Services 254 (25.4%)
Self-employed/Professional 137 (13.7%)
Retired 35 (3.5%)
Farmer 61 (6.1%)
Skilled/Craftsman 177 (17.7%)
Unemployed 45 (4.5%)
Service-professional 67 (6.7%)
Clerical/Sales/Service workers at 25.4% represented the most common occupational
group in the sample. Additionally, unskilled workers/housewives, skilled
workers/craftsmen and self-employed/professionals all accounted for double figure
percentages of the sample. Of note is that only 4.5% of the sample was unemployed
which is below Jamaica’s national average.
The occupation variable was crosstabulated with the various language variables, however
the retired and student categories were omitted from these crosstabulations as both groups
were relatively small and were found to be highly correlated with the age ranges that
were examined earlier. Ninety five per cent of students were 18-30yrs old and 97.1% of
retired respondents were in the 51 and older age group. The farmer group was combined
with skilled/craftsman and the service professional group was combined with the self-
employed group.

40
Occupation by Language Awareness
Table 22: Languages Spoken by Occupation
Languages Spoken Occupation
χ2(8) =40.82; p =0.000
English Count(%)
Patwa Count(%)
Both Count(%)
TOTAL
Unskilled/Housewife 19 (10.5%) 35 (19.3%) 127 (70.2%) n = 181 100%
Clerical/Sales/Services 17 (6.7%) 19 (7.5%) 217 (85.8%) n = 253 100%
Self-Employed/ Professional
29 (14.2%) 8 (3.9%) 167 (81.9%) n = 204 100%
Skilled/Craftsman/ Farmer
29 (12.2%) 36 (15.1%) 173 (72.7%) n = 238 100%
Unemployed 6 (13.3%) 2 (4.4%) 37 (82.2%) n =45 100%
Chi-square analysis found a significant relationship between occupation and the
languages spoken by the sample. Respondents in the unskilled/housewife group were the
most likely of the occupations to speak Patwa only(19.3% versus 7.5%, 3.9%, 15.1%,
4.4%). Unemployed individuals (13.3%) and Self-Employed/Professionals (14.2) were
the groups most likely to speak English only.
The contingency coefficient found this to be a fairly weak/moderate relationship (C =
0.206).
41
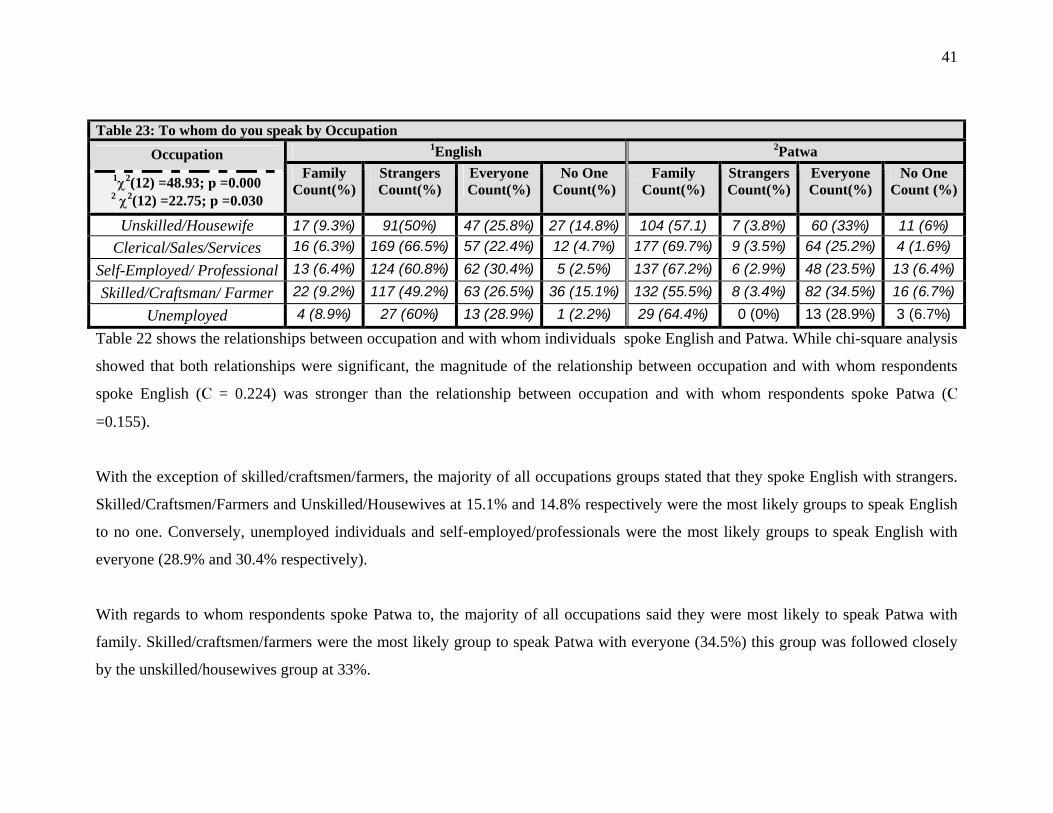
Table 23: To whom do you speak by Occupation 1English 2Patwa Occupation
1χ2(12) =48.93; p =0.000 2 χ2(12) =22.75; p =0.030
Family Count(%)
Strangers Count(%)
Everyone Count(%)
No One Count(%)
Family Count(%)
StrangersCount(%)
Everyone Count(%)
No One Count (%)
Unskilled/Housewife 17 (9.3%) 91(50%) 47 (25.8%) 27 (14.8%) 104 (57.1) 7 (3.8%) 60 (33%) 11 (6%) Clerical/Sales/Services 16 (6.3%) 169 (66.5%) 57 (22.4%) 12 (4.7%) 177 (69.7%) 9 (3.5%) 64 (25.2%) 4 (1.6%)
Self-Employed/ Professional 13 (6.4%) 124 (60.8%) 62 (30.4%) 5 (2.5%) 137 (67.2%) 6 (2.9%) 48 (23.5%) 13 (6.4%) Skilled/Craftsman/ Farmer 22 (9.2%) 117 (49.2%) 63 (26.5%) 36 (15.1%) 132 (55.5%) 8 (3.4%) 82 (34.5%) 16 (6.7%)
Unemployed 4 (8.9%) 27 (60%) 13 (28.9%) 1 (2.2%) 29 (64.4%) 0 (0%) 13 (28.9%) 3 (6.7%) Table 22 shows the relationships between occupation and with whom individuals spoke English and Patwa. While chi-square analysis
showed that both relationships were significant, the magnitude of the relationship between occupation and with whom respondents
spoke English (C = 0.224) was stronger than the relationship between occupation and with whom respondents spoke Patwa (C
=0.155).
With regards to whom respondents spoke Patwa to, the majority of all occupations said they were most likely to speak Patwa with
family. Skilled/craftsmen/farmers were the most likely group to speak Patwa with everyone (34.5%) this group was followed closely
by the unskilled/housewives group at 33%.
With the exception of skilled/craftsmen/farmers, the majority of all occupations groups stated that they spoke English with strangers.
Skilled/Craftsmen/Farmers and Unskilled/Housewives at 15.1% and 14.8% respectively were the most likely groups to speak English
to no one. Conversely, unemployed individuals and self-employed/professionals were the most likely groups to speak English with
everyone (28.9% and 30.4% respectively).
42
Government/Public Use by Occupation
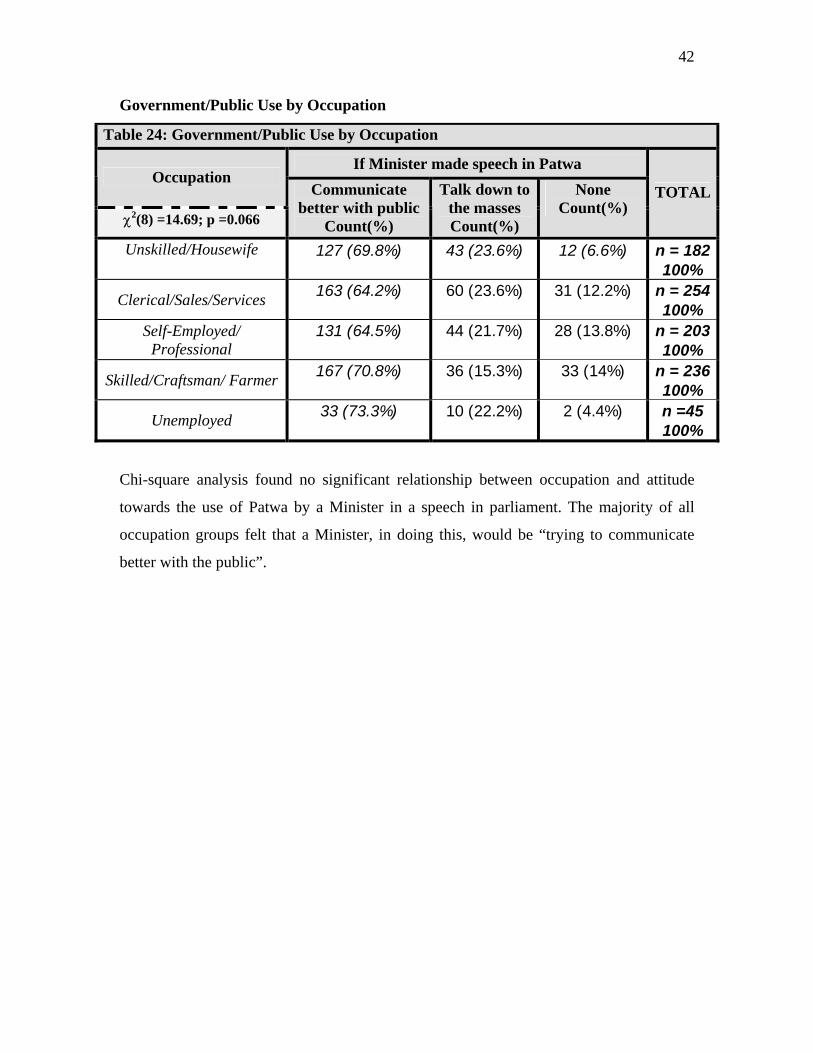
Table 24: Government/Public Use by Occupation
If Minister made speech in Patwa Occupation
χ2(8) =14.69; p =0.066
Communicate better with public
Count(%)
Talk down to the masses Count(%)
None Count(%)
TOTAL
Unskilled/Housewife 127 (69.8%) 43 (23.6%) 12 (6.6%) n = 182 100%
Clerical/Sales/Services 163 (64.2%) 60 (23.6%) 31 (12.2%) n = 254 100%
Self-Employed/ Professional
131 (64.5%) 44 (21.7%) 28 (13.8%) n = 203 100%
Skilled/Craftsman/ Farmer 167 (70.8%) 36 (15.3%) 33 (14%) n = 236 100%
Unemployed 33 (73.3%) 10 (22.2%) 2 (4.4%) n =45 100%
Chi-square analysis found no significant relationship between occupation and attitude
towards the use of Patwa by a Minister in a speech in parliament. The majority of all
occupation groups felt that a Minister, in doing this, would be “trying to communicate
better with the public”.

43
Language Use and Social Stereotypes by Occupation
Table 25: Who is more Intelligent by Occupation
Which speaker is more Intelligent Occupation
χ2(8) =55.86; p =0.000
English Count(%)
Patwa Count(%)
Neither Count(%)
TOTAL
Unskilled/Housewife 123 (68%) 26 (14.4%) 32 (17.7%) n = 181 100%
Clerical/Sales/Services 139 (57.9%) 8 (3.3%) 93 (38.8%) n = 240 100%
Self-Employed/ Professional
91 (49.7%) 8 (4.4%) 84 (45.9%) n = 183 100%
Skilled/Craftsman/ Farmer 125 (53.9%) 21 (9.1%) 86 (37.1%) n = 232 100%
Unemployed 30 (75%) 4 (10%) 6 (15%) n =40 100%
There was a significant relationship between occupation types and the speaker that
respondents felt would be more intelligent. At 75%, unemployed individuals were the
most likely group to think that the English speaker would be more intelligent. Fifteen per
cent of this group felt that neither speaker would be more intelligent which, along with
17.7% of the unskilled/housewives group, represented significantly lower percentages
when compared to the other occupation groups who thought neither speaker was more
intelligent (clerical/sales/services 38.8%, self-employed/professionals 45.9% and
skilled/craftsmen/farmers 37.1%).
The contingency coefficient of 0.245 found this to be a moderate strength relationship.
44
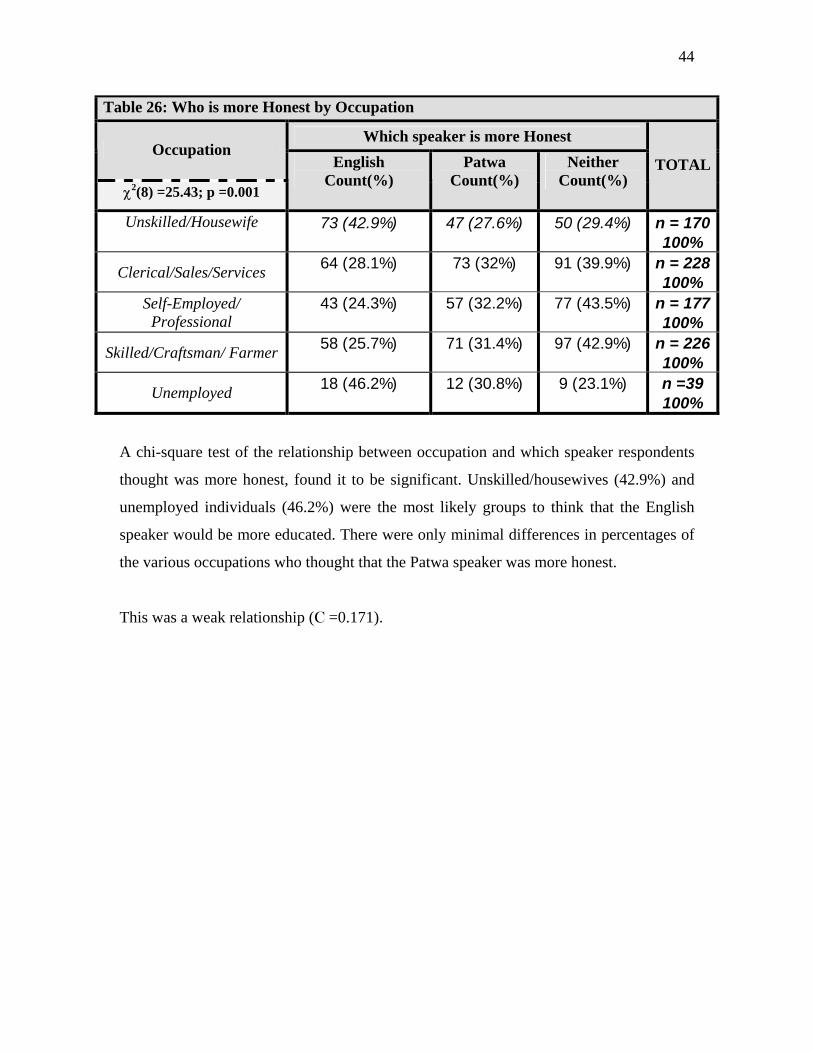
Table 26: Who is more Honest by Occupation
Which speaker is more Honest Occupation
χ2(8) =25.43; p =0.001
English Count(%)
Patwa Count(%)
Neither Count(%)
TOTAL
Unskilled/Housewife 73 (42.9%) 47 (27.6%) 50 (29.4%) n = 170 100%
Clerical/Sales/Services 64 (28.1%) 73 (32%) 91 (39.9%) n = 228 100%
Self-Employed/ Professional
43 (24.3%) 57 (32.2%) 77 (43.5%) n = 177 100%
Skilled/Craftsman/ Farmer 58 (25.7%) 71 (31.4%) 97 (42.9%) n = 226 100%
Unemployed 18 (46.2%) 12 (30.8%) 9 (23.1%) n =39 100%
A chi-square test of the relationship between occupation and which speaker respondents
thought was more honest, found it to be significant. Unskilled/housewives (42.9%) and
unemployed individuals (46.2%) were the most likely groups to think that the English
speaker would be more educated. There were only minimal differences in percentages of
the various occupations who thought that the Patwa speaker was more honest.
This was a weak relationship (C =0.171).

45
Table 27: Who is more Educated by Occupation
Which speaker is more Educated Occupation
χ2(8) =22.34; p =0.004
English Count(%)
Patwa Count(%)
Neither Count(%)
TOTAL
Unskilled/Housewife 120 (67.4%) 19 (10.7%) 39 (21.9%) n = 178 100%
Clerical/Sales/Services 138 (57%) 13 (5.4%) 91 (37.6%) n = 242 100%
Self-Employed/ Professional
112 (58.6%) 7 (3.7%) 72 (37.7%) n = 191 100%
Skilled/Craftsman/ Farmer 143 (61.9%) 14 (6.1%) 74 (32%) n = 231 100%
Unemployed 30 (69.8%) 4 (9.3%) 9 (20.9%) n =43 100%
It was found that occupation was significantly related to whom participants thought
would be more educated. As was the case with stereotypes about intelligence and
honesty, unemployed individuals (69.8%) and unskilled/housewives were the most likely
of the occupation groups to think that the English speaker would be more educated. Also
in keeping with previously identified trends, these two groups were the least likely to
think that neither speaker would be more educated. The relationship between occupation
and stereotypes about education was weak (C = 0.157).
46
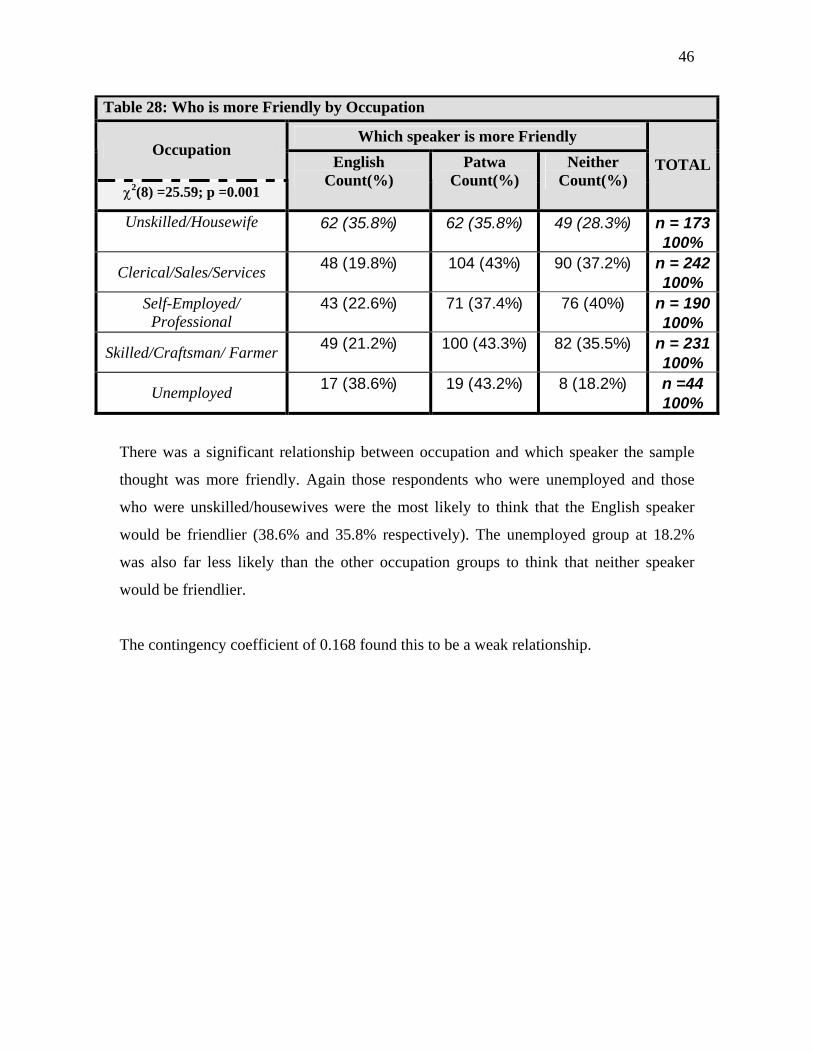
Table 28: Who is more Friendly by Occupation
Which speaker is more Friendly Occupation
χ2(8) =25.59; p =0.001
English Count(%)
Patwa Count(%)
Neither Count(%)
TOTAL
Unskilled/Housewife 62 (35.8%) 62 (35.8%) 49 (28.3%) n = 173 100%
Clerical/Sales/Services 48 (19.8%) 104 (43%) 90 (37.2%) n = 242 100%
Self-Employed/ Professional
43 (22.6%) 71 (37.4%) 76 (40%) n = 190 100%
Skilled/Craftsman/ Farmer 49 (21.2%) 100 (43.3%) 82 (35.5%) n = 231 100%
Unemployed 17 (38.6%) 19 (43.2%) 8 (18.2%) n =44 100%
There was a significant relationship between occupation and which speaker the sample
thought was more friendly. Again those respondents who were unemployed and those
who were unskilled/housewives were the most likely to think that the English speaker
would be friendlier (38.6% and 35.8% respectively). The unemployed group at 18.2%
was also far less likely than the other occupation groups to think that neither speaker
would be friendlier.
The contingency coefficient of 0.168 found this to be a weak relationship.
47
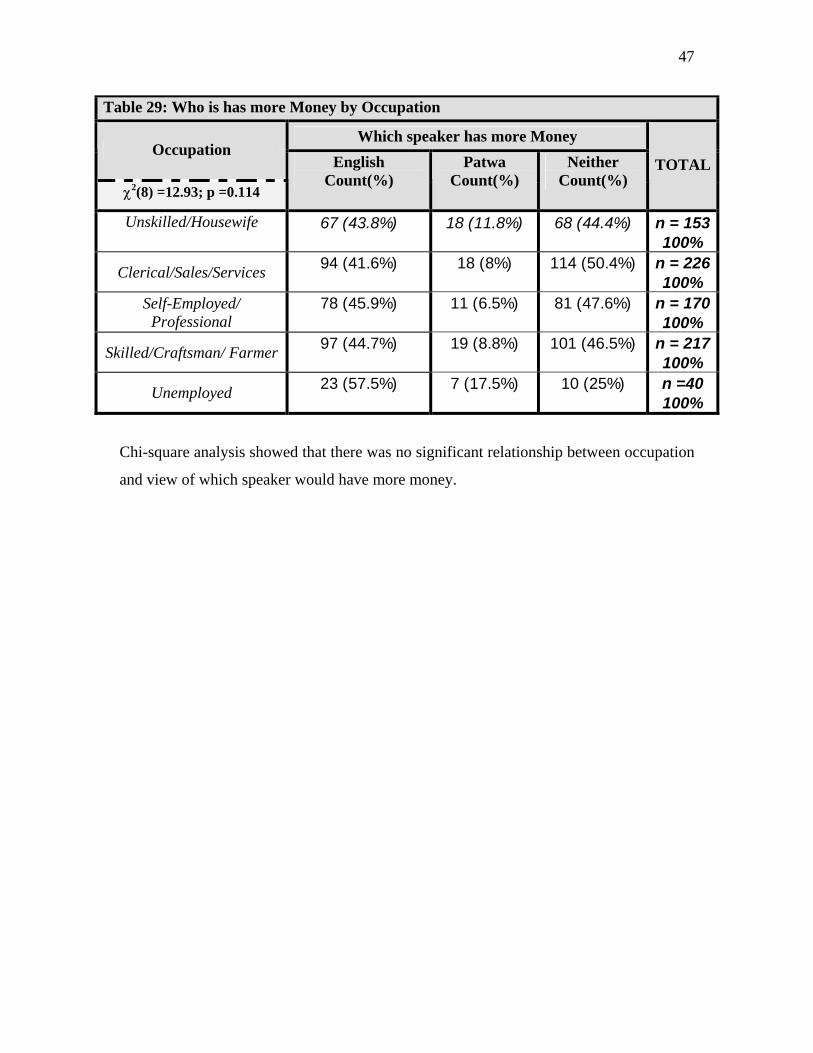
Table 29: Who is has more Money by Occupation
Which speaker has more Money Occupation
χ2(8) =12.93; p =0.114
English Count(%)
Patwa Count(%)
Neither Count(%)
TOTAL
Unskilled/Housewife 67 (43.8%) 18 (11.8%) 68 (44.4%) n = 153 100%
Clerical/Sales/Services 94 (41.6%) 18 (8%) 114 (50.4%) n = 226 100%
Self-Employed/ Professional
78 (45.9%) 11 (6.5%) 81 (47.6%) n = 170 100%
Skilled/Craftsman/ Farmer 97 (44.7%) 19 (8.8%) 101 (46.5%) n = 217 100%
Unemployed 23 (57.5%) 7 (17.5%) 10 (25%) n =40 100%
Chi-square analysis showed that there was no significant relationship between occupation
and view of which speaker would have more money.
48
Table 30: Who is more Helpful by Occupation
Which speaker has more Helpful Occupation
χ2(8) =28.72; p =0.000
English Count(%)
Patwa Count(%)
Neither Count(%)
TOTAL
Unskilled/Housewife 71 (40.6%) 64 (36.6%) 40 (22.9%) n = 175 100%
Clerical/Sales/Services 66 (27.6%) 73 (30.5%) 100 (41.8%) n = 239 100%
Self-Employed/ Professional
42 (22.8%) 58 (31.5%) 84 (45.7%) n = 184 100%
Skilled/Craftsman/ Farmer 78 (34.1%) 68 (29.7%) 83 (36.2%) n = 229 100%
Unemployed 15 (37.5%) 14 (35%) 11 (27.5%) n =40 100%
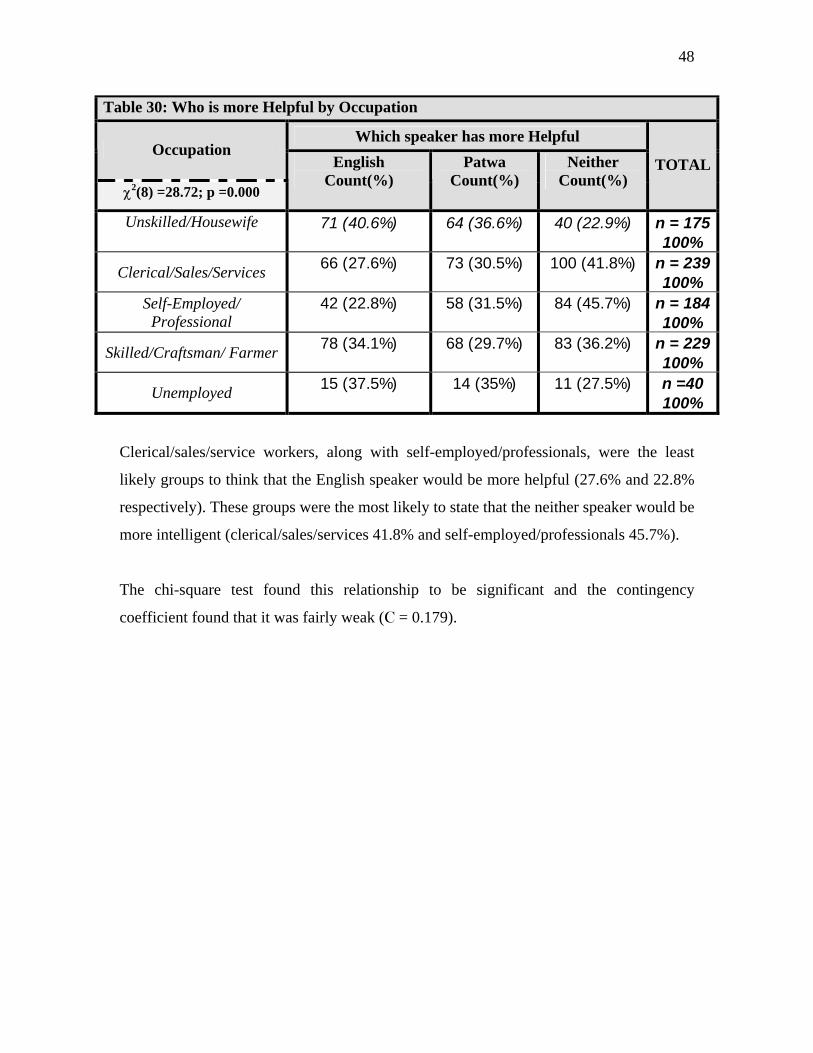
Clerical/sales/service workers, along with self-employed/professionals, were the least
likely groups to think that the English speaker would be more helpful (27.6% and 22.8%
respectively). These groups were the most likely to state that the neither speaker would be
more intelligent (clerical/sales/services 41.8% and self-employed/professionals 45.7%).
The chi-square test found this relationship to be significant and the contingency
coefficient found that it was fairly weak (C = 0.179).

49
Education by Occupation
Table 31: Which school would be better by Occupation
Type of School Occupation
χ2(4) =12.49; p =0.014
English Only Count(%)
English & Patwa Count(%)
TOTAL
Unskilled/Housewife 58 (32.2%) 122 (67.8%) n = 180 100%
Clerical/Sales/Services 59 (23.2%) 195 (76.8%) n = 254 100%
Self-Employed/ Professional 72 (35.3%) 132(64.7%) n = 204 100%
Skilled/Craftsman/ Farmer 58 (24.5%) 179 (75.5%) n = 237 100%
Unemployed 16 (36.4%) 28 (63.6%) n =44 100%
A crosstabulation was also generated for the relationship between occupation and the
type of school that respondents thought would be better for Jamaican children.
Clerical/sales/service workers (76.8%) and skilled/craftsmen/farmers (75.5%) were the
most likely groups to think that the English and Patwa school would be better for
Jamaican children.
This relationship, while statistically significant was found to be weak (C =0.166).

50
Writing in a Standard Form by Occupation
Table 32: Is Patwa a Language by Occupation
Is Patwa a Language Occupation
χ2(4) =7.381; p =0.117
Yes Count(%)
No Count(%)
TOTAL
Unskilled/Housewife 141 (77.5%) 41 (22.5%) n = 182 100%
Clerical/Sales/Services 202 (79.5%) 52 (20.5%) n = 254 100%
Self-Employed/ Professional 168 (82.4%) 36 (17.6%) n = 204 100%
Skilled/Craftsman/ Farmer 200 (84%) 38 (16%) n = 238 100%
Unemployed 31 (68.9%) 14 (31.1%) n =45 100%
There was no significant relationship between occupation and view of Patwa as a
language. The majority of the sample, irrespective of occupational category, felt that
Patwa was a language. It must be noted that unemployed persons at 31.1% were the most
likely group to disagree that Patwa was a language.
51
Table 33: Should Patwa be an Official Language by Occupation
Should Patwa be an Official Language Occupation
χ2(8) =8.62; p =0.376
Yes Count(%)
No Count(%)
Don’t Know Count(%)
TOTAL
Unskilled/Housewife 127 (69.8%) 45 (24.7%) 10 (5.5%) n = 182 100%
Clerical/Sales/Services 173 (68.4%) 69 (27.3%) 11 (4.3%) n = 253 100%
Self-Employed/ Professional
131 (64.2%) 59 (28.9%) 14 (6.9%) n = 204 100%
Skilled/Craftsman/ Farmer 178 (74.8%) 54 (22.7%) 6 (2.5%) n = 238 100%
Unemployed 32 (71.1%) 11 (24.4%) 2 (4.4%) n =45 100%
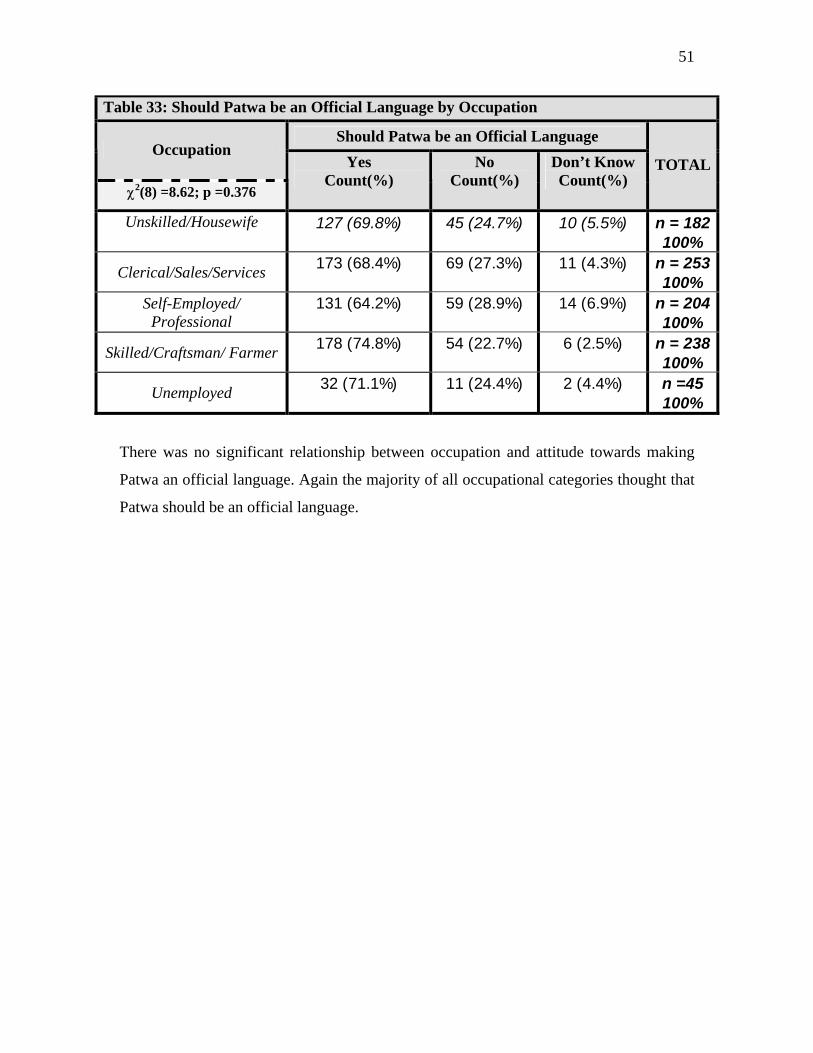
There was no significant relationship between occupation and attitude towards making
Patwa an official language. Again the majority of all occupational categories thought that
Patwa should be an official language.

LANGUAGE ATTITUDE SURVEY OF JAMAICA DEMOGRAPHICS
1. Parish of Residence: How Long:
2. Parish of Birth:
3. Age Range: 18 – 30 years [ ] 31 – 50 years [ ] 51 – 80+ years [ ]
4. Sex: Male [ ] Female [ ]
5. Occupation:
LANGUAGE AWARENESS
6. What languages do you speak? a) English [ ] b) Patwa [ ] c) Any Other [ ]
LANGUAGE USE & CONTEXT
7. To whom do you speak
a) Patwa
b) English
GOVERNMENT /PUBLIC USE
8. If the Prime Minister or the Minister of Finance made his speech in Gordon house in Patwa would
you think he is trying to:
a) communicate better with the public? b) talk down to the masses? c) Other
IF 1c) PLEASE EXPLAIN:
LANGUAGE USE AND SOCIAL STEREOTYPES
9. When you hear a person speaking Patwa and another speaking English, which person do you think:
Patwa English
a) Is more intelligent
b) Is more honest
c) Is more educated
d) Is more friendly
e) Has more money
f) Is more helpful
EDUCATION
10. There are two types of schools in Jamaica. In one they teach the children to read and write only in
English. In the other type of school they teach the children to read and write in English and Patwa.
Which school do you think would be better for a Jamaican child?
a) The English Only School [ ] b) The English & Patwa School [ ]
WRITING IN A STANDARD FORM
11. If there was one proper way to write Patwa would you want to see it written on
(You may choose as many as you like) :
a) road signs b) school books c) medicine bottles d) government forms e) weed spray
12. A language is a form of speech, which can be used to communicate anything people want it to. Do
you think that Patwa is a language?
Yes [ ] No [ ] Other: [ ] Please Explain
13. Should Parliament make Patwa an official language of Jamaica alongside English?
YES [ ] NO [ ] DON”T KNOW [ ]
14. FOR OFFICE USE ONLY : Region – Western [ ] Central [ ] Eastern [ ]

WE JAMIEKAN TINK BOUT LANGGWIJ WE PIIPL LIV
1. We yu liv: Ou lang:
2. We yu baan:
3. Ou uol yu bi: 18 – 30 ierz [ ] 31 – 50 ierz [ ] 51 – 80+ ierz [ ]
4. Man/Uman: Man [ ] Uman [ ]
5. Wa kain a work yu du:
WE PIIPL NUO BOUT LANGGWIJ
6. We kain a langgwij yu taak? a) Ingglish [ ] b) Patwa [ ] c) Sopm els [ ]
OU AN WEN PIIPL YUUZ LANGGWIJ
7. Uu yu taak tu ina
a) Patwa
b) Ingglish
GOVAMENT / POBLIK TAAK
8. Ef di Prime Minister ar di Minister of Finance mek im spiich op a Gordon House ina Patwa wa mek im
du dat :
a) fi mek di public andastan im beta? b) fi taak dong tu di piipl dem? c) sopm els / wat els
IF 8c) Tel wi bout dat:
OU YU LUK PAN PIIPL FI OU DEM TAAK
9. Wen yu ier smadi a taak Patwa an smadi els a taak Ingglish, wich wan yu tink:
Patwa Ingglish
a) av muor brienz
b) muor anis
c) muor edikietid
d) yu kyan taak tu muo
e) av muor moni
f) muor elp yu if yu ina chrobl
EDIKIESHAN
10. Dem av tuu kain a skuul ina Jamieka. Ina wan kain a skuul, di pikni dem lorn fi riid an rait onggl ina
Ingglish. Ina di neks kain a skuul, di pikni dem lorn fi riid an rait ina Ingglish an ina Patwa. Wich kain a
skuul yu tink wuda beta fi wan Jamiekan pikni?
a) Di skuul wid onggl Ingglish [ ] b) Di skuul wid Ingglish an Patwa [ ]
OU FI RAIT PATWA / JAMIEKAN
11. Ef dem did av wan gud wie fi rait Patwa. Yu wuda laik si Patwa rait pan wa?
(Chuuz eni amount a dem) :
a) ruod sain b) skuul buk c) pil bakl d) govament faam e) faam sprie
12. Wan langgwij a sopm we yu kyan yuuz fi se eni ting yu waan se tu piipl. Yu tink se Patwa a wan
langgwij?
Yes [ ] Nuo [ ] Tel wi bout dat
13. Yu tink se Govament shud a mek Patwa wan ofishal langgwig jos laik Ingglish?
YES [ ] NUO [ ] MI NO NUO [ ]
14. FOR OFFICE USE ONLY: Region – Western [ ] Central [ ] Eastern [ ]

Appendix Frequency Tables of Demographic variables in Jamaica Language Attitude Survey
urbanru parish
519 51.9 51.9 51.9481 48.1 48.1 100.0
1000 100.0 100.0
1 urban2 ruralTotal
ValidFrequency Percent Valid Percent
CumulativePercent
region Region
200 20.0 20.0 20.0200 20.0 20.0 40.0600 60.0 60.0 100.0
1000 100.0 100.0
1 Western2 Central3 EasternTotal
ValidFrequency Percent Valid Percent
CumulativePercent
age Age Range
334 33.4 33.4 33.4334 33.4 33.4 66.8332 33.2 33.2 100.0
1000 100.0 100.0
1 18-302 31-503 51-80+ yearsTotal
ValidFrequency Percent Valid Percent
CumulativePercent
sex Gender
501 50.1 50.1 50.1499 49.9 49.9 100.0
1000 100.0 100.0
1 Male2 FemaleTotal
ValidFrequency Percent Valid Percent
CumulativePercent

q5 Occupation
42 4.2 4.2 4.2182 18.2 18.2 22.4254 25.4 25.4 47.8
137 13.7 13.7 61.5
35 3.5 3.5 65.061 6.1 6.1 71.1
177 17.7 17.7 88.845 4.5 4.5 93.367 6.7 6.7 100.0
1000 100.0 100.0
1 Student2 Unskilled/Housewife3 Clerical/Sales/Services4 Self-employed/Professional5 Retired6 Farmer7 Skilled/Craftsman8 Unemployed9 service-professionalTotal
ValidFrequency Percent Valid Percent
CumulativePercent
Frequency Tables of Language Variables
q6a What languages do you speak? (English)
893 89.3 89.3 89.3107 10.7 10.7 100.0
1000 100.0 100.0
1 Yes2 NoTotal
ValidFrequency Percent Valid Percent
CumulativePercent
q6b What languages do you speak? (Patwa)
889 88.9 88.9 88.9111 11.1 11.1 100.0
1000 100.0 100.0
1 Yes2 NoTotal
ValidFrequency Percent Valid Percent
CumulativePercent
language What languages do you speak
109 10.9 10.9 10.9105 10.5 10.5 21.4784 78.4 78.6 100.0998 99.8 100.0
2 .21000 100.0
1.00 English only2.00 Patwa only3.00 BothTotal
Valid
.00MissingTotal
Frequency Percent Valid PercentCumulative
Percent

q7a To whom do you speak? (Patwa)
629 62.9 62.9 62.932 3.2 3.2 66.1
285 28.5 28.5 94.654 5.4 5.4 100.0
1000 100.0 100.0
1 Family & Friends2 Strangers & Work3 everyone4 no oneTotal
ValidFrequency Percent Valid Percent
CumulativePercent
q7b To whom do you speak? (English)
79 7.9 7.9 7.9571 57.1 57.1 65.0262 26.2 26.2 91.2
88 8.8 8.8 100.01000 100.0 100.0
1 Family & Friends2 Strangers & Work3 everyone4 no oneTotal
ValidFrequency Percent Valid Percent
CumulativePercent
q8 If Minister made a speech in Patwa would you think he is:
676 67.6 67.8 67.8
205 20.5 20.6 88.4
116 11.6 11.6 100.0997 99.7 100.0
2 .21 .13 .3
1000 100.0
1 Communicatebetter with the public2 Talk down to themasses9 noneTotal
Valid
34Total
Missing
Total
Frequency Percent Valid PercentCumulative
Percent
rq9a Is more intelligent
73 7.3 7.7 7.7550 55.0 57.8 65.4329 32.9 34.6 100.0952 95.2 100.0
48 4.81000 100.0
1.00 Patwa2.00 English3.00 BothTotal
Valid
SystemMissingTotal
Frequency Percent Valid PercentCumulative
Percent

rq9b Is more honest
283 28.3 31.0 31.0278 27.8 30.4 61.4353 35.3 38.6 100.0914 91.4 100.0
86 8.61000 100.0
1.00 Patwa2.00 English3.00 BothTotal
Valid
SystemMissingTotal
Frequency Percent Valid PercentCumulative
Percent
rq9c Is more educated
59 5.9 6.2 6.2591 59.1 61.7 67.8308 30.8 32.2 100.0958 95.8 100.0
42 4.21000 100.0
1.00 Patwa2.00 English3.00 BothTotal
Valid
SystemMissingTotal
Frequency Percent Valid PercentCumulative
Percent
rq9d Is more friendly
379 37.9 39.8 39.8240 24.0 25.2 65.0333 33.3 35.0 100.0952 95.2 100.0
48 4.81000 100.0
1.00 Patwa2.00 English3.00 BothTotal
Valid
SystemMissingTotal
Frequency Percent Valid PercentCumulative
Percent
rq9e Has more money
77 7.7 8.8 8.8390 39.0 44.7 53.5406 40.6 46.5 100.0873 87.3 100.0127 12.7
1000 100.0
1.00 Patwa2.00 English3.00 BothTotal
Valid
SystemMissingTotal
Frequency Percent Valid PercentCumulative
Percent

rq9f Is more helpful
300 30.0 31.9 31.9292 29.2 31.1 63.0348 34.8 37.0 100.0940 94.0 100.0
60 6.01000 100.0
1.00 Patwa2.00 English3.00 BothTotal
Valid
SystemMissingTotal
Frequency Percent Valid PercentCumulative
Percent
q10 Which school is better?
288 28.8 28.9 28.9
708 70.8 71.1 100.0
996 99.6 100.01 .11 .12 .24 .4
1000 100.0
1 English school only2 English & PatwaSchoolTotal
Valid
59SystemTotal
Missing
Total
Frequency Percent Valid PercentCumulative
Percent
q11a Road Signs
489 48.9 48.9 48.9511 51.1 51.1 100.0
1000 100.0 100.0
1 Yes2 NoTotal
ValidFrequency Percent Valid Percent
CumulativePercent
q11b School Books
573 57.3 57.3 57.3427 42.7 42.7 100.0
1000 100.0 100.0
1 Yes2 NoTotal
ValidFrequency Percent Valid Percent
CumulativePercent
q11c Medicine Bottles
451 45.1 45.1 45.1549 54.9 54.9 100.0
1000 100.0 100.0
1 Yes2 NoTotal
ValidFrequency Percent Valid Percent
CumulativePercent

q11d Government forms
438 43.8 43.8 43.8561 56.1 56.2 100.0999 99.9 100.0
1 .11000 100.0
1 Yes2 NoTotal
Valid
SystemMissingTotal
Frequency Percent Valid PercentCumulative
Percent
q11e Weed Spray
461 46.1 46.2 46.2536 53.6 53.8 100.0997 99.7 100.0
3 .31000 100.0
1 Yes2 NoTotal
Valid
SystemMissingTotal
Frequency Percent Valid PercentCumulative
Percent
q12 Is Patwa a Language
795 79.5 79.5 79.5205 20.5 20.5 100.0
1000 100.0 100.0
1 Yes2 NoTotal
ValidFrequency Percent Valid Percent
CumulativePercent
q13 Should Patwa be an official language?
684 68.4 68.5 68.5264 26.4 26.5 95.0
50 5.0 5.0 100.0998 99.8 100.0
2 .21000 100.0
1 Yes2 No3 Don't KnowTotal
Valid
SystemMissingTotal
Frequency Percent Valid PercentCumulative
Percent

Sample Structure sex Gender * age Age Range * urbanru parish * region Region Crosstabulation
17 17 17 5150.0% 50.0% 51.5% 50.5%
17 17 16 5050.0% 50.0% 48.5% 49.5%
34 34 33 101100.0% 100.0% 100.0% 100.0%
17 17 16 5051.5% 51.5% 48.5% 50.5%
16 16 17 4948.5% 48.5% 51.5% 49.5%
33 33 33 99100.0% 100.0% 100.0% 100.0%
17 17 16 5050.0% 51.5% 37.2% 45.5%
17 16 27 6050.0% 48.5% 62.8% 54.5%
34 33 43 110100.0% 100.0% 100.0% 100.0%
17 16 17 5051.5% 47.1% 73.9% 55.6%
16 18 6 4048.5% 52.9% 26.1% 44.4%
33 34 23 90100.0% 100.0% 100.0% 100.0%
50 50 58 15850.0% 50.0% 53.7% 51.3%
50 50 50 15050.0% 50.0% 46.3% 48.7%
100 100 108 308100.0% 100.0% 100.0% 100.0%
50 50 42 14250.0% 50.0% 45.7% 48.6%
50 50 50 15050.0% 50.0% 54.3% 51.4%
100 100 92 292100.0% 100.0% 100.0% 100.0%
Count% within age Age RangeCount% within age Age RangeCount% within age Age RangeCount% within age Age RangeCount% within age Age RangeCount% within age Age RangeCount% within age Age RangeCount% within age Age RangeCount% within age Age RangeCount% within age Age RangeCount% within age Age RangeCount% within age Age RangeCount% within age Age RangeCount% within age Age RangeCount% within age Age RangeCount% within age Age RangeCount% within age Age RangeCount% within age Age Range
1 Male
2 Female
sex Gender
Total
1 Male
2 Female
sex Gender
Total
1 Male
2 Female
sex Gender
Total
1 Male
2 Female
sex Gender
Total
1 Male
2 Female
sex Gender
Total
1 Male
2 Female
sex Gender
Total
urbanru parish1 urban
2 rural
1 urban
2 rural
1 urban
2 rural
region Region1 Western
2 Central
3 Eastern
1 18-30 2 31-503 51-80+
years
age Age Range
Total

Demographic Variables with Languages spoken What languages do you speak * Gender
Crosstab
59 50 109
54.1% 45.9% 100.0%
11.8% 10.0% 10.9%68 37 105
64.8% 35.2% 100.0%
13.6% 7.4% 10.5%372 412 784
47.4% 52.6% 100.0%
74.5% 82.6% 78.6%499 499 998
50.0% 50.0% 100.0%
100.0% 100.0% 100.0%
Count% within language Whatlanguages do you speak% within sex GenderCount% within language Whatlanguages do you speak% within sex GenderCount% within language Whatlanguages do you speak% within sex GenderCount% within language Whatlanguages do you speak% within sex Gender
1.00 English only
2.00 Patwa only
3.00 Both
language Whatlanguages doyou speak
Total
1 Male 2 Femalesex Gender
Total
Chi-Square Tests
11.936a 2 .00312.076 2 .002
5.496 1 .019
998
Pearson Chi-SquareLikelihood RatioLinear-by-LinearAssociationN of Valid Cases
Value dfAsymp. Sig.
(2-sided)
0 cells (.0%) have expected count less than 5. Theminimum expected count is 52.50.
a.
Symmetric Measures
.109 .003
.109 .003
.109 .003998
PhiCramer's VContingency Coefficient
Nominal byNominal
N of Valid Cases
Value Approx. Sig.
Not assuming the null hypothesis.a.
Using the asymptotic standard error assuming the nullhypothesis.
b.

What languages do you speak * Age Range Crosstab
26 34 49 109
23.9% 31.2% 45.0% 100.0%
7.8% 10.2% 14.8% 10.9%22 39 44 105
21.0% 37.1% 41.9% 100.0%
6.6% 11.7% 13.3% 10.5%285 261 238 784
36.4% 33.3% 30.4% 100.0%
85.6% 78.1% 71.9% 78.6%333 334 331 998
33.4% 33.5% 33.2% 100.0%
100.0% 100.0% 100.0% 100.0%
Count% within language Whatlanguages do you speak% within age Age RangeCount% within language Whatlanguages do you speak% within age Age RangeCount% within language Whatlanguages do you speak% within age Age RangeCount% within language Whatlanguages do you speak% within age Age Range
1.00 English only
2.00 Patwa only
3.00 Both
language Whatlanguages doyou speak
Total
1 18-30 2 31-503 51-80+
years
age Age Range
Total
Chi-Square Tests
19.350a 4 .00119.761 4 .001
16.212 1 .000
998
Pearson Chi-SquareLikelihood RatioLinear-by-LinearAssociationN of Valid Cases
Value dfAsymp. Sig.
(2-sided)
0 cells (.0%) have expected count less than 5. Theminimum expected count is 34.82.
a.
Symmetric Measures
.139 .001
.098 .001
.138 .001998
PhiCramer's VContingency Coefficient
Nominal byNominal
N of Valid Cases
Value Approx. Sig.
Not assuming the null hypothesis.a.
Using the asymptotic standard error assuming the nullhypothesis.
b.

What languages do you speak * parish Crosstab
69 40 109
63.3% 36.7% 100.0%
13.3% 8.3% 10.9%52 53 105
49.5% 50.5% 100.0%
10.1% 11.0% 10.5%396 388 784
50.5% 49.5% 100.0%
76.6% 80.7% 78.6%517 481 998
51.8% 48.2% 100.0%
100.0% 100.0% 100.0%
Count% within language Whatlanguages do you speak% within urbanru parishCount% within language Whatlanguages do you speak% within urbanru parishCount% within language Whatlanguages do you speak% within urbanru parishCount% within language Whatlanguages do you speak% within urbanru parish
1.00 English only
2.00 Patwa only
3.00 Both
language Whatlanguages doyou speak
Total
1 urban 2 ruralurbanru parish
Total
Chi-Square Tests
6.517a 2 .0386.602 2 .037
4.713 1 .030
998
Pearson Chi-SquareLikelihood RatioLinear-by-LinearAssociationN of Valid Cases
Value dfAsymp. Sig.
(2-sided)
0 cells (.0%) have expected count less than 5. Theminimum expected count is 50.61.
a.
Symmetric Measures
.081 .038
.081 .038
.081 .038998
PhiCramer's VContingency Coefficient
Nominal byNominal
N of Valid Cases
Value Approx. Sig.
Not assuming the null hypothesis.a.
Using the asymptotic standard error assuming the nullhypothesis.
b.

What languages do you speak * Region Crosstab
13 18 78 109
11.9% 16.5% 71.6% 100.0%
6.5% 9.0% 13.0% 10.9%22 31 52 105
21.0% 29.5% 49.5% 100.0%
11.1% 15.5% 8.7% 10.5%164 151 469 784
20.9% 19.3% 59.8% 100.0%
82.4% 75.5% 78.3% 78.6%199 200 599 998
19.9% 20.0% 60.0% 100.0%
100.0% 100.0% 100.0% 100.0%
Count% within language Whalanguages do you speak% within region RegionCount% within language Whalanguages do you speak% within region RegionCount% within language Whalanguages do you speak% within region RegionCount% within language Whalanguages do you speak% within region Region
1.00 English only
2.00 Patwa only
3.00 Both
language Whatlanguages doyou speak
Total
1 Western 2 Central 3 Easternregion Region
Total
Chi-Square Tests
13.918a 4 .00813.930 4 .008
3.341 1 .068
998
Pearson Chi-SquareLikelihood RatioLinear-by-LinearAssociationN of Valid Cases
Value dfAsymp. Sig.
(2-sided)
0 cells (.0%) have expected count less than 5. Theminimum expected count is 20.94.
a.
Symmetric Measures
.118 .008
.084 .008
.117 .008998
PhiCramer's VContingency Coefficient
Nominal byNominal
N of Valid Cases
Value Approx. Sig.
Not assuming the null hypothesis.a.
Using the asymptotic standard error assuming the nullhypothesis.
b.
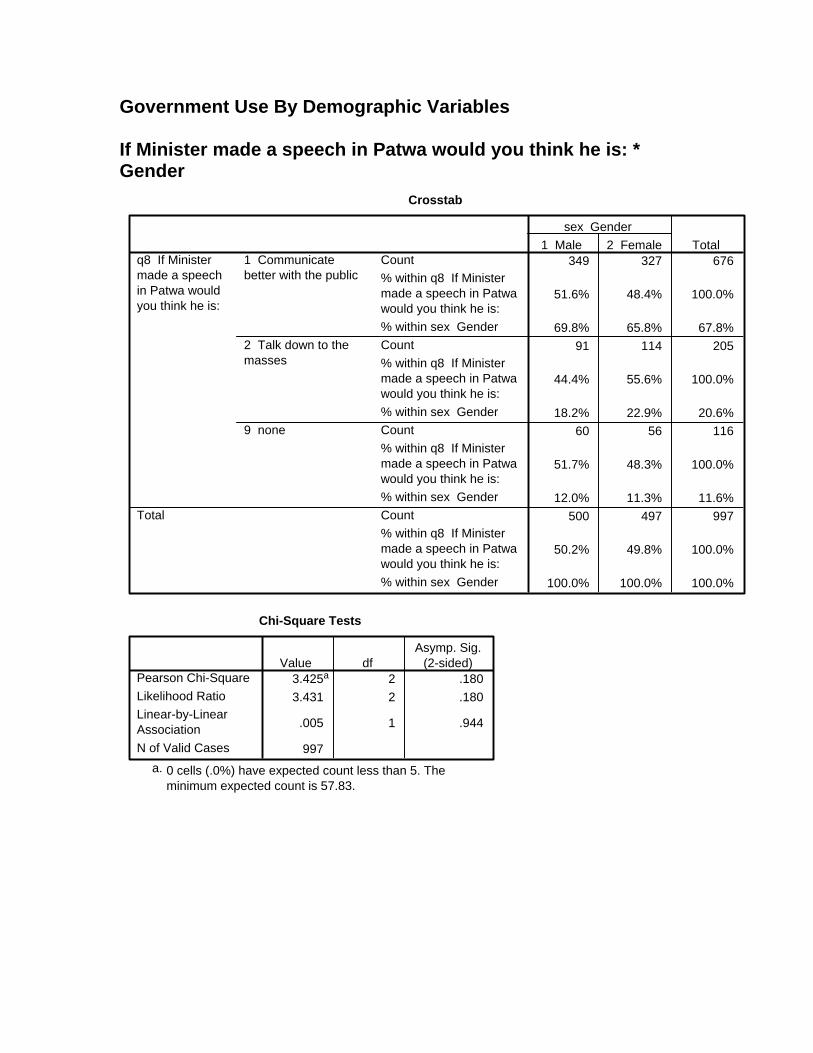
Government Use By Demographic Variables If Minister made a speech in Patwa would you think he is: * Gender
Crosstab
349 327 676
51.6% 48.4% 100.0%
69.8% 65.8% 67.8%91 114 205
44.4% 55.6% 100.0%
18.2% 22.9% 20.6%60 56 116
51.7% 48.3% 100.0%
12.0% 11.3% 11.6%500 497 997
50.2% 49.8% 100.0%
100.0% 100.0% 100.0%
Count% within q8 If Ministermade a speech in Patwawould you think he is:% within sex GenderCount% within q8 If Ministermade a speech in Patwawould you think he is:% within sex GenderCount% within q8 If Ministermade a speech in Patwawould you think he is:% within sex GenderCount% within q8 If Ministermade a speech in Patwawould you think he is:% within sex Gender
1 Communicatebetter with the public
2 Talk down to themasses
9 none
q8 If Ministermade a speechin Patwa wouldyou think he is:
Total
1 Male 2 Femalesex Gender
Total
Chi-Square Tests
3.425a 2 .1803.431 2 .180
.005 1 .944
997
Pearson Chi-SquareLikelihood RatioLinear-by-LinearAssociationN of Valid Cases
Value dfAsymp. Sig.
(2-sided)
0 cells (.0%) have expected count less than 5. Theminimum expected count is 57.83.
a.

If Minister made a speech in Patwa would you think he is: * Age Range
Crosstab
225 219 232 676
33.3% 32.4% 34.3% 100.0%
67.4% 66.0% 70.1% 67.8%71 71 63 205
34.6% 34.6% 30.7% 100.0%
21.3% 21.4% 19.0% 20.6%38 42 36 116
32.8% 36.2% 31.0% 100.0%
11.4% 12.7% 10.9% 11.6%334 332 331 997
33.5% 33.3% 33.2% 100.0%
100.0% 100.0% 100.0% 100.0%
Count% within q8 If Ministermade a speech in Patwawould you think he is:% within age Age RangeCount% within q8 If Ministermade a speech in Patwawould you think he is:% within age Age RangeCount% within q8 If Ministermade a speech in Patwawould you think he is:% within age Age RangeCount% within q8 If Ministermade a speech in Patwawould you think he is:% within age Age Range
1 Communicatebetter with the public
2 Talk down to themasses
9 none
q8 If Ministermade a speechin Patwa wouldyou think he is:
Total
1 18-30 2 31-503 51-80+
years
age Age Range
Total
Chi-Square Tests
1.472a 4 .8321.474 4 .831
.100 1 .752
997
Pearson Chi-SquareLikelihood RatioLinear-by-LinearAssociationN of Valid Cases
Value dfAsymp. Sig.
(2-sided)
0 cells (.0%) have expected count less than 5. Theminimum expected count is 38.51.
a.

If Minister made a speech in Patwa would you think he is: * parish
Crosstab
338 338 676
50.0% 50.0% 100.0%
65.3% 70.6% 67.8%115 90 205
56.1% 43.9% 100.0%
22.2% 18.8% 20.6%65 51 116
56.0% 44.0% 100.0%
12.5% 10.6% 11.6%518 479 997
52.0% 48.0% 100.0%
100.0% 100.0% 100.0%
Count% within q8 If Ministermade a speech in Patwawould you think he is:% within urbanru parishCount% within q8 If Ministermade a speech in Patwawould you think he is:% within urbanru parishCount% within q8 If Ministermade a speech in Patwawould you think he is:% within urbanru parishCount% within q8 If Ministermade a speech in Patwawould you think he is:% within urbanru parish
1 Communicatebetter with the public
2 Talk down to themasses
9 none
q8 If Ministermade a speechin Patwa wouldyou think he is:
Total
1 urban 2 ruralurbanru parish
Total
Chi-Square Tests
3.218a 2 .2003.224 2 .199
1.355 1 .244
997
Pearson Chi-SquareLikelihood RatioLinear-by-LinearAssociationN of Valid Cases
Value dfAsymp. Sig.
(2-sided)
0 cells (.0%) have expected count less than 5. Theminimum expected count is 55.73.
a.

If Minister made a speech in Patwa would you think he is: * Region
Crosstab
152 133 391 676
22.5% 19.7% 57.8% 100.0%
76.8% 66.5% 65.3% 67.8%28 49 128 205
13.7% 23.9% 62.4% 100.0%
14.1% 24.5% 21.4% 20.6%18 18 80 116
15.5% 15.5% 69.0% 100.0%
9.1% 9.0% 13.4% 11.6%198 200 599 997
19.9% 20.1% 60.1% 100.0%
100.0% 100.0% 100.0% 100.0%
Count% within q8 If Ministermade a speech in Patwawould you think he is:% within region RegionCount% within q8 If Ministermade a speech in Patwawould you think he is:% within region RegionCount% within q8 If Ministermade a speech in Patwawould you think he is:% within region RegionCount% within q8 If Ministermade a speech in Patwawould you think he is:% within region Region
1 Communicatebetter with the public
2 Talk down to themasses
9 none
q8 If Ministermade a speechin Patwa wouldyou think he is:
Total
1 Western 2 Central 3 Easternregion Region
Total
Chi-Square Tests
12.448a 4 .01412.883 4 .012
4.863 1 .027
997
Pearson Chi-SquareLikelihood RatioLinear-by-LinearAssociationN of Valid Cases
Value dfAsymp. Sig.
(2-sided)
0 cells (.0%) have expected count less than 5. Theminimum expected count is 23.04.
a.
Symmetric Measures
.111 .014997
Contingency CoefficientNominal by NominalN of Valid Cases
Value Approx. Sig.
Not assuming the null hypothesis.a.
Using the asymptotic standard error assuming the null hypothesis.b.

Stereotypes by Demographic Variables Is more intelligent * Gender
Crosstab
44 29 739.1% 6.2% 7.7%
260 290 55053.9% 61.7% 57.8%
178 151 32936.9% 32.1% 34.6%
482 470 952100.0% 100.0% 100.0%
Count% within sex GenderCount% within sex GenderCount% within sex GenderCount% within sex Gender
1.00 Patwa
2.00 English
3.00 Both
rq9a Is moreintelligent
Total
1 Male 2 Femalesex Gender
Total
Chi-Square Tests
6.784a 2 .0346.808 2 .033
.231 1 .631
952
Pearson Chi-SquareLikelihood RatioLinear-by-LinearAssociationN of Valid Cases
Value dfAsymp. Sig.
(2-sided)
0 cells (.0%) have expected count less than 5. Theminimum expected count is 36.04.
a.
Symmetric Measures
.084 .034952
Contingency CoefficientNominal by NominalN of Valid Cases
Value Approx. Sig.
Not assuming the null hypothesis.a.
Using the asymptotic standard error assuming the null hypothesis.b.
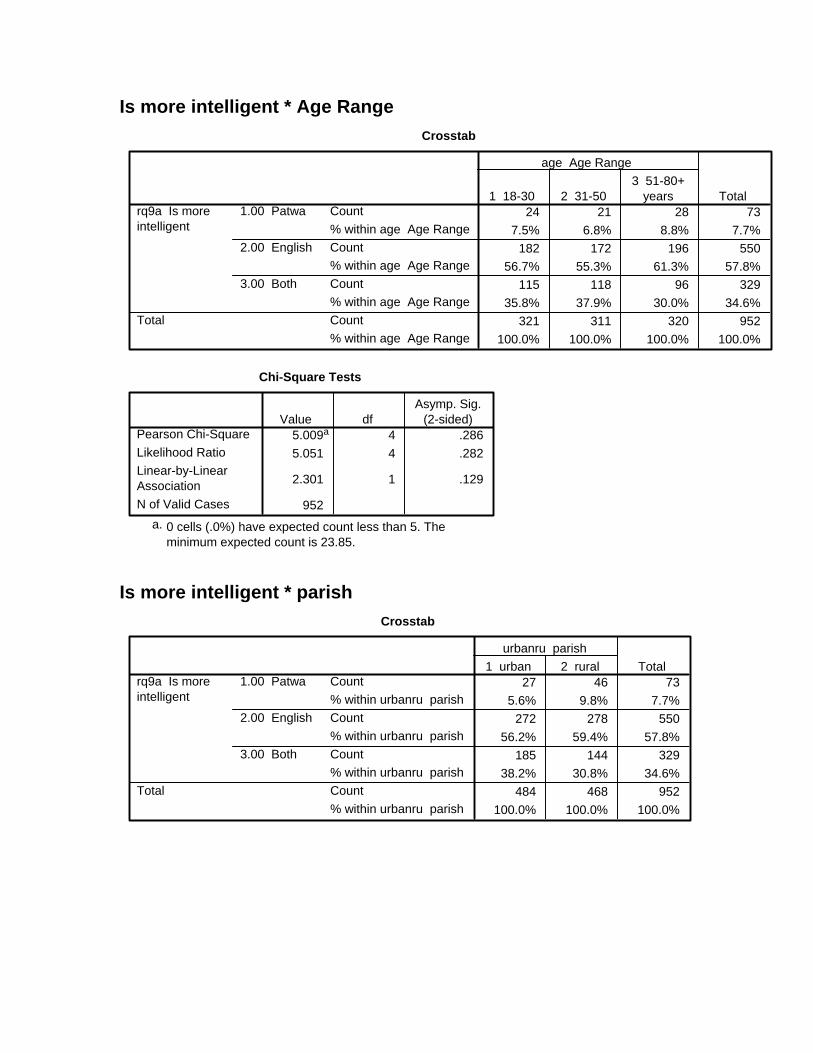
Is more intelligent * Age Range Crosstab
24 21 28 737.5% 6.8% 8.8% 7.7%
182 172 196 55056.7% 55.3% 61.3% 57.8%
115 118 96 32935.8% 37.9% 30.0% 34.6%
321 311 320 952100.0% 100.0% 100.0% 100.0%
Count% within age Age RangeCount% within age Age RangeCount% within age Age RangeCount% within age Age Range
1.00 Patwa
2.00 English
3.00 Both
rq9a Is moreintelligent
Total
1 18-30 2 31-503 51-80+
years
age Age Range
Total
Chi-Square Tests
5.009a 4 .2865.051 4 .282
2.301 1 .129
952
Pearson Chi-SquareLikelihood RatioLinear-by-LinearAssociationN of Valid Cases
Value dfAsymp. Sig.
(2-sided)
0 cells (.0%) have expected count less than 5. Theminimum expected count is 23.85.
a.
Is more intelligent * parish
Crosstab
27 46 735.6% 9.8% 7.7%
272 278 55056.2% 59.4% 57.8%
185 144 32938.2% 30.8% 34.6%
484 468 952100.0% 100.0% 100.0%
Count% within urbanru parishCount% within urbanru parishCount% within urbanru parishCount% within urbanru parish
1.00 Patwa
2.00 English
3.00 Both
rq9a Is moreintelligent
Total
1 urban 2 ruralurbanru parish
Total

Chi-Square Tests
9.854a 2 .0079.922 2 .007
9.304 1 .002
952
Pearson Chi-SquareLikelihood RatioLinear-by-LinearAssociationN of Valid Cases
Value dfAsymp. Sig.
(2-sided)
0 cells (.0%) have expected count less than 5. Theminimum expected count is 35.89.
a.
Symmetric Measures
.101 .007952
Contingency CoefficientNominal by NominalN of Valid Cases
Value Approx. Sig.
Not assuming the null hypothesis.a.
Using the asymptotic standard error assuming the null hypothesis.b.
Is more intelligent * Region
Crosstab
10 20 43 735.2% 10.3% 7.6% 7.7%
127 121 302 55066.1% 62.1% 53.5% 57.8%
55 54 220 32928.6% 27.7% 38.9% 34.6%
192 195 565 952100.0% 100.0% 100.0% 100.0%
Count% within region RegionCount% within region RegionCount% within region RegionCount% within region Region
1.00 Patwa
2.00 English
3.00 Both
rq9a Is moreintelligent
Total
1 Western 2 Central 3 Easternregion Region
Total
Chi-Square Tests
15.733a 4 .00315.884 4 .003
4.695 1 .030
952
Pearson Chi-SquareLikelihood RatioLinear-by-LinearAssociationN of Valid Cases
Value dfAsymp. Sig.
(2-sided)
0 cells (.0%) have expected count less than 5. Theminimum expected count is 14.72.
a.

Symmetric Measures
.128 .003952
Contingency CoefficientNominal by NominalN of Valid Cases
Value Approx. Sig.
Not assuming the null hypothesis.a.
Using the asymptotic standard error assuming the null hypothesis.b.
Is more honest * Gender
Crosstab
156 127 28333.5% 28.3% 31.0%
133 145 27828.5% 32.4% 30.4%
177 176 35338.0% 39.3% 38.6%
466 448 914100.0% 100.0% 100.0%
Count% within sex GenderCount% within sex GenderCount% within sex GenderCount% within sex Gender
1.00 Patwa
2.00 English
3.00 Both
rq9b Ismore honest
Total
1 Male 2 Femalesex Gender
Total
Chi-Square Tests
3.139a 2 .2083.143 2 .208
1.368 1 .242
914
Pearson Chi-SquareLikelihood RatioLinear-by-LinearAssociationN of Valid Cases
Value dfAsymp. Sig.
(2-sided)
0 cells (.0%) have expected count less than 5. Theminimum expected count is 136.26.
a.
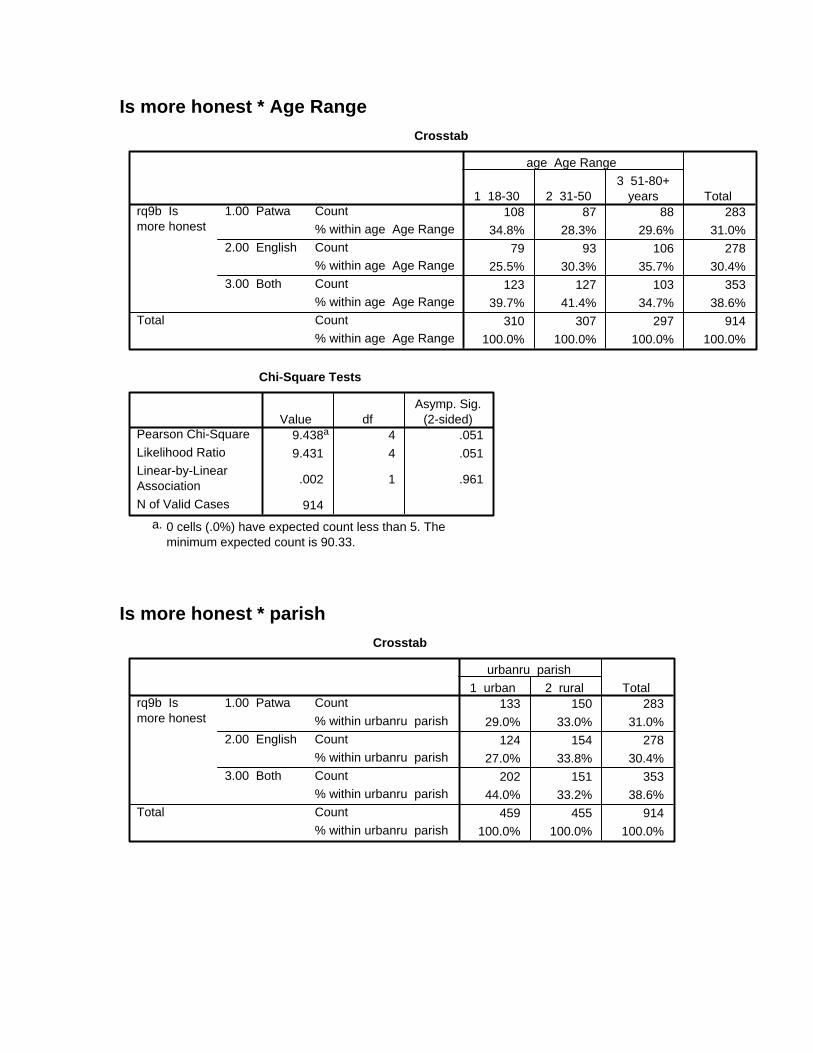
Is more honest * Age Range Crosstab
108 87 88 28334.8% 28.3% 29.6% 31.0%
79 93 106 27825.5% 30.3% 35.7% 30.4%
123 127 103 35339.7% 41.4% 34.7% 38.6%
310 307 297 914100.0% 100.0% 100.0% 100.0%
Count% within age Age RangeCount% within age Age RangeCount% within age Age RangeCount% within age Age Range
1.00 Patwa
2.00 English
3.00 Both
rq9b Ismore honest
Total
1 18-30 2 31-503 51-80+
years
age Age Range
Total
Chi-Square Tests
9.438a 4 .0519.431 4 .051
.002 1 .961
914
Pearson Chi-SquareLikelihood RatioLinear-by-LinearAssociationN of Valid Cases
Value dfAsymp. Sig.
(2-sided)
0 cells (.0%) have expected count less than 5. Theminimum expected count is 90.33.
a.
Is more honest * parish
Crosstab
133 150 28329.0% 33.0% 31.0%
124 154 27827.0% 33.8% 30.4%
202 151 35344.0% 33.2% 38.6%
459 455 914100.0% 100.0% 100.0%
Count% within urbanru parishCount% within urbanru parishCount% within urbanru parishCount% within urbanru parish
1.00 Patwa
2.00 English
3.00 Both
rq9b Ismore honest
Total
1 urban 2 ruralurbanru parish
Total

Chi-Square Tests
11.610a 2 .00311.642 2 .003
7.259 1 .007
914
Pearson Chi-SquareLikelihood RatioLinear-by-LinearAssociationN of Valid Cases
Value dfAsymp. Sig.
(2-sided)
0 cells (.0%) have expected count less than 5. Theminimum expected count is 138.39.
a.
Symmetric Measures
.112 .003914
Contingency CoefficientNominal by NominalN of Valid Cases
Value Approx. Sig.
Not assuming the null hypothesis.a.
Using the asymptotic standard error assuming the null hypothesis.b.
Is more honest * Region
Crosstab
55 54 174 28329.1% 29.2% 32.2% 31.0%
70 67 141 27837.0% 36.2% 26.1% 30.4%
64 64 225 35333.9% 34.6% 41.7% 38.6%
189 185 540 914100.0% 100.0% 100.0% 100.0%
Count% within region RegionCount% within region RegionCount% within region RegionCount% within region Region
1.00 Patwa
2.00 English
3.00 Both
rq9b Ismore honest
Total
1 Western 2 Central 3 Easternregion Region
Total
Chi-Square Tests
11.918a 4 .01811.837 4 .019
.557 1 .456
914
Pearson Chi-SquareLikelihood RatioLinear-by-LinearAssociationN of Valid Cases
Value dfAsymp. Sig.
(2-sided)
0 cells (.0%) have expected count less than 5. Theminimum expected count is 56.27.
a.
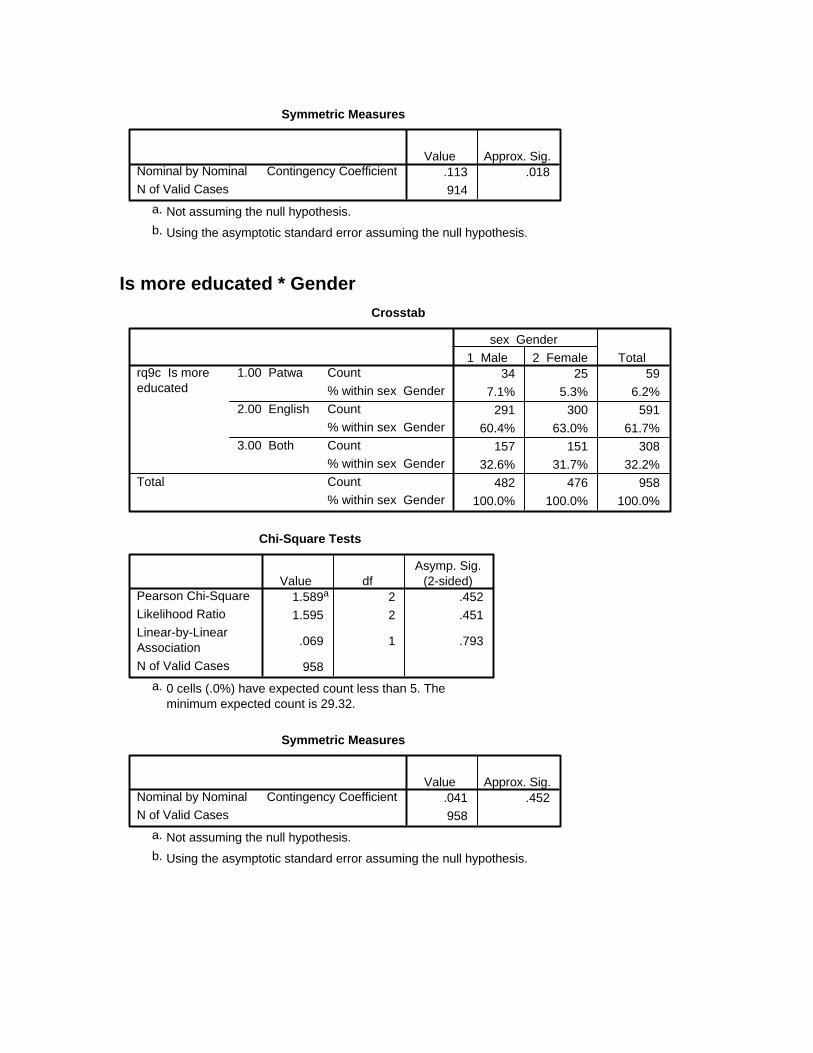
Symmetric Measures
.113 .018914
Contingency CoefficientNominal by NominalN of Valid Cases
Value Approx. Sig.
Not assuming the null hypothesis.a.
Using the asymptotic standard error assuming the null hypothesis.b.
Is more educated * Gender
Crosstab
34 25 597.1% 5.3% 6.2%
291 300 59160.4% 63.0% 61.7%
157 151 30832.6% 31.7% 32.2%
482 476 958100.0% 100.0% 100.0%
Count% within sex GenderCount% within sex GenderCount% within sex GenderCount% within sex Gender
1.00 Patwa
2.00 English
3.00 Both
rq9c Is moreeducated
Total
1 Male 2 Femalesex Gender
Total
Chi-Square Tests
1.589a 2 .4521.595 2 .451
.069 1 .793
958
Pearson Chi-SquareLikelihood RatioLinear-by-LinearAssociationN of Valid Cases
Value dfAsymp. Sig.
(2-sided)
0 cells (.0%) have expected count less than 5. Theminimum expected count is 29.32.
a.
Symmetric Measures
.041 .452958
Contingency CoefficientNominal by NominalN of Valid Cases
Value Approx. Sig.
Not assuming the null hypothesis.a.
Using the asymptotic standard error assuming the null hypothesis.b.

Is more educated * Age Range Crosstab
17 21 21 595.3% 6.6% 6.6% 6.2%
179 188 224 59155.6% 58.8% 70.9% 61.7%
126 111 71 30839.1% 34.7% 22.5% 32.2%
322 320 316 958100.0% 100.0% 100.0% 100.0%
Count% within age Age RangeCount% within age Age RangeCount% within age Age RangeCount% within age Age Range
1.00 Patwa
2.00 English
3.00 Both
rq9c Is moreeducated
Total
1 18-30 2 31-503 51-80+
years
age Age Range
Total
Chi-Square Tests
22.067a 4 .00022.717 4 .000
16.374 1 .000
958
Pearson Chi-SquareLikelihood RatioLinear-by-LinearAssociationN of Valid Cases
Value dfAsymp. Sig.
(2-sided)
0 cells (.0%) have expected count less than 5. Theminimum expected count is 19.46.
a.
Symmetric Measures
.150 .000958
Contingency CoefficientNominal by NominalN of Valid Cases
Value Approx. Sig.
Not assuming the null hypothesis.a.
Using the asymptotic standard error assuming the null hypothesis.b.
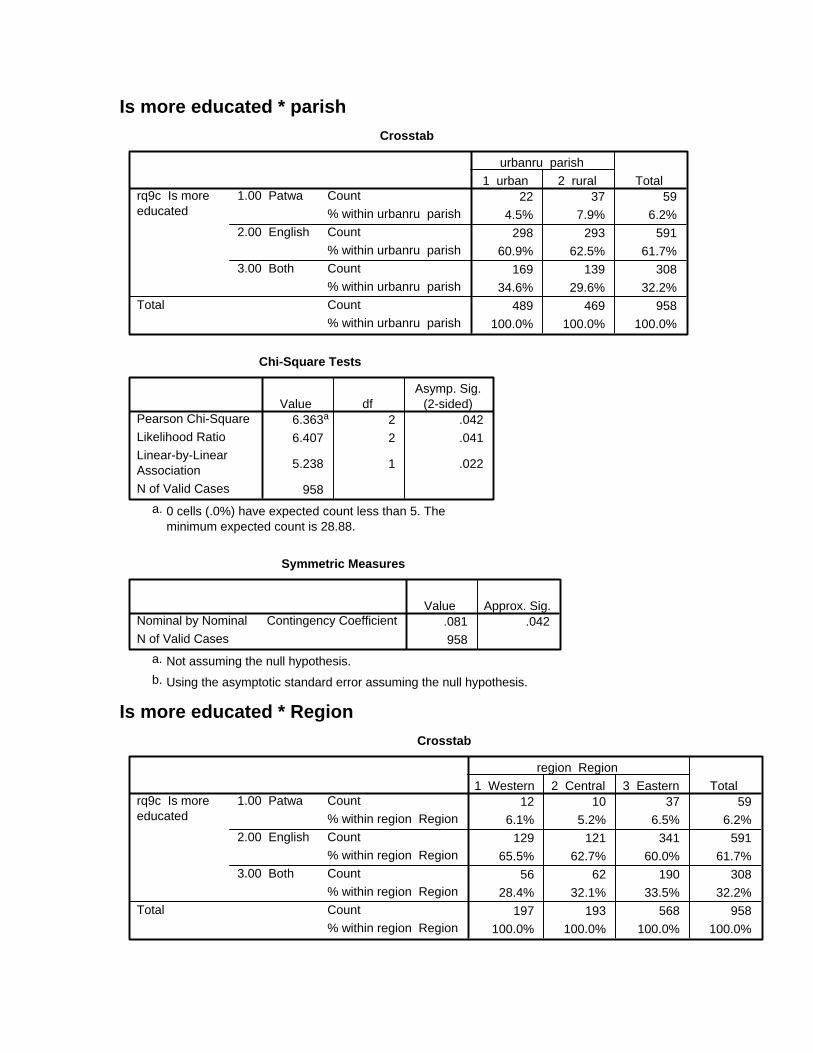
Is more educated * parish Crosstab
22 37 594.5% 7.9% 6.2%
298 293 59160.9% 62.5% 61.7%
169 139 30834.6% 29.6% 32.2%
489 469 958100.0% 100.0% 100.0%
Count% within urbanru parishCount% within urbanru parishCount% within urbanru parishCount% within urbanru parish
1.00 Patwa
2.00 English
3.00 Both
rq9c Is moreeducated
Total
1 urban 2 ruralurbanru parish
Total
Chi-Square Tests
6.363a 2 .0426.407 2 .041
5.238 1 .022
958
Pearson Chi-SquareLikelihood RatioLinear-by-LinearAssociationN of Valid Cases
Value dfAsymp. Sig.
(2-sided)
0 cells (.0%) have expected count less than 5. Theminimum expected count is 28.88.
a.
Symmetric Measures
.081 .042958
Contingency CoefficientNominal by NominalN of Valid Cases
Value Approx. Sig.
Not assuming the null hypothesis.a.
Using the asymptotic standard error assuming the null hypothesis.b.
Is more educated * Region Crosstab
12 10 37 596.1% 5.2% 6.5% 6.2%
129 121 341 59165.5% 62.7% 60.0% 61.7%
56 62 190 30828.4% 32.1% 33.5% 32.2%
197 193 568 958100.0% 100.0% 100.0% 100.0%
Count% within region RegionCount% within region RegionCount% within region RegionCount% within region Region
1.00 Patwa
2.00 English
3.00 Both
rq9c Is moreeducated
Total
1 Western 2 Central 3 Easternregion Region
Total

Chi-Square Tests
2.309a 4 .6792.348 4 .672
.805 1 .370
958
Pearson Chi-SquareLikelihood RatioLinear-by-LinearAssociationN of Valid Cases
Value dfAsymp. Sig.
(2-sided)
0 cells (.0%) have expected count less than 5. Theminimum expected count is 11.89.
a.
Is more friendly * Gender
Crosstab
189 190 37939.2% 40.4% 39.8%
126 114 24026.1% 24.3% 25.2%
167 166 33334.6% 35.3% 35.0%
482 470 952100.0% 100.0% 100.0%
Count% within sex GenderCount% within sex GenderCount% within sex GenderCount% within sex Gender
1.00 Patwa
2.00 English
3.00 Both
rq9d Ismore friendly
Total
1 Male 2 Femalesex Gender
Total
Chi-Square Tests
.454a 2 .797
.455 2 .797
.009 1 .923
952
Pearson Chi-SquareLikelihood RatioLinear-by-LinearAssociationN of Valid Cases
Value dfAsymp. Sig.
(2-sided)
0 cells (.0%) have expected count less than 5. Theminimum expected count is 118.49.
a.

Is more friendly * Age Range Crosstab
123 134 122 37938.2% 42.1% 39.1% 39.8%
75 71 94 24023.3% 22.3% 30.1% 25.2%
124 113 96 33338.5% 35.5% 30.8% 35.0%
322 318 312 952100.0% 100.0% 100.0% 100.0%
Count% within age Age RangeCount% within age Age RangeCount% within age Age RangeCount% within age Age Range
1.00 Patwa
2.00 English
3.00 Both
rq9d Ismore friendly
Total
1 18-30 2 31-503 51-80+
years
age Age Range
Total
Chi-Square Tests
7.950a 4 .0937.853 4 .097
1.597 1 .206
952
Pearson Chi-SquareLikelihood RatioLinear-by-LinearAssociationN of Valid Cases
Value dfAsymp. Sig.
(2-sided)
0 cells (.0%) have expected count less than 5. Theminimum expected count is 78.66.
a.
Is more friendly * parish
Crosstab
180 199 37937.2% 42.5% 39.8%
106 134 24021.9% 28.6% 25.2%
198 135 33340.9% 28.8% 35.0%
484 468 952100.0% 100.0% 100.0%
Count% within urbanru parishCount% within urbanru parishCount% within urbanru parishCount% within urbanru parish
1.00 Patwa
2.00 English
3.00 Both
rq9d Ismore friendly
Total
1 urban 2 ruralurbanru parish
Total

Chi-Square Tests
15.874a 2 .00015.949 2 .000
9.645 1 .002
952
Pearson Chi-SquareLikelihood RatioLinear-by-LinearAssociationN of Valid Cases
Value dfAsymp. Sig.
(2-sided)
0 cells (.0%) have expected count less than 5. Theminimum expected count is 117.98.
a.
Symmetric Measures
.128 .000952
Contingency CoefficientNominal by NominalN of Valid Cases
Value Approx. Sig.
Not assuming the null hypothesis.a.
Using the asymptotic standard error assuming the null hypothesis.b.
Is more friendly * Region
Crosstab
66 76 237 37934.0% 39.6% 41.9% 39.8%
59 54 127 24030.4% 28.1% 22.4% 25.2%
69 62 202 33335.6% 32.3% 35.7% 35.0%
194 192 566 952100.0% 100.0% 100.0% 100.0%
Count% within region RegionCount% within region RegionCount% within region RegionCount% within region Region
1.00 Patwa
2.00 English
3.00 Both
rq9d Ismore friendly
Total
1 Western 2 Central 3 Easternregion Region
Total
Chi-Square Tests
7.193a 4 .1267.191 4 .126
.874 1 .350
952
Pearson Chi-SquareLikelihood RatioLinear-by-LinearAssociationN of Valid Cases
Value dfAsymp. Sig.
(2-sided)
0 cells (.0%) have expected count less than 5. Theminimum expected count is 48.40.
a.

Has more money * Gender Crosstab
46 31 7710.0% 7.5% 8.8%
201 189 39043.7% 45.8% 44.7%
213 193 40646.3% 46.7% 46.5%
460 413 873100.0% 100.0% 100.0%
Count% within sex GenderCount% within sex GenderCount% within sex GenderCount% within sex Gender
1.00 Patwa
2.00 English
3.00 Both
rq9e Hasmore money
Total
1 Male 2 Femalesex Gender
Total
Chi-Square Tests
1.751a 2 .4171.764 2 .414
.451 1 .502
873
Pearson Chi-SquareLikelihood RatioLinear-by-LinearAssociationN of Valid Cases
Value dfAsymp. Sig.
(2-sided)
0 cells (.0%) have expected count less than 5. Theminimum expected count is 36.43.
a.
Has more money * Age Range
Crosstab
24 25 28 777.8% 8.8% 9.9% 8.8%
124 116 150 39040.4% 40.8% 53.2% 44.7%
159 143 104 40651.8% 50.4% 36.9% 46.5%
307 284 282 873100.0% 100.0% 100.0% 100.0%
Count% within age Age RangeCount% within age Age RangeCount% within age Age RangeCount% within age Age Range
1.00 Patwa
2.00 English
3.00 Both
rq9e Hasmore money
Total
1 18-30 2 31-503 51-80+
years
age Age Range
Total

Chi-Square Tests
15.882a 4 .00316.028 4 .003
10.149 1 .001
873
Pearson Chi-SquareLikelihood RatioLinear-by-LinearAssociationN of Valid Cases
Value dfAsymp. Sig.
(2-sided)
0 cells (.0%) have expected count less than 5. Theminimum expected count is 24.87.
a.
Symmetric Measures
.134 .003873
Contingency CoefficientNominal by NominalN of Valid Cases
Value Approx. Sig.
Not assuming the null hypothesis.a.
Using the asymptotic standard error assuming the null hypothesis.b.
Has more money * parish
Crosstab
35 42 777.8% 9.8% 8.8%
194 196 39043.5% 45.9% 44.7%
217 189 40648.7% 44.3% 46.5%
446 427 873100.0% 100.0% 100.0%
Count% within urbanru parishCount% within urbanru parishCount% within urbanru parishCount% within urbanru parish
1.00 Patwa
2.00 English
3.00 Both
rq9e Hasmore money
Total
1 urban 2 ruralurbanru parish
Total
Chi-Square Tests
2.165a 2 .3392.167 2 .338
2.157 1 .142
873
Pearson Chi-SquareLikelihood RatioLinear-by-LinearAssociationN of Valid Cases
Value dfAsymp. Sig.
(2-sided)
0 cells (.0%) have expected count less than 5. Theminimum expected count is 37.66.
a.

Symmetric Measures
.050 .339873
Contingency CoefficientNominal by NominalN of Valid Cases
Value Approx. Sig.
Not assuming the null hypothesis.a.
Using the asymptotic standard error assuming the null hypothesis.b.
Has more money * Region
Crosstab
14 16 47 777.7% 9.1% 9.1% 8.8%
89 86 215 39049.2% 49.1% 41.6% 44.7%
78 73 255 40643.1% 41.7% 49.3% 46.5%
181 175 517 873100.0% 100.0% 100.0% 100.0%
Count% within region RegionCount% within region RegionCount% within region RegionCount% within region Region
1.00 Patwa
2.00 English
3.00 Both
rq9e Hasmore money
Total
1 Western 2 Central 3 Easternregion Region
Total
Chi-Square Tests
5.210a 4 .2665.221 4 .265
1.289 1 .256
873
Pearson Chi-SquareLikelihood RatioLinear-by-LinearAssociationN of Valid Cases
Value dfAsymp. Sig.
(2-sided)
0 cells (.0%) have expected count less than 5. Theminimum expected count is 15.44.
a.
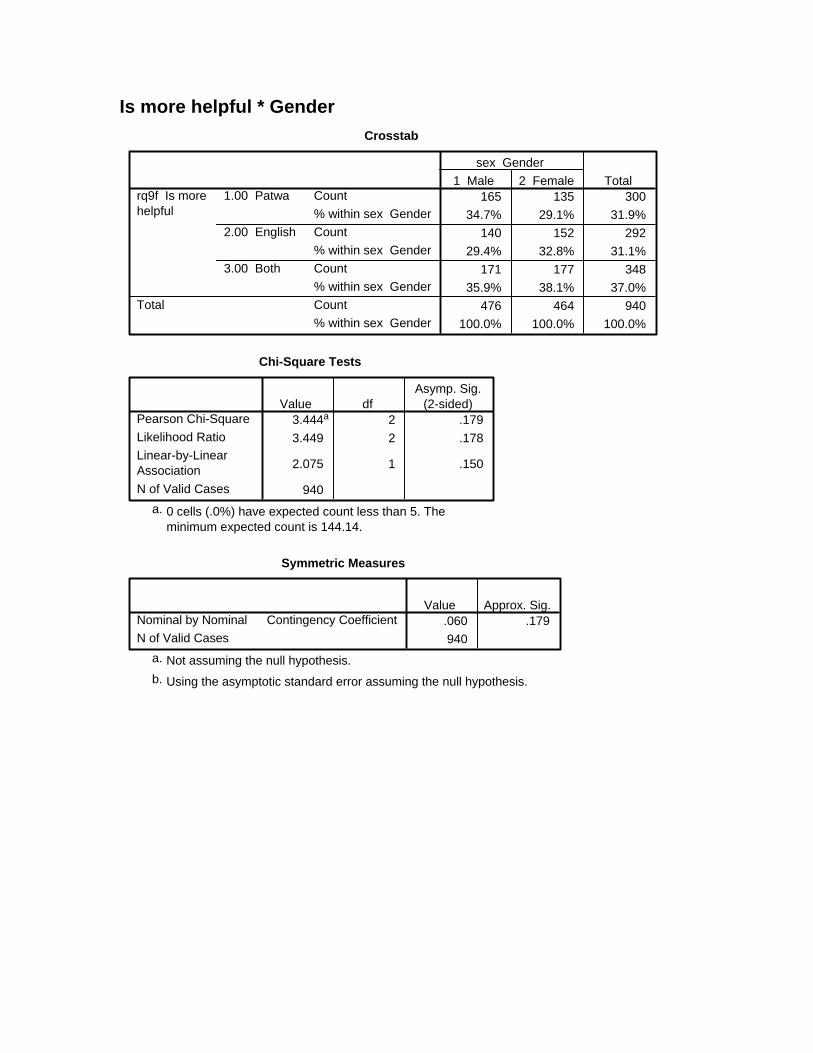
Is more helpful * Gender Crosstab
165 135 30034.7% 29.1% 31.9%
140 152 29229.4% 32.8% 31.1%
171 177 34835.9% 38.1% 37.0%
476 464 940100.0% 100.0% 100.0%
Count% within sex GenderCount% within sex GenderCount% within sex GenderCount% within sex Gender
1.00 Patwa
2.00 English
3.00 Both
rq9f Is morehelpful
Total
1 Male 2 Femalesex Gender
Total
Chi-Square Tests
3.444a 2 .1793.449 2 .178
2.075 1 .150
940
Pearson Chi-SquareLikelihood RatioLinear-by-LinearAssociationN of Valid Cases
Value dfAsymp. Sig.
(2-sided)
0 cells (.0%) have expected count less than 5. Theminimum expected count is 144.14.
a.
Symmetric Measures
.060 .179940
Contingency CoefficientNominal by NominalN of Valid Cases
Value Approx. Sig.
Not assuming the null hypothesis.a.
Using the asymptotic standard error assuming the null hypothesis.b.

Is more helpful * Age Range Crosstab
96 95 109 30030.1% 30.5% 35.2% 31.9%
84 101 107 29226.3% 32.5% 34.5% 31.1%
139 115 94 34843.6% 37.0% 30.3% 37.0%
319 311 310 940100.0% 100.0% 100.0% 100.0%
Count% within age Age RangeCount% within age Age RangeCount% within age Age RangeCount% within age Age Range
1.00 Patwa
2.00 English
3.00 Both
rq9f Is morehelpful
Total
1 18-30 2 31-503 51-80+
years
age Age Range
Total
Chi-Square Tests
12.683a 4 .01312.789 4 .012
7.658 1 .006
940
Pearson Chi-SquareLikelihood RatioLinear-by-LinearAssociationN of Valid Cases
Value dfAsymp. Sig.
(2-sided)
0 cells (.0%) have expected count less than 5. Theminimum expected count is 96.30.
a.
Symmetric Measures
.115 .013940
Contingency CoefficientNominal by NominalN of Valid Cases
Value Approx. Sig.
Not assuming the null hypothesis.a.
Using the asymptotic standard error assuming the null hypothesis.b.

Is more helpful * parish Crosstab
152 148 30031.6% 32.2% 31.9%
132 160 29227.4% 34.9% 31.1%
197 151 34841.0% 32.9% 37.0%
481 459 940100.0% 100.0% 100.0%
Count% within urbanru parishCount% within urbanru parishCount% within urbanru parishCount% within urbanru parish
1.00 Patwa
2.00 English
3.00 Both
rq9f Is morehelpful
Total
1 urban 2 ruralurbanru parish
Total
Chi-Square Tests
8.308a 2 .0168.326 2 .016
2.587 1 .108
940
Pearson Chi-SquareLikelihood RatioLinear-by-LinearAssociationN of Valid Cases
Value dfAsymp. Sig.
(2-sided)
0 cells (.0%) have expected count less than 5. Theminimum expected count is 142.58.
a.
Symmetric Measures
.094 .016940
Contingency CoefficientNominal by NominalN of Valid Cases
Value Approx. Sig.
Not assuming the null hypothesis.a.
Using the asymptotic standard error assuming the null hypothesis.b.
Is more helpful * Region Crosstab
57 56 187 30030.2% 29.8% 33.2% 31.9%
68 67 157 29236.0% 35.6% 27.9% 31.1%
64 65 219 34833.9% 34.6% 38.9% 37.0%
189 188 563 940100.0% 100.0% 100.0% 100.0%
Count% within region RegionCount% within region RegionCount% within region RegionCount% within region Region
1.00 Patwa
2.00 English
3.00 Both
rq9f Is morehelpful
Total
1 Western 2 Central 3 Easternregion Region
Total

Chi-Square Tests
6.663a 4 .1556.618 4 .158
.084 1 .772
940
Pearson Chi-SquareLikelihood RatioLinear-by-LinearAssociationN of Valid Cases
Value dfAsymp. Sig.
(2-sided)
0 cells (.0%) have expected count less than 5. Theminimum expected count is 58.40.
a.
Symmetric Measures
.084 .155940
Contingency CoefficientNominal by NominalN of Valid Cases
Value Approx. Sig.
Not assuming the null hypothesis.a.
Using the asymptotic standard error assuming the null hypothesis.b.

Education by Demographic Variables Which school is better? * Gender
Crosstab
133 155 28826.6% 31.3% 28.9%
367 341 708
73.4% 68.8% 71.1%
500 496 996100.0% 100.0% 100.0%
Count% within sex GenderCount% within sex Gender
Count% within sex Gender
1 English school only
2 English & PatwaSchool
q10 Whichschool isbetter?
Total
1 Male 2 Femalesex Gender
Total
Chi-Square Tests
2.619b 1 .1062.398 1 .1212.621 1 .105
.108 .061
2.617 1 .106
996
Pearson Chi-SquareContinuity Correctiona
Likelihood RatioFisher's Exact TestLinear-by-LinearAssociationN of Valid Cases
Value dfAsymp. Sig.
(2-sided)Exact Sig.(2-sided)
Exact Sig.(1-sided)
Computed only for a 2x2 tablea.
0 cells (.0%) have expected count less than 5. The minimum expected count is 143.42.
b.
Symmetric Measures
.051 .106996
Contingency CoefficientNominal by NominalN of Valid Cases
Value Approx. Sig.
Not assuming the null hypothesis.a.
Using the asymptotic standard error assuming the null hypothesis.b.
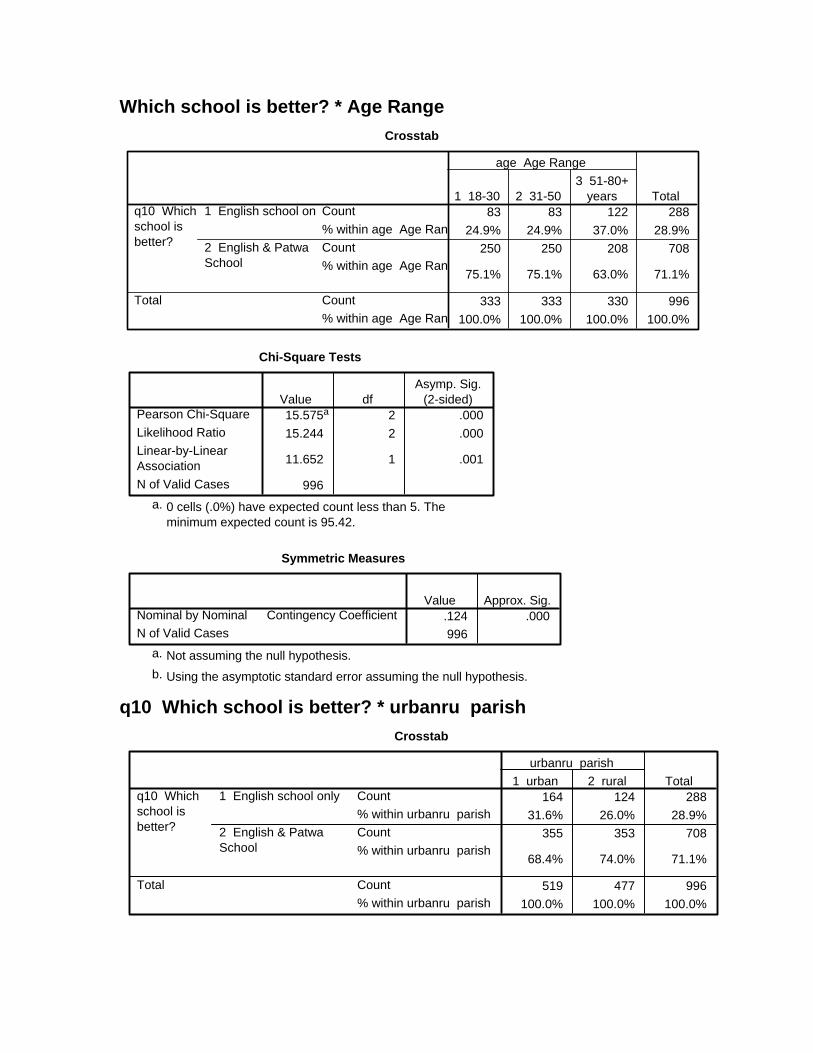
Which school is better? * Age Range Crosstab
83 83 122 28824.9% 24.9% 37.0% 28.9%
250 250 208 708
75.1% 75.1% 63.0% 71.1%
333 333 330 996100.0% 100.0% 100.0% 100.0%
Count% within age Age RangCount% within age Age Rang
Count% within age Age Rang
1 English school on
2 English & PatwaSchool
q10 Whichschool isbetter?
Total
1 18-30 2 31-503 51-80+
years
age Age Range
Total
Chi-Square Tests
15.575a 2 .00015.244 2 .000
11.652 1 .001
996
Pearson Chi-SquareLikelihood RatioLinear-by-LinearAssociationN of Valid Cases
Value dfAsymp. Sig.
(2-sided)
0 cells (.0%) have expected count less than 5. Theminimum expected count is 95.42.
a.
Symmetric Measures
.124 .000996
Contingency CoefficientNominal by NominalN of Valid Cases
Value Approx. Sig.
Not assuming the null hypothesis.a.
Using the asymptotic standard error assuming the null hypothesis.b.
q10 Which school is better? * urbanru parish Crosstab
164 124 28831.6% 26.0% 28.9%
355 353 708
68.4% 74.0% 71.1%
519 477 996100.0% 100.0% 100.0%
Count% within urbanru parishCount% within urbanru parish
Count% within urbanru parish
1 English school only
2 English & PatwaSchool
q10 Whichschool isbetter?
Total
1 urban 2 ruralurbanru parish
Total

Chi-Square Tests
3.797b 1 .0513.529 1 .0603.808 1 .051
.059 .030
3.793 1 .051
996
Pearson Chi-SquareContinuity Correctiona
Likelihood RatioFisher's Exact TestLinear-by-LinearAssociationN of Valid Cases
Value dfAsymp. Sig.
(2-sided)Exact Sig.(2-sided)
Exact Sig.(1-sided)
Computed only for a 2x2 tablea.
0 cells (.0%) have expected count less than 5. The minimum expected count is 137.93.
b.
q10 Which school is better? * region Region
Crosstab
63 51 174 28831.5% 25.8% 29.1% 28.9%
137 147 424 708
68.5% 74.2% 70.9% 71.1%
200 198 598 996100.0% 100.0% 100.0% 100.0%
Count% within region RegioCount% within region Regio
Count% within region Regio
1 English school only
2 English & PatwaSchool
q10 Whichschool isbetter?
Total
1 Western 2 Central 3 Easternregion Region
Total
Chi-Square Tests
1.620a 2 .4451.632 2 .442
.127 1 .722
996
Pearson Chi-SquareLikelihood RatioLinear-by-LinearAssociationN of Valid Cases
Value dfAsymp. Sig.
(2-sided)
0 cells (.0%) have expected count less than 5. Theminimum expected count is 57.25.
a.

Is Patwa a Language by Demographic Variables Is Patwa a Language * Gender
Crosstab
405 390 79580.8% 78.2% 79.5%
96 109 20519.2% 21.8% 20.5%
501 499 1000100.0% 100.0% 100.0%
Count% within sex GenderCount% within sex GenderCount% within sex Gender
1 Yes
2 No
q12 Is Patwaa Language
Total
1 Male 2 Femalesex Gender
Total
Chi-Square Tests
1.103b 1 .294.945 1 .331
1.104 1 .293.309 .166
1.102 1 .294
1000
Pearson Chi-SquareContinuity Correctiona
Likelihood RatioFisher's Exact TestLinear-by-LinearAssociationN of Valid Cases
Value dfAsymp. Sig.
(2-sided)Exact Sig.(2-sided)
Exact Sig.(1-sided)
Computed only for a 2x2 tablea.
0 cells (.0%) have expected count less than 5. The minimum expected count is 102.30.
b.
Is Patwa a Language * Age Range
Crosstab
276 276 243 79582.6% 82.6% 73.2% 79.5%
58 58 89 20517.4% 17.4% 26.8% 20.5%
334 334 332 1000100.0% 100.0% 100.0% 100.0%
Count% within age Age RangeCount% within age Age RangeCount% within age Age Range
1 Yes
2 No
q12 Is Patwaa Language
Total
1 18-30 2 31-503 51-80+
years
age Age Range
Total
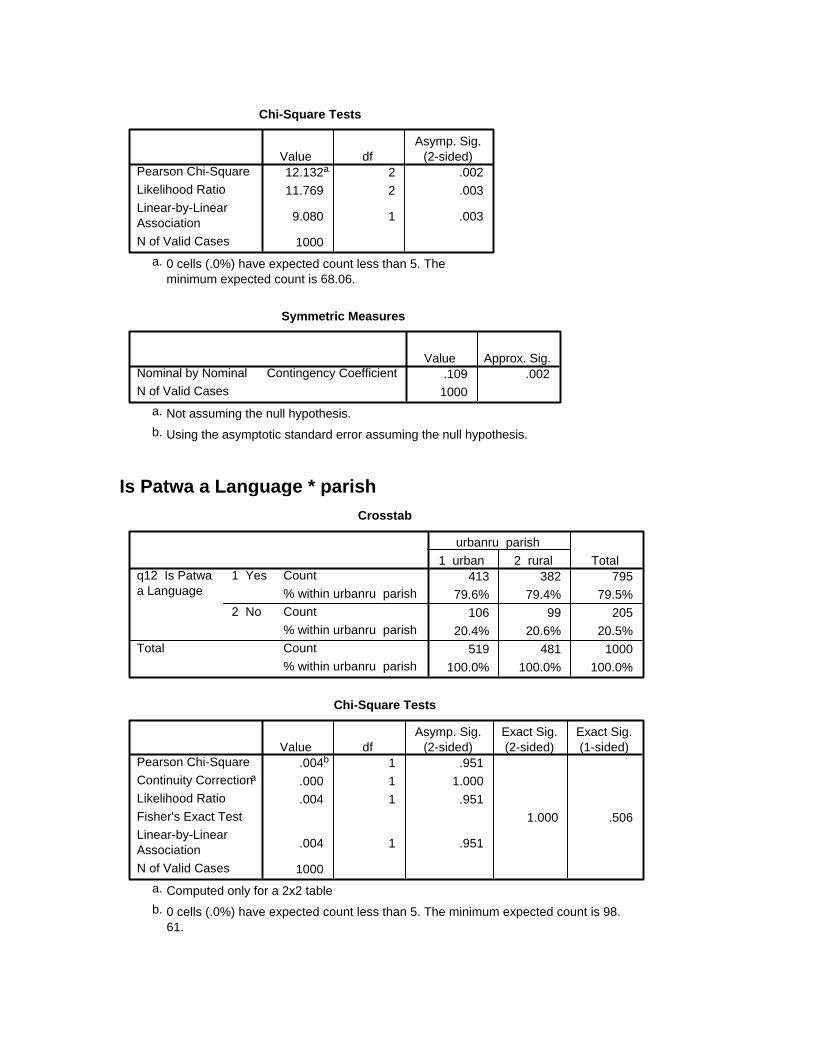
Chi-Square Tests
12.132a 2 .00211.769 2 .003
9.080 1 .003
1000
Pearson Chi-SquareLikelihood RatioLinear-by-LinearAssociationN of Valid Cases
Value dfAsymp. Sig.
(2-sided)
0 cells (.0%) have expected count less than 5. Theminimum expected count is 68.06.
a.
Symmetric Measures
.109 .0021000
Contingency CoefficientNominal by NominalN of Valid Cases
Value Approx. Sig.
Not assuming the null hypothesis.a.
Using the asymptotic standard error assuming the null hypothesis.b.
Is Patwa a Language * parish
Crosstab
413 382 79579.6% 79.4% 79.5%
106 99 20520.4% 20.6% 20.5%
519 481 1000100.0% 100.0% 100.0%
Count% within urbanru parishCount% within urbanru parishCount% within urbanru parish
1 Yes
2 No
q12 Is Patwaa Language
Total
1 urban 2 ruralurbanru parish
Total
Chi-Square Tests
.004b 1 .951
.000 1 1.000
.004 1 .9511.000 .506
.004 1 .951
1000
Pearson Chi-SquareContinuity Correctiona
Likelihood RatioFisher's Exact TestLinear-by-LinearAssociationN of Valid Cases
Value dfAsymp. Sig.
(2-sided)Exact Sig.(2-sided)
Exact Sig.(1-sided)
Computed only for a 2x2 tablea.
0 cells (.0%) have expected count less than 5. The minimum expected count is 98.61.
b.

Is Patwa a Language * Region Crosstab
153 155 487 79576.5% 77.5% 81.2% 79.5%
47 45 113 20523.5% 22.5% 18.8% 20.5%
200 200 600 1000100.0% 100.0% 100.0% 100.0%
Count% within region RegionCount% within region RegionCount% within region Region
1 Yes
2 No
q12 Is Patwaa Language
Total
1 Western 2 Central 3 Easternregion Region
Total
Chi-Square Tests
2.618a 2 .2702.591 2 .274
2.452 1 .117
1000
Pearson Chi-SquareLikelihood RatioLinear-by-LinearAssociationN of Valid Cases
Value dfAsymp. Sig.
(2-sided)
0 cells (.0%) have expected count less than 5. Theminimum expected count is 41.00.
a.

Official Language by Demographic Variables Should Patwa be an official language? * Gender
Crosstab
358 326 68471.7% 65.3% 68.5%
123 141 26424.6% 28.3% 26.5%
18 32 503.6% 6.4% 5.0%
499 499 998100.0% 100.0% 100.0%
Count% within sex GenderCount% within sex GenderCount% within sex GenderCount% within sex Gender
1 Yes
2 No
3 Don't Know
q13 Should Patwa bean official language?
Total
1 Male 2 Femalesex Gender
Total
Chi-Square Tests
6.644a 2 .0366.699 2 .035
6.382 1 .012
998
Pearson Chi-SquareLikelihood RatioLinear-by-LinearAssociationN of Valid Cases
Value dfAsymp. Sig.
(2-sided)
0 cells (.0%) have expected count less than 5. Theminimum expected count is 25.00.
a.
Symmetric Measures
.081 .036998
Contingency CoefficientNominal by NominalN of Valid Cases
Value Approx. Sig.
Not assuming the null hypothesis.a.
Using the asymptotic standard error assuming the null hypothesis.b.

Should Patwa be an official language? * Age Range Crosstab
240 229 215 68472.1% 68.8% 64.8% 68.5%
77 89 98 26423.1% 26.7% 29.5% 26.5%
16 15 19 504.8% 4.5% 5.7% 5.0%
333 333 332 998100.0% 100.0% 100.0% 100.0%
Count% within age Age RangeCount% within age Age RangeCount% within age Age RangeCount% within age Age Range
1 Yes
2 No
3 Don't Know
q13 Should Patwa bean official language?
Total
1 18-30 2 31-503 51-80+
years
age Age Range
Total
Chi-Square Tests
4.420a 4 .3524.434 4 .350
3.389 1 .066
998
Pearson Chi-SquareLikelihood RatioLinear-by-LinearAssociationN of Valid Cases
Value dfAsymp. Sig.
(2-sided)
0 cells (.0%) have expected count less than 5. Theminimum expected count is 16.63.
a.
Should Patwa be an official language? * parish
Crosstab
336 348 68465.0% 72.3% 68.5%
154 110 26429.8% 22.9% 26.5%
27 23 505.2% 4.8% 5.0%
517 481 998100.0% 100.0% 100.0%
Count% within urbanru parishCount% within urbanru parishCount% within urbanru parishCount% within urbanru parish
1 Yes
2 No
3 Don't Know
q13 Should Patwa bean official language?
Total
1 urban 2 ruralurbanru parish
Total

Chi-Square Tests
6.574a 2 .0376.600 2 .037
4.563 1 .033
998
Pearson Chi-SquareLikelihood RatioLinear-by-LinearAssociationN of Valid Cases
Value dfAsymp. Sig.
(2-sided)
0 cells (.0%) have expected count less than 5. Theminimum expected count is 24.10.
a.
Symmetric Measures
.081 .037998
Contingency CoefficientNominal by NominalN of Valid Cases
Value Approx. Sig.
Not assuming the null hypothesis.a.
Using the asymptotic standard error assuming the null hypothesis.b.
Should Patwa be an official language? * Region
Crosstab
127 143 414 68464.1% 71.5% 69.0% 68.5%
60 48 156 26430.3% 24.0% 26.0% 26.5%
11 9 30 505.6% 4.5% 5.0% 5.0%
198 200 600 998100.0% 100.0% 100.0% 100.0%
Count% within region RegioCount% within region RegioCount% within region RegioCount% within region Regio
1 Yes
2 No
3 Don't Know
q13 Should Patwa bean official language?
Total
1 Western 2 Central 3 Easternregion Region
Total
Chi-Square Tests
2.666a 4 .6152.639 4 .620
.754 1 .385
998
Pearson Chi-SquareLikelihood RatioLinear-by-LinearAssociationN of Valid Cases
Value dfAsymp. Sig.
(2-sided)
0 cells (.0%) have expected count less than 5. Theminimum expected count is 9.92.
a.