The Laboratory Diagnosis of Testosterone Deficiency
27
The Laboratory Diagnosis of Testosterone Deficiency DARIUS A. PADUCH, MD, PHD, ROBERT E. BRANNIGAN, MD, EUGENE F. FUCHS, MD, EDWARD D. KIM, MD, JOEL L. MARMAR, MD, AND JAY I. SANDLOW, MD ABSTRACT Evaluation and treatment of hypogonadal men has become an important part of urological practice. Fatigue, loss of libido and erectile dysfunction are commonly reported, but non-specific symptoms of low testosterone (T) and laboratory verification of low testosterone is an important part of evaluation in addition to a detailed history and physical exam. Significant intra-individual fluctuations in serum T levels, biological variation of T action on end organs, the wide range of T levels in human serum samples and technical limitations of currently available assays have led to poor reliability of T measurements in the clinical laboratory setting. There is no universally accepted threshold of T concentration that distinguishes eugonadal from hypogonadal men, thus laboratory results have to be interpreted in the appropriate clinical setting. This review focuses on clinical, biological and technological challenges that affect serum T measurements to educate clinicians regarding technological advances and limitations of currently available laboratory methods to diagnose hypogonadism. A collaborative effort led by the American Urological Association (AUA) between practicing clinicians, patient advocacy groups, government regulatory agencies, industry and professional societies is underway to provide optimized assay platforms and evidence based normal assay ranges to guide clinical decision making. Until such standardization is commonplace in clinical laboratories, the decision to treat should be based on the presence of signs and symptoms in addition to serum T
Transcript of The Laboratory Diagnosis of Testosterone Deficiency

The Laboratory Diagnosis of Testosterone Deficiency
DARIUS A. PADUCH, MD, PHD, ROBERT E. BRANNIGAN, MD, EUGENE F. FUCHS,
MD, EDWARD D. KIM, MD, JOEL L. MARMAR, MD, AND JAY I. SANDLOW, MD
ABSTRACT
Evaluation and treatment of hypogonadal men has become an important part of urological practice.
Fatigue, loss of libido and erectile dysfunction are commonly reported, but non-specific symptoms of
low testosterone (T) and laboratory verification of low testosterone is an important part of evaluation in
addition to a detailed history and physical exam. Significant intra-individual fluctuations in serum T
levels, biological variation of T action on end organs, the wide range of T levels in human serum
samples and technical limitations of currently available assays have led to poor reliability of T
measurements in the clinical laboratory setting. There is no universally accepted threshold of T
concentration that distinguishes eugonadal from hypogonadal men, thus laboratory results have to be
interpreted in the appropriate clinical setting. This review focuses on clinical, biological and
technological challenges that affect serum T measurements to educate clinicians regarding technological
advances and limitations of currently available laboratory methods to diagnose hypogonadism. A
collaborative effort led by the American Urological Association (AUA) between practicing clinicians,
patient advocacy groups, government regulatory agencies, industry and professional societies is
underway to provide optimized assay platforms and evidence based normal assay ranges to guide
clinical decision making. Until such standardization is commonplace in clinical laboratories, the
decision to treat should be based on the presence of signs and symptoms in addition to serum T
2
© 2013 American Urological Association Education and Research, Inc.
measurements. Rigid interpretation of T ranges should not dictate clinical decision making or define
coverage of treatment by third party payers.
KEYWORDS
Testosterone
Bioavailable testosterone
Free testosterone
Sex-hormone binding globulin
Androgen deficiency
Hypogonadism
Assays
INTRODUCTION
The laboratory diagnosis of testosterone (T) deficiency is a challenge. Serum T levels are subject to
temporal variation— diurnal, seasonal and age-related. Illness and certain medications, such as opiates
and glucocorticoids, can temporarily affect T concentrations through central and peripheral effects. Total
testosterone (TT) concentrations are affected by alterations in sex-hormone binding globulin (SHBG),
which in turn can vary for a variety of reasons, including age, medications and medical comorbidities.
There are several different assays for measurement of T levels, and performance characteristics,
linearity, reproducibility, low level limits of detection and pre-analytical requirements differ among the
assay platforms. The populations upon which the normal assay ranges are established differ between
assays leading to a wide variety of normal ranges reported by different laboratories. Lastly, T circulates
in the blood primarily bound specifically to SHBG or non-specifically to albumin, with only 2-3% of TT
being free. Whether TT or free testosterone (FT) measurements most closely correlate with symptomatic
androgen deficiency is a matter of debate.

3
© 2013 American Urological Association Education and Research, Inc.
Androgen deficiency may become apparent at different ages within an individual or a population. T
levels are affected by age; body mass index (BMI); and comorbidities, such as type 2 diabetes mellitus
(T2DM), depression, anxiety, thyroid disorders, malnutrition, alcohol consumption and physical activity.
There is no large population-based study of T values from healthy, fertile men with normal sexual
activity and reproductive function assessed by commonly accepted validation methods. The lack of these
types of studies confuses clinical decision making and impairs comparison of assays on the same subject
obtained in different laboratories.
Because of the multitude of factors affecting the laboratory evaluation and interpretation of T levels, it is
no surprise that a significant, universally accepted definition of T deficiency is lacking. The American
Urological Association (AUA), together with the Endocrine Society and the Centers for Disease Control
and Prevention (CDC), has been a leading force in addressing technical difficulties in T measurements,
establishing clinically relevant normal assay ranges and harmonizing T assay performance across
different platforms.1 Improving assay accuracy, sensitivity and reproducibility as well as advocating
that laboratories disclose information about their methodologies with results and provide a standardized
definition of normal populations used to establish normal assay ranges should help clinicians to deliver
better care for their patients.
Herein, we discuss the currently used assays for T measurement, their utility and limitations and the
implications for clinical practice relevant to practice of urology and andrology.
DEFINING TESTOSTERONE DEFICIENCY
There is no consensus among endocrinologists, urologists and clinical pathologists as to what defines a
“low” T level. Published normal assay ranges for serum T are mostly based on studies in older men (>65
years old) and were not specifically designed to establish normal assay ranges in men with normal
sexual and reproductive function. It is clear that T level correlates with overall health status and normal
sexual function. To best serve our patients, it is our belief that the normal ranges should be based on a
4
© 2013 American Urological Association Education and Research, Inc.
predefined, healthy index population representing the demographic structure of the United States. The
Endocrine Society recommends that total low T be defined using local, normal assay ranges in the
presence of characteristic signs or symptoms diagnostic of hypogonadism.2 The Food and Drug
Administration (FDA) uses a cut-off value of 300 ng/dL to define hypogonadism for clinical trial
development and enrollment. Meanwhile, a consensus statement from the International Society of
Andrology (ISA), the International Society for Study of the Aging Male (ISSAM), the European
Association of Urology (EAU), the European Association of Andrology (EAA) and the American
Society of Andrology (ASA) recommended that TT levels above 350 ng/dL do not require treatment,
and levels below 230 ng/dL (with symptoms) may require T replacement therapy.3 For levels between
230-350 ng/dL, the recommendation is to repeat the TT with SHBG for calculation of FT or direct
measurement of FT by equilibrium dialysis.3 Similarly, it has been previously recommended that men
with TT<200 ng/dL be treated as hypogonadal, those with TT>400 ng/dL be considered normal and
those with TT 200-400 ng/dL be treated based on their clinical presentation if symptomatic.4
Considering that serum T level is used as a surrogate of target organ concentration of T and based on a
review of the published literature and the best clinical judgment of the authors of this manuscript, this
panel emphasizes that signs and symptoms suggestive of hypogonadism and laboratory measured T
level are equally important indicators of hypogonadism and indicators for treatment until more research
is done. We believe that rigid use of T cut-off (300 ng/dL) may lead to unnecessary treatment of
asymptomatic men as well as under-treatment of men with persistent signs and symptoms.
Use of free or bioavailable T may aid in the biochemical diagnosis of hypogonadism, especially when
results of the TT assay are equivocal or fail to reflect clinical presentation.3 There are no generally
accepted lower limits of normal FT for the diagnosis of hypogonadism. According to expert opinion, a
FT level below 65 pg/ml may provide supportive evidence for treatment.3 Corresponding values for
bioavailable T depend on the method used and are not generally available for healthy young men.5
Calculated FT using measured TT and SHBG values is a feasible approach to include the SHBG
variability in the interpretation of total T.6
5
© 2013 American Urological Association Education and Research, Inc.
It is no surprise that attempts to establish a uniform laboratory threshold that accurately distinguishes
hypogonadal and eugonadal men among the broad range of subjects of different ages and ethnic
background has been difficult given lack of agreement on what constitutes the definition of a “normal”
subject, tendency to select men older than 65 years for published studies on hypogonadism, different
inclusion and exclusion criteria among studies and technical differences in assays used. Mean age of
subjects enrolled in the largest population studies on male hypogonadism was 75.4 for the MrOS arm in
Sweden, 73.7 in the United States based arm of MrOS and 60 for the EMAS study.7-9 More studies
focused on demographically matched healthy male populations are clearly needed to establish normal
assay ranges for diverse age group of men.
PREVALENCE OF TESTOSTERONE DEFICIENCY
In a multi-ethnic, population-based observational study of 1,475 men aged 30-79 years in the United
States, Araujo et al.10 observed the prevalence of symptomatic androgen deficiency in hypogonadal men
(TT<300 ng/dL) to be 5.6% (95% CI, 3.6-8.6%). Symptomatic hypogonadism was defined as presence
of low libido, erectile dysfunction, osteoporosis or fracture or two or more of following symptoms: sleep
disturbance, depressed mood, lethargy or diminished physical performance. The prevalence of
hypogonadism was lower in men less 70 years old (3.1-7.0%), but increased substantially with age to
18.4%. Men older than 50 with a T level below 300 ng/dL were more likely to have hypogonadism
related symptoms (8.4%) as compared to younger hypogonadal men (4.2%). Longitudinal population-
based studies of aging men have also demonstrated that both TT and FT decline with age with a
concomitant increase in SHBG levels.11-13 Given this evidence, it is estimated that by the year 2025,
there will be approximately 6.5 million American men 30-80 years of age diagnosed with androgen
deficiency.10 Mulligan et al. reported prevalence of hypogonadism (TT<300 ng/dL) to be 38.7% among
men >45 years attending general clinical practice, but the mean age of subjects in this study was 60
years, thus limiting the conclusions of study.14 The ability to relate the symptoms of androgen deficiency
to accurate and reliable laboratory values has obvious clinical implications.

6
© 2013 American Urological Association Education and Research, Inc.
VARIABILITY IN TESTOSTERONE CONCENTRATIONS
Serum T in men shows a wide range of variation, owing to episodic secretion, diurnal variation, glucose
ingestion, week-to-week variation, seasonal variation and type of activities prior to blood draw.15 The
amplitude and diurnal variations in free and bioavailable T levels are similar to those of TT.16, 17 One
report has described a circadian pattern of SHBG levels as well, with peaks occurring in the early
afternoon,17 but this finding has not been corroborated by other studies. Genetic variants in SHBG may
affect TT.18
Serum T levels peak in the early morning, followed by a progressive decline over the course of the day
until they reach their nadir in the evening hours. Nadir values are approximately 15% lower than
morning values, but they may even vary by as much as 50% in younger subjects.19 Therefore, sampling
time is an important consideration when interpreting serum T. Historically it was recommended that
samples be obtained in the morning, between 07:00 and 11:00 hours especially in younger men, but this
approach has been challenged and is often not followed in clinical practice.20, 21 This diurnal pattern is
blunted in older men, and time of measurement may be less important in this age group.16, 22 While it has
been argued that morning T measurements are not necessary in older men due to blunting of the
circadian rhythm, a substantial fraction of older men aged 65 to 80 years who have low serum T in the
afternoon will have normal T concentrations in the morning. 20, 23 Week long night/day shift work does
not seem to change T levels.24 However, in one study, low morning T in rapidly changing shifts was
associated with significant changes in T levels.25 Thus, in men working at night, T should be checked
during off days.
Brambilla et al. showed that “biological” intra-individual variation in T levels of approximately 10% is
observed when samples are collected from the same individual at the same time of the day over several
days.23 Approximately 15% of healthy men may have a T level below the normal assay range in a 24-
hour period. Furthermore, among men with an initial T concentration in the mildly hypogonadal range,
approximately 30% will have a normal T upon repeat measurement.23 Day-to-day variations in T
concentrations can be large enough to render a single T measurement inadequate to accurately

7
© 2013 American Urological Association Education and Research, Inc.
characterize an individual’s levels. Repeated measurement of T may be obtained if an initial laboratory
value does not align with a subject’s signs and symptoms.2
Results of T measurements are affected by patient factors, such as glucose intake, triglyceride levels,
medication taken and initial processing of a sample from blood draw point to analytical laboratory.26
Pre-analytical factors include various technical factors, such as types of collection tubes used to obtain
samples, sample centrifugations, intermediate storage and environmental conditions of sample transport.
For example, storage of serum or plasma in collection tubes following centrifugation can affect the
results of measured T after processing; storage in ethylenediaminetetraacetic acid (EDTA) can adversely
affect SHBG measurement and thereby affect the calculation of free hormones.26 To improve accuracy
of testing, the reader is advised to discuss the type of collection tube and initial processing protocol with
the laboratory they use. The time from blood draw to measurements is an additional factor to consider.
Samples obtained in the morning are typically transported and processed the same day, but samples
drawn in the afternoon may be inappropriately stored for processing on the following day thereby
invalidating specimen and thus measurement results. Effects of the initial processing of a sample may
differ between direct and indirect assays.
Circulating T levels are influenced by a variety of medical conditions, including medications, acute
illness, sexual activity and SHBG concentrations, among many others. These factors must be taken into
consideration when ordering or interpreting any T assay.26, 27 The suppression of T is particularly
profound in men on methadone maintenance therapy due to its long duration of action. Acute illness can
also temporarily but significantly lower serum T. Thus diagnosis of androgen deficiency should not be
made during an acute illness.2
TESTOSTERONE: TOTAL, FREE, AND BIOAVAILABLE
T circulates in the body bound to either SHBG, albumin or corticosteroid binding globulin (CBG), or in
an unbound form (free). SHBG-bound T represents approximately 44% of the TT, is tightly bound and
unavailable to cells. However, albumin-bound T represents approximately 50% of the total
8
© 2013 American Urological Association Education and Research, Inc.
concentration, is weakly bound and dissociates easily and rapidly. CBG-bound T represents 4% of the
TT and, like albumin, is weakly bound and dissociates rapidly. FT represents only about 2-3% of the
TT.28 The term “bioavailable” T refers to the sum of the CBG-bound, albumin-bound and free
components and represents the T fraction that is available to cells. This term should not be confused
with cellular and tissue biological availability of T to bind to androgen receptor and exert its androgenic
action.
SHBG can vary considerably to affect TT levels. Because SHBG-bound T is not bioavailable, TT may
be a poor indicator of the adequacy of circulating androgens available for target organs, but TT is the
recommended initial test to diagnose hypogonadism. Conditions that increase SHBG, including aging,
hyperthyroidism and hepatic cirrhosis, or that decrease SHBG, including obesity, diabetes mellitus and
glucocorticoid use, affect bioavailability of T. (Table 1). The increase in SHBG with age means that
older men may have a normal TT levels, even if they are hypogonadal, as they have low levels of free or
bioavailable T. Conversely, obesity decreases SHBG and TT, even when the bioavailable fraction may
be normal.4
Independent of SHBG levels, some of the features of metabolic syndrome, such as hypertension,
dyslipidemia, insulin resistance and obesity, are commonly present in hypogonadal men.29, 30
Hypogonadotropic hypogonadism occurs frequently in men with T2DM and obesity.31 Measurement of
T in men with metabolic syndrome and symptoms of T deficiency have been suggested, but effect of
weight loss on diagnosis of hypogonadism and the utility of androgen replacement therapy in
symptomatic men continues to be an active area of research.3 A recent longitudinal study by Haring et
al. showed that low T increases risk of developing metabolic syndrome, thus underscoring importance of
early diagnosis of hypogonadism even in young men.32
LABORATORY MEASUREMENT OF TESTOSTERONE
T assays and their interpretation pose several challenges. T concentrations in serum vary more than three
orders of magnitude, depending on age, gender and the presence of disease, and an adequate assay must

9
© 2013 American Urological Association Education and Research, Inc.
be able to maintain accuracy, sensitivity, specificity and linearity over a large range of concentrations.
Thus, one assay may not fit all needs, and clinicians should be aware of performance characteristics of
requested assays, especially in children and hypogonadal men. Other steroids in the circulation that are
of similar structure and are present at high concentrations can lead to difficulties with assay
interpretation due to the interference with T measurements and inaccurate test results. Age, ethnicity and
gender-adjusted normal T concentration ranges using a standardized assay are lacking. Furthermore,
there is no commonly agreed upon and universally used T-calibration laboratory standard in the United
States.5 The US National Institute of Standards and Technology is offering a serum-based reference
material (SRM 971) for calibration and calibration verification. The CDC is offering serum-based
materials for calibration through its Hormone Standardization program, and the Australian National
Metrology Institute is offering pure T as primary calibrator; in addition, state specific quality assurance
programs exist in the United States.
Binding of T to SHBG, albumin and CBG has implications for accurate measurement of T
concentration. Early T assays required T to be extracted or displaced from SHBG and albumin by
dissolution into organic solvents, separated by column or thin layer chromatography and then measured
by radioimmunoassay (RIA). This method offered several advantages, including the separation of
interfering proteins and cross-reacting steroids to increase specificity, and capability to use large serum
aliquots to increase sensitivity. With increased demand for economical and rapid alternatives, initial
chromatography to separate different steroids was omitted and antibodies with better sensitivity and
specificity allowed for the development of modern RIA, which continues to be used in many research
and some clinical laboratories worldwide for the last 30 years.
Unfortunately, RIA is time intensive, expensive and creates environmental challenges due to the need
for disposal of high volumes of radioactive materials. Over the last decade, the laboratory investigation
of TT measurement has evolved from RIA, through automated enzyme-linked immunoassay testing
available in most laboratories, to the new generation of liquid chromatography/mass spectrometry (LC-
MS/MS) methods in reference laboratories and some hospitals. Correlation between these various
methodologies can be poor, and national standardization is underway in this area where the goal is
10
© 2013 American Urological Association Education and Research, Inc.
increased accuracy leading to “portability” and comparability of results obtained from the same
patient.33, 34 From the technological aspects, improvement in T measurement accuracy, defined as
closeness of agreement between a measured quantity value and a true quantity value of an analyte, is a
critical component of the assay’s performance to establish uniform normal ranges. From a clinical
aspect, the same result should be obtained if blood was drawn from the same patient, at the same time
and sent to different laboratories, a scenario that is not common at present. Establishing national external
quality control programs, such as those in Europe or offered through CDC in the United States, may
improve the consistency of assay results across laboratories and help in clinical decision making. As
even the most currently sensitive methods based on MS are prone to technical challenges, a continued
laboratory quality control process has to be implemented.35 Otherwise, performance characteristics of
preferred reference methods may drift down and match the level of unreliability of currently used
assays.35
Radioimmunoassay (RIA)
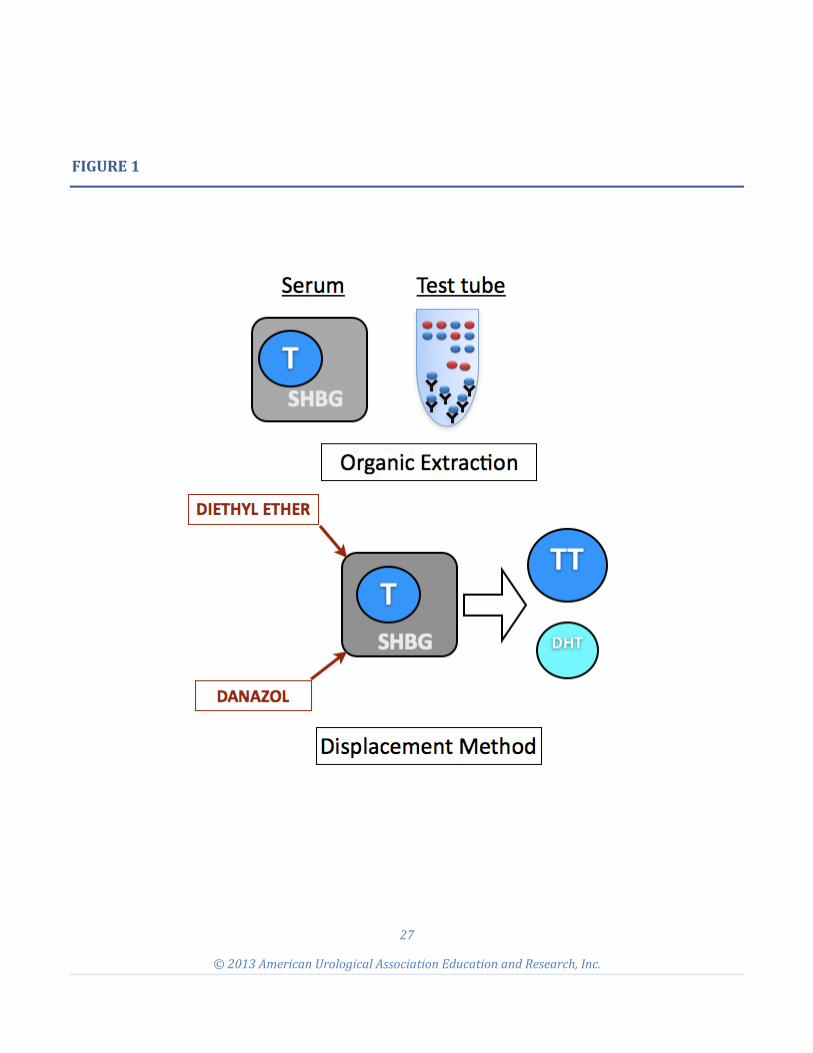
RIAs are based on competitive binding of T to a T-specific antibody after sample pretreatment to
displace T from bound fractions. The patient’s serum is mixed with a set amount of radioactively-
labeled T tracer and a fixed amount of antibody against T. The amount of tracer displaced by the
patient’s T is evaluated by measuring the radioactivity of the sample, and the patient’s T concentration is
calculated (Figure 1).
T RIA requires a specific antibody with minimal cross-reactivity. T is a suboptimal antigen, structurally
similar to other steroids, so the development of an antibody of high specificity for T is difficult. For
commercially available kits, different manufacturers use different sources and types of antibodies
(monoclonal v. polyclonal), which may in turn have different binding affinities to T and varied cross-
reactivities. This contributes to the variable results seen with different commercial kits.
Immunoassays (IAs)
Like RIAs, enzyme immunoassays (EIAs) are also based on the principle of competitive binding of T in
serum and a non-radioactive tracer to a fixed amount of anti-T antibody. The tracer is T-bound to

11
© 2013 American Urological Association Education and Research, Inc.
enzymes like horseradish peroxidase or acetylcholinesterase, which act on their respective substrates
resulting in color change or emission of luminescence. The EIAs for T are sometimes called enzyme
linked immunosorbent assays (ELISAs); however, in both assays the tracer is T-conjugated to assay a
specific enzyme or marker. IAs, similarly to RIAs, depend on high-quality antibodies, but an advantage
of IAs is the elimination of problems with radioactive waste and ease of automatization. EIAs and their
modifications, like electrochemiluminescence, are the most commonly used methods to measure T in
non-reference hospital and commercial laboratories. Commercial IA platforms have adequate accuracy
for eugonal men but not TT levels less than 300 ng/dL (10.4 nm/L) as compared to LC-MS.36
Liquid Chromatography-Mass Spectrometry (LC-MS)
A direct method for qualitatively and quantitatively measuring T includes assessment of the differences
in mass-to-charge ratio (m/z) using MS. T is first eluted from a biological sample matrix by gas
chromatography (GC) or liquid chromatography (LC) and then captured, ionized, accelerated, deflected
and detected by single or tandem MS. Addition of another MS in tandem (MS/MS) is used to quantify
low levels of T in a complex matrix. LC-MS/MS combines automation with high precision, accuracy,
specificity and wide linearity to achieve low column volume (CV) in normoganadal men, but with
concentrations below 300 ng/dL (10.4 nmol/L), CV increases to 14 % even in highly experienced
reference laboratories.37 Thientpont et al. showed that CV of measurements of the same standard
reference sample varied from as low as 1% to as high as 8% in four national reference laboratories in the
United States and Europe.35 Vesper et al. reported measured values between 198 ng/dL to 364 ng/dL
(6.86-12.62 nmol/L) when a standard sample of 299 ng/dL (10.37 nmol/L) was measured by eight
reference laboratories in the United States.37 The difference of -33% and +21% from standard exceeds
intra-individual T variability of 9.3% and illustrates that even with LC-MS/MS men can be over or
underdiagnosed.37 LC-MS/MS requires attention to calibration and between runs quality control. Current
MS assays are developed, optimized and validated in-house using different procedures, instrumentation,
reagents and calibrators. This can lead to differences in individual assay performances and limitations
when comparing results.37 LC- MS/MS requires close attention to quality procedures, national
standardization of procedures and calibrators and traceability to nationally recognized reference standard
to sustain high level of accuracy and reproducibility.38

12
© 2013 American Urological Association Education and Research, Inc.
LABORATORY MEASUREMENT OF TESTOSTERONE FRACTIONS
The simplistic “free hormone hypothesis” assumes that only FT is available to the end-organs and
biologically active at the tissue level,39 hence assays and formulas for various T fractions, including FT,
bioavailable (free and non-specifically bound) and androgen index, have also been developed to help
with diagnosis.40-42
Some laboratories have directly measured bioavailable T by selective ammonium sulfate precipitation of
SHBG bound T.43 Others measure FT by equilibrium dialysis or ultracentrifugation and advocate for this
method as the most accurate assessment of physiologically active circulating hormone fraction.41 As
direct methods to measure FT are technically difficult, calculation derived FT (cFT) and BT are
sufficient in clinical practice as cFT levels correlate highly with FT measured using dialysis.44 Androgen
index and analog RIA for FT (aFT), although recommended by Moreno et al., are considered poor
indicators of androgenization by most authors.45-47 T treatment will affect cFT as shown by Ly et al.48
Free and bioavailable T are helpful in both screening and establishment of diagnosis of hypogonadism in
men with equivocal TT results, but as they rely on accuracy and precision of T and SHBG, statistically
they multiply error in measurement of each of assay used in calculation.
ACCURACY, PRECISION, AND QUALITY CONTROLS OF TESTOSTERONE ASSAYS
An accurate diagnosis of androgen deficiency requires availability of hormone assays with high levels of
specificity, accuracy, precision and broad linearity, performed in clinical laboratories following internal
and external quality procedures. Internal quality control implies that the assay has a high level of
accuracy, precision and reproducibility based on repetitive assays of the same sample or set of samples
within a clinical laboratory. External quality control of assay refers to performance of the assay when
testing reference samples obtained from national programs like the College of American Pathologists
(CAP) or the CDC Hormone Standardization Program. Calibration of an assay offers nationally
available samples with known concentrations and isotope compositions—a critical step in initial
13
© 2013 American Urological Association Education and Research, Inc.
optimization of an assay. The precision of an assay is independent of accuracy as it measures closeness
in agreement between independent results of measurements obtained under stipulated conditions (each
run in duplicate, with two runs per day over 20 days).49 Reproducibility refers to the closeness of
agreement between results of successive measurements obtained under changed conditions (time,
operators, calibrators, reagents and laboratory). Accuracy measures closeness to true value, and
specificity addresses how well an assay detects only a specific substance (T) and does not detect closely
related substances. Sensitivity represents the smallest amount of substance in a sample that can be
accurately measured by an assay.50 Sensitivity is also called low limit of detection and is related to
linearity of the assay–ability to predict unknown concentration from a set of standards.51
The above mentioned parameters of assays are defined by regulatory agencies and professional
organizations in more or less general terms. A number of international quality standards (International
Organization for Standardization (ISO) and Clinical Laboratory Standards Institute (CLSI)),
accreditation agency guidelines (CAP, Joint Commission, U.K. Clinical Pathology Accreditation
(CPA)), and regional laws (Clinical Laboratory Improvement Amendments of 1988 (CLIA'88)) exist
describing the requirements for method verification and validation and other than as prescribed by
applicable laws and regulations at state and federal levels. However, laboratory directors are not
obligated to enroll in specific quality control programs or use calibrator that may be considered optimal
by professional societies. This regulatory complexity brings additional levels of challenges to improve
quality testing in T. T assays, like other reproductive hormone assays, were established in research
laboratories that maintained their own internal quality controls. The increasing use of T assays in routine
clinical practice has increased the demand for the T assays and created a shift to T assays performed in
large-throughput laboratories that employ commercial, random-access, automated platform assays.
The methodological changes required to make the transition to automation and high-throughput can be
associated with a loss in accuracy and linearity for T assays regardless of methodology used. Widely
differing reference ranges reported, both amongst the various automated assays and different
laboratories using same methods, are as much the result of the performance of the assay as the selection
of the index population. Salameh et al. reported a normal T range using LC-MS/MS in a population of

14
© 2013 American Urological Association Education and Research, Inc.
264 male normal volunteers aged 8-90 years enrolled by Quest Diagnostics Institute.44 In this study,
subjects’ health was defined as “apparently healthy, ambulatory, non-medicated” without giving any
specifics as to how samples were derived and criteria for enrollment. This study reported the normal T
range to be between 250-1100 ng/dL for men 18-69 year old and 90-890 ng/dl for men 70 years old and
above. Inter-assay CV was 11% with an accuracy of 102 % at 254 ng/dl. TT normal range for men age
18-39 years was 250-1200 ng/dL in this study. This is in striking contrast with data published by Bhasin
et al., who also using LC-MS/MS reported a 95% confidence interval for healthy men between 18-40
years to be 405 – 1,124 ng/dL with inter-assay CV of 7.7% at 241 ng/dL.52 Assuming average CV of
10% using LC-MS/MS values of TT between 270 ng/dL and 330 ng/dL are consistent with
hypogonadism using 300 ng/dL TT level cut-off point underscoring our statement that even with the
best assays currently available, diagnosis has to be based on clinical picture and not T level alone.
Sikaris et al. enrolled 124 fertile, healthy males (21-35) with normal semen analysis. Serum samples
from young, fertile men were distributed among nationally recognized laboratories using immunoassays
and compared to LC-MS/MS. Using LC-MS/MS, mean TT was 18.2 nmol/L with Q1-Q3 (25%-75%
confidence interval) between 14.6 nmol/L to 21.5 nmol/L. Normal range limits differed by 6% to 37%
when the same serum samples were measured using immunoassays and compared to results obtained
with LC-MS/MS. In this particular paper, authors showed that mathematical transformation of data and
parametric v. non-parametric tests used to calculate normal ranges lead to different cut-off points.53 The
three studies discussed above illustrate that both sample selection and assay performance lead to
variance in reported normal ranges and underscores the need for standardization of selection of index
population and assays used.
There is no uniform standard of reporting the performance characteristics of assays used in studies, thus
it is difficult to compare results and determine how much of variability between different reported
normal ranges originate from the assay itself, especially in samples with low concentration of T. For
example, Wang et al. compared serum T measurements from eugonadal and hypogonadal adult men
with LC-MS versus manual RIAs and four commonly used commercially available immunoassay
platforms.34 Using LC-MS/MS as the preferred method, they found that while some of the manual and
automated assays could be used to assess T in eugonadal men, the majority were unacceptable for

15
© 2013 American Urological Association Education and Research, Inc.
measurement of low T levels (i.e. in hypogonadal men), due to lack of precision and accuracy. Similar
findings have been reported by Taieb et al., who found that immunoassay results varied as much as five-
fold at TT concentrations below 230 ng/dL, and immunoassays generally overestimated T
concentrations in subjects with T values in the low range.33 Validation studies of most T assays are
performed using a standard sample with a T concentration of 400 ng/dL. The sensitivity and specificity
of most assays is not measured at low T levels, the region where the accuracy and precision of the assay
is worse regardless of platform used. At low T levels, as seen in women, children and early male
puberty, serum T levels are comparable to those seen in castrated men. The low reliability and poor
sensitivity of some of commercial T assays in these settings has led the authors to state that some
commercially-available T assays were nearly useless for women and children, and in some cases, these
assays were less accurate than guessing.54
Clinical laboratories employing automated immunoassays should validate the reference ranges, based on
normal healthy men of different ages, rather than using manufacturer-supplied ranges.34 Reference
ranges for commercial T assays are often based on small, convenient population samples not controlled
for medical comorbidities or other factors that may affect sex hormone levels.55 Not surprisingly,
therefore, reference ranges vary significantly between different commercial assays. Historically, the
range of T in healthy young men using assays that utilize extraction and chromatography has
approximated 275-1,000 ng/dL. In contrast, some commercial laboratories have reported the lower limit
of the normal range to be as low as 84 ng/dL and the upper limit of the normal range as high as 1,727
ng/dL.55 An acceptable reference range for T assays should instead be based on a population of healthy
men with verified normal sexual and reproductive function. A recent study by Bhasin et al. showed that
enrolling healthy men is critical to establishment of normal ranges, but neither Bhasin et al. nor Sikaris
et al. have evaluated both sexual and reproductive function using accepted and validated instruments.
To improve precision and accuracy, laboratories should undertake external quality control and
proficiency testing programs through CAP, the CDC Hormone Standardization Program and others as
dictated by federal, state and local regulations. Analysis of recent CAP proficiency survey data revealed
that most currently available T assays missed these analytical performance goals of imprecision of 5.3%
16
© 2013 American Urological Association Education and Research, Inc.
and total error of 16.7% by wide margins.38 What is interesting is that 2/4 LC-MS/MS assays failed to
meet established quality criteria underscoring that it is not the technology but day-to-day good
laboratory practices that are the critical factors for the future improvements in T testing.38 This
magnitude of variability is of little value in clinical medicine.
The laboratory diagnosis of T deficiency may, therefore, be confounded by limitations of both internal
and external validation. An understanding of the assays employed by one’s specific laboratory, as well
as an appreciation for population-specific reference ranges, is key for accurate clinical diagnosis.
FUTURE RESEARCH AND AREAS OF IMPROVEMENT
Reproducible T assays that reflect accurate serum concentrations and referenced to well-defined healthy
population are important in order to correctly diagnose hypogonadism. Over the past 30 years, T assays
have progressively become more economical, rapid and automated. However, scientific data suggests
that most T measurements in typical clinical laboratories may be ≥30% different from the “true” serum
T concentrations measured using the preferred reference method. This leads to diagnostic and
management dilemmas as insurance carriers will often require TT levels below 300 ng/dL to pay for T
replacement therapy.
The poor reliability of T measurement is secondary to a combination of factors, including technical
limitations of currently available assays, intra-individual variation and the wide range of T levels in
human samples.
The AUA is a major stakeholder in efforts to create standardization of T assays. Widespread enrollment
of clinical laboratories in accuracy-based programs, such as the CDC HoSt program, is a critical element
to improve the quality. Use of standards and calibrators traceable to preferred reference methods is
critical for “portability” of results in the same individual between different clinical laboratories. The
AUA is actively involved in studies aiming to define normal ranges using standardized tests and clinical
signs and symptoms. Normal ranges need to be established in normal healthy patients of varying ages
17
© 2013 American Urological Association Education and Research, Inc.
with normal sexual and reproductive function. Calibration of the methodology and population-based
reference ranges for FT is also needed. Increased accuracy in the measurement of T and SHBG will lead
to improvement in calculations of free- and bioavailable T.
The AUA and members of the panel suggest that the scientific community and manufacturers of assays
should follow similar standards of reporting. Specifically, the studies should be performed using well
defined, described and representative populations, and accepted and validated instruments to assess
sexual function and fertility should be used. Uniform reporting of precision, accuracy and
reproducibility across hypogonadal and normogonadal men (i.e., T levels <200 ng/dL, 200-299 ng/dL,
300-399 ng/dL, > 400 ng/dL) should be implemented. Traceability of standards and calibrators used to
assess accuracy and to adjust assays should be disclosed. Description of the mathematical
transformation of data and reporting using both parametric and non-parametric tests should be included
in manuscripts and manufactures’ documentation. Such approaches will lead to better increased ability
to compare results between different platforms and studies.
At this point, no specific assay can be recommended as superior, but each assay should be compared to
minimum standards of accuracy based on biological variation. The CDC HoSt program reports that out
of five assays that passed CDC standard for T testing, four are based on LC-MS/MS, and one is an
immunoassay.38 This data support our decision to not assign superiority to a specific platform but to
emphasize that each platform should meet similar standards of accuracy, precision and bias.38
Position statement: Based on the extensive review of published data and input from professional
organizations, the members of this panel believe that, for now, diagnosis of hypogonadism should be
based as much on the presence of signs and symptoms as on serum T measurement. Based on overall
poor quality of T testing in most clinical laboratories and age bias of published reference ranges, no
patient should be denied coverage for treatment based solely on payer defined cut-off points if need for
such treatment is established by a health professional. The AUA works closely with regulatory and
professional agencies to improve assay performance and normal range, and as literature accumulates,
this position will be reevaluated.
18
© 2013 American Urological Association Education and Research, Inc.
In summary, it is in our and our patients’ best interest to favor the advancement of the technological and
clinical aspects of the biochemical diagnosis of hypogonadism to provide reliable, cost-effective and
portable tools to aid clinicians in the diagnosis and treatment of this common condition.56 We
encourage urologists and andrologists to discuss methodology and source of reference values with
laboratory directors at their institutions to better understand limitations and advantages of local assays
and to improve patient care.
REFERENCES
1. Vesper HW, Botelho JC, Shacklady C et al: CDC project on standardizing steroid hormone
measurements. Steroids 2008; 73:1286.
2. Bhasin S, Cunningham G, Hayes FJ et al: Testosterone therapy in men with androgen deficiency
syndromes: an Endocrine Society clinical practice guideline. J Clin Endocrinol Metab 2010; 95:
2536.
3. Wang C, Nieschlag E, Swerdloff R et al: Investigation, treatment, and monitoring of late-onset
hypogonadism in males: ISA, ISSAM, EAU, EAA, and ASA recommendations. J Androl 2009;
30:1.
4. Hellstrom JG, Paduch D and Donatucci CF: Importance of hypogonadism and testosterone
replacement in current urologic practice: a review. Int Urol Nephrol 2010; Epub ahead of print.
5. Rosner W, Auchis RJ, Azziz R et al: Position statement: utility, limitations, and pitfalls in measuring
testosterone: an Endocrine Society Position Statement. J Clin Endocrinol Metab 2007; 92: 405.
19
© 2013 American Urological Association Education and Research, Inc.
6. Dechaud H, Lejeune H, Garoscio-Cholet M et al: Radioimmunoassay of testosterone not bound to
sex-steroid-binding protein in plasma. Clin Chem 1989; 35: 1609.
7. Ohlsson C, Barrett-Connor E, Bhasin S et al: High serum testosterone is associated with reduced risk
of cardiovascular events in elderly men. The MrOS (Osteoporotic Fractures in Men) study in
Sweden. J Am Coll Cardiol 2011; 58: 1674.
8. Orwoll E, Blank JB, Barrett-Connor E et al: Design and baseline characteristics of the osteoporotic
fractures in men (MrOS) study--a large observational study of the determinants of fracture in older
men. Contemp Clin Trials 2005; 26: 569.
9. Lee DM, O'Neill TW, Pye SRet al: The European Male Ageing Study (EMAS): design, methods and
recruitment. Int J Androl 2009; 32: 11.
10. Araujo AB, Esche GR, Kupelian V et al: Prevalence of symptomatic androgen deficiency in men. J
Clin Endocrinol Metab 2007; 92: 4241.
11. Harman SM, Metter EJ, Tobin JD et al: Longitudinal effects of aging on serum total and FTlevels in
healthy men. J Clin Endocrinol Metab 2001; 86: 724.
12. Wu FCW, Tajar A, Beynon J et al: Identification of late-onset hypogonadism in middle-aged and
elderly men. NEJM 2010; 363: 123.
13. Feldman HA, Longcope C, Derby CA et al: Age trends in the level of serum testosterone and other
hormones in middle-aged men: longitudinal results from the Massachusetts Male Aging Study. L
Clin Endocrinol Metab 2002; 87: 589.
20
© 2013 American Urological Association Education and Research, Inc.
14. Mulligan T, Frick MF, Zuraw QC et al: Prevalence of hypogonadism in males aged at least 45 years:
the HIM study. Int J Clin Pract 2006; 60: 762.
15. Cunningham GR and Toma SM: Why is androgen replacement in males controversial? J Clin
Endocrinol Metab 2011; 96: 38.
16. Brambilla DJ, Matsumoto AM, Araujo AB et al: The effect of diurnal variation on clinical
measurement of serum testosterone and other sex hormone levels in men. J Clin Endocrinol Metab
2009; 94: 907.
17. Plymate SR, Tenover JS and Bremner WJ: Circadian variation in Testosterone, sex-hormone binding
globulin, and calculated non-sex hormone binding globulin bound testosterone in healthy young and
elderly men. J Androl 1989; 10: 366.
18. Ohlsson C, Wallaschofski H, Lunetta KL et al: Genetic determinants of serum testosterone
concentrations in men. PLoS Genet 2011; 7: e1002313.
19. Winters SJ: Laboratory Assessment of Testicular Function. In: Endotext. http://www.endotext.com.
20. Crawford ED, Barqawi AB, O'Donnell C et al: The association of time of day and serum
testosterone concentration in a large screening population. BJU Int 2007; 100: 509.
21. Diver MJ, Imtiaz KE, Ahmad AM et al: Diurnal rhythms of serum total, free, and bioavailable
testosterone and of SHBG in middle-aged men, compared with those in younger men. Clin
Endocrinol 2003; 58: 710.
21
© 2013 American Urological Association Education and Research, Inc.
22. Bremner WJ, Vitiello MV and Prinz PN: Loss of circadian rythmicity in blood testosterone levels
with aging in normal men. J Clin Endocrinol Metab 1983; 56: 1278.
23. Brambilla DJ, O’Donnell AB, Matsumoto AM et al: Intra-individual variation in levels of serum
testosterone and other reproductive and adrenal hormones in men. Clin Endocrinol 2007; 67: 853.
24. Smith AM, Morris P, Rowell KO et al: Junior doctor and the full shift rota-psychological and
hormonal changes: a comparative cross-sectional study. Clin Med 2006; 6: 174.
25. Axelsson J, Akerstedt T, Kecklund G et al: Hormonal changes in satisfied and dissatisfied shift
workers across a shift cycle. J Appl Physiol 2003; 95: 2099.
26. Raff H and Sluss PM: Pre-analytical issues for testosterone and estradiol assays. Steroids 2008; 73:
1297.
27. Bolyakov A, Raymond S, Vaucher L et al: Changes in serum in reproductive hormones in
neurotransmitters during arousal, ejaculation, and orgasm in normal volunteers. J Urol 2010;
183:468.
28. De Ronde W, van der Schouw YT, Pols HAP et al: Calculation of bioavailable and free testosterone
in men: a comparison of 5 published algorithms. Clin Chem 2006; 52: 1777.
29. Kupelian V, Page ST, Araujo AB et al: Low sex-hormone binding globulin, total testosterone, and
symptomatic androgen deficiency are associated with development of the metabolic syndrome in
nonobese men. J Clin Endocrinol Metab 2006; 91: 843.

22
© 2013 American Urological Association Education and Research, Inc.
30. Kalyani RR and Dobs AS: Androgen deficiency, diabetes, and the metabolic syndrome in men. Curr
Opin Endocrinol Diab Obes 2007; 14: 226.
31. Dhindsa S, Prabhakar S, Sethi M et al: Frequent occurrence of hypogonadotropic hypogonadism in
type 2 diabetes. J Clin Endocrinol Metab 2004; 89: 5462.
32. Haring R, Volzke H, Felix SB et al: Prediction of metabolic syndrome by low serum testosterone
levels in men: results from the study of health in Pomerania. Diabetes 2009; 58: 2027.
33. Taieb J, Mathian B, Millot F et al: Testosterone measured by 10 immunoassays and by isotope-
dilution gas chromatography-mass spectrometry in sera from 116 men, women, and children.
Clinical Chemist 2003; 49: 1381.
34. Wang C, Catlin DH, Demers LM et al: Measurement of total serum testosterone in adult men:
comparison of current laboratory methods versus liquid chromatography-tandem mass spectrometry.
J Clin Endocrinol Metab 2004; 89: 534.
35. Thienpont LM, Van Uytfanghe K, Blincko S et al: State-of-the-art of serum testosterone
measurement by isotope dilution-liquid chromatography-tandem mass spectrometry. Clinical
Chemist 2008; 54:1290.
36. Owen WE, Rawlins ML and Roberts WL: Selected performance characteristics of the Roche Elecsys
testosterone II assay on the Modular analytics E 170 analyzer. Clinica chimica acta; international
journal of clinical chemistry. 2010; 411: 1073.
37. Vesper HW, Bhasin S, Wang C et al: Interlaboratory comparison study of serum total testosterone
[corrected] measurements performed by mass spectrometry methods. Steroids 2009; 74: 498.

23
© 2013 American Urological Association Education and Research, Inc.
38. Yun YM, Botelho JC, Chandler DW et al: Performance Criteria for Testosterone Measurements
Based on Biological Variation in Adult Males: Recommendations from the Partnership for the
Accurate Testing of Hormones. Clinical Chemist 2012; Epub.
39. Herzog AG and Levesque LA: Testosterone, free testosterone, nonsex hormone binding globulin,
and free androgen index: which testosterone measurement is most relevant to reproduction and
sexual function in men with epilepsy? Arch Neurol 1992; 49: 133.
40. Mendel CM: The free hormone hypothesis: a physiologically based mathematical model. Endocrine
Reviews 1989; 10: 232.
41. Vermeulen A, Stoica T and Verdonck L: The apparent free testosterone concentration, an index of
androgenicity. J Clin Endocrinol Metab 1971; 33: 759.
42. Sodergard R, Backstrom T, Shanbhag V et al: Calculation of free and bound fractions of testosterone
and estradiol-17 beta to human plasma proteins at body temperature. J Steroid Biochem 1982; 16:
801.
43. O'Connor S, Baker HW, Dulmanis A et al: The measurement of sex steroid binding globulin by
differential ammonium sulphate precipitation. J Steroid Biochem 1973; 4: 331.
44. Salameh WA, Redor-Goldman MM, Clarke NJ et al: Validation of a total testosterone assay using
high-turbulence liquid chromatography tandem mass spectrometry: total and free testosterone
reference ranges. Steroids 2010; 75:169.
24
© 2013 American Urological Association Education and Research, Inc.
45. Moreno SA, Shyam A and Morgentaler A: Comparison of free testosterone results by analog
radioimmunoassay and calculated free testosterone in an ambulatory clinical population. J Sex Med
2010; 7: 1948.
46. Diver MJ: Analytical and physiological factors affecting the interpretation of serum testosterone
concentration in men. Ann Clin Biochem 2006; 43: 3.
47. Swerdloff RS and Wang C: Free testosterone measurement by the analog displacement direct assay:
old concerns and new evidence. Clinical Chemist 2008; 54: 458.
48. Ly LP, Sartorius G, Hull L et al: Accuracy of calculated free testosterone formulae in men. Clinical
Endocrinol 2010; 73: 382.
49. Chesher D: Evaluating assay precision. The Clinical biochemist Reviews / Australian Association of
Clinical Biochemists. 2008; 29:S23.
50. Nichols JH: Verification of method performance for clinical laboratories. Adv Clin Chem 2009;
47:121.
51. Jhang JS, Chang CC, Fink DJ et al: Evaluation of linearity in the clinical laboratory. Arch PAthol
Lab Med 2004; 128: 44.
52. Bhasin S, Pencina M, Jasuja GK et al: Reference ranges for testosterone in men generated using
liquid chromatography tandem mass spectrometry in a community-based sample of healthy
nonobese young men in the Framingham Heart Study and applied to three geographically distinct
cohorts. J Clin Endocrinol Metab 2011; 96: 2430.
25
© 2013 American Urological Association Education and Research, Inc.
53. Sikaris K, McLachlan RI, Kazlauskas R et al: Reproductive hormone reference intervals for healthy
fertile young men: evaluation of automated platform assays. J Clin Endocrinol Metab 2005; 90:
5928.
54. Herold DA and Fitzgerald RL: Immunoassays for testosterone in women: better than a guess? Clin
Chem 2003; 49: 1250.
55. Bhasin S, Zhang A, Coviello A et al: The impact of assay quality and reference ranges on clinical
decision making in the diagnosis of androgen disorders. Steroids 2008; 73: 1311.
56. Mehta A, Paduch DA: The Laboratory Diagnosis of Testosterone Deficiency. In Hellstrom, W. J. G.
(2012). Androgen deficiency and testosterone replacement: current controversies and strategies. New
York, Springer.
26
© 2013 American Urological Association Education and Research, Inc.
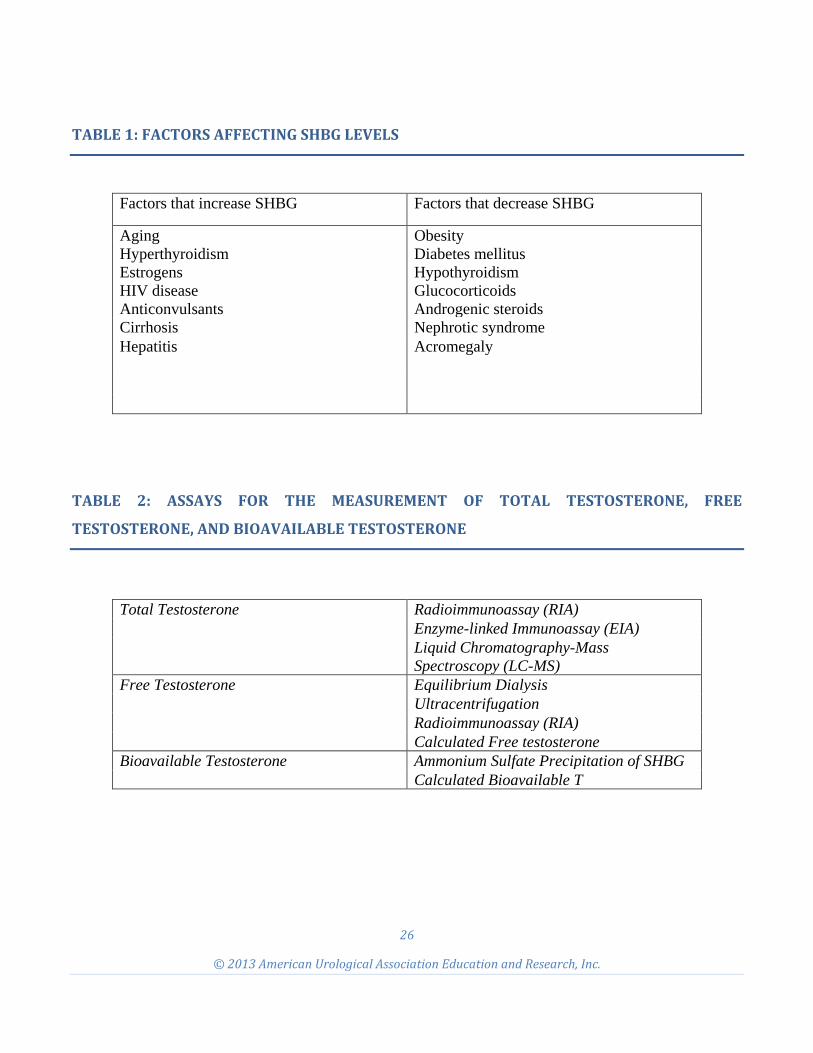
TABLE 1: FACTORS AFFECTING SHBG LEVELS
Factors that increase SHBG Factors that decrease SHBG
Aging Hyperthyroidism Estrogens HIV disease Anticonvulsants
Obesity Diabetes mellitus Hypothyroidism Glucocorticoids Androgenic steroids
Cirrhosis Nephrotic syndrome Hepatitis Acromegaly
TABLE 2: ASSAYS FOR THE MEASUREMENT OF TOTAL TESTOSTERONE, FREE
TESTOSTERONE, AND BIOAVAILABLE TESTOSTERONE
Total Testosterone Radioimmunoassay (RIA)
Enzyme-linked Immunoassay (EIA) Liquid Chromatography-Mass Spectroscopy (LC-MS)
Free Testosterone Equilibrium Dialysis Ultracentrifugation Radioimmunoassay (RIA) Calculated Free testosterone
Bioavailable Testosterone Ammonium Sulfate Precipitation of SHBG Calculated Bioavailable T
27
© 2013 American Urological Association Education and Research, Inc.
FIGURE 1