The Korea-USA FTA and Its Economic Impact
38
The Korea-USA FTA and Its Economic Impact PRESENTED BY: LILI, ZESHAN AND ABDULLAH PUKYONG, NATIONAL UNIVERSITY, INTERNATIONAL & AREA STUDIES DEPARTMENT
-
Upload
pukyong-national-university -
Category
Economy & Finance
-
view
275 -
download
3
Transcript of The Korea-USA FTA and Its Economic Impact

The Korea-USA FTA and Its Economic Impact
PRESENTED BY: LILI, ZESHAN AND ABDULLAH
PUKYONG, NATIONAL UNIVERSITY,INTERNATIONAL & AREA STUDIES DEPARTMENT

CONTENT OF STUDY Introduction History of FTA (Free Trade Agreement) Current Trade Scenario Model Data Different Policy Scenarios:
Scenario 1: 50% cut in tariffScenario 2: 75% cut in tariffScenario 3: (i) 100% cut in manufacturing sector (ii) 95% cut in agriculture sector by Korea (iii) 95% cut in textile sector by USA
Empirical Results: (i) Macroeconomic Results (ii) Microeconomic Results
Conclusion

INTRODUCTION – WHAT EFFECTS WILL BRING?
The KORUS FTA is the second-largest USA FTA (next to NAFTA). The USA International Trade Commission estimates that the reduc-
tion of Korean tariffs and tariff-rate quotas on goods alone will add $10 billion to $12 billion to annual USA Gross Domestic Product and around $10 billion to annual merchandise exports to Korea.
On the other hand, Korea’s exports to USA would increase by $6.4 billion to $6.9 billion, primarily in textiles, apparel, leather products, footwear, machinery, electronics, and passenger vehicles and parts (USITC, 2007).
Under the KORUS Agreement, over 95 percent of bilateral trade in consumer and industrial products would become duty free within five years of the date the agreement enters into force, and most re-maining tariffs would be eliminated within 10 years.

INTRODUCTION – WHAT EFFECTS WILL BRING? For agricultural products, the FTA will immediately eliminate or phase
out tariffs and quotas on a broad range of products, with almost two-thirds (by value) of Korea's agriculture imports from the United States becoming duty free upon entry into force.
The KORUS Agreement would also open Korea’s $560 billion services market to highly competitive American companies, supporting jobs for American workers in sectors ranging from delivery and telecommuni-cations services to education and health care services.
FTA would eventually lead to a 0.42% to 0.59% increase in South Ko-rea’s GDP according to a static analysis, and 1.99% to 2.27% accord-ing to a dynamic analysis (Korea Institute for International Economic Policy, 2005).
Overall, USA-Korea goods and services trade has risen from $126.5 billion in 2011 to $145.2 billion in 2014.

HISTORY OF FTA(SOURCE: OFFICE OF THE UNITED STATES TRADE REPRESENTATIVE, GOVERNMENT OF USA)
June 5, 2006The United States and the Republic of Korea Began negations for the
USA-Korea FTA (Free Trade Agreement)
June 30, 2007The USA and Korea signed the USA-
Korea FTAJune 26, 2010
President Barack Obama and President Lee Myung-bak expressed renewed
commitment to the treaty, stating that they would direct their governments to
resolve remaining obstacles to the agreement by November2010. February 10,2011
The USA and Korea signed letters on new agreements designed to more
passages of the agreement forward.October 12, 2011
The USA Congress approved the agreement.
November 22, 2011The Korean National Assembly
approved the agreement.February 21, 2012
The USA and Korea completed their review of the measures both sides
had taken to implement the FTA and exchanged diplomatic notes on
agreeing to bring the agreement into force.
March 15,2012USA-Korea FTA Implemented

TOP EXPORT BENEFICIARY ITEMS (USA TO KOREA): 2014 (SOURCE: EMBASSY OF THE REPUBLIC OF KOREA IN WASHINGTON, DC )
Commodity Pre-KORUS Tariff Elimination ScheduleGrowth Be-tween 2011 and 2014
Exports to Ko-rea (2013)
Machines for manufacturing semiconductor de-vices
8% eliminated immediately or over 10 years 41.20% $2.2 billion
Motor cars & vehicles for transporting per-sons 8% eliminated over 5 years 142.70% $1 billion
Medicaments 8% eliminated immediately or over 3 yearsated over 15 years 90.90% $758.2 million
Petrol and bitum mineral oil (not crude) 3% or 5% eliminated immediately 558.60% $670.2 millionFrozen beef (bone-in) 40% eliminated over 15 years 71.40% $365 million
Food preparations 8%, 30% or 754.3% being eliminated im-mediately or over 10 years 18.80% $255 million
Parts of taps, cocks, valves for pipes 8% eliminated over 5 years 532.90% $216.8 millionBeauty & skin care preparation 6.5% eliminated immediately or over 10
years 30.10% $208 millionAlmonds (shelled and in shell) 8% eliminated immediately 174.40% $204.4 million
Fresh cheese (e.g. mozzarella, cream cheese)
36% eliminated over 15 years575.50% $199.4 million(0% tariff applied for quantity less than
7,000t)

CURRENT TRADE SCENARIO:USA TRADE IN GOODS WITH KOREA (USD BILLIONS)
Exports Imports Balance
-30.0
-20.0
-10.0
0.0
10.0
20.0
30.0
40.0
50.0
60.0
70.0
36.8
60.7
-24.0
37.1
57.2
-20.1
20152014
Source: United States Census Bureau

USA TRADE IN GOODS WITH KO-REA (USD BILLIONS)
2015 2014 2013 2012 2011 2010
-30.0
-20.0
-10.0
0.0
10.0
20.0
30.0
40.0
50.0
60.0
70.0
36.8 37.1 33.9 35.8 36.0
32.2
60.7 57.2
52.5 49.5 47.3
40.0
-24.0 -20.1 -18.6
-13.7 -11.3
-7.8
ExportsImportsBalance
Sources: United States Census Bureau

USA TRADE IN GOODS WITH KOREA (USD MILLIONS)
Jan/85
Jul/86
Jan/88
Jul/89
Jan/91
Jul/92
Jan/94
Jul/95
Jan/97
Jul/98
Jan/00
Jul/01
Jan/03
Jul/04
Jan/06
Jul/07
Jan/09
Jul/10
Jan/12
Jul/13
Jan/15
-4,000.00
-2,000.00
0.00
2,000.00
4,000.00
6,000.00
8,000.00
Exports
Imports
Balance
Sources: United States Census Bureau

Source: GTAP Modeling Lec Professor Dr. Ko Jong-Hwan
Regional Household
PrivateHousehold
SavingGovernment
Producer
Rest of World
SaveTaxTax
PRIVEXPVOAEndow
Tax GOVEXP
MTax
XTax
VDPA
VIPA
VDGA
VIGA
NETINV
VIFA VXMDVDFA
GTAP MODEL
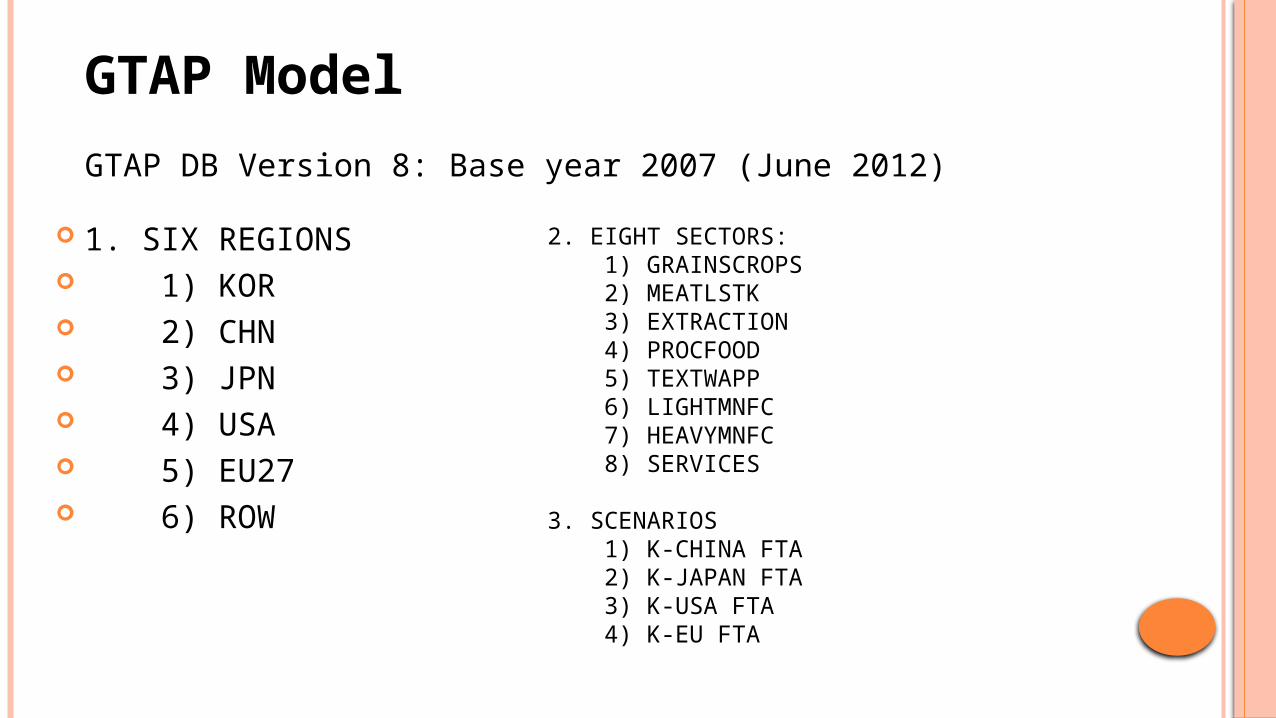
2. EIGHT SECTORS: 1) GRAINSCROPS 2) MEATLSTK 3) EXTRACTION 4) PROCFOOD 5) TEXTWAPP 6) LIGHTMNFC 7) HEAVYMNFC 8) SERVICES
3. SCENARIOS 1) K-CHINA FTA 2) K-JAPAN FTA 3) K-USA FTA 4) K-EU FTA
1. SIX REGIONS 1) KOR 2) CHN 3) JPN 4) USA 5) EU27 6) ROW
GTAP Model GTAP DB Version 8: Base year 2007 (June 2012)

BASIC TRADE FACTS: SECTORAL IMPORT SHARES (%)
GrainsCrops MeatLstk Extraction ProcFood TextWapp LightMnfc HeavyMnfc Services0.0
10.0
20.0
30.0
40.0
50.0
60.0
70.0
0.1 0.0 0.1 0.73.2
19.9
66.2
9.8
3.71.1 1.4 2.4 1.2
20.4
45.3
24.4
KOR USA

IMPORTS SHARES BY COUNTRY (%)
KOR CHN JPN USA EU27 ROW0.0
10.0
20.0
30.0
40.0
50.0
60.0
0.0
17.315.2
13.711.5
42.3
2.5
15.3
7.0
0.0
20.9
54.3
KOR USA

SECTORAL EXPORTS SHARES (%)
GrainsCrops MeatLstk Extraction ProcFood TextWapp LightMnfc HeavyMnfc Services0
5
10
15
20
25
30
35
40
45
50
1.3 0.8
21.2
2.1 2.4
7.4
47.2
17.7
1 0.5
12.7
2.64.6
22.5
41.3
14.7
KOR USA

EXPORTS SHARES BY COUNTRY (%)
KOR CHN JPN USA EU27 ROW0.0
10.0
20.0
30.0
40.0
50.0
60.0
0.0
17.315.3 14.0
11.7
41.8
2.5
15.2
7.1
0.0
21.2
54.0
KOR USA

SIMULATION RESULTS: MACROECONOMIC EFFECTS Change in Korea's GDP (% Change)
SC1 SC2 SC30.00
0.10
0.20
0.30
0.40
0.50
0.60
0.22
0.35
0.51

CHANGE IN USA'S GDP (% CHANGE)
SC1 SC2 SC3
-0.0006
-0.0005
-0.0004
-0.0003
-0.0002
-0.0001
0.0000
0.0001
0.0002
0.0001
-0.0002
-0.0005
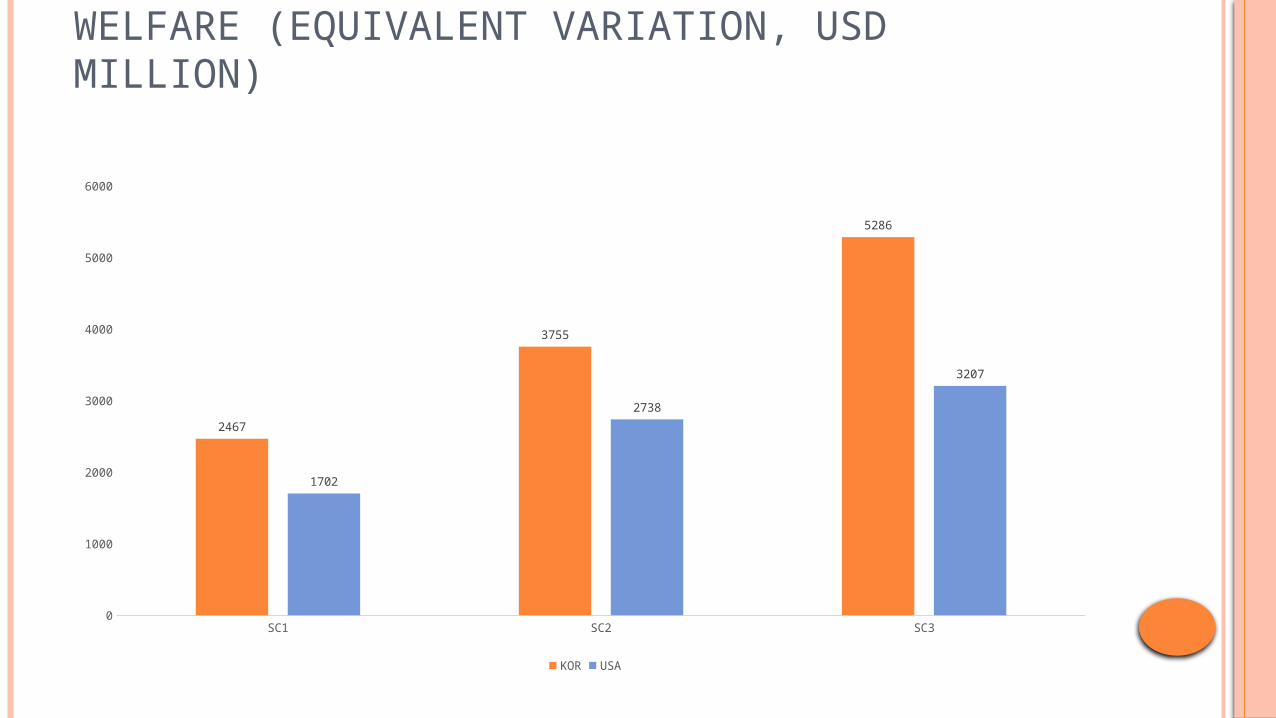
WELFARE (EQUIVALENT VARIATION, USD MILLION)
SC1 SC2 SC30
1000
2000
3000
4000
5000
6000
2467
3755
5286
1702
2738
3207
KOR USA
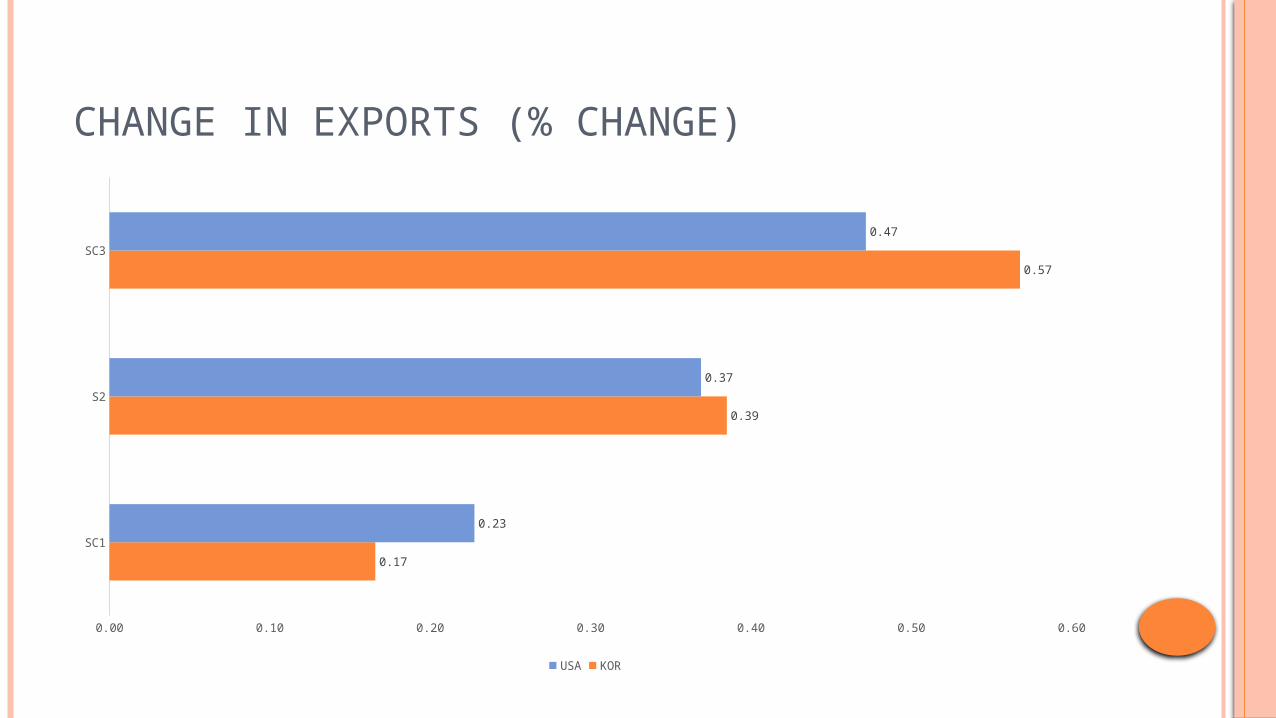
CHANGE IN EXPORTS (% CHANGE)
SC1
S2
SC3
0.00 0.10 0.20 0.30 0.40 0.50 0.60
0.17
0.39
0.57
0.23
0.37
0.47
USA KOR
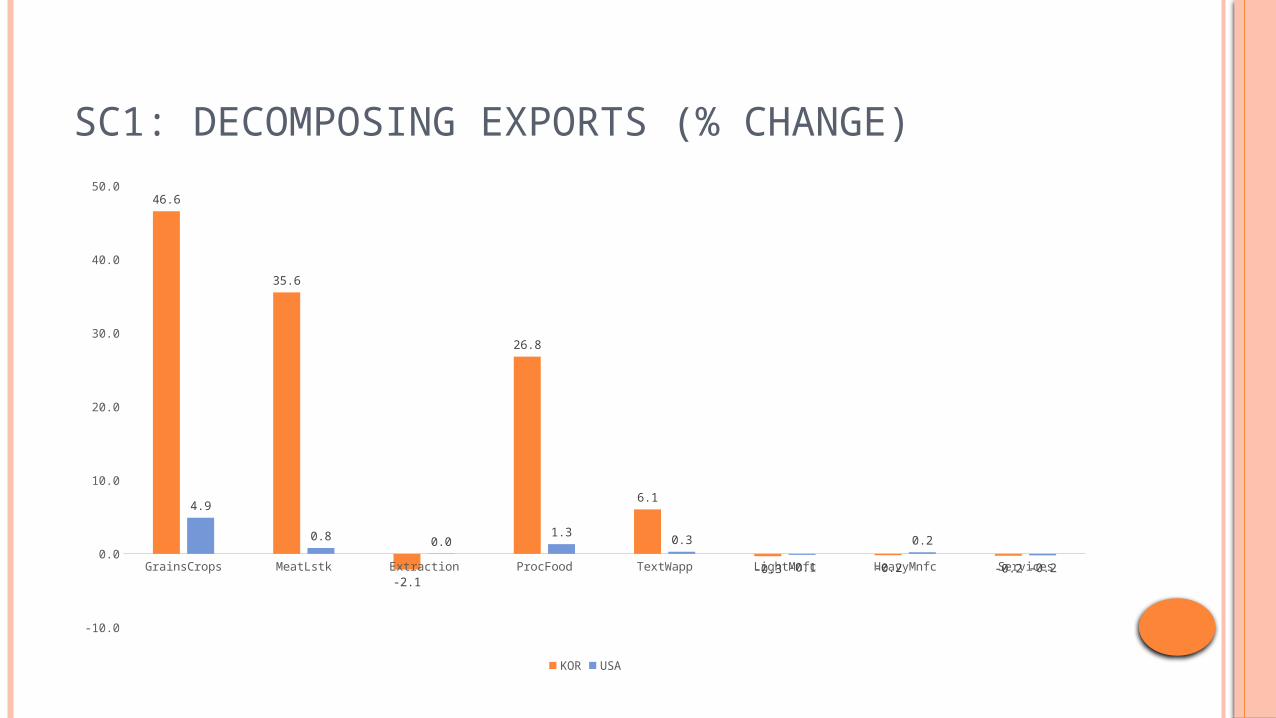
SC1: DECOMPOSING EXPORTS (% CHANGE)
GrainsCrops MeatLstk Extraction ProcFood TextWapp LightMnfc HeavyMnfc Services
-10.0
0.0
10.0
20.0
30.0
40.0
50.046.6
35.6
-2.1
26.8
6.1
-0.3 -0.2 -0.2
4.9
0.8 0.0 1.3 0.3-0.1
0.2-0.2
KOR USA

SC2: DECOMPOSING EXPORTS (% CHANGE)
GrainsCrops MeatLstk Extraction ProcFood TextWapp LightMnfc HeavyMnfc Services
-20.0
0.0
20.0
40.0
60.0
80.0
100.0
120.0
102.4
76.8
-3.8
54.0
10.5
-0.5 -0.3 -0.3
8.51.0 0.1 2.2 0.5
-0.20.3
-0.3
KOR USA

SC3: DECOMPOSING EXPORTS (% CHANGE)
GrainsCrops MeatLstk Extraction ProcFood TextWapp LightMnfc HeavyMnfc Services
-50.0
0.0
50.0
100.0
150.0
200.0
175.3
131.1
-6.1
79.6
14.2
-0.8 -0.4 -0.4
12.01.1
-0.2 -2.1 -0.8 -0.20.6
-0.3
KOR USA

CHANGE IN IMPORTS (% CHANGE)
SC1
SC2
SC3
0.00 0.50 1.00 1.50 2.00 2.50
0.70
1.36
1.96
0.18
0.29
0.35
USA KOR
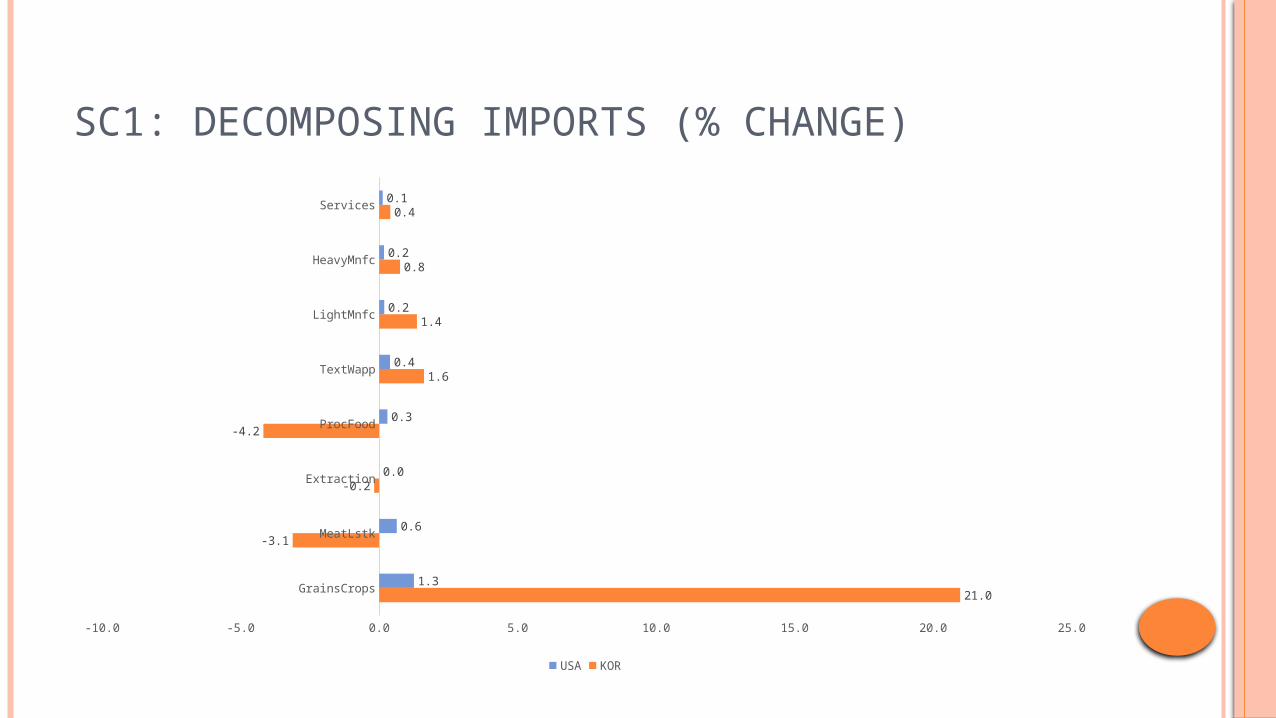
SC1: DECOMPOSING IMPORTS (% CHANGE)
GrainsCrops
MeatLstk
Extraction
ProcFood
TextWapp
LightMnfc
HeavyMnfc
Services
-10.0 -5.0 0.0 5.0 10.0 15.0 20.0 25.0
21.0
-3.1
-0.2
-4.2
1.6
1.4
0.8
0.4
1.3
0.6
0.0
0.3
0.4
0.2
0.2
0.1
USA KOR

SC2: DECOMPOSING IMPORTS (% CHANGE)
GrainsCrops
MeatLstk
Extraction
ProcFood
TextWapp
LightMnfc
HeavyMnfc
Services
-20.0 -10.0 0.0 10.0 20.0 30.0 40.0 50.0 60.0
53.2
-6.7
-0.2
-7.3
2.7
2.2
1.2
0.6
2.2
1.0
0.0
0.5
0.7
0.3
0.3
0.2
USA KOR

SC3: DECOMPOSING IMPORTS (% CHANGE)
GrainsCrops
MeatLstk
Extraction
ProcFood
TextWapp
LightMnfc
HeavyMnfc
Services
-40.0 -20.0 0.0 20.0 40.0 60.0 80.0 100.0 120.0
94.3
-10.6
-0.3
-19.3
2.8
3.0
1.7
0.8
2.8
1.3
0.0
0.5
0.8
0.3
0.3
0.2
USA KOR

TERMS OF TRADE
SC1 SC2 SC30.00
0.02
0.04
0.06
0.08
0.10
0.12
0.14
0.16
0.18
0.05
0.04
0.02
0.09
0.14
0.17
KOR USA

MICROECONOMIC EFFECTS: SC1: DOMESTIC PRODUCTION BY SECTOR
GrainsCrops MeatLstk Extraction ProcFood TextWapp LightMnfc HeavyMnfc Services CGDS
-8.00
-6.00
-4.00
-2.00
0.00
2.00
4.00
6.00
8.00
-6.79
4.22
-0.01
6.29
2.79
-0.23 -0.36
0.150.710.92
-0.05 -0.040.02
-0.19 -0.08 -0.01 0.000.02
KOR USA

SC2: DOMESTIC PRODUCTION BY SECTOR
GrainsCrops MeatLstk Extraction ProcFood TextWapp LightMnfc HeavyMnfc Services CGDS
-20.00
-15.00
-10.00
-5.00
0.00
5.00
10.00
15.00
-14.42
8.26
0.07
12.17
4.88
-0.33 -0.55
0.251.231.58
-0.11 -0.060.02
-0.30 -0.12 -0.03 0.000.03
KOR USA

SC3: DOMESTIC PRODUCTION BY SECTOR
GrainsCrops MeatLstk Extraction ProcFood TextWapp LightMnfc HeavyMnfc Services CGDS
-30.00
-20.00
-10.00
0.00
10.00
20.00
30.00
-24.83
12.92
0.19
19.92
6.93
-0.42 -0.77
0.391.762.17
-0.21 -0.06 -0.27 -0.52 -0.140.01
0.000.03
KOR USA

SC1: CHANGE IN VALUE ADDED (%)
GrainsCrops MeatLstk Extraction ProcFood TextWapp LightMnfc HeavyMnfc Services
-8.0
-6.0
-4.0
-2.0
0.0
2.0
4.0
6.0
8.0
-6.8
4.2
0.0
6.3
2.8
-0.2 -0.4
0.10.9
0.0 0.00.0
-0.2 -0.1 0.0 0.0
KOR USA

SC2: CHANGE IN VALUE ADDED (%)
GrainsCrops MeatLstk Extraction ProcFood TextWapp LightMnfc HeavyMnfc Services
-20.0
-15.0
-10.0
-5.0
0.0
5.0
10.0
15.0
-14.4
8.3
0.1
12.2
4.9
-0.3 -0.6
0.31.6
-0.1 -0.10.0
-0.3 -0.1 0.0 0.0
KOR USA

SC3: CHANGE IN VALUE ADDED (%)
GrainsCrops MeatLstk Extraction ProcFood TextWapp LightMnfc HeavyMnfc Services
-30.0
-20.0
-10.0
0.0
10.0
20.0
30.0
-24.8
12.9
0.2
19.9
6.9
-0.4 -0.8
0.42.2
-0.2 -0.1 -0.3 -0.5 -0.10.0
0.0
KOR USA

SC1: CHANGE IN EMPLOYMENT LEVEL (%)
GrainsCrops MeatLstk Extraction ProcFood TextWapp LightMnfc HeavyMnfc Services
-12.0
-10.0
-8.0
-6.0
-4.0
-2.0
0.0
2.0
4.0
6.0
8.0
KOR USA
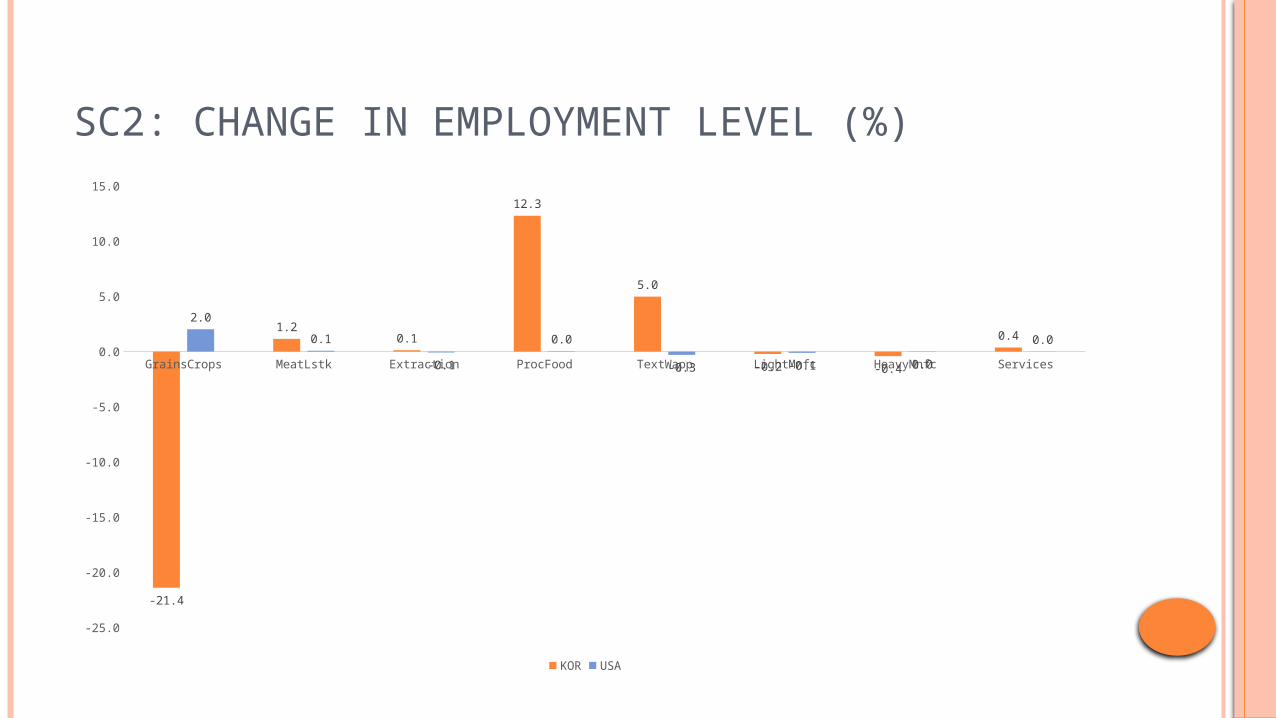
SC2: CHANGE IN EMPLOYMENT LEVEL (%)
GrainsCrops MeatLstk Extraction ProcFood TextWapp LightMnfc HeavyMnfc Services
-25.0
-20.0
-15.0
-10.0
-5.0
0.0
5.0
10.0
15.0
-21.4
1.20.1
12.3
5.0
-0.2 -0.4
0.42.0
0.1-0.1
0.0-0.3 -0.1 0.0
0.0
KOR USA

SC3: CHANGE IN EMPLOYMENT LEVEL (%)
GrainsCrops MeatLstk Extraction ProcFood TextWapp LightMnfc HeavyMnfc Services
-40.0
-30.0
-20.0
-10.0
0.0
10.0
20.0
30.0
-33.7
1.3 0.3
20.2
7.1
-0.2 -0.5
0.62.8
0.0-0.1 -0.3 -0.5 -0.1
0.0 0.0
KOR USA

CHANGE IN WAGE RATE IN EACH SECTOR (%)
SC1 SC2 SC30.00
0.20
0.40
0.60
0.80
1.00
1.20
0.47
0.75
1.00
0.060.10 0.11
KOR USA

CONCLUSION
Korea and USA both have the highest share of imports in heavy and light manufac-turing sectors.
Korea mainly exports heavy manufacturing, extractions and services while USA mainly exports heavy manufacturing, light manufacturing and services.
Korea’s GDP growth rate is positive for all scenarios but in case of USA it is positive only for SC1.
Still Korea and USA have increasing welfare level for SC1, SC2, and SC3. Tariff reduction increases exports in both countries in all scenarios. But imports of Korea from USA increase a lot, mainly in the grain sector while Ko-
rea’s imports decrease in meat and livestock and processed food sector. The higher imports deteriorate terms of trade in case of Korea while terms of trade
improves for USA. Because of the tariff reduction, output in grain crop sector falls down while produc-
tivity in meat and livestock and processed food increases. This is also shown in case of value addition and employment level as both increase.
The overall increase in wage rate is higher in Korea than USA in each scenario.


![별표3] The Republic of Korea Tariff Reduction Schedule for Korea … · 2015-12-22 · [별표3] The Republic of Korea Tariff Reduction Schedule for Korea-ASEAN FTA (HS2012) 2012](https://static.fdocuments.net/doc/165x107/5e8e2fd8378fff744940f072/eoe3-the-republic-of-korea-tariff-reduction-schedule-for-korea-2015-12-22.jpg)