The Kiss of Death: A 5-Star Morningstar Mutual Fund … Gruber, and Blake 4-factor alpha (1996), a...
19
The Kiss of Death: A 5-Star Morningstar Mutual Fund Rating? By Matthew R. Morey Department of Finance Pace University One Pace Plaza New York, NY 10025 Abstract We examine the effect that an initial 5-star Morningstar mutual fund rating has on future fund performance, strategy, risk-taking, expenses, and portfolio turnover. Using a sample of diversified domestic equity funds from the 1990s we find that during the three-years after a fund received its initial 5-star rating, fund performance severely falls off. This result is robust across different performance measures and different samples of funds. We also find that after receiving their initial 5-star rating, the risk levels of funds rise and the funds are not able to load on momentum stocks as well as they did before receiving the 5-star rating. These results suggest that funds, to some degree, alter their portfolios after receiving a 5-star rating and that investors should be very wary about using the 5-star rating as a signal of future 3-year performance. Key Words: Mutual Funds, Morningstar, Fund Ratings, Performance persistence
Transcript of The Kiss of Death: A 5-Star Morningstar Mutual Fund … Gruber, and Blake 4-factor alpha (1996), a...
The Kiss of Death: A 5-Star Morningstar Mutual Fund Rating?
By
Matthew R. Morey Department of Finance
Pace University One Pace Plaza
New York, NY 10025
Abstract We examine the effect that an initial 5-star Morningstar mutual fund rating has on future fund performance, strategy, risk-taking, expenses, and portfolio turnover. Using a sample of diversified domestic equity funds from the 1990s we find that during the three-years after a fund received its initial 5-star rating, fund performance severely falls off. This result is robust across different performance measures and different samples of funds. We also find that after receiving their initial 5-star rating, the risk levels of funds rise and the funds are not able to load on momentum stocks as well as they did before receiving the 5-star rating. These results suggest that funds, to some degree, alter their portfolios after receiving a 5-star rating and that investors should be very wary about using the 5-star rating as a signal of future 3-year performance. Key Words: Mutual Funds, Morningstar, Fund Ratings, Performance persistence
The Kiss of Death: A 5-Star Morningstar Mutual Fund Rating?
Abstract We examine the effect that an initial 5-star Morningstar mutual fund rating has on future fund performance, strategy, risk-taking, expenses, and portfolio turnover. Using a sample of diversified domestic equity funds from the 1990s we find that during the three years after a fund received its initial 5-star rating, fund performance severely falls off. This result is robust across different performance measures and different samples of funds. We also find that after receiving their initial 5-star rating, the risk levels of funds rise and the funds are not able to load on momentum stocks as well as they did before receiving the 5-star rating. These results suggest that funds, to some degree, alter their portfolios after receiving a 5-star rating and that investors should be very wary about using the 5-star rating as a signal of future 3-year performance. Key Words: Mutual Funds, Morningstar, Fund Ratings, Performance persistence
1. Introduction How does the average U.S. investor discern a winning mutual fund from another? If one were to
glance at mutual fund advertisements in the popular press the likely answer would be
Morningstar star ratings. For many well-known funds, the only hint of past winning performance
in their ads is the Morningstar star rating. Indeed, in 2001-2002, fund companies such as
American Century, Dreyfus, Fidelity, Franklin Resources, Northern Funds, and Strong Funds all
ran advertisements that emphasized stars rather than their own return history.1
Evidence from academic research also indicates that investors care greatly about star
ratings. Del Guercio and Tkac (2002) find that the Morningstar star rating itself has a significant
effect on fund flows. They find that a fund’s initial 5-star rating produces inflows of 53 percent
above the normal flow. In contrast, funds with rating downgrades experience significant outflows
beyond what would normally be expected.
Given the importance of the Morningstar ratings to mutual fund investors this paper asks
the following question: What happens to fund performance, strategy, risk-taking, expenses and
portfolio turnover just after a fund receives its first 5-star rating? This is an important question to
ask because we can look at two of the more deeply investigated issues in mutual fund research—
performance persistence and tournament effects—using a definition of a winning fund that is
consistent with what the average investor would also use. For example, consider the issue of
performance persistence in mutual funds. While a number of papers examine performance
persistence (e.g., Brown and Goetzmann (1995), Carhart (1997), Elton, Gruber and Blake
(1996), Goetzmann and Ibotson (1994), Hendricks, Patel and Zeckhauser (1993), Khorana
(2001)), they all define winning funds by standard performance measures such as single or multi-
index alphas. Furthermore, these papers typically use performance at the end of the year to
define winning funds. Alternatively, our use of the initial 5-star rating allows us to utilize the
same definition of a winning fund as investors, and to pinpoint the exact time when an investor
would know it.
Our approach also allows us to examine tournament effects. In the tournament literature,
Brown, Harlow and Starks (1996), Busse (2001) and others define winning funds during the
1 See “Stars Alone Don’t Illuminate Performance Picture”, by Karen Damato, The Wall Street Journal, March 22, 2002, page C1.
1
middle of the year using standard performance metrics and then examine the strategies of these
winning funds during the later part of the year. The idea is that funds are competing to be the
best performing funds not at the middle of the year but at the end when performance histories are
calculated and used in marketing efforts. In this paper, we can use the 5-star rating--the
performance metric that many mutual fund companies actually advertise--as the definition of a
winning fund, and then see how and if the funds alter their strategy in an attempt to retain the 5-
star rating.
Finally, it should be noted that this paper is not the first to examine the performance
effects of Morningstar ratings.2 For example, Blake and Morey (2000) and Morey (2002a)
investigated the predictive qualities of the entire Morningstar rating system. The difference here
is that this paper examines only those cases where we can define a fund as receiving its first 5-
star rating so as to measure the effects of suddenly becoming a winning fund. This approach
allows for an easy-to-use break point to examine changes in performance, strategy, risk-taking,
expenses, and portfolio turnover. Conversely, Blake and Morey only examine performance. This
paper is also similar in spirit to Elton, Gruber and Blake (1996) as it uses comparable
methodology to ascertain if past risk-adjusted returns predicts future risk-adjusted returns. The
key difference is that rather than using past risk-adjusted returns, this paper uses the initial 5-star
Morningstar rating to measure past performance.
The rest of the paper is organized as follows. Section 2 describes the data. Section 3
contains the methodology. Section 4 presents all of our results and Section 5 concludes the
paper.
2. Data
To obtain fund data we use 33 Morningstar mutual fund quarterly data disks from July 1993 till
July 2001. Our reason for beginning with the July 1993 disk is that this is the first data disk that
provides inception date information for the funds. Hence, it is the first time we can accurately
determine the age of the fund.
2 Other papers have examined the methodology of the Morningstar ratings. These include Blume (1998), Sharpe (1998) and Morey (2002b).
2
Using these disks our process of collecting the data was the following. Starting with the
July 1993 data disk3 we select all funds, regardless of style, that had inception dates of no earlier
than April 1, 1990 and had 5-star overall Morningstar ratings. Since all these funds have just
slightly more than three years of return data and because Morningstar only rates funds with at
least three years of return history, the July 1993 data disk represents the first time that the
selected funds are listed as having a 5-star overall rating. Then for each of the subsequent
quarterly data disks through July 1998 (data up until June 30, 1998) we repeat this process
making sure that the funds selected from each subsequent disk have not been rated as 5-star
performers before. For example, for the October 1993 disk, we select all funds on the disk with
inception dates of April 1, 1990 or later and had an overall 5-star rating as of the October 1993
disk. Any funds that were also selected when using the July 1993 disk were omitted from the
sample.
Hence, at the end of this process we have a list of funds that have just received their first
5-star rating. Of course, the sample is somewhat biased in that we are only taking relatively
young funds. Indeed, the oldest possible fund in our sample would be just over eight years old at
the time it was initially given a 5-star rating (April 1, 1990-June 30, 1998). It would, of course,
be preferable to examine older funds as well, but since we cannot determine whether or not these
older funds have received a 5-star rating before we first examine them, we are forced to exclude
them from the sample.
Finally, to make the sample more manageable we then choose only those funds that were
listed as diversified domestic equity funds. These are funds that had styles of Aggressive
Growth, Equity-Income, Growth, Growth-Income, and Small Company. This left a sample of
273 total funds.
For each of the 273 funds we then collected the fund returns for three years before and
three years after the fund first became a 5-star fund.4 For example, for a fund that was found to
receive its first 5-star rating on the January 1998 disk (as of December 31, 1997), we examined
the returns from January 1, 1995-December 31, 1997 (in-sample) and the returns from January 1,
1998 to December 31, 2000 (out-of-sample).
3 The July 1993 data disk has data updated through June 30, 1993. 4 These returns are adjusted for management expenses such as 12b-1 fees but are not adjusted for loads.
3
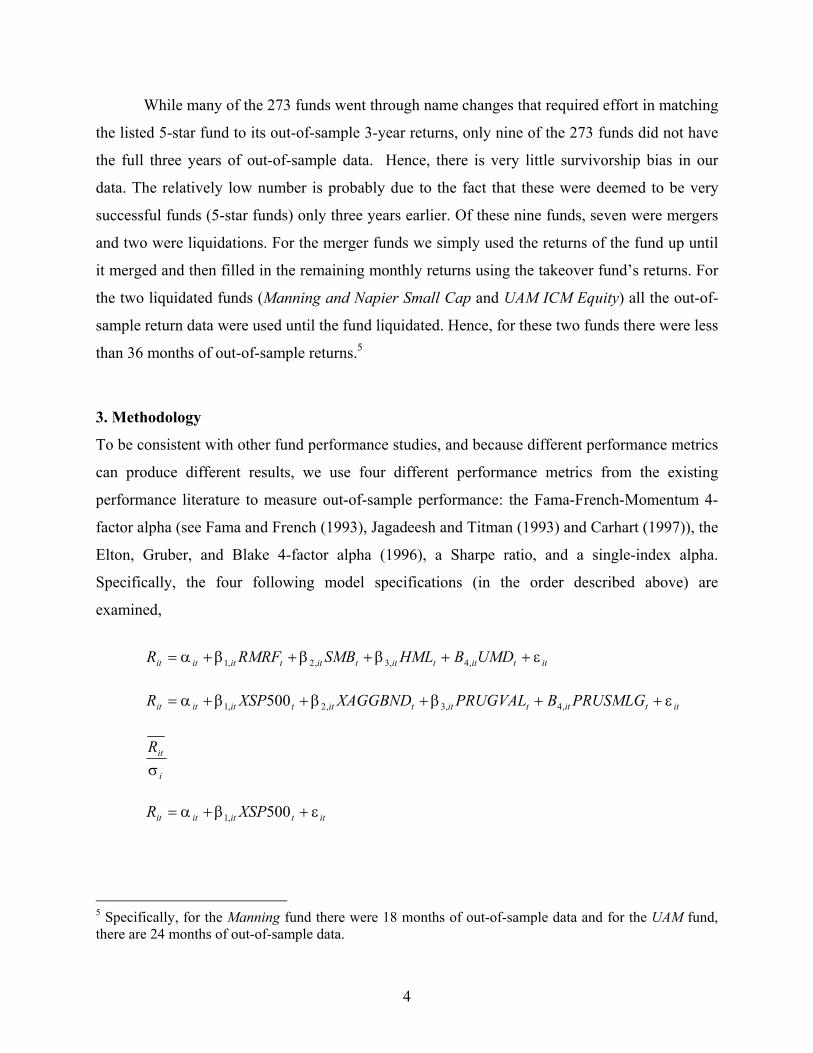
While many of the 273 funds went through name changes that required effort in matching
the listed 5-star fund to its out-of-sample 3-year returns, only nine of the 273 funds did not have
the full three years of out-of-sample data. Hence, there is very little survivorship bias in our
data. The relatively low number is probably due to the fact that these were deemed to be very
successful funds (5-star funds) only three years earlier. Of these nine funds, seven were mergers
and two were liquidations. For the merger funds we simply used the returns of the fund up until
it merged and then filled in the remaining monthly returns using the takeover fund’s returns. For
the two liquidated funds (Manning and Napier Small Cap and UAM ICM Equity) all the out-of-
sample return data were used until the fund liquidated. Hence, for these two funds there were less
than 36 months of out-of-sample returns.5
3. Methodology
To be consistent with other fund performance studies, and because different performance metrics
can produce different results, we use four different performance metrics from the existing
performance literature to measure out-of-sample performance: the Fama-French-Momentum 4-
factor alpha (see Fama and French (1993), Jagadeesh and Titman (1993) and Carhart (1997)), the
Elton, Gruber, and Blake 4-factor alpha (1996), a Sharpe ratio, and a single-index alpha.
Specifically, the four following model specifications (in the order described above) are
examined,
ittittittittititit UMDBHMLSMBRMRFR ε++β+β+β+α= ,4,3,2,1
ittittittittititit PRUSMLGBPRUGVALXAGGBNDXSPR ε++β+β+β+α= ,4,3,2,1 500
i
itRσ
ittititit XSPR ε+β+α= 500,1
5 Specifically, for the Manning fund there were 18 months of out-of-sample data and for the UAM fund, there are 24 months of out-of-sample data.
4
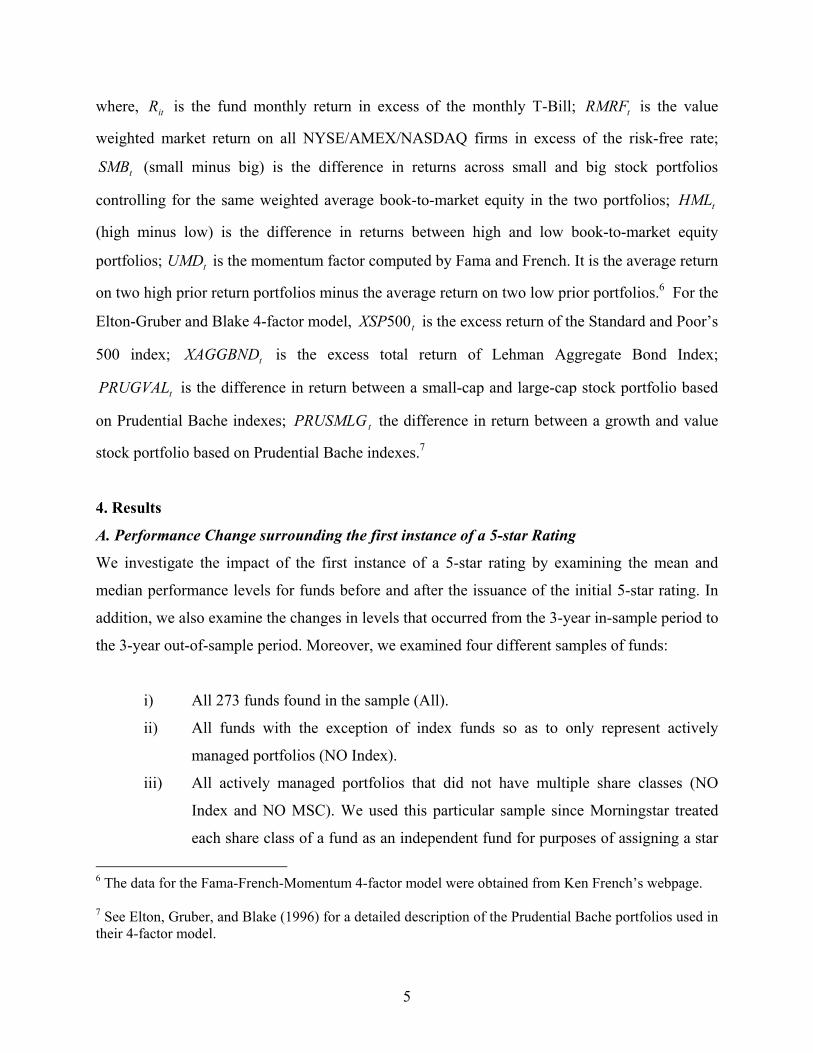
where, is the fund monthly return in excess of the monthly T-Bill; is the value
weighted market return on all NYSE/AMEX/NASDAQ firms in excess of the risk-free rate;
(small minus big) is the difference in returns across small and big stock portfolios
controlling for the same weighted average book-to-market equity in the two portfolios;
(high minus low) is the difference in returns between high and low book-to-market equity
portfolios; UMD is the momentum factor computed by Fama and French. It is the average return
on two high prior return portfolios minus the average return on two low prior portfolios.
itR tRMRF
tSMB
PRUGVAL
tHML
t
t
6 For the
Elton-Gruber and Blake 4-factor model, is the excess return of the Standard and Poor’s
500 index; is the excess total return of Lehman Aggregate Bond Index;
is the difference in return between a small-cap and large-cap stock portfolio based
on Prudential Bache indexes; the difference in return between a growth and value
stock portfolio based on Prudential Bache indexes.
tXSP500
t
tXAGGBND
PRUSMLG7
4. Results
A. Performance Change surrounding the first instance of a 5-star Rating
We investigate the impact of the first instance of a 5-star rating by examining the mean and
median performance levels for funds before and after the issuance of the initial 5-star rating. In
addition, we also examine the changes in levels that occurred from the 3-year in-sample period to
the 3-year out-of-sample period. Moreover, we examined four different samples of funds:
i) All 273 funds found in the sample (All).
ii) All funds with the exception of index funds so as to only represent actively
managed portfolios (NO Index).
iii) All actively managed portfolios that did not have multiple share classes (NO
Index and NO MSC). We used this particular sample since Morningstar treated
each share class of a fund as an independent fund for purposes of assigning a star
6 The data for the Fama-French-Momentum 4-factor model were obtained from Ken French’s webpage. 7 See Elton, Gruber, and Blake (1996) for a detailed description of the Prudential Bache portfolios used in their 4-factor model.
5
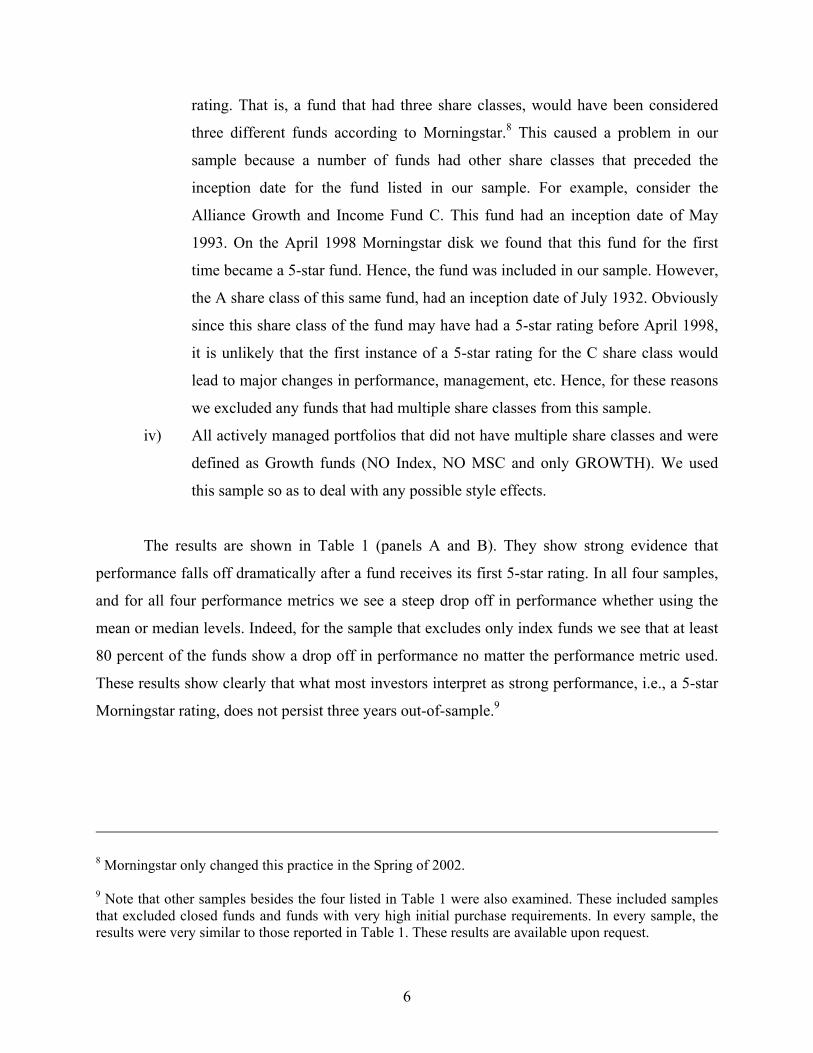
rating. That is, a fund that had three share classes, would have been considered
three different funds according to Morningstar.8 This caused a problem in our
sample because a number of funds had other share classes that preceded the
inception date for the fund listed in our sample. For example, consider the
Alliance Growth and Income Fund C. This fund had an inception date of May
1993. On the April 1998 Morningstar disk we found that this fund for the first
time became a 5-star fund. Hence, the fund was included in our sample. However,
the A share class of this same fund, had an inception date of July 1932. Obviously
since this share class of the fund may have had a 5-star rating before April 1998,
it is unlikely that the first instance of a 5-star rating for the C share class would
lead to major changes in performance, management, etc. Hence, for these reasons
we excluded any funds that had multiple share classes from this sample.
iv) All actively managed portfolios that did not have multiple share classes and were
defined as Growth funds (NO Index, NO MSC and only GROWTH). We used
this sample so as to deal with any possible style effects.
The results are shown in Table 1 (panels A and B). They show strong evidence that
performance falls off dramatically after a fund receives its first 5-star rating. In all four samples,
and for all four performance metrics we see a steep drop off in performance whether using the
mean or median levels. Indeed, for the sample that excludes only index funds we see that at least
80 percent of the funds show a drop off in performance no matter the performance metric used.
These results show clearly that what most investors interpret as strong performance, i.e., a 5-star
Morningstar rating, does not persist three years out-of-sample.9
8 Morningstar only changed this practice in the Spring of 2002. 9 Note that other samples besides the four listed in Table 1 were also examined. These included samples that excluded closed funds and funds with very high initial purchase requirements. In every sample, the results were very similar to those reported in Table 1. These results are available upon request.
6
B. Performance Attribution Analysis
In an effort to examine if fund managers alter their portfolio strategies upon the first instance of
5-star rating, we examined the estimates of the Fama-French-Momentum four-factor model
before and after the issuance of the initial 5-star rating. The results are reported in Table 2. Note
that because the findings were similar across the four samples reported in Table 1, we only report
the results on the NO Index sample.
The results show that managers significantly increase their loadings on HML, the
difference in returns between high and low book-to-market equity portfolios, after receiving a 5-
star rating. This result suggests that fund managers move towards higher value stocks in attempt
to maintain their high ratings.
The results also show that funds did a poorer job of loading on momentum stocks (UMD)
after receiving their initial 5-star rating. This inability to identify and invest in these momentum
stocks, i.e., stocks that have done very well in the recent past, could very well be part of the
explanation for the poorer performance after receiving the 5-star rating. In the literature, Carhart
(1997), Wermers (1999) and Grinblatt, Titman, and Wermers (1995) find that the momentum
factor is an important determinant of whether winning performance persists.
One of the possible explanations for the poorer ability of funds to load on momentum
stocks is the massive inflows these funds receive with the 5-star rating (see Del Guerico and
Tkac (2002)). A plausible story is that the large increases in fund size from the 5-star rating make
trading in these momentum stocks unwieldy. In other words, the large increases in fund size
make it difficult for fund mangers to get in and out of positions in momentum stocks without
influencing their value.
C. Portfolio Risk Analysis
In this section we examine the risk-taking behavior before and after a fund receives its initial 5-
star rating. Specifically, we examine the levels and changes in levels of a fund’s total risk
(sigma—the standard deviation of monthly returns) and systematic risk (beta—from the single
index model) during the three years before and after a fund receives its initial 5-star rating. The
results are reported in Table 3 and are again only for the NO Index sample. The results for other
samples were very similar to those reported and are available upon request.
7
The results show that after a fund has received its initial 5-star rating, the risk level of the
average fund increases quite substantially. Although there are some doubts as to whether sigma
and beta appropriately measure risk (see Fama and French (1993)), we find that both sigma and
beta rise significantly after a fund receives the initial 5-star rating.
At first glance these results seem to contradict the mutual fund tournament literature.
Specifically, research by Brown, Harlow and Starks (1996) has found that poor performing funds
will attempt to increase their risk more than winning funds in an attempt to “catch-up” while the
winning funds will take more conservative positions in order to “lock-in” their ranking. Hence,
given that a 5-star rating is one of the most visible signs of a winning fund to investors, we
would expect funds that have just received their first 5-star rating to be somewhat more
conservative in order to maintain these high ratings. However, the story does not end there. More
recent research suggests that our results showing increased risk by winning funds (as measured
by the 5-star rating) may be not be that surprising at all. For example, Chavalier and Ellison
(1997) found a positive correlation between past fund performance and increases in tracking
error volatility in the subsequent quarter. Moreover, Busse (2001) has found that funds that are
ranked above the median fund in their category increase total risk more than below median
funds. Finally, recent work by Taylor (2003) has theoretically modeled how winning funds may
be more willing to gamble than poor performing funds as the winning fund manager gambles in
expectation that losing fund managers will gamble as well. In any event, the results of Table 3
indicate that these newly minted 5-star funds are increasing risk substantially as compared to
what they did before the 5-star rating.
D. Expense Ratio and Turnover Analysis
Carhart (1997) notes that one of the most important factors in terms of predicting future
performance is that of expenses. Specifically, funds with low expenses seem to perform slightly
better than funds with higher expenses. Given this, we wanted to see if the fall off in
performance in Table 1 was a result of funds increasing their expenses and/or turnover after
receiving a 5-star fund.
Table 4 presents mean and median expense ratio and turnover during the time when funds
received their initial 5-star rating and then one, two and three years afterwards. The results
8
suggest that the expense ratios slightly declined after receiving their initial 5-star rating. This
decline is consistent with economies of scale coming from an increase in the average fund size.
In terms of portfolio turnover, the results suggest a very small decrease in portfolio
turnover after a fund receives a 5-star rating (however the decrease is not significant). For
example we find that the mean turnover rate goes from 94.70 percent when the fund first
receives its initial 5-star rating to 85.48 percent three years later. These results are very
consistent with Khorana (2001) who finds that past top performing funds show a slight decline in
turnover after the time they are defined as top performing funds.
In sum, both expenses and turnover seem to slightly decline or remain at stable levels
after the fund receives the 5-star rating. These results provide evidence that increases in expenses
and/or turnover are not the cause of the fall off in performance that we see in Table 1.
5. Conclusions
Our results in Table 1 indicating that the there is a sharp drop off in performance after a fund
receives its first 5-star Morningstar rating are very consistent with the literature that shows that
winning performance does not persist. Brown and Goetzmann (1995), Elton, Gruber and Blake
(1996) and Carhart (1997) all find that while winning performance may persist for one year, in
longer out-of-sample periods, such as three years, performance severely drops off. The
difference here is that we examine performance persistence using what a typical investor might
use to deem a fund a winning fund. As to why there is such a fall off in performance there are
several possible explanations.
First, while we find that that expenses and portfolio turnover do not change much, it does
seem that the risk levels of 5-star funds rise and that the funds are not able to load on momentum
stocks as well as they did before receiving the 5-star rating. These results are consistent with
findings reported by Busse (2001) that winning funds increase risk levels. Hence, it may be that
winning funds, in an attempt to remain winning funds, take risks and use strategies that cause
their performance to suffer.
Second, our results may simply be due to efficient markets. That is, the past performance
of a fund that has just acquired its initial 5-star rating may simply be a matter of luck. Hence,
given enough time, most winning funds will revert to the mean in terms of performance. In
studies of the entire Morningstar rating system, Blake and Morey (2000) find results that concur
9

with these. Specifically they find that the average 3-year out-of-sample performance of funds
with 5-star ratings is similar to that of 3-star rated (median rated) funds.
Third and most interesting, as mentioned in the introduction, recent research by Del
Guercio and Tkac (2002) has found that the Morningstar rating itself has a very powerful effect
on fund flows. They find, for example, that an initial 5-star rating yields, on average, a seven-
month abnormal flow of 53 percent above the normal expected inflow. Hence, one possible
explanation for our results is that once a fund receives its initial 5-star rating, the fund receives so
much new money that the fund becomes unwidely to manage and hence cannot perform to the
same level as before receiving the 5-star rating. Indeed, the increase in size of the fund may have
a lot to do with why the funds are not able to load as effectively on momentum stocks after
receiving the initial 5-star rating as they were before receiving the 5-star rating (results from
Table 2). A very conceivable story is that the large increases in fund size make it difficult for
fund mangers to get in and out of positions in momentum stocks without influencing their value.
The lack of ability to invest in these momentum stocks then leads to lower performance.
While this last explanation is quite compelling, the literature is rather mixed on how fund
flows affect future performance. Warther (1995) provides evidence to suggest that there is a
positive relationship between flows and subsequent performance whereas others such as Jain and
Wu (2000) show that large inflows do not allow for persistence in performance. However, given
the strong results of Del Guercio and Tkac and those reported here, there may indeed be a
negative relationship between large fund inflows and future performance. This is a subject for
future research.
10
References Blake, Christopher and Matthew Morey, 2000, “Morningstar Rating and Mutual Fund Performance”, Journal of Financial and Quantitative Analysis, 35, 3, 451-83. Blume, Marshall, 1998, “An Anatomy of Morningstar Ratings.” Financial Analysts Journal, March/April, 19-27. Brown, Stephen and William Goetzmann, 1995, “Performance Persistence”, Journal of Finance, 50, 679-698. Brown, Keith, W. Harlow and Laura Starks, 1996, “Of Tournaments and Temptation: An Analysis of Managerial Incentives in the Mutual Fund Industry”, Journal of Finance, 51, 85-110. Busse, Jeffrey, 2001, “Another look at Mutual Fund Tournaments”, Journal of Financial and Quantitative Analysis, 36, 53-74. Chavalier, Judith and Glenn Ellison, 1997, “Risk Taking by Mutual Funds as a Response to Incentives”, Journal of Political Economy, 105, 1167-1200. Carhart, Mark M., 1997, “On Persistence in Mutual Fund Performance” Journal of Finance, 52, 1, 57-82. Del Guercio, Diane and Paula A. Tkac, 2002, “The Effect of Morningstar Ratings on Mutual Fund Flows”, Working Paper, University of Oregon Department of Finance. Fama, Eugene and Kenneth R. French, 1993, “The Common Risk Factors in the Returns on Stocks and Bonds”, Journal of Financial Economics, 33, 1, 3-56. Elton, Edwin J., Martin J. Gruber and Christopher R. Blake, 1996a, “The Persistence of Risk-Adjusted Mutual Fund Performance.” Journal of Business, 69, 2, 133-157. Goetzmann, William N. and Roger G. Ibbotson, 1994, “Do Winners Repeat?” Journal of Portfolio Management, Winter, 9-18. Goetzmann, William N. and N. Peles, 1997, “Cognitive Dissonance and Mutual Fund Investors.” Journal of Financial Research, vol. XX, no. 2, (Summer), 145-158. Grinblatt, Mark, Sheridan Titman, Russ Wermers, 1995, “Momentum Investment Strategies, Portfolio Performance, and Herding: A Study of Mutual Fund Behavior”, American Economic Review, 85, 5, 1088-1105. Hendricks, Darryll, Jayendu Patel and Richard Zeckhauser, 1993, “Hot Hands in Mutual Funds: Short-Run Persistence of Relative Performance, 1974-1988.” Journal of Finance, 48, 93-130. Jain, Prem C. and Joanna. S. Wu, 2000, “Truth in Mutual Fund Advertising: Evidence on Future Performance and Fund Flows”, Journal of Finance, 55, 2, 937-58.
11
Jagadeesh N., and Sheridan Titman, 1993, “Returns to Buying Winners and Selling Losers: Implications for Stock Market Efficiency”, Journal of Finance, 48, 65-91. Khorana, Ajay, 2001, “Performance Changes following Top Management Turnover: Evidence from Open-End Mutual Funds”, Journal of Financial and Quantitative Analysis, 36, 3, 371-393. Morey, Matthew, 2002a, “Rating the Raters: An Investigation into Mutual Fund Rating Services”, The Journal of Investment Consulting, November/December 2002, 5, 2, 30-50. Morey, Matthew, 2002b, “Mutual Fund Age and Morningstar Ratings”, Financial Analysts Journal, March/April, 56-63. Sharpe, William, 1998, “Morningstar Performance Measures.” Financial Analysts Journal, July/August, 21-33. Taylor, Jonathon, 2003, “Risk-taking Behavior in Mutual Fund Tournaments”, Journal of Economic Behavior and Organization, 50, 373-383. Warther, Vincent, A., 1995, “Aggregate Mutual Fund Flows and Security Returns”, Journal of Financial Economics, 39, 2-3, 209-35. Wermers, Russ, 1999, “Mutual Fund Herding and the Impact on Stock Prices”, Journal of Finance, 54, 2, 581-622.
12

Table 1 (Panel A): Mean and Median Performance Results for New 5-Star Funds All diversified domestic equity funds are examined that received their first 5-star overall Morningstar rating during the period July 1993-July 1998. We examine the performance for the 36-month period before and the 36-month period after a fund receives its first 5-star rating from Morningstar. Four samples of funds are examined: All, No Index, No Index and No MSC and No Index, No MSC and only Growth. All uses all funds in the sample; No Index excludes index funds; No index and No MSC excludes index funds and funds which had another share class. No Index, No MSC and only Growth is the same as third sample except that it only includes Growth funds. A falling fund is a fund that has fallen in terms of performance from the pre-5-star period to the post-5-star period.
Sample Fama-French-Momentum
Alpha
Elton-Gruber-Blake Alpha
Sharpe Ratio
Single-Index Alpha
All Mean Pre-5-star 0.3030 0.3623 0.4726 0.3623 Mean Post-5-star -0.1107 -0.0255 0.1657 -0.4087 Mean Change from Pre-5-star to Post-5-star -0.4137*** -0.3878*** -0.3069*** -0.7710***
Median Pre-5-star 0.2384 0.2509 0.4730 0.2310 Median Post-5-star -0.1023 -0.0279 0.1542 -0.2992 Median Change from Pre-5-star to Post-5-star -0.3546*** -0.2945*** -0.3197*** -0.5678***
# Funds 273 273 273 273
# Falling Funds 209 212 260 224 % Falling funds 77 78 95 82
No Index Mean Pre-5-star 0.3247 0.3952 0.4737 0.3958 Mean Post-5-star -0.1276 -0.0243 0.1561 -0.4414 Mean Change from Pre-5-star to Post-5-star -0.4523*** -0.4195*** -0.3176*** -0.8373***
Median Pre-5-star 0.2785 0.2963 0.4784 0.2840 Median Post-5-star -0.1446 -0.0433 0.1420 -0.3682 Median Change from Pre-5-star to Post-5-star -0.4027*** -0.3234*** -0.3287*** -0.6942***
# Funds 251 251 251 251
# Falling Funds 203 200 238 213 % Falling funds 81 80 95 85
***, **, * indicate that the mean (median) change coefficient is statistically significant at the one, five and ten percent level based on a paired t-test (Wilcoxon sign rank test).
13

Table 1 (Panel B): Mean and Median Performance Results for New 5-Star Funds All diversified domestic equity funds are examined that received their first 5-star overall Morningstar rating during the period July 1993-July 1998. We examine the performance for the 36-month period before and the 36-month period after a fund receives its first 5-star rating from Morningstar. Four samples of funds are examined: All, No Index, No Index and No MSC and No Index, No MSC and only Growth. All uses all funds in the sample; No Index excludes index funds; No index and No MSC excludes index funds and funds which had another share class. No Index, No MSC and only Growth is the same as third sample except that it only includes Growth funds. A falling fund is a fund that has fallen in terms of performance from the pre-5-star period to the post-5-star period.
Sample Fama-French-Momentum
Alpha
Elton-Gruber-Blake Alpha
Sharpe Ratio
Single-Index Alpha
No Index Mean Pre-5-star 0.3363 0.4115 0.4707 0.4157 And No Mean Post-5-star -0.1291 -0.0236 0.1633 -0.4497 MSC Mean Change from Pre-5-star to Post-5-star -0.4654*** -0.4351*** -0.3074*** -0.8654***
Median Pre-5-star 0.2853 0.2990 0.4704 0.3324 Median Post-5-star -0.1370 -0.0399 0.1542 -0.3813 Median Change from Pre-5-star to Post-5-star -0.3997*** -0.3250*** -0.3054*** -0.7963***
# Funds 219 219 219 219
# Falling Funds 180 175 206 190 % Falling funds 82 80 94 87 No Index, Mean Pre-5-star 0.3410 0.3787 0.4634 0.3504 No MSC Mean Post-5-star -0.0810 -0.0037 0.1942 -0.2984 And Only Mean Change from Pre-5-star to Post-5-star -0.4219*** -0.3824*** -0.2692*** -0.6489*** Growth Median Pre-5-star 0.3109 0.2792 0.4601 0.2467 Median Post-5-star -0.1244 -0.0518 0.1943 -0.2667 Median Change from Pre-5-star to Post-5-star -0.3809*** -0.3250*** -0.2605*** -0.5259***
# Funds 88 88 88 88
# Falling Funds 71 69 82 74 % Falling funds 81 78 93 84
***, **, * indicate that the mean (median) change coefficient is statistically significant at the one, five and ten percent level based on a paired t-test (Wilcoxon sign rank test).
14

Table 2: Performance Attribution for New 5-Star Funds Using Fama-French-Momentum Model. The table presents the mean and median coefficient values for the 36-month period before and the 36-month period after a fund receives its first 5-star rating from Morningstar. A falling fund is a fund that has fallen in terms of the performance attribution measure. Hence, the 93 funds under RMRF indicates that 93 funds (37 percent of the sample of 251) had their RMRF coefficient fell from the pre-5-star period to the post-5-star period. RMRF is the excess return on the value weighted market proxy, SMB is the difference in returns across small and big stock portfolios controlling for the same weighted average book-to-market equity in the two portfolios, HML is the difference in returns between high and low book-to-market equity portfolios, and UMB is a momentum factor that is the average return on two high prior return portfolios minus the average return on two low prior return portfolios. The sample of funds used corresponds to the no index sample in Table 1. The other samples produced very similar results. RMRF SMB HML UMDMean Pre-5-star 0.9491 0.2352 -0.0791 0.0775 Mean Post-5-star 1.0031 0.2506 0.0916 -0.0094 Mean Change from Pre-5-star to Post-5-star
0.0540*** 0.0154 0.1707*** -0.0870***
Median Pre-5-star 0.9579 0.1130 0.0107 0.0235 Median Post-5-star 1.0025 0.0797 0.1547 -0.0300 Median Change from Pre-5-star to Post-5-star
0.0404*** 0.0246 0.1460*** -0.0867***
# Funds 251 251 251 251 # Falling Funds 93 108 59 175 % Falling funds 37 43 24 70 ***, **, * indicate that the mean (median) change coefficient is statistically significant at the one, five and ten percent level based on a paired t-test (Wilcoxon sign rank test).
15

Table 3: Risk Measures for New 5-Star Funds. This table presents the mean and median values for the 36-month period before and the 36-month period after a fund receives its first 5-star rating from Morningstar. A falling fund is a fund that has fallen in terms of risk from the pre-5-star period to the post-5-star period. Sigma is the 36-month standard deviation of monthly excess returns. Beta is from the single-index alpha. The sample of funds used corresponds to the No Index sample in Table 1. The other samples produced very similar results. Sigma BetaMean Pre-5-star 0.0335 0.8992 Mean Post-5-star 0.0555 0.9505 Mean Change from Pre-5-star to Post-5-star
0.0220*** 0.0513***
Median Pre-5-star 0.0317 0.9160 Median Post-5-star 0.0528 0.9562 Median Change from Pre-5-star to Post-5-star
0.0225*** 0.0417***
# Funds 251 251 # Falling Funds 13 89 % Falling funds 5 35 ***,**, * indicate that the mean (median) change coefficient is statistically significant at the one, five and ten percent level based on a paired t-test (Wilcoxon sign rank test).
16

17
Table 4: Expense Ratios and Turnover for New 5-Star Funds This table shows the mean and median expense ratios and turnover (expressed in %) for funds receiving their first 5-star rating from Morningstar. Time 0 refers to the time when the fund received its initial 5-star rating. The expense ratio is defined as the percentage of fund assets paid for operating expenses and management fees, including 12b-1 fees, administrative fees, and all other asset-based costs incurred by the fund, except brokerage costs. The turnover ratio is a measure of the fund’s trading activity which is computed by taking the lesser of purchases or sales (excluding all securities with maturities of less than one year) and dividing by average monthly net assets. The sample of funds used corresponds to the No Index sample in Table 1. The other samples produced very similar results. Years with respect to when fund receives first 5-Star Rating
0 +1 +2 +3Mean Expense Ratio (in %) 1.25 1.21 1.18 1.17 Median Expense Ratio (in %)
1.21
1.18
1.13
1.13
Mean Turnover (in %) 94.70 79.88 82.15 85.48 Median Turnover (in %) 71.00 67.00 65.00 66.50 Changes in Levels with respect to when fund receives first 5-star Rating 0 to +1 0 to +2 0 to +3 Mean Change in Expense Ratio -0.03 -0.07 -0.08* Median Change in Expense Ratio
0.00 -0.02
-0.04
Mean Change in Turnover -4.75 -13.11 -11.21 Median Change in Turnover 0.00 -5.00 -3.00 ***,**, * indicate that the mean (median) change coefficient is statistically significant at the one, five and ten percent level based on a paired t-test (Wilcoxon sign rank test).