The Journal of Undergraduate Research: Volume 10
203
e Journal of Undergraduate Research Volume 10 Journal of Undergraduate Research, Volume 10: 2012 Article 1 2012 e Journal of Undergraduate Research: Volume 10 Follow this and additional works at: hps://openprairie.sdstate.edu/jur Part of the Arts and Humanities Commons , Education Commons , Engineering Commons , Life Sciences Commons , Physical Sciences and Mathematics Commons , and the Social and Behavioral Sciences Commons is Full Issue is brought to you for free and open access by the Division of Research and Economic Development at Open PIRIE: Open Public Research Access Institutional Repository and Information Exchange. It has been accepted for inclusion in e Journal of Undergraduate Research by an authorized editor of Open PIRIE: Open Public Research Access Institutional Repository and Information Exchange. For more information, please contact [email protected]. Recommended Citation (2012) "e Journal of Undergraduate Research: Volume 10," e Journal of Undergraduate Research: Vol. 10 , Article 1. Available at: hps://openprairie.sdstate.edu/jur/vol10/iss1/1
Transcript of The Journal of Undergraduate Research: Volume 10
The Journal of Undergraduate ResearchVolume 10 Journal of Undergraduate Research,Volume 10: 2012 Article 1
2012
The Journal of Undergraduate Research: Volume10
Follow this and additional works at: https://openprairie.sdstate.edu/jur
Part of the Arts and Humanities Commons, Education Commons, Engineering Commons, LifeSciences Commons, Physical Sciences and Mathematics Commons, and the Social and BehavioralSciences Commons
This Full Issue is brought to you for free and open access by the Division of Research and Economic Development at Open PRAIRIE: Open PublicResearch Access Institutional Repository and Information Exchange. It has been accepted for inclusion in The Journal of Undergraduate Research by anauthorized editor of Open PRAIRIE: Open Public Research Access Institutional Repository and Information Exchange. For more information, pleasecontact [email protected].
Recommended Citation(2012) "The Journal of Undergraduate Research: Volume 10," The Journal of Undergraduate Research: Vol. 10 , Article 1.Available at: https://openprairie.sdstate.edu/jur/vol10/iss1/1
JOURNAL OF
UNDERGRADUATE
RESEARCH Volume 10 • 2012

The South Dakota State University Journal of Undergraduate Research
is published annually by the Office of Research & Sponsored Programs
at South Dakota State University
Editor
Renae Kuhl
Associate Editor
Linda Winkler
All assertions of fact or statements of opinion are solely those of
the authors. They do not necessarily represent the views of the
Editorial Board, the Office of Research & Sponsored Programs,
South Dakota State University or its faculty and administration.
All correspondence, including requests for copies of the Journal, should be sent to:
South Dakota State University Journal of Undergraduate Research Office of Research & Sponsored Programs
130 Administration Building
Brookings, SD 57007
South Dakota State University
JOURNAL OF
UNDERGRADUATE
RESEARCH
Volume 10 • 2012
Table of Contents
Guidelines – SDSU Journal of Undergraduate Research………….….……….vi
Immigration Liberalization in the Unites States and Beyond
ARRAN DAVIS…………………………………….…….……..……1
Seedling Root Morphology of Six Alfalfa Populations
BRIANNA J. GAUGHAN……………………….……….………...…43
Prevalence and Behavior of Blastobasis repartella (Dietz) in Switchgrass
KRISTA HEGGE…………………………………….………………55
Contributions of Seed Bank and Vegetative Propagules to Vegetation
Composition on Prairie Dog Colonies in Western South Dakota
EMILY R. HELMS………………………………….……....……….63
Establishment of Photo-Activated Localization Microscopy (PALM) for
Imaging Signaling Complexes on the Surfaces of Cells
BRADLEY E. IVERSON………………………….……..….……….75
Carl Orff’s Carmina Burana: A Conceptual and Ethical Analysis
ZACHARY KRUEGER………………………….…….…….………86
Translation of Vibration from a Vibrational Plate to the Human Body
LARS MATTISON…………………………….……….…………..109
Hydraulic Test Bench Circuit Construction, Testing and Analysis
SHANE MICHELSON, MITCH MUELLER, BRETT SCHURMAN…..117
Shoot Morphology of Eleven Alfalfa Populations
JESSICA A. SCHMUCK……………………………….…………..128

Georgiana Duchess of Devonshire: Spark of the Women’s Rights
Movement
CASEY SEGER……………………………………………….……137
The Growing Demand for Energy and Ethanol’s Role
KYLEEN SHIELDS……………………………………….……….158
Stock Index Options Pricing Models
MARK YORK………………………………………………….….172

SUBMISSION GUIDELINES vi
MANUSCRIPT SUBMISSION (Due June 1 of
each calendar year.)
This section is intended to provide you with some guidance regarding the final structure
and format your research manuscript should possess to warrant publication in the SDSU
Journal of Undergraduate Research. Student authors wishing to have their work published
in the Journal are advised to follow these guidelines as closely as possible, as manuscripts
submitted to the Journal that are not of high quality in content and format may be rejected
by the editor. The Journal editor understands that research products and manuscripts from
different disciplines may take on quite different forms. As such, if these guidelines do not
adequately answer your questions, simply follow the format and guidelines utilized by a
major scholarly journal in your field of study. Professional journal articles in your field of
study are a guideline for manuscript length. (When in doubt, article conciseness is
important.) Your faculty mentor should be able to advise you in this regard.
SUBMISSION INFORMATION
All manuscripts must be submitted by your faculty mentor to the Journal of Undergraduate
Research, Administration Building, Room 130. E-mail electronic versions to
[email protected] by June 1. Manuscripts submitted by students will not be
accepted for publication.
TECHNICAL GUIDELINES
Your Journal manuscript must be submitted both in hard copy (printed) form AND
electronic format (via e-mail).
1. HARD COPY SUBMISSION - Use Microsoft Word® to prepare, print and submit your
manuscript with all graphics, figures and captions in place, exactly as you would like to see
them appear in the final Journal article. Every effort will be made to reproduce your
manuscript in a form most closely resembling your hard copy; however, slight variations
may occur in converting your files to those used by the publisher. Your careful adherence
to the information in the next few paragraphs will ensure that your manuscript is
reproduced with minimal errors.
SUBMISSION GUIDELINES vii
2. ELECTRONIC SUBMISSION - Submit your Microsoft Word® file to the Journal e-mail
address.
By default, the Journal will be reproduced in black and white. Color printing is available,
at the expense of the author, for those who wish their graphics to be in color. Cost of color
printing is approximately $50 per page. If you have further questions about submission, or
if additional questions about content and format arise, please contact the Journal editor,
Renae Kuhl, Economics Department, 688-4848 or [email protected].
MANUSCRIPT REVIEW
After your manuscript has been submitted to the SDSU Journal of Undergraduate
Research, it will be reviewed by the editorial staff, and, if deemed acceptable for
publication, converted into a “publication-ready” format (proof). A hard copy of the
manuscript proof will then be returned to your faculty mentor by July 1 for final review. At
that time, it will be your mentor’s responsibility to make any final changes to the document
and return it to the editors by the noted deadline (July 15). It is imperative that all proofs be
returned to the Journal staff in a timely manner so that any final changes can be
incorporated before the volume goes to press.
FINAL PRODUCT
The final form of your paper will depend greatly on the nature of your topic and certain
publishing conventions that may exist within your discipline. It is expected that the faculty
advisor for each project will provide substantial guidance in this matter. An excellent
general resource providing details of the content, style and organization of a typical journal
article is the Publication Manual of the American Psychological Association, which is
accepted as a definitive source in many disciplines. While the emphasis there is on
empirical research reports (based upon original research and data collection), other types of
papers are also described (review articles, theoretical articles), and an appendix: “Material
Other Than Journal Articles,” may be useful. Your discipline may have its own publication
style preferences, and you should explore this matter with your faculty advisor. For most all
disciplines, however, articles should follow a standard format and begin with a descriptive
title, the name of the author(s), the name(s) of the faculty advisor(s) and an abstract
describing in brief the purpose, methodology and findings or conclusions of the project (see
SUBMISSION GUIDELINES viii
below). Manuscripts describing empirical research will typically be organized into further
subsections, labeled: Introduction, Method, Results, Discussion, (or variations on those
subheadings), along with a complete list of References. The rest of these guidelines are
intended to provide you with a sense of the appearance and content of a typical final
research report, as it should appear in the SDSU JUR.
How to Use this Template
This template has been formatted in the approved Journal format. All submitted Journal
articles must follow the template below, or it will be returned to the author for corrections.
Approved Font Sizes and Styles
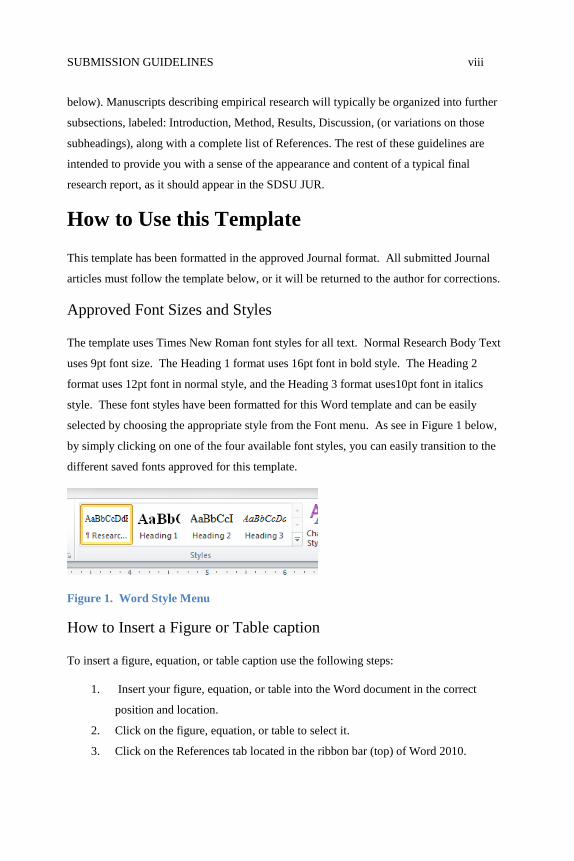
The template uses Times New Roman font styles for all text. Normal Research Body Text
uses 9pt font size. The Heading 1 format uses 16pt font in bold style. The Heading 2
format uses 12pt font in normal style, and the Heading 3 format uses10pt font in italics
style. These font styles have been formatted for this Word template and can be easily
selected by choosing the appropriate style from the Font menu. As see in Figure 1 below,
by simply clicking on one of the four available font styles, you can easily transition to the
different saved fonts approved for this template.
Figure 1. Word Style Menu
How to Insert a Figure or Table caption
To insert a figure, equation, or table caption use the following steps:
1. Insert your figure, equation, or table into the Word document in the correct
position and location.
2. Click on the figure, equation, or table to select it.
3. Click on the References tab located in the ribbon bar (top) of Word 2010.

SUBMISSION GUIDELINES ix
4. Click on Insert Caption.
5. Select Figure, Equation, or Table from the Label: drop down menu.
6. Click OK.
7. Enter a meaningful title after the Figure, Equation, or Table heading located
under your figure, table or equation.
Headers/Footers
Each page of your research article will contain a header. Footers are not used in this
journal. The header will contain the first 4 – 5 words of your title and the page number.
Page numbers have already been included in the template and do not need to be added or
modified. To edit the header to include your title, use the following steps:
1. Click on the Header of this template twice quickly.
2. Highlight the Sample text “FIRST 4-5 WORDS OF TITLE IN ALL CAPS”
3. Delete the sample text.
4. Type the first 4 – 5 words of your title, ensuring that it does not overlap the page
number.
5. The Title in the header should be left justified and in all caps.
Margins
The margins in this template have been preset. They should remain at 1” for the top and
bottom, and .7” for the left and right. The paper size has also been preset to ensure the best
reading format for online submission. The paper size needs to remain at 6” X 9”.
Sample Journal Article
Below is a sample of a journal article that is in the approved format and styles. Authors can
utilize this sample by replacing the text with the research article content. All electronic and
hard copy submissions of the draft journal articles must strictly follow the approved
template or it will be returned to the original author for rework. Questions about the styles,
fonts, and use of the template can be forwarded to the JUR editor: Renae Kuhl, Economics
Department, 688-4848 or [email protected].
SUBMISSION GUIDELINES x
Title Of Your Article
Author(s): Your Name, Your Partner’s Name(s)
Faculty Sponsor: Faculty Mentor’s Name
Department: Economics
ABSTRACT
This will be a brief statement of what was done in your research, along with your principal
results and conclusions. Only the most important facts should be related here, in non-
indented paragraph form. Offset the abstract by using margins that are indented 0.5” on
each side relative to the body of your manuscript. You may list key words to aid in online
computer-search applications, if that is appropriate. For example, Keywords:
undergraduate research, manuscript, submission, guidelines.
INTRODUCTION
This is the first formal section of a research report. This and the sections to follow should
be single-spaced and laser-printed on only one side of the paper (8.5” x 11”). Early in this
section, provide a general description of the research problem or activity. Attempt to
identify and define whatever terms your reader will need to understand your project. The
remaining paragraphs are often used to summarize relevant findings from previously
completed research. Always be sure to cite your sources. Sarbin and Coe (1969) state that
“in preparing a . . . report, the student must pay careful attention to the problems of
documentation.” In these examples of citations, “the documentation is contained in the
parentheses . . .” (Sarbin and Coe, 1969). To find the remaining information, the reader
examines the reference list at the end of the paper. This citation style is sometimes called
“scientific notation.” Other citation styles may be more appropriate to your own disciplines.
Be sure to be consistent and to discuss this with your faculty advisor. Ultimately, you
should use a citation style that is commonly accepted within your discipline. The last

SUBMISSION GUIDELINES xi
portion of an introduction is often used to state the specific expected outcomes of the
project; sometimes this appears as one or more formal testable hypotheses.
METHODS
The content of this subsection may vary greatly, depending upon the nature of the research
project. You should refer to publication manuals or published research for information
specific to your type of project. Sometimes this subsection is labeled “Materials and
Method.” Figures (see below) are often used to clarify and explain important details. In
general you should use this subsection to explain to your reader, in as clear a way as
possible, what you did, in the order that you did it. In an empirical research report, you
should try to provide enough detail that another researcher could essentially duplicate your
study without referring excessively to other sources.
RESULTS
This should be a clear description of any data (or other material) generated as a result of
your research. It must start out as a written description, but this subsection is often
supplemented with FIGURES and TABLES, or PLATES, or other types of graphic images.
These are never sufficient by themselves. Figures and Tables should not appear in your
paper until after they’ve been mentioned or referred to in the written portion of this section.
They should appear as soon as is reasonable after such mention, either on the same page, or
on the next page (see Figure 1, and Table 1). Notice, in particular, that in most scientific
papers, the number and title of a Table appear above the data being described, but the
number and title of a Figure appear below the data. Any units of measure must appear
either in the title, or independently in the column or row headings. A table is useless unless
the reader can understand exactly what is represented.
Graphic materials, properly labeled, should be included IN THE BODY of your paper, not
grouped at the end. (See the above section labeled “Submission” for further details.)
The Results section is also the place to include any statistical interpretation of the data, if
such exists. Be sure to point out any important features of your findings, but AVOID to the

SUBMISSION GUIDELINES xii
extent possible, any THEORETICAL INTERPRETATION unless you are combining this
with the next section (DISCUSSION or CONCLUSIONS).
DISCUSSION (AND/OR CONCLUSIONS)
This section is sometimes combined with the previous RESULTS section, especially when
that permits a more efficient presentation. Your “Discussion” should include any
theoretical interpretation of your data, including, when appropriate to your topic, the
following: (1) WHETHER your results support any specific hypothesis or hypotheses you
may have stated in your introduction; (2) HOW your results compare with the results in
your cited research sources; and (3) WHAT theories or explanations seem to best explain or
account for the results that you are describing. Again, be sure to cite (Sarbin and Coe,
1969) the sources for theoretical ideas and explanations provided by other writers or
sources. Also, address whether there any practical applications for the results or methods
used in your research.
LIMITATIONS
It is often useful, particularly in undergraduate research, to provide a summary of the
limitations of the research from methodological, theoretical or other points of view to
provide perspective and to serve as a possible basis for improvements in future projects.
ACKNOWLEDGEMENTS
Feel free to use this section to BRIEFLY acknowledge any and all who helped you bring
your project through to fruition. You may also thank any funding sources if appropriate.
REFERENCES
Provide a complete list of all cited materials in a format that is consistent with publications
in your area of study.

SUBMISSION GUIDELINES xiii
APPENDIX
This section is optional and generally unnecessary. In some cases, it may be included to
provide a more complete description of materials used. The editor of the SDSU Journal of
Undergraduate Research would prefer that no appendices be used. However, if absolutely
necessary, the number of pages in an appendix should be kept to an absolute minimum!

The Journal of Undergraduate Research would like to thank
Dr. Kevin Kephart, Vice President for Research, for his efforts
to secure funding for the Journal.
IMMIGRATION LIBERALIZATION IN THE 1
Immigration Liberalization in the United States
and Beyond
Author: Arran Davis
Faculty Sponsors: Dr. Joseph Santos and Dr. Timothy Nichols
Departments: Economics and Global Studies
ABSTRACT
Although it is known as a country of immigrants, immigration has always been a
controversial issue in the United States. Despite being a well-discussed topic for centuries,
many citizens still suffer from false assumptions about immigration. The objective of this
research was to investigate the impacts of immigration liberalization and to address
commonly held assumptions about the impact of immigration. Both pro and anti-
immigration literature was examined, with a focus on free market economics and the moral
impacts of immigration policy. It was determined that liberalizing immigration fits within
both left and right-leaning ideologies in the American political spectrum. Free migration is
shown to be a crucial aspect of free market policies, although right-leaning groups who
promote the economic philosophy often ignore it. The often-misunderstood secondary or
long run economic benefits of immigration liberalization are explained, with evidence
given regarding immigration’s positive effects on economic growth. Immigration
liberalization is also shown to be crucial to human rights, as it provides people with the
freedom to work where their labor is demanded. This gives impoverished immigrants a real
chance to improve their standards of living as well as those of their family members living
in their native countries. More open borders are also explained as a way to help spur
economic growth in underdeveloped countries. For these reasons, immigration
liberalization fits into many progressively liberal agendas. Rebuttals to the arguments of
anti-immigration groups are also provided. Finally, policy recommendations are given that
consider both pro and anti-immigration arguments. It is suggested that developed countries,
with a focus on the United States, liberalize their immigration policies by letting more
IMMIGRATION LIBERALIZATION IN THE 2
immigrants into the country to match their economies’ demand for their labor. The findings
of the paper are significant to society at large because they help to show that the economic
and moral benefits of immigration liberalization far outweigh the apparent problems that
many developed country citizens associate with immigration.
INTRODUCTION
“Few of their children learn English…The signs in our streets have inscriptions in both
languages…Unless the stream of their importation could be turned away they will soon
outnumber us…and even our government will become precarious,” although this sounds as
if it could have been said by any number of today’s right-wing politicians regarding Latino
immigrants, these are actually the words of Benjamin Franklin in the 1750’s. Franklin
wasn’t referring to Latinos, but instead to German immigrants. Ironically, many of these
people were the ancestors of today’s politicians who use the same anti-immigrant rhetoric
that was used by Franklin 250 years ago (Franklin par. 10).
Anti-immigrant sentiment is nothing new in this country of immigrants; since its
foundation Americans have been trying to keep others out because of fears they will take
jobs and benefits, depress wage, and ruin the country’s culture. In the 18th century Scotts
and Irishmen were said to be drunks with allegiances to foreign lands. In the 19th century
Germans and Italians were thought to have too many children that would be a drain on
American prosperity. Eastern Europeans were thought to bring crime, poverty and ethnic
ghettos. In the 1880’s racist campaigns led to exclusionary laws that kept out Asians and in
the 1920’s these polices were extended to include restrictions on the entry of “darker”
Europeans; Italians, Greeks, Poles and Russian Jews (Guskin & Wilson19). After the Great
Depression it was Mexican migrant workers that faced the anti-immigrant backlash. These
migrant workers had initially been brought into the country by U.S. Department of Labor
temporary worker programs, which the agricultural industry heavily lobbied for as a way to
address worker shortages. The program, known as the “bracero program,” allowed over
200,000 Mexican workers to legally enter the country to work by 1953. However, these
immigrants were soon blamed for taking jobs from natives and draining public services,
just as their counterparts from the past and present. In 1954, the U.S. government began
what it called Operation Wetback, a program aimed at deporting some of the very same
IMMIGRATION LIBERALIZATION IN THE 3
braceros brought into the country to work during shortages. Federal agents combed
Mexican-American neighborhood looking for anyone who “looked Mexican,” asking them
for documentation and deporting those who did not have it (Guskin & Wilson 111).
Although this practice seems blatantly racist, it has been resumed as a 21st century policy
by the political right in United States. New laws have been passed in Arizona and Alabama
that aim to curb illegal immigration based on the same reasoning that has been used in the
country for over 100 years. Law enforcement agencies in these states now have the power
to arrest and detain anyone they think looks like an illegal immigrant, leaving substantial
room for racial profiling (Summers par. 2). Another hardline stance found in Alabama law
is that it is now illegal to transport, harbor or rent property to illegal immigrants making it
possible for the child of an illegal immigrant to be arrested for giving his or her parent a
ride (Summers par. 4). Laws like these don’t just affect illegal immigrants; they affect legal
ones as well. In fact, Alabama’s new law has led some to suggest that Latinos here legally
are no longer being treated as citizens, but instead as suspects (Editorial: Alabama…).
When looking at the melting pot that is America today, and the contributions that these
previously persecuted people have made, the anti-immigrant fears of the past seem
shortsighted and prejudice. Yet today many Americans want to impose similar restrictive
policies on immigrants that want to come to America for the same reasons as past
immigrants: opportunity and freedom. However, the reasons for denying free immigration
seem to be based on xenophobia, racism and incorrect assumptions about economics. Both
the political left and right need to see that freer immigration does indeed fall in line with
their ideologies. For the right, free immigration should be recognized as a free market,
laissez-faire policy that is the most efficient way to create wealth. For the left, free
immigration is a way to help the poor; giving immigrants the chance to come to developing
countries changes their lives for the better. It is in the best interest of both the ideological
right and left in developed countries like the United States to realize the economic and
moral imperatives of implementing more liberal immigration policies. These policies will
not only benefit immigrant-receiving countries, but the entire global community.
IMMIGRATION LIBERALIZATION IN THE 4
IMMIGRATION LIBERALIZATION AS A
FREE MARKET POLICY
Humanity’s history of anti-immigrant sentiment is no surprise to evolutionary
psychologists. Many of them assert that anti-immigrant instincts are wired into our brain;
they were naturally selected for as we evolved over thousands of years. Paul H. Rubin in
his article “Evolution, Immigration and Trade” writes, “Our ancestors lived in relatively
small groups in which everyone knew everyone else. Our minds are adapted to deal with
populations of that size. Our ancestors made strong distinctions between members of the in-
group and outsiders” (par. 3). In a world in which people lived in small bands, the arrival of
“immigrants” meant a loss for the other members of the band. This is known as a zero-sum
game: if one human gains, then another must lose. However, in today’s world
circumstances and resources are not as fixed as they were for our ancestors. As economists
argue, contrary to our evolutionary intuition, not everything is a zero-sum game. Voluntary
trade, for example, is a positive sum game; it benefits both parties and if it doesn’t it won’t
occur. Immigration, as Rubin argues, is the same: “immigrants coming here to exchange
their labor for money that they exchange for the products of other people labor- is a
positive sum” (Rubin par. 4). Unfortunately, we did not evolve to think in this manner and
have difficulty seeing the positive economic effects of immigration.
Despite controversy around the subject, there are many factors that suggest immigration is
beneficial to recipient countries. Immigrants increase economic activity and growth
because they enable employers to fill jobs for which the supply of labor was previously
insufficient. With the extra resources that these immigrant workers bring, the market can
begin producing more goods and services. This, say economists, is what raises standards of
living of those in immigrant receiving countries (Ebeling 1).
Immigrants are also willing to be employed for less. This has many secondary effects that
lead to long-term economic gains. In sectors of the economy that can employ immigrants
for less production costs will go down because businesses will able to pay their employees
less in wages. Immigrants, in effect, grow the pool of labor available to work at lower
prices, thereby driving down wages. This creates two economic benefits. First, profits are
IMMIGRATION LIBERALIZATION IN THE 5
increased, allowing employers to expand their own business and invest in the expansion of
other business. As employers expand their business, they begin to hire more people and
produce more goods. An increase of goods in the market usually causes prices to decrease,
which will benefit every consumer of these goods and services. With the money they saved
from buying less expensive goods and services, consumers will want to buy different
things, thereby spurring growth in even more sectors of the economy.
For over 200 years economists have been advocating for the liberalization of trade as a free
market policy to increase economic growth and standards of living. Arguments for the free
circulation of labor can be traced back to the father of free trade economics, Adam Smith.
In his book, The Wealth of Nations, he argues that the free market is the most productive
economic system, and therefore the most beneficial to societies. Just as Smith argued that
goods and services be traded freely, he argued that people as well should be allowed to
trade their labor with whoever wants to hire them. Cleary, immigration barriers block the
free movement, or trade, of labor. According to Smith, policies that block free trade are less
productive and therefore less beneficial to society. In other words, free market economists
favor “the elimination of all privileges that groups of individuals secure by imposing legal
barriers to entry into the market, thereby artificially increasing the value of their services”
(Maloberti 551). Developed country and U.S. citizens alike are paying extra for these
artificially high priced goods and services. Imagine the economic expansion that would be
created if citizens in these economies were able to spend this extra money elsewhere.
Although the free movement of labor through immigration is a free market policy, it is
hardly ever proposed in politics. Since the 1980’s free market policies have dominated
discussions of the global economy; the free movement of capital, goods, and services are
strongly advocated by many countries as a way to increase people’s economic well being
(Herrera par. 3). Yet the free movement of labor is almost always left out of these talks
(Casey 18). This is interesting, considering the free movement of labor may be just as
important to free market economies as the free movement of capital, goods or services
(Casey 19). A freer movement of labor would allow for more perfect labor markets. Instead
of being stuck in developing countries with little work and few prospects, immigrants could
take their work to growing economies that need their labor.
IMMIGRATION LIBERALIZATION IN THE 6
The fact that at least some elements of the free movement of labor are not included in free
trade agreements is made to seem even more nonsensical when one considers that these
trade agreements are often the reason people need to immigrate in the first place. The free
flow of labor goes hand in hand with free trade, yet immigration barriers do not allow this
to happen. A perfect example of this can be seen in Mexico with the results of the North
American Free Trade Agreement (NAFTA). Under NAFTA tariffs were lifted that once
protected small, and mostly poor, Mexican farmers from an influx of cheaper U.S. food
commodities (Guskin and Wilson 25). As U.S. foods flooded the Mexican market, native
farmer’s crops became worth much less. Many had to give up farming because they simply
could not compete with bigger, more efficient American farms. Without work in their home
countries, many breadwinners were left with no option but to try to get into the United
States, where they knew they could find a job that would support their family back home.
In some especially hard hit Mexican states hundreds of families were forced to migrate
each week in search of work. Many chose to enter the U.S. illegally because they had no
opportunity to do so legally (Avalos-Sartorio 7). Although free trade created this situation,
America’s restrictive immigration policies have essentially blocked the market from fixing
it. It seems nonsensical to block a flow of labor that results from free trade. Ideally, Central
American workers that lost their job could immigrate to the U.S. to find work. Yet, with
today’s American immigration policy, this is nearly impossible for most of them to do
legally.
“The U.S. immigration system is still characterized by a convoluted set of arbitrary
numerical quotas that were devised in the 1960’s,” writes Walter Ewing’s in his article
“The Many Facets of Immigration Reform (110).” He goes on to assert that these policies
have created a decades long discrepancy in the amount of labor the United States lets in and
the amount of labor the economy requires (113). The fact that America experienced such a
spike in illegal immigration during the 1990’s reflects the fact that immigration policy met
neither U.S. employers nor Central American laborer’s demands (Ewing 116). Outweighing
immigrant’s choice to move to America is the fact that capitalism effectively sucks them
into the country by offering them so many jobs, regardless of their legality. Immigrant
workers are only fulfilling a demand created by developed country economic systems.
Evidence for this is seen in the visa application process. For both skilled and unskilled
IMMIGRATION LIBERALIZATION IN THE 7
labor the demand for work visas is so great that the limit is reached months in advance,
leaving thousands who want to come to the country to work with no legal option to do so
(Guskin and Wilson 115). This is not surprising considering the United States does not
recognize economic refugees, such as those of Central America, when considering who to
let in the country even though these people are often as helpless to improve their situation
as any other type of refugee (Guskin and Wilson 45). It has already been shown that this
policy leaves many trapped in their own countries without work, obviously worse off than
if they were allowed to freely move their labor to where its demanded. If they were
allowed to, many immigrants would come to America to work. The vast majority of these
immigrants end up in the local labor market (Zientara 68). Jane Guskin and David L.
Wilson write in their book The Politics of Immigration that the free movement of labor
means “a profit-driven model of ‘labor mobility,’ in which employers benefit from a large
global pool of qualified workers competing for jobs” (133). Immigrants also end up
participating in other ways in the local economy. According to Ewing, illegal immigrants
alone make up a very important part of the U.S. economy; they spend $551.6 billion
annually, create $245 billion in annual economic output, and fill more than 2.8 million jobs
(114). Clearly, immigrants contribute to the economy, and their labor is crucial to its
continued growth. Furthermore, immigrants may be needed to combat aging populations,
falling birth rates, and lack of low-skilled workers in developing countries. This seems to
be the case, especially when one looks at demographics in the United States. By 2030, it is
projected that the ratio of retired seniors to working age adults will increase by 67% as the
country’s “Baby Boom” generation retires and younger generations have fewer children
(Ewing 116). Demographer Dowell Myers writes in her article “Thinking Ahead About Our
Immigration Future” that this will bring on “not only fiscal crisis in the Social Security and
Medicare systems, but workforce losses due to mass retirements that will drive labor-force
perilously low (1).” In addition, half the jobs that will be opening up due to these “mass
retirements” and regular economic growth will be occupations that require no post-
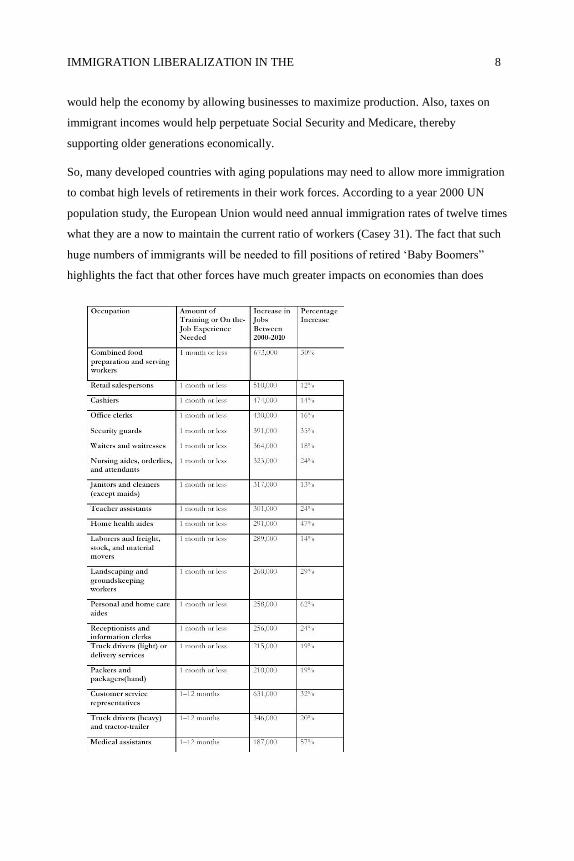
secondary training, according to the U.S. Bureau of Labor Statistics (Ewing 116). In fact, as
seen in Table 1, growth in the non-skilled labor sector of the U.S. economy will be huge,
but only 13% of the country’s native workers have less than a high school degree (Anrig
and Wang). Of course, immigration is a major solution to these problems. Immigrants
could help fill these jobs if barriers to them coming into the country were relaxed. This
IMMIGRATION LIBERALIZATION IN THE 8
would help the economy by allowing businesses to maximize production. Also, taxes on
immigrant incomes would help perpetuate Social Security and Medicare, thereby
supporting older generations economically.
So, many developed countries with aging populations may need to allow more immigration
to combat high levels of retirements in their work forces. According to a year 2000 UN
population study, the European Union would need annual immigration rates of twelve times
what they are a now to maintain the current ratio of workers (Casey 31). The fact that such
huge numbers of immigrants will be needed to fill positions of retired ‘Baby Boomers”
highlights the fact that other forces have much greater impacts on economies than does
IMMIGRATION LIBERALIZATION IN THE 9
immigration. Retirement policies, the participation of older people and women in the
workforce, and lower birth rates are all factors that can affect an economy much more than
the amount of immigrants entering the workforce. Further evidence for the U.S. economy’s
demand for immigrant labor, both legal and illegal, was generated in the aftermath of
Alabama’s laws that combat illegal immigration. Since employers in the state were required
to hire only legal citizens there has been an extreme shortage of workers in sectors usually
dominated by illegal immigrants. Produce has been rotting in fields as employers cannot
find any unemployed native workers willing to do the jobs that the laws’ supporters claim
the illegal immigrants were stealing from them (Editorial: Alabama…).
This leads to the well-known and widely accepted premise that immigrants take jobs that
native workers simply do not want to do (like the jobs in Table 1), at least not at the price
employers are willing to pay. “Indeed, without cheap immigrant labor, some sectors of rich
country economies – most notably agriculture and lower-end services – would face serious
problems owing to lack of workers,” writes economist Piotr Zientara (71). Companies that
lack workers because of immigration barriers, such as those in Alabama, cannot reach their
full production and may have to pay workers higher wages because of a shrunken supply of
labor. This means higher prices for consumers and fewer profits to invest in economic
expansion, which can result in less economic growth (Ebeling 2).
So, immigration is in many ways beneficial to the economies of receiving countries. In fact,
according to a 2003 report from the Federal Reserve Bank of Dallas, the economic growth
of the 1990’s wouldn’t have been possible without immigrant labor. It states that
immigrants have been a driving force behind job growth in the country. They are now
filling an increased share of jobs in the U.S. as demand for their labor has increased in the
low-skilled labor sector since many native workers have become too educated to want these
jobs (Anrig and Wang). It is in this way that immigration is most important to developing
country economies. Immigrants do more than spend money in their new economies, which
creates jobs; they also fill jobs that otherwise would have gone unfilled. Both of these facts
help economic growth. For decades the political right in developed countries, especially the
U.S., has focused its policy on free market economics as a means of creating wealth. It is
time that these groups begin to embrace immigration as a part of free market policy; the
IMMIGRATION LIBERALIZATION IN THE 10
economics of immigration should be a justification for the right’s support of more open
borders, not a reason to build higher fences.
IMMIGRATION LIBERALIZATION AS A
FREE MARKET DEVELOPMENT POLICY
Aside from benefiting the economies of recipient countries, immigration liberalization
helps immigrants and their families work toward better lives in their native countries. In
this way, allowing freer migration is a way in which developed countries can help
developing countries. In today’s world, most immigrants move from poor to rich countries
in search of work. However, many more are not allowed to move because of extensive
immigration barriers; these barriers force the poor to stay in their countries, segregated
from the rich. John P. Casey in his article “Open Borders” writes, “closed borders only
entrench the global apartheid that keeps the poor in their homelands” (54). Not surprisingly,
developing countries have been calling for the opening up of developed country labor
markets and an end to this system of closed borders. Both the World Bank and the UN have
acknowledged the benefits of a freer movement of labor for developing countries (Casey
16).
Increased immigration generates economic opportunities in immigrant sending countries as
well as receiving countries. A major form in which developing country economies are
helped is through remittances – immigrants sending money home to their families. In some
developing countries this money makes up over 10% of GDP. Furthermore, this money is
often spent on education or health care, which increase human capital and helps the
development of these countries even more (Zientara 70). Many immigrants also return to
their home countries and invest their profits in its economy. Even though wages of
immigrant workers are usually rather low by developed country standards, they equate to
large sums of money in their native, developing countries. This money can be used as
capital to start new businesses. Allowing immigration also helps the dispersion of
knowledge from rich to poor countries, which is crucial to the development of successful
business and higher standards of living (Zientara 70). In many ways, more open
immigration laws would help bridge the current income gap between the richer countries of
IMMIGRATION LIBERALIZATION IN THE 11
the northern hemisphere and the poorer countries of the southern hemisphere. Many on the
political left see economic inequality as a terrible injustice; liberalizing immigration is one
way to address this issue.
Another benefit of freer immigration to global society would be that developed countries
could use free movement of labor policies as a type of development aid to poorer countries.
First, allowing freer immigration will act as a safety valve for developing country
economies that cannot create enough jobs for their populations. This is especially true for
young people, who make up large percentages of the working population in developing
countries. It is a well known fact that political unrest and resentment towards the west in
developing countries is often tied to young populations who cannot find work. Also, as
previously discussed, freer immigration laws help developing country economies. In fact,
the UN estimates that in 2004 remittances injected $172 billion into developing economies
while during the same year aid made up less than 1/3 of this amount, around $50 billion
(Casey 34). If developing countries were to further open their borders to immigration,
increased money from remittances would spur economic growth. Not only would free
migration benefit both developing and developed countries, it would also give those in rich
countries more incentive to effectively help the economies of poor counties. If economies
in poorer countries were performing well their citizens would have less need to immigrate
to the developed world (Casey 36-37).
IMMIGRATION LIBERALIZATION AS
PART OF A GLOBAL HUMAN RIGHTS
AGENDA
More open borders are more than a smart choice economically for poor countries and rich
country citizens; they are also the right choice morally. From the perspective of the
progressive political left, immigration liberalization can be justified as part of a global
human rights agenda that gives dignity and opportunity to the world’s poor. Many feel that
privileged citizens in the global community should feel an obligation to help the less
fortunate. On top of this, isn’t it just to give those living in poverty in developing countries
IMMIGRATION LIBERALIZATION IN THE 12
a chance at a better life by allowing them to work where their labor is demanded? For many
progressive liberals the answer is yes. If developed country citizens truly believe that all
people are equal, it would be nothing less than a tragedy for them to bar poor immigrants
from coming into their country to work for a better life for themselves and their families.
However, current immigration laws do not allow many people to come to America in
search of a better life. To many, this is a violation of these people’s human rights (Guskin
133). Maloberti expresses this opinion: “rights entail the permissibility of not merely using
resources, but also of exchanging them by mutual consent. Immigration barriers prevent
individuals from doing so, and thus they preclude individuals from the opportunity to
improve their lives” (550). What makes the situation even more unjust for the poor is that
the world’s rich usually have no problem moving from one country to another. Casey
writes that the rich are “courted in official immigration programs, protected by internal
labor markets of global organizations, and aided by a lucrative immigration law
industry…In effect, it is already a borderless world for those who have the resources to
exploit it” (18).
Furthermore, for citizens of democratic and free nations, freedom of movement within the
country’s borders is taken for granted. Anything less would be a violation of citizens’ rights
to work and live where they want. This thinking is reflected in the Universal Declaration of
Human Rights, which guarantees freedom of movement within one’s country and also the
right to leave one’s country (The Universal Declaration…). But curiously, and perhaps
reflecting current global sentiment towards immigration, it does not extend the right to
settle in another country (Casey 15). However, if one is guaranteed the right to leave an
oppressive country, but not allowed to settle in a new one, aren’t they in effect not able to
exercise their right to leave an oppressive country?
Allowing freer immigration would encourage positive change in developing country
governments. Casey writes that “Expatriates often pressure for political change…Sending
countries have benefited considerably from the political expertise of expatriates” (34-35).
After living in developed countries with democracies, the experience of many immigrants
is extremely valuable to their native countries when they return home. Many are elected to
office or serve in government positions (Casey 35). Furthermore, immigration barriers
decrease pressure on developing governments to improve. Since immigration is so difficult
IMMIGRATION LIBERALIZATION IN THE 13
there is very little competitive pressure on governments to give better lives to their people
so that they would want to remain in their native country; many are effectively trapped in
countries with bad governments. No matter how much they dislike their government, they
will probably have to live there. In the article “Government by Choice” classical liberal
Nicolas Maloberti argues, “immigration barriers usually condemn them to live in nations
with defective institutional systems under which individuals lack incentives to save and
invest” he goes on to say that governments can take advantage of their populations only
when there are “constraints on mobility” (556). If people could move freely, ineffective
governments would collapse as those unhappy with the system leave.
Strong immigration barriers effectively trap people in countries with poor governments and
standards of living. Many times people in developing countries have no way out of extreme
poverty and unhealthy living conditions. John P. Casey writes of the moral obligation
developing countries have to help these people. If they cannot or will not improve their
situation through effective aid they should at least be willing to admit poor immigrants into
their country as a way of improving their lives. This seems especially true when
considering many developed country’s history of exploiting their former colonies, which
today have become the developing countries that immigrants come from. Freer migration,
says Casey, would increase equality and improve the lives of the poor (38). Many NGO’s
and advocates for the world’s poor see the benefit of economic liberalization in improving
lives in developing countries. They call for a greater emphasis on the “social justice
dimensions of economic and trade agreements, which includes increased rights of the
circulation of labor” (Casey 46). Again, the Universal Declaration of Human Rights is
applicable; it states in Article 23 “everyone has the right to work, to free choice of
employment.” Closed borders infringe upon this human right, keeping developing country
citizens trapped in small labor markets with low-paying jobs and few opportunities for
employment.
Aside from denying the poor a way to improve their lives, restrictive immigration laws also
block the unification of their families. This can happen in a number of ways. In the U.S.,
deportations of parents with native-born children, who automatically have citizenship, often
leave families separated (Guskin and Wilson 47). 52% of Guatemalans deported from the
United States leave a spouse or child in the counrty (Guskin and Wilson 123). An
IMMIGRATION LIBERALIZATION IN THE 14
astonishing 5,100 children of immigrants have been left to foster care as a result of their
parents being either detained or deported (Riggs). According to Guskin and Wilson, “the
deportation of a breadwinner can plunge children and partners into sudden poverty, and
force them to seek public benefits” (123). Strong border enforcement also means that once
illegal immigrants arrive in a country, they are separated from their families in their home
country for decades because the risk and cost of illegal entry is too high for immigrants to
frequently forgo (Guskin and Wilson 53). There is no doubting the emotional and financial
toll that this takes on immigrant families.
When illegal immigrants do work and live in the United States, their undocumented status
often makes them easy targets for abuse. Working and living conditions for illegal
immigrants are notoriously poor. Employers and landlords know that illegal immigrants
probably won’t report abuses to authorities or organize for better treatment for fear of being
deported. Fear of contacting law enforcement also makes undocumented immigrants an
easy target for thieves. They also have trouble applying for jobs and school, finding
housing and getting drivers licenses (Guskin and Wilson 51-52). Immigrants who lack legal
status but have lived and gone to school in the United States since their childhood often
find themselves with no option for post-secondary education because non-citizens are not
eligible for financial aid (Guskin and Wilson 54). This lack of educational opportunities
perpetuates the poor salaries and living conditions of immigrant populations and does
nothing to help their productivity or integration into society. Giving these people access to
citizenship would improve their working and living conditions, increase their levels of
education and make their lives safer.
ARGUMENTS AGAINST IMMIGRATION
LIBERALIZATION AND THEIR
REBUTTALS
Despite apparent economic and ethical reasons for more liberal immigration laws, there are
many who favor a world of closed borders, or at least borders that are closed to immigrants.
When considering the popularity of free immigration policies John P. Casey writes that
IMMIGRATION LIBERALIZATION IN THE 15
“the vast majority of the population is against such a policy and there is wide-spread
opposition to immigration in general” (24). Many developed countries favor restrictive
immigration policies because they fear immigration hurts the welfare of native citizens by
ruining culture, raising crime levels, decreasing wages, taking jobs, threatening national
security and flooding recipient countries with huge numbers of poor people which creates
ghettos and puts a strain on government goods and services.
All of these reasons- immigrations effect on the economy, society and national security-
lead anti-immigration organizations to call for stricter enforcement of immigration laws and
reductions in the number of immigrants the country allows in. Some of these groups would
even like to see the country’s population shrink as a result of having a closed border policy
(Immigration 101). The Federation for American Immigration Reform (FAIR), a leading
anti-immigration group, has rather ambitious policy recommendations: it calls for
increasing border control, more enforcement of immigration laws in the country’s interior
by local police departments, and a system of national ID cards to verify citizenship. FAIR’s
policies are by no means extreme when compared to those of the Republican Party, whose
platform on immigration includes “completing the border fence quickly,” denying illegal
immigrants driver’s license, and opposing any type of amnesty (National Security). Mitt
Romney, a leading candidate for the 2012 Republican Presidential nomination, takes a firm
stance on immigration. He proposed a system of government ID cards that would show
immigrants had proper federal documentation. Those without valid cards would effectively
be barred from the employment market. He hopes illegal immigrants will “self-deport” as a
result of not being able to work or use even the most basic of the country’s public services
(Boroff & Planas). Through policies like these, anti-immigration contingencies hope to
reduce the number of illegal immigrants in the country thereby reducing the negative
economic and social effects they think they create.
Being able to choose who can live in a country, and therefor immigration levels, is seen as
a fundamental right to national sovereignty. The debate on immigration today is largely
shaped by the idea that, under international law, nations have the “right and power to grant
or withhold permission to settle (Casey 19).” This right is considered in current
international law to trump what Maloberti argued was the right of the individual to freely
IMMIGRATION LIBERALIZATION IN THE 16
trade his labor for a salary with anyone willing to do so (550). Christopher Wellman
explains that:
as an individual has the right to determine whom (if anyone) he or she would like
to marry, a group of fellow-citizens has a right to determine whom (if anyone) it
would like to invite into its political community…a state’s freedom of association
entitles it to exclude all foreigners from its political community (Maloberti 549).
Arguments for freedom of association like these generally stand up in courts of law,
especially in the United States. For example, the U.S. Supreme Court has defended the
rights of private organizations, like the Jaycees, to exclude women on the grounds that it
was their right to decide whom to include in their groups and that allowing anyone would
infringe on the groups freedom of expression. The argument used by the Jaycees has many
parallels with the argument nations use to exclude immigrants. Nations should be able to
decide just who gets to make up their national character.
So, a nation should have the right to exclude whom it wants according to current norms in
international law. To take away this right would infringe upon its sovereignty. However,
this does not mean that it is in their best interest to do so; countries have the right to trade
protectionism as well but most have accepted that the free trade of goods and services is a
practice with net economic benefits. Immigration should be seen in the same light and
immigration barriers should be seen as protectionism for native workers, a practice with
negative economic consequences. The arguments against strict immigration laws are
compelling, even when considering the arguments of anti-immigration factions.
The “Mexican Reconquista” Argument: Allowing such high numbers of
“Hispanics” into the country will dilute American culture and ruin its “social
fabric.”
Anti-immigration groups assert that today’s immigrants do not share cultural values that
made America so successful in the past, such as a support of democratic institutions. AIC
states on its website that:
Because America's culture, customs, language, and laws are under assault from
foreigners who come to live here and, instead of learning the American way of
IMMIGRATION LIBERALIZATION IN THE 17
life, choose to impose their own alien cultures, languages, and institutions upon
us, we must review our heritage and understand the need to preserve it, lest
America self-destruct through ethnic strife (A Brief History...).
They argue that allowing more immigrants will only destroy the social fabric that makes up
America today. Having large numbers of immigrants that were raised under different values
and institutions could introduce corruption and chaos to the United States (Maloberti 558).
This would undoubtedly change the structure of the country itself, leading to what some
would see as reprehensible results (Maloberti 559). Micheal Walzer makes this point clear,
he writes that with no barriers to immigration a “historically stable, ongoing association of
men and women with some special commitment to one another and some special sense of
their common life” could not exist (Maloberti 551).
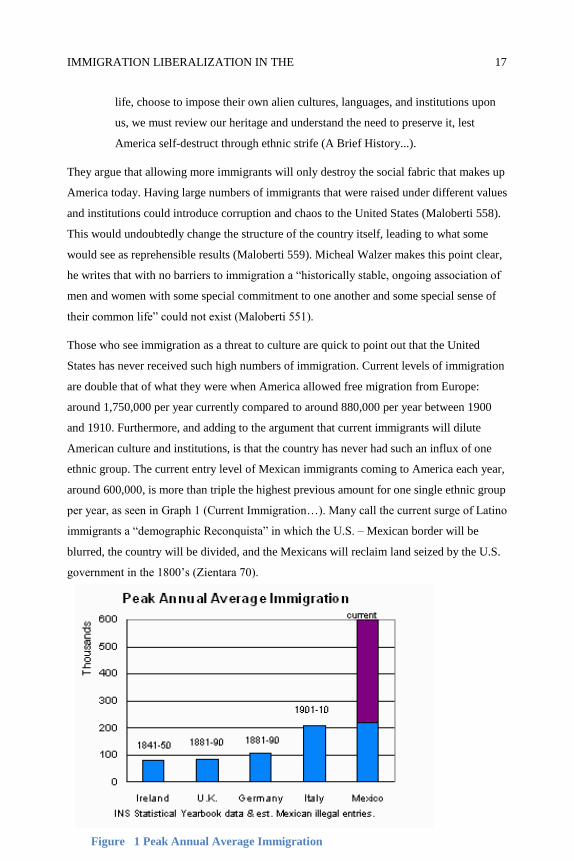
Those who see immigration as a threat to culture are quick to point out that the United
States has never received such high numbers of immigration. Current levels of immigration
are double that of what they were when America allowed free migration from Europe:
around 1,750,000 per year currently compared to around 880,000 per year between 1900
and 1910. Furthermore, and adding to the argument that current immigrants will dilute
American culture and institutions, is that the country has never had such an influx of one
ethnic group. The current entry level of Mexican immigrants coming to America each year,
around 600,000, is more than triple the highest previous amount for one single ethnic group
per year, as seen in Graph 1 (Current Immigration…). Many call the current surge of Latino
immigrants a “demographic Reconquista” in which the U.S. – Mexican border will be
blurred, the country will be divided, and the Mexicans will reclaim land seized by the U.S.
government in the 1800’s (Zientara 70).
Figure 1 Peak Annual Average Immigration
IMMIGRATION LIBERALIZATION IN THE 18
Rebuttal to the “Mexican Reconquista” Argument
Immigration opponents cite the fact that there has never been such an influx of one type of
ethnic immigrants. 600,000 Mexicans enter the country each year. The previous highest
total was around 200,000 Italians entering the country each year between 1900-1910. FAIR
seems to be implying that this is evidence for the “demographic Reconquista” that will ruin
American culture and turn the country into Mexico. What groups like FAIR fail to note is
that the U.S. population in 1910 was about 1/3 of what it is today: around 92 million
compared to around 310 million (Demographic history…). This means that proportionately
to the country’s population the amount of Mexican immigrants today is equal to the amount
of Italian immigrants in 1910. So, to say that today’s Mexican immigrants will have more
impact on American culture than Italian immigrants did in 1910 is unfair. Most
immigration opponents today do not regret allowing Italians to immigrate to the country in
the past; in fact, many may be their descendants. Also, to say that Arizona and California
are becoming like Mexico is to ignore the fact that California and Arizona were Mexican
before the U.S. forced the Mexican cession of these territories after its victory in the
Mexican-American War in 1848. These territories never lost their Mexican heritage and
Mexican immigrants today in these areas are only carrying on societal traditions that have
existed for centuries.
Immigration opponents have also argued that today’s new wave of immigrants is too
different in culture, customs and language, to be integrated successfully into American
society. Others have said they will ruin American culture, changing it into a new Vietnam,
China or Mexico. This has been said for generations about each new group of immigrants.
As Ebeling points out, “with every wave of immigrants, the concern was expressed that the
new group would not be able to adapt to American life” (3). These fears turned out to be
wrong. In the 1800’s it was Germans who were accused of always needing to speak their
native language and living in ethnic ghettos. It was said that immigrant populations like the
Germans would never integrate into American society. History has shown that within one
generation the children of immigrants become “Americanized;” they speak English and
disperse throughout the country. Guskin and Wilson cite the fact that today’s immigrants
are just as likely as past immigrants to learn English and integrate into society (80). On top
of this, globalization is only making integration into American society easier; many
IMMIGRATION LIBERALIZATION IN THE 19
immigrants have already been exposed to western lifestyles. Yes, these immigrants will
change American culture. But they will change it for the better; America is a melting pot of
the world’s greatest characteristics. It has been since immigrants founded the country and
helped it grow. For over 250 years immigrants have been a positive force of change in
America. There is no reason to think that today’s immigrants will not do the same as
immigrants before them, to say they won’t is to ignore the lessons taught by history.
The “Poor Pouring In” Argument: Open borders would result in poor people flooding into
the country and living in poor ethnic enclaves. This would put a strain on public education
and infrastructure, welfare, healthcare, and the prison system.
Those who lobby for stronger immigration laws point to the fact that today’s immigrants
will overrun America with poor people. They assert that immigrants today are an even
greater burden on the U.S. government budget than previous generations. They receive
public funds for welfare, healthcare and education. They also put a strain on public
infrastructure such as roads and sewage systems. The Federation for American Immigration
Reform (FAIR) argues that immigrants of previous generation were more likely to return
home after they had made enough money to support their families, thereby avoiding many
of the costs they impose on society. In 1904 nearly 37% of immigrants in America returned
home, while today the number is only 15%. This is a huge problem; according to FAIR the
average immigrant has a “net annual cost of $2700” because of the small amount of taxes
they pay relative to their use of government goods and services (Immigration Now…).
Furthermore, those who see the welfare system as illegitimate especially dislike free
immigration. Maloberti writes that for these people “immigration barriers are taken to be
justified insofar as they prevent further extension of such a system and by doing so prevent
even greater numbers of illegitimate transfers (549,). The National Academy of Sciences
found that although immigrants are only 10% of households, they cost native households
over $250 a year in tax money to support them (Guskin and Wilson 63). This statistic is
reflected in the fact that, on average, immigrant households pay 1/3 less in taxes than does
the average American household because of their lower earnings. These lower earnings also
mean that 21% of immigrant households are on welfare, compared to 14% of native
households (Immigration 101).
IMMIGRATION LIBERALIZATION IN THE 20
To add to this problem, FAIR points out that “ethnic enclaves are huge and growing,” and
that these immigrant populations have negative effects on society. Casey writes “most
importantly, the free movement of immigrants is seen as threatening current living
standards…but there are also fears about loss of existing culture, about rising crime” (25).
Upon arriving, many immigrants move to low-income areas with cheap housing. The
arrival of more immigrants will only increase the amount of low-quality, overcrowded
housing. FAIR notes the “share of overcrowded housing is seven times higher in high
immigration cities than in low immigration cities” (Immigration 101). Furthermore, these
immigrant populations cost the American taxpayer. Immigrant use of “government
infrastructure” costs $1.37 billion a year in tax money. 43% of immigrants do not have
medical insurance, when they cannot pay for these bills it is passed on to the public, costing
them a total of $20 billion annually. Taxpayer money also pays for the education of
immigrant children. FAIR makes sure to point out that:
Without school-age immigrants and the children of immigrants, school
enrollment would not be rising at all. The estimated cost to the American
taxpayer for the education of immigrants’ children is over $30 billion a year
(Immigration 101).
On top of these costs, there are statistics that imply a correlation between immigration and
increased crime levels. For example, 25% of the U.S. federal prison population is foreign-
born and the government has around 30,000 immigrants in detention each day, which cost
almost $1 billion annually (Guskin and Wilson 131).
Rebuttal to the Argument that the Poor would Overcrowd America
Anti-immigration proponents argue that if the country opened its borders to more
immigrants there would be a huge influx of poor people that would put strains on the
country’s social institutions and infrastructure. However, there is no telling just how many
immigrants would come if America opened its borders. It is hard to believe that more
immigrants would come then there are jobs available. Evidence is seen for this when one
compares U.S. economic performance with immigration flows; it seems that immigration
falls dramatically when the economy is preforming poorly. This makes perfect sense;
immigrants come when jobs are available and they stay home when work becomes scare in
IMMIGRATION LIBERALIZATION IN THE 21
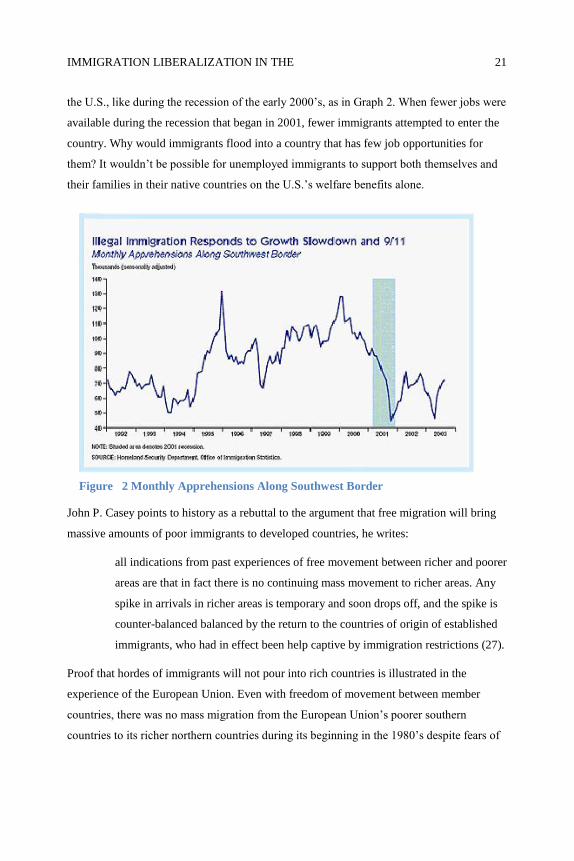
the U.S., like during the recession of the early 2000’s, as in Graph 2. When fewer jobs were
available during the recession that began in 2001, fewer immigrants attempted to enter the
country. Why would immigrants flood into a country that has few job opportunities for
them? It wouldn’t be possible for unemployed immigrants to support both themselves and
their families in their native countries on the U.S.’s welfare benefits alone.
John P. Casey points to history as a rebuttal to the argument that free migration will bring
massive amounts of poor immigrants to developed countries, he writes:
all indications from past experiences of free movement between richer and poorer
areas are that in fact there is no continuing mass movement to richer areas. Any
spike in arrivals in richer areas is temporary and soon drops off, and the spike is
counter-balanced balanced by the return to the countries of origin of established
immigrants, who had in effect been help captive by immigration restrictions (27).
Proof that hordes of immigrants will not pour into rich countries is illustrated in the
experience of the European Union. Even with freedom of movement between member
countries, there was no mass migration from the European Union’s poorer southern
countries to its richer northern countries during its beginning in the 1980’s despite fears of
Figure 2 Monthly Apprehensions Along Southwest Border
IMMIGRATION LIBERALIZATION IN THE 22
mass exoduses (Casey 29). Twenty years later as the E.U. prepared to absorb 10 new
countries with average incomes around half that of existing E.U. countries, fears of mass
migrations again arose. However, as Guskin and Wilson write, “the feared economic
consequences of mass migration from new E.U. member states to more prosperous western
European states have largely failed to materialize “(136). Even though European Union
member citizens have the right to live in whatever country they feel benefits them most,
less than 3% live away from their native countries (Casey 28).
This statistic reflects the fact that most people don’t like leaving their homes. All people
face emotional, social, economic and psychological disincentives when making the choice
to immigrate. Leaving the comfort of one’s native language and culture, as well as leaving
behind family members, is not the first choice of immigrants. For many it is a last resort, as
families simply cannot make enough money to get out of poverty and improve their lives in
their home countries. Zientara has also found that “cultural affinity and geographical
proximity (as well as the presence of a diaspora) seem to be instrumental in determining
where migrants move” (67). Even if immigrants did want to leave home they would have to
be able to afford to do so first; it would be difficult for an immigrant that earns $1 a day in
his home country to afford a $1000 plain ticket to the United States. Casey writes that,
paradoxically, it is not the poorest, most desperate that migrate, but instead the ones with
the “personal and financial capital” to do so (30).
Circular migration is another concept that drives down the likelihood of poor people
overcrowding rich countries under a system of open borders. Many believe that under a
global system of open borders, immigrant would be able to “circulate” between their native
countries and their countries of origin (Casey 28). Immigrants would no longer be “bottled
up” in recipient countries out of fear of not being able to get back in if they return to their
native countries. Another example of what has happened under open border agreements
between countries with large differences in wealth can be seen with the arrangement
between the United States and Puerto Rico. Although Puerto Ricans have full rights to live
in the United States, nearly half of all Puerto Rican immigrants that came to the United
States returned to Puerto Rico in less than 2 years (Casey 30). A system like this, under
which immigrants could practice circular migration, would be much more in tune with the
needs not only of the immigrants but also of recipient country economies. Furthermore,
IMMIGRATION LIBERALIZATION IN THE 23
developing countries may begin to realize the correlation of wealth disparities between
countries and immigration. Knowing that poor countries send immigrants, developed
countries may take more initiative to improve standards of living in the developing world.
In this sense, rich country aid and trade policies can directly contribute to better living
conditions in the developed world so that people there have less need to immigrate (Casey
31).
Rebuttal to the Argument that Immigrants put a Strain on Public
Education and Infrastructure, Welfare, Healthcare, and the Prison
System
Another argument against immigrants is that they do not pay taxes and are a burden on the
welfare, health and prison systems as well as public infrastructure. A closer look at the
argument used by anti-immigration groups and politicians reveals some flaws in their
arguments. Take the statistic used by FAIR that immigrant households cost native
households $2700 dollars a year. Guskin and Wilson write that “taken out of context this
seems like ammunition for immigration opponents. But native-born young people with
families are also a ‘burden’ on the system in the exact same way – they too make less
money and pay less in taxes while they are raising their children (63).” The National
Academy of Sciences, the group that initially found this statistic, went on to explain that in
the long-run immigrants more than make up for what they take in the beginning, just like
native worker do over time and as their children leave home (Guskin and Wilson 64). The
fact that in 2009 Americans 65 and older had an average net worth of $120,457 while
those 35 and younger had and average net worth of $3,662 seems to back this assertion
(Marche table 1). When considering health care one must take into the account that most
immigrants are young, meaning that they are on average no more likely need government
services than native citizens. Young immigrants have the chance to pay their dues like
native citizens before they take advantage of social security and Medicare. The assertion
that immigrants are disproportionately more likely to be criminal is also unfair. A joint
study by two nonpartisan Washington-based research groups, the Urban Institute and the
Carnegie Endowment for International Peace, actually found the opposite: “immigrants are
disproportionately unlikely to be criminal” (Guskin and Wilson 83). Robert J. Sampson, the
IMMIGRATION LIBERALIZATION IN THE 24
chairman of the Department of Sociology at Harvard University, has found that first
generation immigrants commit violent crimes at a rate 45 percent lower than third
generation or native-born Americans (Immigrants Responsible For…). He goes on to say
that “In the '90s and continuing to the present, we've seen a great deal of increase in
immigration from countries around the world. In fact, as immigration has increased, we've
seen correlated declines in the crime rate” (par 8). Sampson’s finding seem to suggest that
immigration is at least partially responsible for lower crime rates, a finding contrary to the
stereotype that immigrants bring crime. Furthermore, if immigrants were made legal they
would have more chances at finding legitimate work, which would reduce their need to
depend on criminal activity to make a living.
Another problem to immigration liberalization is that many see any redistribution of wealth
through welfare as an injustice because it violates citizen’s rights by redistributing money
against their will. For these people open borders are undesirable because the welfare system
will be expanded as immigrants arrive. In other words, these people are willing to create
immigration barriers (which infringe on an individual’s right to move in search of a better
life) in order to prevent an extension of the welfare system (which they see as a violation of
their rights). Even for these people, writes Maloberti, a welfare state with open borders is
preferable to a welfare state with closed borders (555). A person’s country of origin is
morally irrelevant when considering their rights towards welfare. Even if welfare is an
injustice, “maintaining of immigration barriers entails an equal injustice, at least for those
who might otherwise escape from dire situations” because they prevent people from
moving to countries where they can improve their lives. For Maloberti, it is not acceptable
to prevent one injustice, welfare, by invoking and even greater injustice, immigration
barriers (556-557). It seems that here Maloberti is employing a utilitarian argument;
allowing immigrants to take advantage of welfare at the expense of a country’s tax payers
will create more “happiness” than would closing its borders and keeping the welfare state
small by not allowing anyone new to join. This being said it must be remembered that
immigrants will very likely immigrate to work, not to receive welfare benefits. If they were
made legal, the tax revenue created from taxing immigrant income would actually benefit
the welfare state, not be a burden on it.

IMMIGRATION LIBERALIZATION IN THE 25
Any argument that asserts immigration is a strain on welfare and government budgets is
inevitably linked to the fact that illegal immigrants don’t pay taxes, but they can’t pay all
their taxes because the government has no way of billing them. Immigration opponents are
essentially blaming immigrants for a problem that was created by policies they advocate,
mainly not giving immigrants citizenship. By legalizing immigration, the U.S. would gain
billions in tax revenue from previously illegal workers that were not being fully taxed
(Guskin and Wilson 139). Zientara cites a U.S. Congressional Budget Office report on an
immigration legalization, or amnesty, bill that proves this assumption. The report found that
by legalizing current illegal immigrants in the U.S. the government would increase its
revenue by $66 billion over a ten year period through income and payroll taxes on newly
legalized immigrants. This new tax revenue would result in a net gain in the federal budget
of $12 billion over 10 years as newly legalized immigrants would only use $54 billion in
government benefits during that same time period (115). Also, as previously explained,
immigrant labor increases corporate profits. This, says Zientara, will also generate more tax
revenue for the federal government as it will get more money from the taxation of these
companies’ profits (71). Finally legalized immigrants make more money, thereby
increasing the federal government’s revenue from income taxes (Guskin and Wilson 55).
So, although on the surface immigration looks to be harmful to recipient country economies
and welfare systems, when one looks at the long term and secondary benefits of immigrants
working legally, it is clear that immigration brings a net benefit to recipient countries.
When it comes to welfare, it seems that immigration is again the right choice morally and
economically.
Economic Argument: “Immigrants take Native Jobs”
Aside from costs to society, opponents of immigration also point to what they claim are its
negative economic effects. A central claim is that immigrants take native jobs. Casey notes
that the poor in immigrant receiving countries will be exposed to competition because
“low-skilled and low-waged labor is theoretically substitutable by immigrants" (32). Nearly
2 million American workers are displaced each year by immigrants, and providing
assistance for these laid-off Americans costs taxpayers $15 billion a year (Immigration
101). What is even more disheartening for immigration opponents is that the U.S. continues
to let in immigrants while around 10% of its population is unemployed. In the next ten
IMMIGRATION LIBERALIZATION IN THE 26
years 22 million jobs will be created for 17 million native workers, but FAIR states that
“this job creation will be cancelled out by the 6.5 million immigrants expected to enter the
job market (Immigration 101).”
Rebuttal to the Argument that Immigrants take Native Jobs
The claim that immigrants take native jobs is based on shortsighted, flawed economics.
Primarily, it is derived from the false assumption that there is only a finite amount of work
to be done, meaning that when an immigrant takes a job, a native has one less available
place to work. However, Ebeling explains, “there is always more work to be done as long
as scarcity exists” (1). He goes on to state that when the supply of labor in an economy is
increased, so too is the amount of goods and services produced and purchased. Consumer
demand is limited by the amount of resources available to produce goods and services,
which effects price. Therefore, immigration, instead of taking jobs from Americans,
actually allows the U.S. economy to fill jobs for which it couldn’t before, because of a lack
of willing labor. The increased quantity of goods and services that this results in actually
raises the standard of living for Americans as their demand as consumers is better met
(Ebeling 2). Maloberti writes:
contrary to what it implied by common trends of reasoning, economies tend to
absorb immigrants by expanding job opportunities rather than by displacing
native workers…it would be surprising if an increase in labor were to produce
stagnation and misery rather than an expansion of the overall economy (560).
Even conservative think tanks, like the Liberty Fund at which Maloberti is a fellow,
acknowledge that immigration results in net job creation. A study on immigration and
employment that spanned 100 years, from 1891 to 1991, by Ohio University professors
Richard Vedder and Lowell Galloway seems to support Maloberti’s assertion. Vedder and
Galloway found that “higher rates of foreign-born population historically have
corresponded to lower unemployment rates;” immigrants increase output and the demand
for labor, are highly productive, and “promote capital formation through high savings
rates” (Immigrants and the Economy). Obviously, immigrants take jobs, but when they buy
goods and services they create new jobs as well (Guskin and Wilson 68). Evidence for this
can be seen in the European Union. During the first decade that free movement of labor
IMMIGRATION LIBERALIZATION IN THE 27
was allowed between the richer countries of the north and the poorer countries of the south,
unemployment rates, contrary to what was feared, actually fell in all E.U. countries (Guskin
and Wilson 131).
Economic Argument: “Immigrants Lower Native Wages”
Besides taking native jobs, anti-immigration leaders also claim that immigration depresses
wages in recipient countries. There is no doubt that immigrants are willing to work for less
than native workers. In fact, it is not at all surprising when considering that wages in
developed countries are four to twelve times higher than in developing countries (Freeman
154). Even a meager salary in a developed country is a huge improvement for immigrants
and sometimes enough to support immigrant families in their native countries. However,
there is evidence that wages are lowered for low skilled jobs in recipient countries as a
result of immigrant’s willingness to work for less as well as their contributing to a growing
labor supply. In his article “In Defense of Free Migration,” Richard M. Ebeling states that
“It is true that when immigrants try to enter particular occupations, they may find willing
employers only if they offer themselves at lower wages than that which existing employees
are receiving” (2). According to the National Academy of Sciences, immigration has been
responsible for a 44% decrease in the salaries of native-born workers who did not finish
high school because many immigrants are substitutes for these workers (Immigration 101).
Also, immigrants come with low-levels of skill and education; FAIR points out that there
has been a quadrupling over the past 20 years in the gap between native education levels
and immigrant education levels (Immigration 101). These facts, say those in favor of
stronger border control, mean that immigration is harmful to native workers.
Rebuttal to the Argument that Immigrants Lower Native Wages
The claim that immigrants lower wages, thereby hurting the economy, is also based on
shortsighted economics. It is true those immigrants who are willing to work for less than
natives drive down wages. However, as Ebeling explains, this totally ignores “beneficial
secondary effects” (3). With cheaper labor, goods and services can be produced at lower
costs, which means greater profits for business. With this extra money, production can be
expanded and consumer prices will be lowered. As a whole, consumers and immigrants are
better off. The only group that loses is the small group of workers who were not willing to
IMMIGRATION LIBERALIZATION IN THE 28
work for the wages the immigrants are; these people would be out of work. But even these
people will benefit from the cheaper goods and services and economic expansion that
immigrant labor brings. This extra money will increase demand in other sectors of the
economy, which means that employers in these areas will hire more people. “Thus,” says
Ebeling, “for consumers in general, numerous goods and services will be less expensive;
and for many workers, there will be an increased demand for their labor” (3). Still, groups
such as FAIR argue that lower wages as a result of immigration are bad overall. Ironically,
the same anti-immigration policies they and similar groups advocate for actually make the
problem worse. Having a group of workers that cannot become legal citizens only provides
a pool of labor that cannot organize for better pay and working conditions. An illegal
immigrant has little bargaining power when it comes to pay, hours, and working condition.
If immigrant workers were allowed to become citizens they could organize more easily to
lobby for better pay and working conditions. The upward pressure on wages from
legalizing low-skilled laborers would help to combat drops in native-worker wages and
increase government tax revenue, as these workers would finally be fully taxed. However,
rises in prices would be likely, as employers would have to pay their newly legal
employees more.
Economic Argument: “Immigrant Remittances Drain the U.S.
Economy of Money
Immigration opponents often cite the high levels of remittances sent home by immigrants to
their native countries. As of 2002, Latin American immigrants alone sent nearly $28 billion
to their families back home (Guskin & Wilson 67). Anti-immigration groups cite the fact
that this money does not stay in the United States where it could have been used to buy
goods and services locally. Furthermore, the U.S. government loses any tax revenue that
would have been generated from these local purchases. They see remittances as just another
way for immigrants to avoid paying taxes to the U.S. government, which makes them an
even greater burden to the native taxpayer (Parker par. 5).
IMMIGRATION LIBERALIZATION IN THE 29
Rebuttal to the Argument that Remittances Drain the U.S. Economy
of Money
Again, immigration opponents have taken a simplistic view of immigrant’s economic
impact. At first sight, it seems that money in the form of remittances sent to foreign
countries is lost forever to the U.S. economy. However, this is not the whole story.
Remittances bolster the economies of immigrants sending countries. With this extra money
in their pockets, family members of immigrants can buy more goods and services, which
are often times produced in the U.S. Guskin and Wilson write that remittances often “go to
countries like Mexico, which are tightly linked to the United States economically
[NAFTA]- so that a lot of the money comes back in purchases of U.S. goods and services”
(67). For example, in 2008 nearly a quarter of all Californian exports went either to China
or Mexico, both of which have huge numbers of expatriates living in the state (Waslin par.
5). Michele Waslin, a Senior Policy Analyst at the Immigration Policy Center, writes “U.S.
Remittances facilitate demand for U.S. exports and make U.S. goods more competitive”
(par. 5). Another way to look at remittances is that they send abroad the income that
immigrants earn domestically. If this money is spent on goods and services produced in
their own country it amounts in a reduction in demand for American goods and services.
This creates a similar effect as a native U.S. citizen buying an import, which is certainly a
right most Americans like to have. Furthermore, around 80% of immigrants send money
home through U.S. money transfer companies, like Western Union (Parker par. 6). Even
the George W. Bush administration worked with the industry to promote its growth in order
to help both the U.S. economy and immigrant sending economies (Parker par 11). Finally,
and maybe most importantly, the $28 billion that Latino immigrants send home yearly is
really not a large enough amount of money to have any serious effect on the $15 trillion a
year U.S. economy (Report for…). Any small loss is far outweighed by the previously
discussed economic gains associated with immigration, and immigrants spend the majority
of their salaries in the U.S. economy.
IMMIGRATION LIBERALIZATION IN THE 30
The National Security Argument: “Immigration is a Threat to
National Security”
Finally, with events like September 11, immigration has increasingly been tied to national
security issues. Obviously, the terrorists who carried out the attacks came from outside the
U.S. Some believe not allowing immigration would have stopped the attacks from
happening in the first place. Others say that increasing border security is crucial to national
security and the War on Terror (National Security). Furthermore, some suggest that Muslim
immigrants may feel more allegiance to their religion than they do to their new country
(Zientara 69).
Rebuttal to the National Security Argument
The Republican Party in the United States and anti-immigration groups across the world
have consistently tried to justify closed borders as a security need. In fact, the Republican
Party’s official stance on immigration is found in its national security platform suggesting
that above all else, immigration is a security issue (National Security). This seems like a
convenient way to tie immigration to a topic that is especially important to the American
public after 9/11. There is no doubt that every country should know who is entering its
territory and if these people have criminal records, but to connect today’s immigrants with
terrorism is misleading. It is unfair to link immigrants with terrorist acts, especially
immigrants that enter the country through its southern border. Although “immigrants” who
entered the country legally on visas carried out 9/11, a U.S. citizen and Gulf-War veteran
carried out the second most deadly attack, the Oklahoma City bombing. But Gulf-War
veterans haven’t been facing the same scrutiny as immigrants have in the U.S.’s War on
Terror (Guskin and Wilson 86). The U.S. government has used the War on Terror to create
anti-immigrant sentiment and increase deportations of illegal immigrants that the country
has unfairly depicted as terrorist threats. In this way the Republican Party has been able to
carry out its own anti- illegal immigration agenda under the guise of national security.
IMMIGRATION LIBERALIZATION IN THE 31
Problems with the Philosophy of Stronger Border Controls to
Reduce Immigration
The first solution of groups that oppose freer migration always seems to be to step up
enforcement. The Republican Party in the United States has for decades focused on ways to
make illegal immigration more difficult, but has rarely put effort into making legal
immigration more feasible. This ignores the fact that immigrants are coming because jobs
are available; employers are willing to employ them. Trying to block immigration flows is
only a “Band-Aid” policy that does not address the underlying factors that draw illegal
immigrants to the country in the first place. Another problem is that there is strong
evidence that constantly increasing enforcement spends astronomical amounts of taxpayer
money while showing little results in blocking immigrant flows. In the past two decades,
the United States has increased its border control budget nearly ten-fold (Casey 33). But
this did not lead to less illegal immigrants entering the United States. In fact, as Guskin and
Wilson point out, “the number of unauthorized immigrants in the United States rose by
some five million from 1990 to 2000, at a significantly faster rate than in previous decades,
and continuing to rise almost as quickly afterwards” (97-98). This statistic should be very
troubling to those who see stronger border enforcement as the answer to illegal
immigration, such as the Republican Party in the United States. Even though the U.S. was
spending more than it ever had on border control, it failed miserably at keeping immigrants
out. Walter A. Ewing puts the statistics in a more simple light: while the U.S. Border
Patrols budget increased from $326.2 million in 1992 to $2.7 billion in 2009, an increase of
714%, the number of unauthorized immigrants roughly tripled in the U.S., as seen in
Graphs 3 and 4 (111). Anti-immigration groups also point out that the U.S. spends billions
each year detaining and deporting illegal immigrants, but they seem to fail to realize that
this cost, along with a substantial amount of border patrol costs, would be avoided if
America allowed freer migration.
Furthermore, organized crime is given a never-ending source of income through smuggling
people past the U.S.’s beefed up border control. Since the U.S. began to more strictly
enforce it border, the price of being smuggled into the United States has increased by
nearly 800% (Guskin and Wilson 98). Reports now claim that fees charged by smugglers
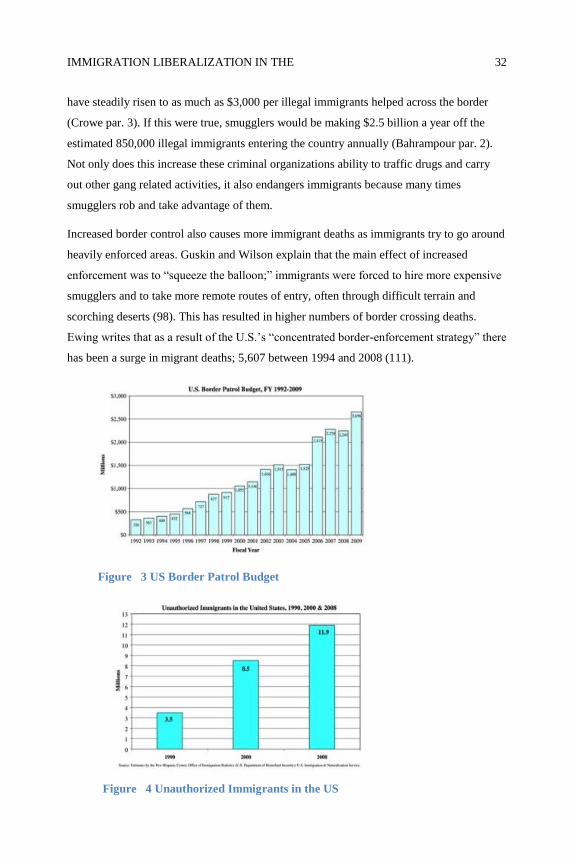
IMMIGRATION LIBERALIZATION IN THE 32
have steadily risen to as much as $3,000 per illegal immigrants helped across the border
(Crowe par. 3). If this were true, smugglers would be making $2.5 billion a year off the
estimated 850,000 illegal immigrants entering the country annually (Bahrampour par. 2).
Not only does this increase these criminal organizations ability to traffic drugs and carry
out other gang related activities, it also endangers immigrants because many times
smugglers rob and take advantage of them.
Increased border control also causes more immigrant deaths as immigrants try to go around
heavily enforced areas. Guskin and Wilson explain that the main effect of increased
enforcement was to “squeeze the balloon;” immigrants were forced to hire more expensive
smugglers and to take more remote routes of entry, often through difficult terrain and
scorching deserts (98). This has resulted in higher numbers of border crossing deaths.
Ewing writes that as a result of the U.S.’s “concentrated border-enforcement strategy” there
has been a surge in migrant deaths; 5,607 between 1994 and 2008 (111).
Figure 3 US Border Patrol Budget
Figure 4 Unauthorized Immigrants in the US
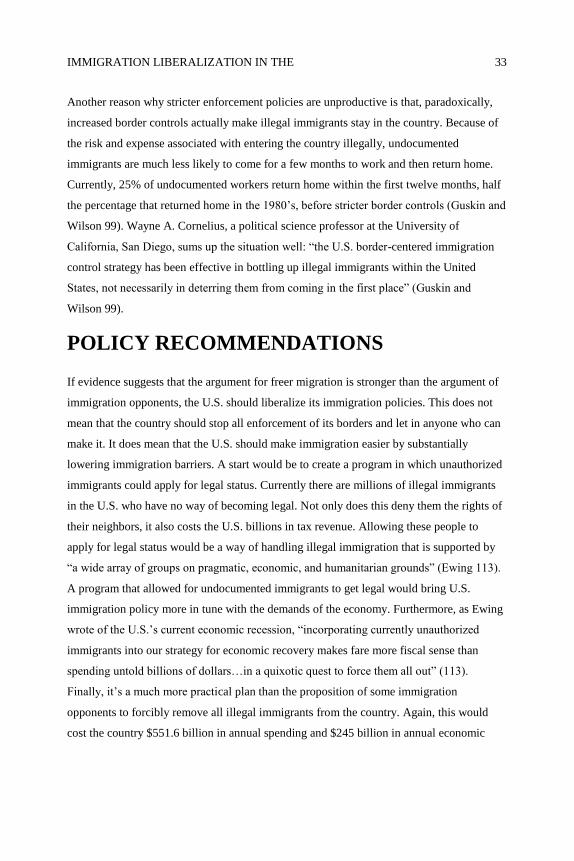
IMMIGRATION LIBERALIZATION IN THE 33
Another reason why stricter enforcement policies are unproductive is that, paradoxically,
increased border controls actually make illegal immigrants stay in the country. Because of
the risk and expense associated with entering the country illegally, undocumented
immigrants are much less likely to come for a few months to work and then return home.
Currently, 25% of undocumented workers return home within the first twelve months, half
the percentage that returned home in the 1980’s, before stricter border controls (Guskin and
Wilson 99). Wayne A. Cornelius, a political science professor at the University of
California, San Diego, sums up the situation well: “the U.S. border-centered immigration
control strategy has been effective in bottling up illegal immigrants within the United
States, not necessarily in deterring them from coming in the first place” (Guskin and
Wilson 99).
POLICY RECOMMENDATIONS
If evidence suggests that the argument for freer migration is stronger than the argument of
immigration opponents, the U.S. should liberalize its immigration policies. This does not
mean that the country should stop all enforcement of its borders and let in anyone who can
make it. It does mean that the U.S. should make immigration easier by substantially
lowering immigration barriers. A start would be to create a program in which unauthorized
immigrants could apply for legal status. Currently there are millions of illegal immigrants
in the U.S. who have no way of becoming legal. Not only does this deny them the rights of
their neighbors, it also costs the U.S. billions in tax revenue. Allowing these people to
apply for legal status would be a way of handling illegal immigration that is supported by
“a wide array of groups on pragmatic, economic, and humanitarian grounds” (Ewing 113).
A program that allowed for undocumented immigrants to get legal would bring U.S.
immigration policy more in tune with the demands of the economy. Furthermore, as Ewing
wrote of the U.S.’s current economic recession, “incorporating currently unauthorized
immigrants into our strategy for economic recovery makes fare more fiscal sense than
spending untold billions of dollars…in a quixotic quest to force them all out” (113).
Finally, it’s a much more practical plan than the proposition of some immigration
opponents to forcibly remove all illegal immigrants from the country. Again, this would
cost the country $551.6 billion in annual spending and $245 billion in annual economic
IMMIGRATION LIBERALIZATION IN THE 34
output (Ewing 114). Granting these illegal immigrants legal status is much more practical
then kicking them all out.
Another seemingly realistic policy change for the U.S. would be to start giving work visas
to any immigrants that can show they will have a job upon entering the United States. This
program would be similar to current temporary worker programs, but unlike these
programs, workers would be able to stay as long as they like (provided they remain
employed) and change jobs as they see fit. Here is a perfect place for political compromise
with the political right, which would most likely oppose such a policy. First, immigrants
could be required to show proof of employment before receiving government benefits,
effectively eliminating the freeloader problem. Second, the government ID cards proposed
by Republicans that would notify employers of workers’ legality seems appropriate in this
situation. Technology will enable the use of the cards, and every citizen of the country
could have an electronically verifiable ID number, much like a social security number.
Another compromise could be to gradually implement immigration liberalization by slowly
allowing more immigrants into the country to work each year. This would ensure that there
be enough work for new immigrants upon their arrival. It would also help to decrease any
burden on government goods and services that a completely open border may bring. Of
course, the amount of immigrants allowed into the country on a yearly basis would have to
be much higher than the arbitrary quotas set today. Leading economists could be consoled
so that the new immigration policy would be more in tune with labor market demands. And
since the U.S. would be easier to get into, these people could return home more easily when
they were done working. The circular immigration this policy encourages would be even
more effective if the U.S. included free movement of labor in its free trade agreements with
other countries.
The European Union could be a model for even more liberal immigration policies once
support for immigration become more popular with U.S. citizens. The European Union
currently allows for the free migration of all citizens of its member countries. However, this
means that countries need to decouple sovereignty from a country’s ability to block
immigration. As Casey asserts, “the ability to control immigration (but not capital, goods,
foreign policy, etc.) should not be idealized as a mainstay of sovereignty” (43). For a
change in immigration policies to take place in a democratic country like the U.S., there
IMMIGRATION LIBERALIZATION IN THE 35
must be a change in public opinion. This needs to be done by educating the population on
how immigration will benefit them. Maloberti writes that in democracies where individual
votes are usually indecisive:
few individuals find it profitable to invest in the costly process of understanding
the unintended effects of popular policies…trade restrictions, burdensome
regulations, and high taxes, for example, have important effects on prosperity.
Yet individuals wrongly think that such government interventions are able or
necessary to increase their collective welfare. Individuals prefer misguided
policies simply because they tend to be more intuitive, and interest groups prefer
such policies because they benefit them (552-553).
This seems to be exactly the case with immigration; people’s intuition is that immigration
is a zero-sum game, when in reality it is a positive sum game. The burden of educating the
American population on this concept will undoubtedly fall on immigration interest groups.
But the population can also call on politicians, professors and business leaders to take a
more pragmatic, fact-based approach to immigration rhetoric.
Once the American population changes its stance on immigration, the country should work
to enter into bilateral free trade agreements that include the free migration of labor. Such
agreements already exist in global politics. Aside from the EU., the Caribbean Community,
the Nordic Council, and the Trans Tasmanian Arrangement between Australia and New
Zealand, are all examples of what Casey calls “comfort zones” in which labor is allowed to
move freely (45). These policies have not created the strife that immigration opponents
claimed they would. In fact, EU citizens listed “freedom to travel and work” as the greatest
achievement to date of the European Union (Guskin and Wilson 135). For America to enter
into free movement of labor agreements, it will have to give importance to economic
interests over what Casey calls “the politics of fear” which today seem to dominate
immigration rhetoric (45).
CONCLUSION
As Maloberti writes on immigration, “there are no good reasons for preventing the entry of
those who merely intend to advance their own well-being within the constraints imposed by
IMMIGRATION LIBERALIZATION IN THE 36
respect for other people’s rights“ (561). Not only would freer migration improve America
economically, it would also improve the standards of living of countless poor people who
decide to immigrate as well as the lives of those who reap the benefits of the free trade of
labor in their home countries. Just as the liberalization of trade increased wealth across the
world and helped to reduce poverty, so too could the liberalization of immigration.
According to a World Bank report, if developed countries were to let in just 14 million
immigrant workers the “world economy would yearly generate, ceteris paribus, $365
billion over a 15 year period (2010-2025)”. Of this $365 billion, immigrants would yearly
gain $162 billion, citizens remaining in developing countries would yearly gain $143
billion, and natives in immigrant receiving countries would gain $139 billion per year
(Zientara 71). So, according to the World Bank, every part of the world would benefit
economically from freer migration, rich and poor alike. To again make a utilitarian
argument the improved lives of immigrants would create a huge amount of happiness, as
would the economic gains enjoyed by the entire world. This happiness would certainly
outweigh the unhappiness created by immigrants moving to parts of the world where native
citizens do not want them. It would also outweigh the unhappiness brought by the eyesore
of immigrants living in conditions poorer than what developed country citizens are
accustomed to. Immigration liberalization will bring its challenges; more people have to
compete to use government goods and services in immigrant receiving countries, but these
problems are minuscule when considering the huge economic and moral benefits of
allowing people to freely chose where they work.
And paradoxically, as more of the world’s poor benefit from the free movement of labor,
there will be less need for them to move to developed countries, such as the United States.
It is the very existence of immigration barriers that contribute to the poor’s need to
immigrate in the first place (Maloberti 559). “Open borders should be a driver for less
immigration, and those who move should do so out of choice and not because of necessity,”
writes Casey (53). After all, free migration is seen as a wealth equalizer. Many of the
developing world’s poor would see their need to immigrate fall as the benefits of free
migration create economic growth in their home countries.
It is not as if a policy of open borders would be new to America. For its first 100 years of
existence the country had an open immigration policy, allowing in anyone who could pass a
IMMIGRATION LIBERALIZATION IN THE 37
health check and afford a ticket to come to America in search of a better life. During this
time there were also those who opposed immigration for many of the same reasons as
today. Yet it was this period of free migration that propelled America to the prosperity and
influence that it now has. Today, America can benefit again from policies much like it had
in its first 100 years. The country owes its greatness to the huddled masses, which came in
search of the American dream. In fact, it is these immigrants that were willing to leave
everything they had for a shot at a better life; they truly believed in the American dream
and the dream needed their intensity to hold true. Immigration has been fundamental to
America since its beginning and it will remain fundamental to its prosperous future. It was
Thomas Jefferson, principal author of the Declaration of Independence, that wrote of “the
natural right which men have of relinquishing the country in which birth or accident may
have thrown them, and seeking subsistence and happiness whosesoever they may be able”
(Ebeling). Today, developed countries, the United States included, have the chance to
fulfill Jefferson’s wish and grant the right to find a better life in a new country to all of
humanity. Will this pragmatic, economic and ethical right come to be in our generation? Or
will we find our immigration policies making the same uneducated mistakes as those of
past generations?
REFERENCES
"A Brief History of Immigration." ImmigrationControl.com. American for Immigration
Control, Inc. Web. 20 Nov. 2011.
<http://www.immigrationcontrol.com/index.php?option=com_content&view=article&
id=85&Itemid=55 >.
Anrig, Greg, and Tova A. Wang. "Immigraton, Jobs, and the American
Economy."Economics and Inequality. The Century Foundation, 24 Sept. 2004. Web. 3
Feb. 2012. <http://tcf.org/publications/2004/9/pb491#17>.Ávalos-Sartorio, Beatriz.
"Coffee, Policy and Stability in Mexico." Food Policy for Developing
Countries: Case Studies. Ed. Per Pinstrup-Andersen and Fuzhi
IMMIGRATION LIBERALIZATION IN THE 38
Cheng. Cornell: Cornell University, NY. Food Policy for Developing Countries. Cornell
University Library, 2012. Web. 4 Nov. 2011.
Bahrampour, Tara. "Fewer Entering U.S. Illegally." The Boston Globe 2 Sept. 2010.
Boston.com. The Boston Globe, 2 Sept. 2010. Web. 27 Mar. 2012.
<http://www.boston.com/news/nation/washington/articles/2010/09/02/report_shows_s
teep_decline_in_illegal_immigrant s_enter ing_us/>.
Boroff, David, and Roque Planas. "Mitt Romney Says He Favors 'self-deportation' When
Asked about Immigration ..." News. New York Daily News, 24 Jan. 2012. Web. 19
Feb. 2012. <http://www.nydailynews.com/news/election-2012/mitt-romney-favors-
self-deportation-asked-immigration-gop-debate-article-1.1010812>.
Casey, John P. "Open Borders: Absurd Chimera or Inevitable Future Policy?" International
Migration 48.5 (2010): 15-54. EBSCO MegaFILE. Web. 29 Sept. 2011.
Crowe, Aaron. "Coyotes Making Money, Even with Fewer Customers."
DailyFinance.com.Daily Finance, 19 May 2009. Web. 27 Mar. 2012.
<http://www.dailyfinance.com/2009/05/19/coyotes-making-money-even-with-fewer-
customers/>.
"Current Immigration in Perspective: Never Before Has Immigration from One Country
Been so Massive." FAIRUS.org. Federation for American Immigration Reform, 2002.
Web. 15 Nov. 2011.
<http://www.fairus.org/site/News2?page=NewsArticle&id=16933>.
IMMIGRATION LIBERALIZATION IN THE 39
"Demographic History of the United States." Wikipedia. Wikimedia Foundation, 17 Feb.
2012. Web. 21 Feb. 2012.
<http://en.wikipedia.org/wiki/Demographic_history_of_the_ United_States>.
Ebeling, Richard M. "In Defense of Free Migration." Freedom Daily. The Future of
Freedom Foundation, June 1991. Web. 10 Oct. 2011.
Ewing, Walter. "The Many Facets Of Effective Immigration Reform." Society 47.2 (2010):
110-117. EBSCO MegaFILE. Web. 17 Feb. 2012.
Franklin, Benjamin. "The Support of the Poor." The Writings of Benjamin Franklin:
Philadelphia, 1726 - 1757. 8 Feb. 2012. The History Carper.
<http://www.historycarper.com/resources/twobf2/letter18.htm>.
Freeman, Richard B. "People Flows in Globalization." Journal of Economic Perspectives
20.2 (2006): 145-70. EBSCO MegaFILE. Web. 13 Dec. 2011.
Guskin, Jane, and David L. Wilson. The Politics of Immigration: Questions and Answers.
New York: Monthly Review, 2007. Print.
Herrera, Rémy. "The Neoliberal 'Rebirth' of Development Economics." Monthly Review
58.1 (2006). Monthly Review, 10 Feb. 2012. Web. 15 Feb. 2012.
"Immigration." Mitt Romney for President 2012. Mitt Romney for President, Inc., 2011.
Web. 18 Feb. 2012. <http://mittromney.com/issues/immigration>.
"Immigrants and the Economy." Defending Targets of Discrimination. American Civil
Liberties Union, 12 Mar. 2002. Web. 27 Mar. 2012. <http://www.aclu.org/
immigrantsrights/immigrants-and-economy>.
IMMIGRATION LIBERALIZATION IN THE 40
"Immigration Now and Then." FAIRUS.org. Federation for American Immigration Reform,
2002. Web. 17 Nov. 2011.
<http://www.fairus.org/site/PageNavigator/facts/research_now_then/>.
Immigration 101: A Primer on Immigration and the Need for Reform. Washington, DC:
Federation for American Immigration Reform, 1997. Web. 21 Nov. 2011
<http://www.fairus.org/site/PageNavigator/facts/immigration_101.html>
Jones, Brent, ed. "Editorial: Alabama Nets More than Illegal Immigrants." Editorial.
USAToday.com. Gannett Co. Inc., 4 Dec. 2011. Web. 20 Feb. 2012.
<http://www.usatoday.com/news/opinion/editorials/story/2011-12-04/Alabama-nets-
more-than-illegal-immigrants/51643358/1>.
Malobert, Nicolas. "Government by Choice: Classical Liberalism and the Moral Status of
Immigration Barriers." The Independent Review 15.4 (2011): 541-62. EBSCO
MegaFILE. Web. 12 Oct. 2011
Marche, Stephen. "The War Against Youth." Esquire.com. Hearst Communications, 26
Mar. 2012. Web. 30 Mar. 2012. <http://www.esquire.com/features/young- people-in-
the-recession-0412>.
Myers, Dowell. "Thinking Ahead About Our Immigration Future." Immigration Policy
Center (2008). Research & Publications. 1 Jan. 2008. Web. 8 Feb. 2012.
<http://www.immigrationpolicy.org/special-reports/thinking-ahead-about-our-
immigrant-future-new-trends-and-mutual-benefits-our-aging-s>.
"National Security." 2008 Republican Platform. Republican National Committee, 2008.
Web. 19 Feb. 2012. <http://www.gop.com/2008Platform/NationalSecurity.htm>.
IMMIGRATION LIBERALIZATION IN THE 41
Parker, Randall. "Bush Administrations Wants Immigrants To Send More Money
Home."ParaPundit.com. ParaPundit, 17 May 2004. Web. 26 Mar.
2012.<http://www.parapundit.com/archives/002115.html>.
Riggs, Mike. "The Most Vile and Inhumane Immigration Story You Will Read This
Week." Hit & Run. Reason Magazine, 15 Feb. 2012. Web. 19 Feb. 2012.
<http://reason.com/blog/2012/02/15/the-most-vile-and-inhumane-immigrations>.
“Report for Selected Countries and Subjects: United States." IMF.org. International
Monetary Fund, Sept. 2011. Web. 28 Mar. 2012.
Rubin, Paul H. "Evolution, Immigration and Trade." The Washington Post. The
Washington Post Company, 7 May 2007. Web. 08 Feb. 2012.
<http://www.washingtonpost.com/wpdyn/content/
article/2007/05/07/AR2007050700755.html>.
Sampson, Robert J. "Immigrants Responsible For Drop in Crime Rates." Up Front with
Tony Cox. Dir. Tony Cox. National Public Radio. Washington, DC, 26 May 2010.
Radio. Transcript.
Smith, Adam, Edwin Cannan, and Max Lerner. An Inquiry into the Nature and Causes of
the Wealth of Nations. New York: Modern Library, 1937. Print.
Summers, Elizabeth. "New Alabama Immigration Law Tougher Than Arizona's SB-1070
Measure." PBS News Hour. PBS, 10 June 2011. Web. 20 Feb. 2012.
<http://www.pbs.org/newshour/updates/law/jan-june11/alabama_06-10.html>.
"The Universal Declaration of Human Rights." UN.org. United Nations. Web. 19 Feb.
2012. <http://www.un.org/en/documents/udhr/#atop>.

IMMIGRATION LIBERALIZATION IN THE 42
Waslin, Michele. "Remittances Will Help Haiti Recover and Strengthen U.S. Economy."
LAProgressive.com. L.A. Progressive Social Justice Magazine. Web. 28 Mar. 2012.
<http://www.laprogressive.com/remittances-haiti-recover-iandi-strengthen-
economy/>.
Zientara, Piotr. "International Migration: A Case Against Building Ever-Higher Fences."
Economic Affairs 31.1 (2011): 66-72. EBSCO MegaFILE. Web. 17 Feb. 2012.
SEEDLING ROOT MORPHOLOGY OF SIX 43
Seedling Root Morphology of Six Alfalfa
Populations
Author: Brianna J. Gaughan
Faculty Sponsor: Dr. Lan Xu
Department: Natural Resources Management
ABSTRACT
Seedling root morphology plays a crucial role in seedling survival and stand establishment.
Naturalized yellow-flowered alfalfa (YFA) (Medicago sativa subsp. falcata) has
demonstrated adaptation to semiarid conditions of the Northern Great Plains and tolerance
to grazing. Seedling stage root morphology is poorly defined. Our objective was to
compare morphological traits of seedling roots for six alfalfa populations. Six entries were
evaluated: one M. sativa population as a control, two M. falcata entries, with reported
“spreading characteristics” and three naturalized YFA populations. Uniform seeds of each
entry were scarified with 320 grade sand paper and inoculated with rhizobium before
planting. A V-shaped plexiglass rootview growth box (48cm long X 27cm wide X 40cm
deep) was divided into six compartments with aluminum foil, each filled with Miracle-Gro
potting soil. Ten seeds per population were planted (1.5 cm deep) at 1.5 cm intervals
against the Plexiglass wall. The rootview growth box was maintained in a growth chamber
(24±3°C; 16h light/8h dark). Soil moisture was maintained with daily misting for 26 days.
M. sativa and YFA populations had faster primary root emergence (2-3 d) than M. falcata
populations (8 d). Primary root elongation rate was greater for M. sativa (3-4cm/d) than M.
falcata and YFA populations (1.8-2.6cm/d) for the first 7 days. First lateral root emerged
when primary root length reached 10-14 cm for all populations. The first lateral root
emerged 2-3cm below the root-stem junction with the exception of one M. falcata
population (5cm).
SEEDLING ROOT MORPHOLOGY OF SIX 44
Keywords: Medicago sativa, Medicago falcata, yellow-flowered alfalfa, legume,
emergence, seedling root, development, morphology
INTRODUCTION
Alfalfa (Medicago sativa) is an important forage crop grown worldwide. But alfalfa has
difficulty establishing in arid and semiarid rangelands because of inadequate soil moisture
(Ries, 1982) and to persist because of winterkilling and grazing (Oakley and Garver 1917).
There has long been a need and demand for cultivars of alfalfa that have the ability to
establish and persist in grazing lands of semiarid regions, and to increase forage quality and
animal production. Since introduction, over a hundred varieties of alfalfa have been
developed but very few have been successfully naturalized in the North America
rangelands (Rumbaugh 1982) even though the conditions are similar to its native range up
to 64°N in Siberia (Hansen 1909). However, recently it was discovered that a population
of predominantly Yellow-flowered alfalfa (YFA) (Medicago sativa subsp. falcata) has
become naturalized in rangeland of northwestern South Dakota (Xu et al. 2005) and
persisted under grazing pressure.
Yellow-flowered alfalfa (Medicago falcata) has demonstrated unique adaptations for
survival under grazing in rangelands of the Northern Great Plains (Berdahl et al. 1989).
YFA was first introduced to the United States in 1897 by Niels Ebbesen Hansen who was
one of the first agricultural explorers working for the United States Department of
Agriculture (Oakley and Garver 1917). During Hansen’s exploration of Russia and Siberia,
he observed along with other Russian agronomists that M. falcata varieties have several
desirable traits for semiarid pastures, including grazing tolerance whereas strains of M.
sativa do not; palatable to cattle, horses, and sheep; greening up early in cold spring;
tolerant to severe drought in summer; alkali and salt resistance; winter hardiness; broad and
deep-set crowns; and the habit of sprouting by roots proliferation (Hansen 1909). The
spreading habit via rhizomes and proliferating roots enabled YFA to endure grazing and
trampling to a great extent, provided them self-renovation after the death of the main
rootstock (Southworth 1921), further enhanced persistence of stands. The capacity of YFA
vegetative reproduction through root or rhizome has significant potential utility for grazing-
type alfalfas to improve depleted rangelands, and agricultural and economical implications.
SEEDLING ROOT MORPHOLOGY OF SIX 45
The critical role of root morphology associated with alfalfa establishment, persistence and
productivity have been recognized (Johnson et al 1998). Several researchers reported that
the ability of YFA being able to withstand severe conditions of grazing, drought, and cold
has been largely associated with belowground morphological traits, such as deep-set and
wide crowns, subsurface budding, well-developed rooting rhizomes, numerous branched
roots and fibrous root system (Oakley and Graver, 1917, Southworth 1921, Garver 1922,
Heinrichs 1963). Root morphologic traits on established 1-year-old alfalfa plants for 1067
plant introductions (PIs) and 110 North American cultivars were evaluated for identifying
potential parent material for increasing persistence and productivity (Johnson et al 1998).
Seedling survival and establishment are depended on seedling root development and
morphology. Rapid root emergence and elongation, and early branching facilitate seedlings
to acquire the necessary water and nutrients for survival and growth as well as successfully
compete with neighboring plant species. However, little is understood of YFA root
morphology at seedling stage. Information on the seedling root morphological
characteristic will provide insight of the developmental history of the root system and
would be useful for selection of potential parent materials for breeding grazing – type
alfalfas in arid and semiarid regions.
This study was designed to test the hypothesis that there is a difference in seedling root
morphology among six alfalfa populations. Our objective was to compare seedling root
morphological characteristics among six alfalfa populations.
METHODS & MATERIALS
Seed source
Seeds of these six alfalfa populations used in this study were taken from a commercial seed
companies (Persist II, Falcata), naturalized populations (SD202, SD203) of alfalfa in the
Grand River National Grassland (45º49’N, 102°33’W), and PIs from National Plant
Germplasm System (PI494660, PI494661) (Table. 1). Ten uniform seeds from each of the
six alfalfa population were carefully selected under a dissecting microscope (10X
magnification). Selected seeds were hand scarified (Narem et al. 2009) with 320-grade
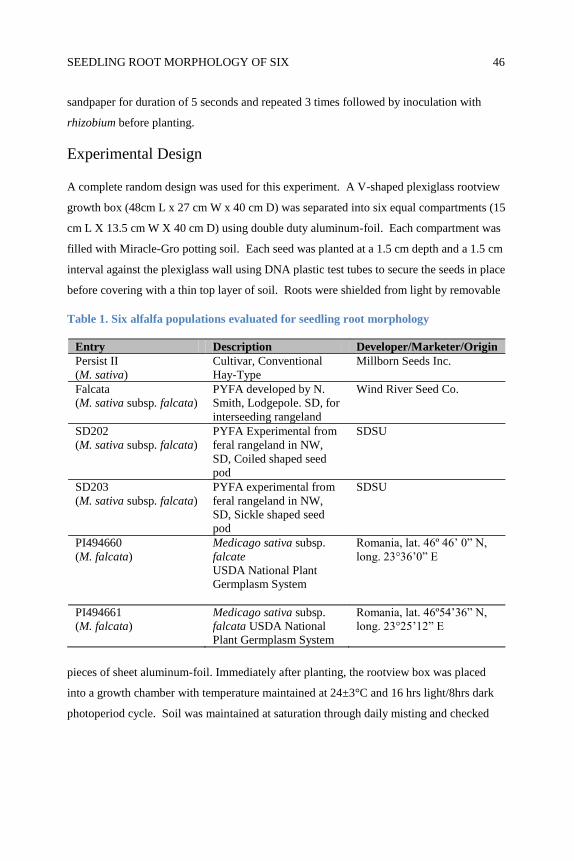
SEEDLING ROOT MORPHOLOGY OF SIX 46
sandpaper for duration of 5 seconds and repeated 3 times followed by inoculation with
rhizobium before planting.
Experimental Design
A complete random design was used for this experiment. A V-shaped plexiglass rootview
growth box (48cm L x 27 cm W x 40 cm D) was separated into six equal compartments (15
cm L X 13.5 cm W X 40 cm D) using double duty aluminum-foil. Each compartment was
filled with Miracle-Gro potting soil. Each seed was planted at a 1.5 cm depth and a 1.5 cm
interval against the plexiglass wall using DNA plastic test tubes to secure the seeds in place
before covering with a thin top layer of soil. Roots were shielded from light by removable
Table 1. Six alfalfa populations evaluated for seedling root morphology
Entry Description Developer/Marketer/Origin
Persist II
(M. sativa)
Cultivar, Conventional
Hay-Type
Millborn Seeds Inc.
Falcata
(M. sativa subsp. falcata)
PYFA developed by N.
Smith, Lodgepole. SD, for
interseeding rangeland
Wind River Seed Co.
SD202
(M. sativa subsp. falcata)
PYFA Experimental from
feral rangeland in NW,
SD, Coiled shaped seed
pod
SDSU
SD203
(M. sativa subsp. falcata)
PYFA experimental from
feral rangeland in NW,
SD, Sickle shaped seed
pod
SDSU
PI494660
(M. falcata)
Medicago sativa subsp.
falcate
USDA National Plant
Germplasm System
Romania, lat. 46º 46’ 0” N,
long. 23°36’0” E
PI494661
(M. falcata)
Medicago sativa subsp.
falcata USDA National
Plant Germplasm System
Romania, lat. 46º54’36” N,
long. 23°25’12” E
pieces of sheet aluminum-foil. Immediately after planting, the rootview box was placed
into a growth chamber with temperature maintained at 24±3°C and 16 hrs light/8hrs dark
photoperiod cycle. Soil was maintained at saturation through daily misting and checked
SEEDLING ROOT MORPHOLOGY OF SIX 47
with a soil moisture meter. The rootview box was placed in the controlled environmental
growth chamber for 26 days for each trial.
DATA COLLECTION
The dates when the primary root, which arises from the radicle, emerged from seeds after
planting were recorded. The primary root growth, emergence date of first lateral root, and
the number of lateral roots were recorded daily for 26 days total for each trial or when the
primary root reached the bottom of the rootview box. The distance of the first lateral root
from the junction between root and stem on the primary root was measured after each
seedling was excavated at the end of trial period. There was two trials.
DATA ANALYSIS
Primary root elongation rate was calculated using the equation (L2-L1)/(T2-T1), where L1
and L2 are root lengths at sampling times T1 and T2, respectively (Pan et al. 2001).
Cumulative primary root length and the primary root length at first lateral root emergence
was calculated based on daily growth measurements. Average number of lateral roots
production after primary root emergence was calculated. A one-way variance analysis was
used to analyze each morphological trait variable among six populations at α=0.05. A
Duncan Multiple Comparison test was used when p<0.05 (SAS 1990).
RESULTS
Persist II (M. sativa) and YFA populations (Falcata, SD202, SD203) had rapid primary root
emergence (2-3 d) compared to PI494660 and PI494661 (M. falcata) (8 d) (p<0.0001) (Fig.
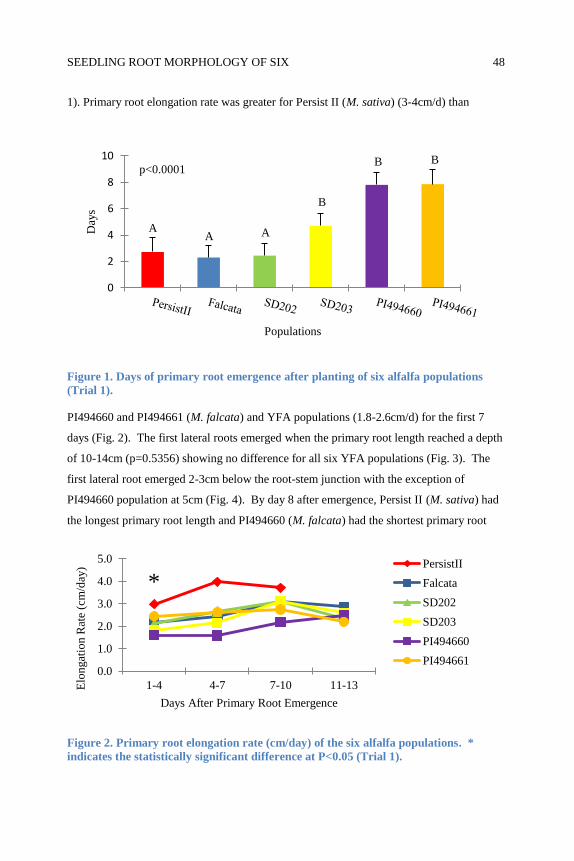
SEEDLING ROOT MORPHOLOGY OF SIX 48
1). Primary root elongation rate was greater for Persist II (M. sativa) (3-4cm/d) than
Figure 1. Days of primary root emergence after planting of six alfalfa populations
(Trial 1).
PI494660 and PI494661 (M. falcata) and YFA populations (1.8-2.6cm/d) for the first 7
days (Fig. 2). The first lateral roots emerged when the primary root length reached a depth
of 10-14cm (p=0.5356) showing no difference for all six YFA populations (Fig. 3). The
first lateral root emerged 2-3cm below the root-stem junction with the exception of
PI494660 population at 5cm (Fig. 4). By day 8 after emergence, Persist II (M. sativa) had
the longest primary root length and PI494660 (M. falcata) had the shortest primary root
Figure 2. Primary root elongation rate (cm/day) of the six alfalfa populations. *
indicates the statistically significant difference at P<0.05 (Trial 1).
0
2
4
6
8
10
Day
s
Populations
p<0.0001
A A
B
A
B
B
0.0
1.0
2.0
3.0
4.0
5.0
1-4 4-7 7-10 11-13Elo
ngat
ion
Rat
e (c
m/d
ay)
Days After Primary Root Emergence
* PersistII
Falcata
SD202
SD203
PI494660
PI494661
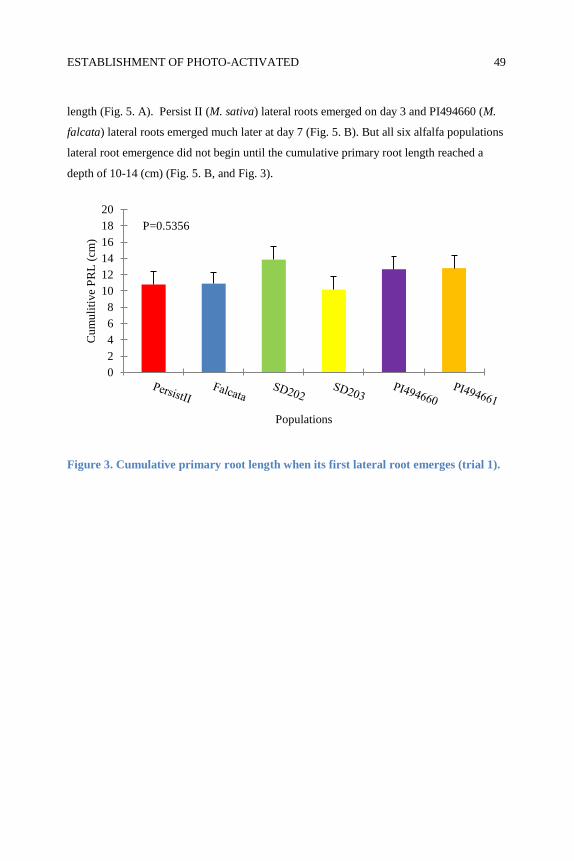
ESTABLISHMENT OF PHOTO-ACTIVATED 49
length (Fig. 5. A). Persist II (M. sativa) lateral roots emerged on day 3 and PI494660 (M.
falcata) lateral roots emerged much later at day 7 (Fig. 5. B). But all six alfalfa populations
lateral root emergence did not begin until the cumulative primary root length reached a
depth of 10-14 (cm) (Fig. 5. B, and Fig. 3).
Figure 3. Cumulative primary root length when its first lateral root emerges (trial 1).
0
2
4
6
8
10
12
14
16
18
20
Cu
mu
liti
ve
PR
L (
cm)
Populations
P=0.5356
*
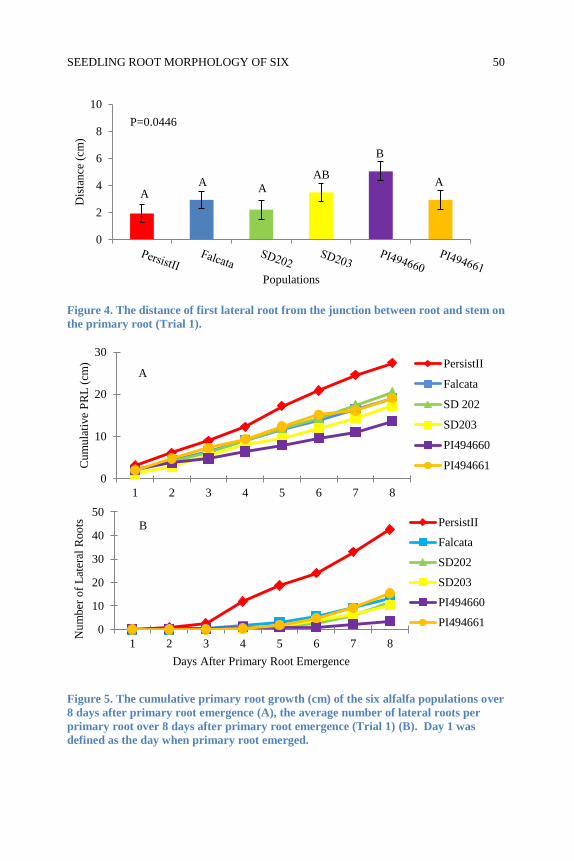
SEEDLING ROOT MORPHOLOGY OF SIX 50
Figure 4. The distance of first lateral root from the junction between root and stem on
the primary root (Trial 1).
Figure 5. The cumulative primary root growth (cm) of the six alfalfa populations over
8 days after primary root emergence (A), the average number of lateral roots per
primary root over 8 days after primary root emergence (Trial 1) (B). Day 1 was
defined as the day when primary root emerged.
0
2
4
6
8
10
Dis
tan
ce (
cm)
Populations
A A
A
AB
B
A
P=0.0446
0
10
20
30
1 2 3 4 5 6 7 8
Cu
mu
lati
ve
PR
L (
cm)
A PersistII
Falcata
SD 202
SD203
PI494660
PI494661
0
10
20
30
40
50
1 2 3 4 5 6 7 8
Nu
mb
er o
f L
ater
al R
oo
ts
Days After Primary Root Emergence
B PersistII
Falcata
SD202
SD203
PI494660
PI494661
ESTABLISHMENT OF PHOTO-ACTIVATED 51
DISCUSSION
Persist II (M. sativa) demonstrated the fastest root emergence (2 – 3 days after planting),
the fastest primary root elongation rate (3-4cm/day), and the earliest lateral root initiation,
and more lateral root production for the first 8 days due to its quick primary root elongation
rate compared to the other five alfalfa populations. This indicates that Persist II (M. sativa)
may have the potential for the greatest establishment among the six alfalfa populations
under ideal environmental conditions. Speed of root emergence is crucial for initial
establishments of plant species, especially in semiarid environments where conditions are
harsh. The elongation rate of the primary root is equally important after emergence for fast
establishment leading to root penetration and exploration in soils for needed resources, such
as water and nutrients. However, plant species cannot rely solely on their primary roots
for nutrient uptake. The increase in root surface area by produced lateral roots and
enhanced nutrient uptake gives plants higher survivability (Thornley 1971). Plants with
more branched root systems may enable to persist under grazing and tolerance to drought
and cold (Daday1962, Garver 1922).
Results from this study also demonstrate M. falcata (PI494660 and PI494661) populations
are conservative in primary root emergence and slow primary root elongation rate (8 d and
1.8-2.6 cm/d) of the six YFA populations under observation. These phenomena may be a
SEEDLING ROOT MORPHOLOGY OF SIX 52
reflection of M. falcata origin (Table 1). These characteristics imply natural selection and
adaptation to very harsh and unpredictable environments, but further research is needed to
confirm this suggestion. It is speculated that slow emergence and elongation of the primary
root is, in fact, advantage in environments with unpredictable spring to avoid the frost
killing of seedlings, and germination occurred only after ideal environmental conditions
have been reached.
M. falcata is purported by several researchers to posses the “spreading root” characteristics
near the crown (Hansen 1927, Heinrichs 1963) but we did not observe such trait in
PI494660 and PI494661 (M. falcata) at the seedling stage. It is very probably developed in
the later stage.
It must be restated that the objective of this experiment was to compare the root
morphological characteristic at seedling development stage of six alfalfa populations about
26 days and the results may vary in adult alfalfa populations. The results presented here
were from Trial 1, but the same trends and patterns were confirmed by the Trial 2.
The practical applications of this study would be used to help determine the YFA seedling
root morphology variations, and to provide useful information for selecting potential
parental materials to develop grazing-type alfalfa for semiarid regions.
LIMITATIONS
This study was conducted between the months of August to December of 2011. Therefore,
the main limitation of this study was time. Due to this time constraint, the study of
morphological root traits in YFA was limited to 26-day old seedling stage only. The
second limitation was space. This study was conducted under a well controlled
environmental condition a growth chamber, due to limited space in the growth chamber,
only six alfalfa populations were evaluated for their seedling root morphology for total two
trials with 26 days per trial. The limitation of time and space prevented more populations
to be evaluated and more trials and long duration for each trial to be conducted.
SEEDLING ROOT MORPHOLOGY OF SIX 53
ACKNOWLEDGEMENTS
First and foremost, I would like to acknowledge the Griffith Undergraduate Research
Scholarship for the funding of this project. I would like to thank Jordan Knowltonkey and
Ayush Shrestha for their assistance in this study. Special thanks to Drs. Roger Gates, Arvid
Boe, Patricia Johnson and Yajun Wu for their valuable inputs and comments. Thanks to Dr.
Yajun Wu and Dr. Arvid Boe for providing the growth chamber and greenhouse space to
conduct the experiments. Lastly, special thanks to my amazing mentor Dr. Lan Xu, for her
incredible knowledge, guidance, and support throughout this entire study.
REFERENCES
Berdahl, J. D., A. C. Wilton, and A. B. Frank. 1989. Survival and agronomic performance
of 25 alfalfa cultivars and strains interseeded into rangeland. J. Range Manage.
42:312-316.
Daday, H. 1962. Breeding for creeping root in Lucerne (Medicago sativa L.). Austr. J. of
Agri. Res. 13(5):813-820.
Garver, S. 1922. Alfalfa root studies. United States Department of Agriculture Bull. No.
1087.
Hansen, N. E. 1909. The wild alfalfa and clovers of Siberia, with a perspective view of
alfalfa of the world. USDA Bur. Plant Ind. Bull. 150.
Hansen, N. E. 1927. Plant Introductions. S. Dakota State Coll. Agr. Expt. Sta. Bull. 224.
Heinrichs, D. H. 1963. Creeping alfalfa. Adv. Agron. 15:317-337.
Johnson, L. D., J. J. Marquez-Ortiz, J. F. S. Lamb, and D. K. Barnes. 1998. Root
morphology of alfalfa plant introductions and cultivars. Crop Sci. 38:497-502.
Narem, D. M., L. Xu, R. N. Gates, A. A. Boe, and P. S. Johnson, P. S. 2009. Does
stratification, warm treatment, and mechanical and acid scarification increase the
emergence of yellow-flowered alfalfa (Medicago sativa subsp. falcata) seeds?
Proceedings of the South Dakota Academy of Science, Vol. 88:180.
SEEDLING ROOT MORPHOLOGY OF SIX 54
Oakley, R. A. and S. Garver. 1917. Medicago falcate, a yellow-flowered alfalfa. U.S.
Dept. of Agriculture Bulletin. No. 428.
Pan, W.L., F. L. Young, and R.P. Bolton. 2001. Monitoring Russian thistle (Salsola
iberica) root growth using a scanner-based portable mesorhizotron. Weed
Technology. Vol.15:762-766.
Ries, R. E. 1982. Environmental factors and alfalfa persistence in dryland pastures and
rangeland. In: Alfalfa for dryland grazing. US Department of Agriculture,
Agriculture Information Bulletin No. 444. p4-7.
SAS Institute, Inc. 1990. SAS/STAT User’s Guide, Version 6. SAS Institute, Inc. Cary,
NC.
Southworth, W. 1921. A study of the influence of the root system in promoting hardiness
in alfalfa. Sci. Agric. (Canada), 1:5-9.
Thornley, J. H. M. 1972. A balanced quantitative model for root:shoot ratios in vegetative
plants. Annals of Botany. Vol. 36(2):431-441.
Xu, L., A. Boe, P. S. Johnson, and K. Kephart. 2005. Naturalization of alfalfa in
rangeland. Proceedings of the South Dakota Academy of Science. 84:343.
PREVELANCE AND BEHAVIOR OF BLASTOBASIS 55
Prevalence and Behavior of Blastobasis
repartella (Dietz) in Switchgrass
Author(s): Krista Hegge
Faculty Sponsor: Dr. Paul J. Johnson and Dr. Susan Rupp
Department: Plant Science and Natural Resource Management
ABSTRACT
Switchgrass (Panicum virgatum) is growing in recognition as a potential source for
biomass. In order to use switchgrass optimally as a crop for biofuel production potential
pests need to be detected and studied. Currently, one pest being studied is the stem-boring
larva of the moth Blastobasis repartella. The objective of this experiment was to compare
effects of larval feeding on rhizome buds for two cultivars of switchgrass, and to observe
and document feeding behavior of the larva. The two cultivars of switchgrass used were
Pathfinder (PTH), a lowland variety, and Sunburst (SBS), an upland variety. Six, 15-cm2
samples of rhizome clusters from each cultivar were taken in September 2011 from South
Dakota State University’s Aurora Research Farm. A total of 136 tillers were collected from
both varieties containing 345 buds; 114 of those buds were killed by B. repartella.
Pathfinder rhizome samples produced 25 larvae while those of Sunburst had 22 larvae. No
significant differences were detected between PTH and SBS in regards to the number of
new buds present, the number of damaged buds, the number of larvae, or the rate of
damage caused by larvae. It appears that B. repartella larvae do similar amounts of
damage to both varieties and that there is a significant pest status with approximately one-
third of the potential biomass producing buds being killed.
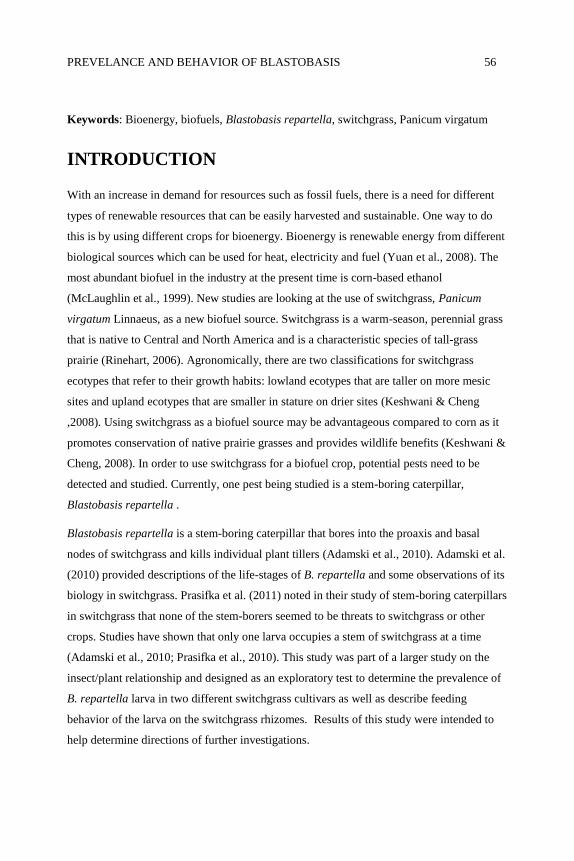
PREVELANCE AND BEHAVIOR OF BLASTOBASIS 56
Keywords: Bioenergy, biofuels, Blastobasis repartella, switchgrass, Panicum virgatum
INTRODUCTION
With an increase in demand for resources such as fossil fuels, there is a need for different
types of renewable resources that can be easily harvested and sustainable. One way to do
this is by using different crops for bioenergy. Bioenergy is renewable energy from different
biological sources which can be used for heat, electricity and fuel (Yuan et al., 2008). The
most abundant biofuel in the industry at the present time is corn-based ethanol
(McLaughlin et al., 1999). New studies are looking at the use of switchgrass, Panicum
virgatum Linnaeus, as a new biofuel source. Switchgrass is a warm-season, perennial grass
that is native to Central and North America and is a characteristic species of tall-grass
prairie (Rinehart, 2006). Agronomically, there are two classifications for switchgrass
ecotypes that refer to their growth habits: lowland ecotypes that are taller on more mesic
sites and upland ecotypes that are smaller in stature on drier sites (Keshwani & Cheng
,2008). Using switchgrass as a biofuel source may be advantageous compared to corn as it
promotes conservation of native prairie grasses and provides wildlife benefits (Keshwani &
Cheng, 2008). In order to use switchgrass for a biofuel crop, potential pests need to be
detected and studied. Currently, one pest being studied is a stem-boring caterpillar,
Blastobasis repartella .
Blastobasis repartella is a stem-boring caterpillar that bores into the proaxis and basal
nodes of switchgrass and kills individual plant tillers (Adamski et al., 2010). Adamski et al.
(2010) provided descriptions of the life-stages of B. repartella and some observations of its
biology in switchgrass. Prasifka et al. (2011) noted in their study of stem-boring caterpillars
in switchgrass that none of the stem-borers seemed to be threats to switchgrass or other
crops. Studies have shown that only one larva occupies a stem of switchgrass at a time
(Adamski et al., 2010; Prasifka et al., 2010). This study was part of a larger study on the
insect/plant relationship and designed as an exploratory test to determine the prevalence of
B. repartella larva in two different switchgrass cultivars as well as describe feeding
behavior of the larva on the switchgrass rhizomes. Results of this study were intended to
help determine directions of further investigations.
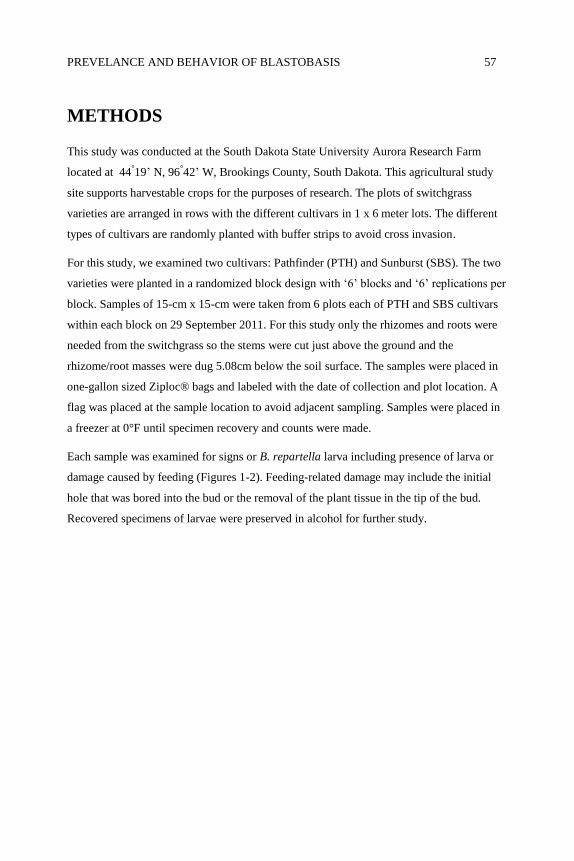
PREVELANCE AND BEHAVIOR OF BLASTOBASIS 57
METHODS
This study was conducted at the South Dakota State University Aurora Research Farm
located at 44°19’ N, 96°42’ W, Brookings County, South Dakota. This agricultural study
site supports harvestable crops for the purposes of research. The plots of switchgrass
varieties are arranged in rows with the different cultivars in 1 x 6 meter lots. The different
types of cultivars are randomly planted with buffer strips to avoid cross invasion.
For this study, we examined two cultivars: Pathfinder (PTH) and Sunburst (SBS). The two
varieties were planted in a randomized block design with ‘6’ blocks and ‘6’ replications per
block. Samples of 15-cm x 15-cm were taken from 6 plots each of PTH and SBS cultivars
within each block on 29 September 2011. For this study only the rhizomes and roots were
needed from the switchgrass so the stems were cut just above the ground and the
rhizome/root masses were dug 5.08cm below the soil surface. The samples were placed in
one-gallon sized Ziploc® bags and labeled with the date of collection and plot location. A
flag was placed at the sample location to avoid adjacent sampling. Samples were placed in
a freezer at 0°F until specimen recovery and counts were made.
Each sample was examined for signs or B. repartella larva including presence of larva or
damage caused by feeding (Figures 1-2). Feeding-related damage may include the initial
hole that was bored into the bud or the removal of the plant tissue in the tip of the bud.
Recovered specimens of larvae were preserved in alcohol for further study.
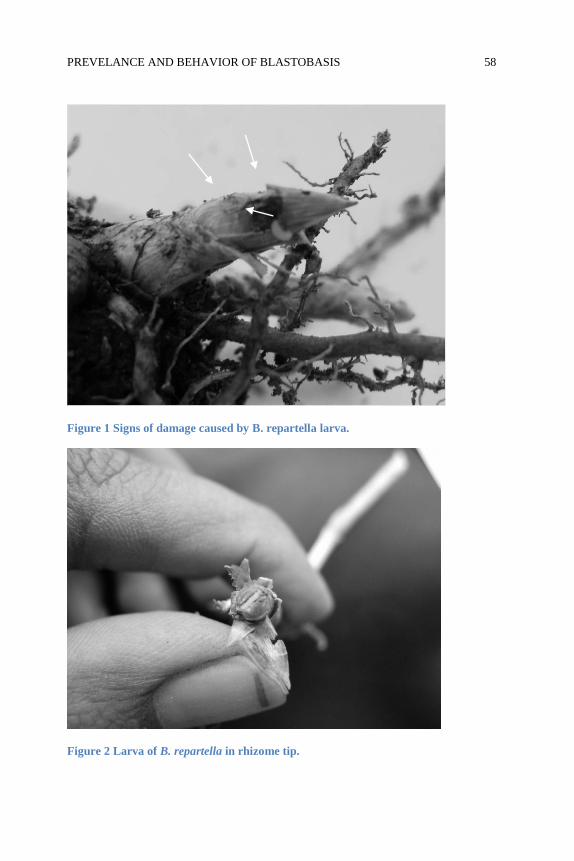
PREVELANCE AND BEHAVIOR OF BLASTOBASIS 58
Figure 1 Signs of damage caused by B. repartella larva.
Figure 2 Larva of B. repartella in rhizome tip.
PREVELANCE AND BEHAVIOR OF BLASTOBASIS 59
Data collected and recorded for each switchgrass tiller included the total number of new
buds, number of damaged buds, number of buds with larva, number of larva per bud, and
the type of damage on each bud. These data were used to quantify the prevalence of and
damage caused by B. repartella between the two varieties of switchgrass. Differences in
productivity, prevalence and damage between the two varieties were analyzed with a two
sample t-test assuming equal variance with an alpha level of 0.05.
RESULTS
A total of 136 tillers (65 PTH and 71 SBS) were collected and 345 buds (160 PTH and 185
SBS) were examined (Figure 3). Of those buds, 114 (55 PTH and 59 SBS) were damaged
by larva (Figure 3). A total of 47 (25 PTH and 22 SBS) larva were found in the rhizome
buds. There was no significant difference between PTH and SBS in the number of new
buds present (p = 0.54), for the number of damaged buds (p = 0.93), and for the number of
larva a (p= 0.4. Damage prevalence was 34.38% for the PTH variety and 31.89% for the
SBS variety.
Figure 3 Comparison of total buds and damaged buds caused by B. repartella larvae
on Pathfinder and Sunburst cultivars.
0
20
40
60
80
100
120
140
160
180
200
Pathfinder Sunburst
DamagedBuds
Total Buds
PREVELANCE AND BEHAVIOR OF BLASTOBASIS 60
Feeding behaviors of the larva were found to occur below ground where the larva feeds on
the meristematic tissues of the new rhizome buds in both varieties of switchgrass. There
was only one larva found per bud but multiple larvae were found per tiller. The typical
presence of a single larva per rhizome with multiple damaged buds suggests that a larva
moves from one bud to another.
DISCUSSION
Corn-based ethanol alone cannot reduce the current societal dependency on fossil fuels. For
this reason research is focused on determining the advantages of using switchgrass as a
biofuel source as well as potential limitations to biofuel yields from this source. We know
of no published studies that have looked at how pest relationships may alter the biomass
yields. Switchgrass can yield anywhere from ~16 Mg/ha to ~30 Mg/ha depending on
factors such as amount of precipitation and type of switchgrass variety being used
(McLaughlin et al., 1999). However, the parent project of this one has found decreases in
biomass production from between approximately 100-650 kg/ha across six switchgrass
cultivars (V. Calles Torrez, personal communication), indicating a potentially serious pest
status for the moth larva. This is the first study to examine the prevalence and damage
caused by a switchgrass pest feeding on underground portions of the plant. Further
research is needed to accurately determine how the larval feeding on underground portions
influences potential yields.
Previous research noted that B. repartella had a negative impact on the growth of
switchgrass tillers (Prasifka et al., 2010). We know that at the larval stage damage caused
by feeding causes cessation of tiller growth in switchgrass (Nyoka et al., 2007). A recent
study found that upwards of 40% of tillers may be lost due to damage caused by B.
repartella (P. Johnson, personal communication). However, little is known about the
effects of larval feeding on switchgrass growth below ground.
Because one-third of the potential biomass producing buds was killed by B. repartella,
there is a significant pest relationship and this requires the finding of new ways to manage
the populations of the switchgrass moth. Possible control includes the use of insecticides.
However, additional research would be needed to determine impacts of such control on
non-target sources.
PREVELANCE AND BEHAVIOR OF BLASTOBASIS 61
Because the larvae feed primarily below ground, the effects on switchgrass by the larvae
may differ from the older life stages. Normal switchgrass development typically has tip-
killed rhizomes not producing root-bearing proaxis from auxiliary buds and tillers at a 90%
rate (A. Boe, personal communication). In our study, we observed that larva below ground
feed entirely on the meristematic tissue rhizomes, and damaged rhizome meristems showed
an increase in auxiliary bud production after the primary tip was killed by the feeding larva.
This may suggest that supplementary tillers may be produced every year, which could
potentially increase biomass production. Future research needs to be conducted to
determine if B. repartella may be beneficial to switchgrass by causing it to respond to
predation and produce more rhizomes.
Blastobasis repartella appears to be more prevalent in cultivated plots compared to natural
settings at this time. It may be possible that the increase of acres of planted switchgrass
plots could lead to a subsequent increase in the distribution and populations sizes of B.
repartella. Research is needed to understand the prevalence and damage caused by B.
repartella at a larger scale in order to identify whether appropriate management strategies
to control this pest are warranted as the use of switchgrass as a source of biofuels increases.
LIMITATIONS
Limitations for this study included a small sampling number due to the exploratory nature
of the study. In the future using more samples will provide more accurate numbers for
statistical analyses.
ACKNOWLEDGEMENTS
I would personally like to thank Dr. Paul J. Johnson, Dr. Susan Rupp and Veronica Calles
Torrez for allowing me to do this research project and providing assistance until the very
end. And a special thanks to Dr. Melissa Wuellner for providing additional support in the
editing and formatting of this paper.
PREVELANCE AND BEHAVIOR OF BLASTOBASIS 62
REFERENCES
Adamksi, D., P. J. Johnson, A. A. Boe, J. D. Bradshaw, and A. Pultyniewicz. 2010.
Descriptions of life-stages of Blasotobasis repartella (Lepidoptera: Gelechioidea:
Coleophorida: Blastobasinae) and observations on its biology in switchgrass. Zootaxa
2656: 41-54.
Keshwani, D. R. and J. J. Cheng. 2008. Switchgrass for bioethanol and other value-added
applications: a review. Bioresource Technology 100: 1515-1523.
McLaughlin, S., J. Bouton, D. Bransby, B. Conger, W. Ocumpaugh, D. Parrish, C.
Taliaferro, K. Vogel, and S. Wullschleger. 1999. Developing switchgrass as a
bioenergy crop. In J. Janick (ed.), Proc. 4th New Crops Symposium 9-11 November
1998, Phoenix, AZ. American Society Horticulture Science, Alexandria, VA.
Nyoka B., P. Jeranyama, V. Owens, A. Boe, and M. Moechnig. 2007. Management guide
for biomass feedstock production from switchgrass in the Northern Great Plains.
Publication SGINC2-07, Brookings, SD: South Dakota State University.
Prasifka, J. R., J. D. Bradshaw, A. A. Boe, D. Lee, D. Adamski, M. E. Gray. 2010.
Symptons, distribution, and abundance of the stem-boring caterpillar, Blastobasis
repartella (Dietz), in switchgrass. Bioenergy Research 3: 238-242.
Prasifka, J. R., J. E. Buhay, T. W. Sappington, E. A. Heaton, J. D. Bradshaw, and M.E.
Gray. 2011. Stem-boring caterpillars of switchgrass in the Midwestern United States.
Annals of the Entomological Society of America 104: 507-514.
Rinehart, L. 2006. Swithgrass as a bioenergy crop. ATTRA-National Sustainable
Agriculture Information Services. Available: www.attra.ncat.org/attra-
pub/switchgrass.html Accessed: 30 Sep. 2011
Yuan, J. S., K. H. Tiller, H. Al-Ahmad, N. R. Stewart, and C. N. Stewart Jr. 2008. Plants to
power: bioenergy to fuel the future. Trends in Plant Science 13: 421-42
CONTRIBUTIONS OF SEED BANK 63
Contributions of Seed Bank and Vegetative
Propagules to Vegetation Composition on
Prairie Dog Colonies in Western South Dakota
Author: Emily R Helms
Faculty Sponsors: Dr. Lan Xu, Dr. Jack L. Butler
Department: Natural Resource Management
ABSTRACT
Characterizing the contributions of the seed bank and vegetative propagules will enhance
our understanding of community resiliency associated with prairie dog disturbances. Our
objective was to determine the effects of ecological condition (EC) and distance from
burrows on the soil seed bank and vegetative propagules. Based on species composition of
the extant vegetation, two prairie dog colonies were selected on the Buffalo Gap National
Grasslands in western South Dakota. Within each colony, two prairie dog burrows were
randomly selected at each of three sample points located about 150m apart. Two soil cores
were taken at 0.5m, 1.0m, and 1.5m distances from the center of each burrow. Cores used
to evaluate the seed bank were sifted and spread within standard seed flats, while cores
used to determine vegetative propagules were placed intact into plastic pots. Both were
maintained in a greenhouse for daily monitoring. A total 450 seedlings representing 16
species emerged from the low EC seed flats while 550 seedlings comprising 24 species
emerged from the high EC seed flats. Sixty-two percent of the low EC and 67% of the high
EC species emerged from the seed flats were annuals. On the low EC colony, 43 shoots
generated from vegetative propagules representing 7 species, two of which were also found
in the seed flats. On the high EC colony, 431 shoots sprouted from vegetative propagules
representing 5 species, 3 of which were not present in the seed flats. Fourteen percent of
the low EC and 80% of the high EC species emerged as vegetative propagules were
perennial native grasses. Distance from burrows had no impact on species richness within
CONTRIBUTIONS OF SEED BANK 64
each EC. Both colonies demonstrated considerable revegetation potential but differed with
respect to relative contributions from the soil seed bank and vegetative propagules.
INTRODUCTION
Prairie dogs and prairie dog colonies are very important components of native grasslands
where they contribute substantially to ecosystem biodiversity as well as providing habitat
and serving as a food source for several threatened, endangered, and sensitive species.
Prairie dogs are deemed as a keystone species and ecosystem engineers (Vannimwegen, et.
al., 2008). Predators and arthropods are more abundant in areas surrounding prairie dog
towns when compared with non-prairie dog colonized areas (Vannimwegen, et. al., 2008).
The most endangered mammal in North America, the black-footed ferret, use prairie dogs
as their sole food source. Other organisms such as burrowing owls, non-game grassland
birds, reptiles, and insects all call a prairie dog burrow home. Continuously clipping,
foraging and burrowing, prairie dogs has physically altered their habitat.
However, managing prairie dogs as keystone species is often considered incongruent with
managing grasslands for livestock production. Because both prairie dogs and cattle prefer
graminoids (Uresk, 1984) and cattle use the same landscapes and forage as prairie dogs.
These two species seem to compete for available forage. A general inability exists in
developing adaptive management plans that simultaneously manage public grasslands for
black-footed ferret habitat and livestock production in South Dakota. Much of this ability
can be directly attributed to the lack of understanding of the factors controlling vegetation
dynamics involved in correctly managing these important communities (Miller, et. al.,
2007).
Areas inhabited by prairie dogs are subject to continuous and intense disturbance by
grazing and burrowing that alters vegetation composition and structure compared to the
surrounding uninhabited areas. Vegetation resilience following these disturbances comes
from two primary sources: seeds (seed bank) and vegetative propagules (bud bank)
(Harper, 1977). Distinguishing the different contributions (seed bank vs. bud bank) may be
especially important to communities often subjected to multiple levels of disturbance, such
as with prairie dogs. Because the existing vegetation on prairie dog colonies is generally
well adapted to a wide variety of disturbance, the on-site bud bank may greatly facilitate
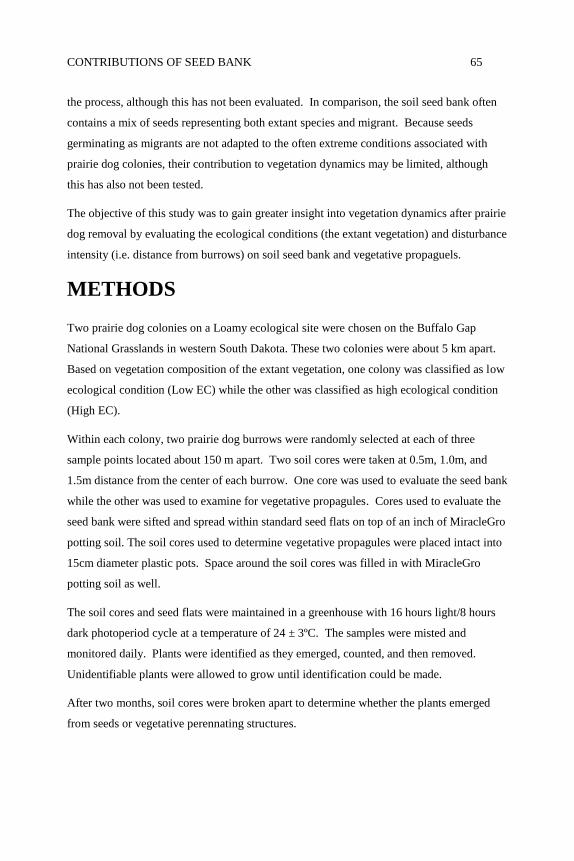
CONTRIBUTIONS OF SEED BANK 65
the process, although this has not been evaluated. In comparison, the soil seed bank often
contains a mix of seeds representing both extant species and migrant. Because seeds
germinating as migrants are not adapted to the often extreme conditions associated with
prairie dog colonies, their contribution to vegetation dynamics may be limited, although
this has also not been tested.
The objective of this study was to gain greater insight into vegetation dynamics after prairie
dog removal by evaluating the ecological conditions (the extant vegetation) and disturbance
intensity (i.e. distance from burrows) on soil seed bank and vegetative propaguels.
METHODS
Two prairie dog colonies on a Loamy ecological site were chosen on the Buffalo Gap
National Grasslands in western South Dakota. These two colonies were about 5 km apart.
Based on vegetation composition of the extant vegetation, one colony was classified as low
ecological condition (Low EC) while the other was classified as high ecological condition
(High EC).
Within each colony, two prairie dog burrows were randomly selected at each of three
sample points located about 150 m apart. Two soil cores were taken at 0.5m, 1.0m, and
1.5m distance from the center of each burrow. One core was used to evaluate the seed bank
while the other was used to examine for vegetative propagules. Cores used to evaluate the
seed bank were sifted and spread within standard seed flats on top of an inch of MiracleGro
potting soil. The soil cores used to determine vegetative propagules were placed intact into
15cm diameter plastic pots. Space around the soil cores was filled in with MiracleGro
potting soil as well.
The soil cores and seed flats were maintained in a greenhouse with 16 hours light/8 hours
dark photoperiod cycle at a temperature of 24 ± 3ºC. The samples were misted and
monitored daily. Plants were identified as they emerged, counted, and then removed.
Unidentifiable plants were allowed to grow until identification could be made.
After two months, soil cores were broken apart to determine whether the plants emerged
from seeds or vegetative perennating structures.
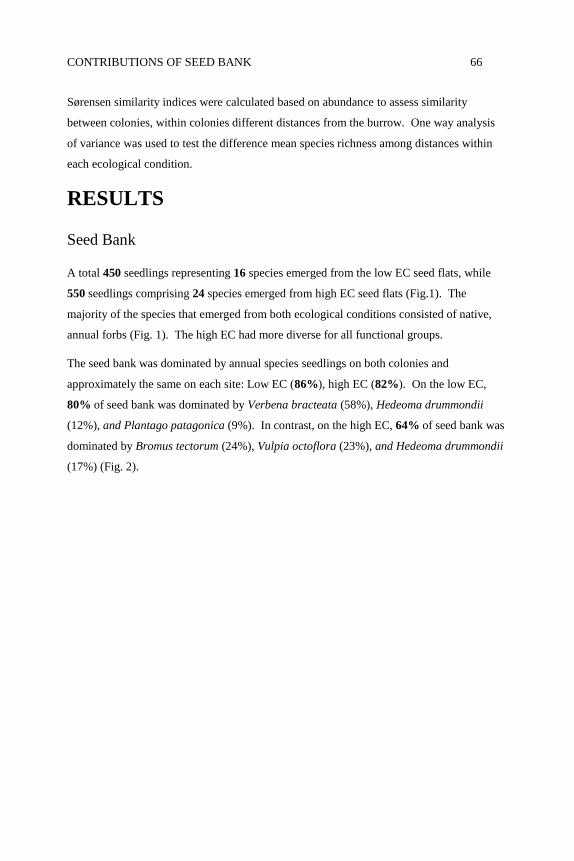
CONTRIBUTIONS OF SEED BANK 66
Sørensen similarity indices were calculated based on abundance to assess similarity
between colonies, within colonies different distances from the burrow. One way analysis
of variance was used to test the difference mean species richness among distances within
each ecological condition.
RESULTS
Seed Bank
A total 450 seedlings representing 16 species emerged from the low EC seed flats, while
550 seedlings comprising 24 species emerged from high EC seed flats (Fig.1). The
majority of the species that emerged from both ecological conditions consisted of native,
annual forbs (Fig. 1). The high EC had more diverse for all functional groups.
The seed bank was dominated by annual species seedlings on both colonies and
approximately the same on each site: Low EC (86%), high EC (82%). On the low EC,
80% of seed bank was dominated by Verbena bracteata (58%), Hedeoma drummondii
(12%), and Plantago patagonica (9%). In contrast, on the high EC, 64% of seed bank was
dominated by Bromus tectorum (24%), Vulpia octoflora (23%), and Hedeoma drummondii
(17%) (Fig. 2).
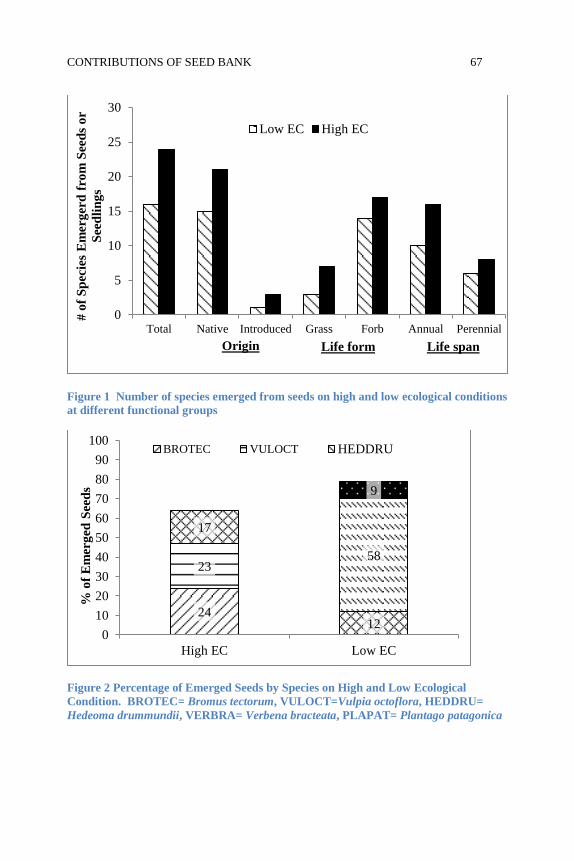
CONTRIBUTIONS OF SEED BANK 67
Figure 1 Number of species emerged from seeds on high and low ecological conditions
at different functional groups
Figure 2 Percentage of Emerged Seeds by Species on High and Low Ecological
Condition. BROTEC= Bromus tectorum, VULOCT=Vulpia octoflora, HEDDRU=
Hedeoma drummundii, VERBRA= Verbena bracteata, PLAPAT= Plantago patagonica
0
5
10
15
20
25
30
Total Native Introduced Grass Forb Annual Perennial
# o
f S
pec
ies
Em
erg
erd
fro
m S
eed
s o
r
See
dli
ng
s
Low EC High EC
Life form Life span Origin
24
23
17
12
58
9
0
10
20
30
40
50
60
70
80
90
100
High EC Low EC
% o
f E
merg
ed
Seed
s
BROTEC VULOCT HEDDRU
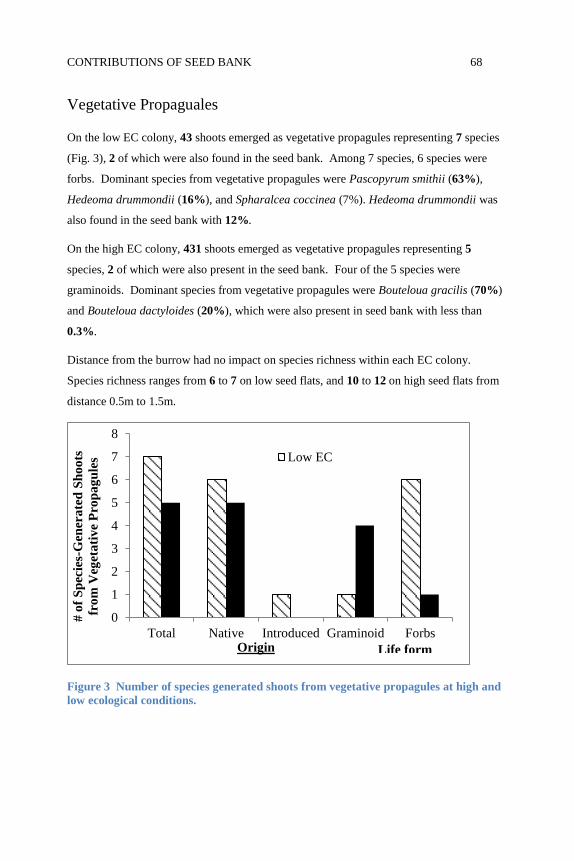
CONTRIBUTIONS OF SEED BANK 68
Vegetative Propaguales
On the low EC colony, 43 shoots emerged as vegetative propagules representing 7 species
(Fig. 3), 2 of which were also found in the seed bank. Among 7 species, 6 species were
forbs. Dominant species from vegetative propagules were Pascopyrum smithii (63%),
Hedeoma drummondii (16%), and Spharalcea coccinea (7%). Hedeoma drummondii was
also found in the seed bank with 12%.
On the high EC colony, 431 shoots emerged as vegetative propagules representing 5
species, 2 of which were also present in the seed bank. Four of the 5 species were
graminoids. Dominant species from vegetative propagules were Bouteloua gracilis (70%)
and Bouteloua dactyloides (20%), which were also present in seed bank with less than
0.3%.
Distance from the burrow had no impact on species richness within each EC colony.
Species richness ranges from 6 to 7 on low seed flats, and 10 to 12 on high seed flats from
distance 0.5m to 1.5m.
Figure 3 Number of species generated shoots from vegetative propagules at high and
low ecological conditions.
0
1
2
3
4
5
6
7
8
Total Native Introduced Graminoid Forbs
# o
f S
pec
ies-
Gen
era
ted
Sh
oo
ts
fro
m V
eget
ati
ve
Pro
pa
gu
les Low EC
Origin Life form
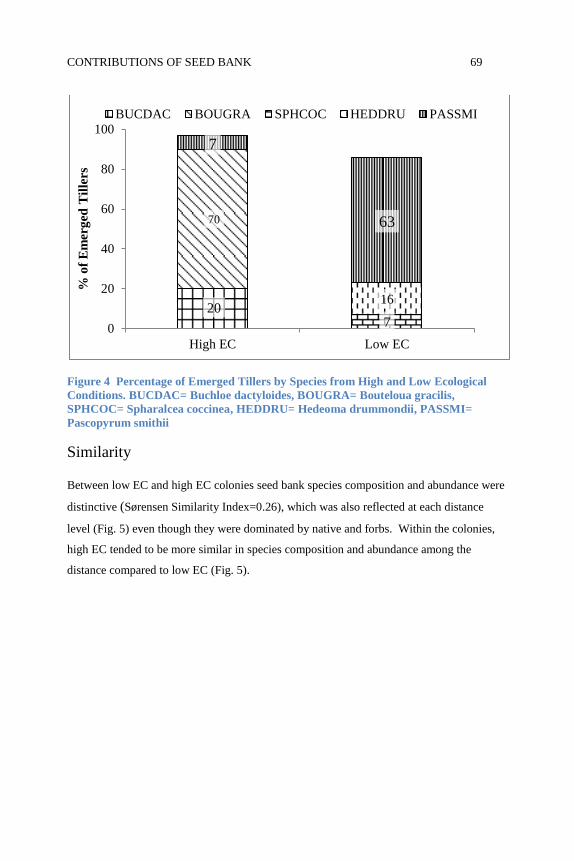
CONTRIBUTIONS OF SEED BANK 69
Figure 4 Percentage of Emerged Tillers by Species from High and Low Ecological
Conditions. BUCDAC= Buchloe dactyloides, BOUGRA= Bouteloua gracilis,
SPHCOC= Spharalcea coccinea, HEDDRU= Hedeoma drummondii, PASSMI=
Pascopyrum smithii
Similarity
Between low EC and high EC colonies seed bank species composition and abundance were
distinctive (Sørensen Similarity Index=0.26), which was also reflected at each distance
level (Fig. 5) even though they were dominated by native and forbs. Within the colonies,
high EC tended to be more similar in species composition and abundance among the
distance compared to low EC (Fig. 5).
20
70
7
16
7
63
0
20
40
60
80
100
High EC Low EC
% o
f E
mer
ged
Til
lers
BUCDAC BOUGRA SPHCOC HEDDRU PASSMI
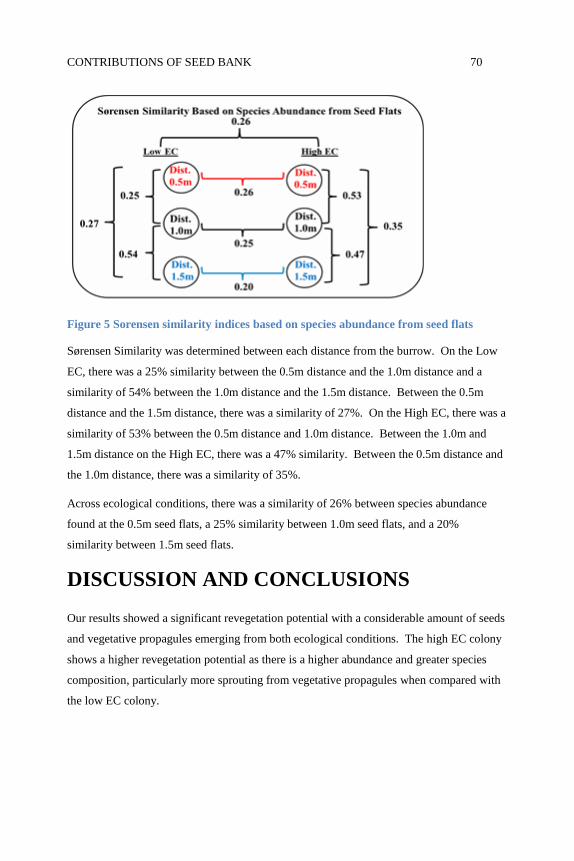
CONTRIBUTIONS OF SEED BANK 70
Figure 5 Sorensen similarity indices based on species abundance from seed flats
Sørensen Similarity was determined between each distance from the burrow. On the Low
EC, there was a 25% similarity between the 0.5m distance and the 1.0m distance and a
similarity of 54% between the 1.0m distance and the 1.5m distance. Between the 0.5m
distance and the 1.5m distance, there was a similarity of 27%. On the High EC, there was a
similarity of 53% between the 0.5m distance and 1.0m distance. Between the 1.0m and
1.5m distance on the High EC, there was a 47% similarity. Between the 0.5m distance and
the 1.0m distance, there was a similarity of 35%.
Across ecological conditions, there was a similarity of 26% between species abundance
found at the 0.5m seed flats, a 25% similarity between 1.0m seed flats, and a 20%
similarity between 1.5m seed flats.
DISCUSSION AND CONCLUSIONS
Our results showed a significant revegetation potential with a considerable amount of seeds
and vegetative propagules emerging from both ecological conditions. The high EC colony
shows a higher revegetation potential as there is a higher abundance and greater species
composition, particularly more sprouting from vegetative propagules when compared with
the low EC colony.
CONTRIBUTIONS OF SEED BANK 71
Results from this study are concurrent with other studies that have found on perennial
mixed-grass and shortgrasses prairie that annual forbs occurrence increases on prairie dog
towns (Winter, et. al., 2002; Fahnestock, et. al., 2003). This reflected on presence of the
abundant Verbena bracteata, Dyssodia papposa, and Plantago patigonica in the seed bank.
There was difference between proportion species composition and abundance between low
EC and high EC. On the low EC colony, seed bank was dominated by annual forbs (67%),
while on the high EC colony, 47% of seed bank was dominated by annual grasses such as
Bromus tectorum and Vulpia octoflora.
The relative contributions of the seed and bud bank to each colony generally reflected the
ecological condition of each colony, which is a product of the management and
environmental history of each colony. On the high EC colony, the vegetative propaguls
(bud bank) (431 shoots emerged from vegetative propagules) was much higher than low EC
colony’s bud bank (only 43 shoots generated from vegetative propagules). In addition, the
species compositions on these vegetative propaguels were different, there was more native
perennial forbs like Spharalcea coccinea and Hedeoma drummondii on the low EC colony
compared to more native perennial grasses such as Bouteloua gracilis (70%) and
Bouteloua dactyloides (20%) on the high EC.
Although few species emerged from the seed bank could be considered typical of
undisturbed mixed-grass prairie vegetation, the number and composition of seedlings
suggest that, with the removal of the major disturbance factors (prairie dogs, livestock),
colonies have the potential to quickly re-vegetate. The high percentage (44%) emergence
of shoots from the bud bank on the high EC colony suggest that vegetation recovery may
proceed faster and persist longer than recovery on the low EC colony (only 9% emergence
of shoot from the bud bank). More management may be needed in order to reach a climax
state equal to a historic climax plant community for that site.
LIMITATIONS
The main limitations to this study were greenhouse space and time. Due to these
limitations, the samples size was limited to 3 replications and two months duration. Future
study should have more replications, long duration, and different distance regimes from the
CONTRIBUTIONS OF SEED BANK 72
center of the burrows in order to fully quantify the soil seed bank and vegetative propagule
numbers.
ACKNOWLEDGEMENTS
This project was funded by the Griffith Undergraduate Research Award and Undergraduate
Research Program of Academic and Scholarly Excellence. Thanks to Dr. Gary Larson for
help in identifying the seemingly unidentifiable, Dr. Patricia Johnson for her insight, Dr.
Neil Reese for the greenhouse space, Will Busse for help in collecting, preparing, and
transporting the samples to Brookings, US Forest Service Rocky Mountain Research
Station for the contribution, and to Ayush Shrestha and Jordan Knowltonkey for their
assistance in this study.
REFERENCES
Boyda, E. D., J. L. Bulter, and L. Xu. 2011. Using similarity indices as a tool for
characterizing and monitoring vegetation within prairie dog colonies in southwestern
South Dakota. The 64th Annual Meeting of the Society of Range Management.
Billings, MT. Abstract.
Fahnestock, J.T., D. L. Larson, G. E. Plumb, and J. K.Detling. 2003. Effects of ungulates
and prairie dogs on seed banks and vegetation in North American mixed-grass prairie.
Plant Ecology 167:255-268.
Harper, J.L. 1977. Population biology of plants. Academic Press, New York.
Miller, B. J., R. P. Reading, D. E. Biggins, J. K. Detling, S. C. Forrest, J. L. Hoogland, J.
Javersak, S. D. Miller, J. Proctor, J. Truett, and D. W. Uresk. 2007. . Prairie dogs:
An ecological review and current biopolitics, J. Wildlife Management 71:2801-2810.
Uresk, D. 1984. Black-tailed Prairie Dog Food Habits and Forage Relationships in Western
South Dakota. Journal of Range Management. 37 (4): 325-329.
Vannimwegen, R.E., J. Kretzer, and J. F. Cully Jr.. 2008. Ecosystem Engineering by a
colonial mammal: How Prairie Dogs Structure Rodent Communities. Ecology, 89
(12): 3298-3305.
Winter, S.L., J. F. Cully Jr., and J. S. Pontius. 2002. Vegetation of prairie dog colonies and
non-colonized shortgrass prairie. J. Range Manage. 55:502-508.
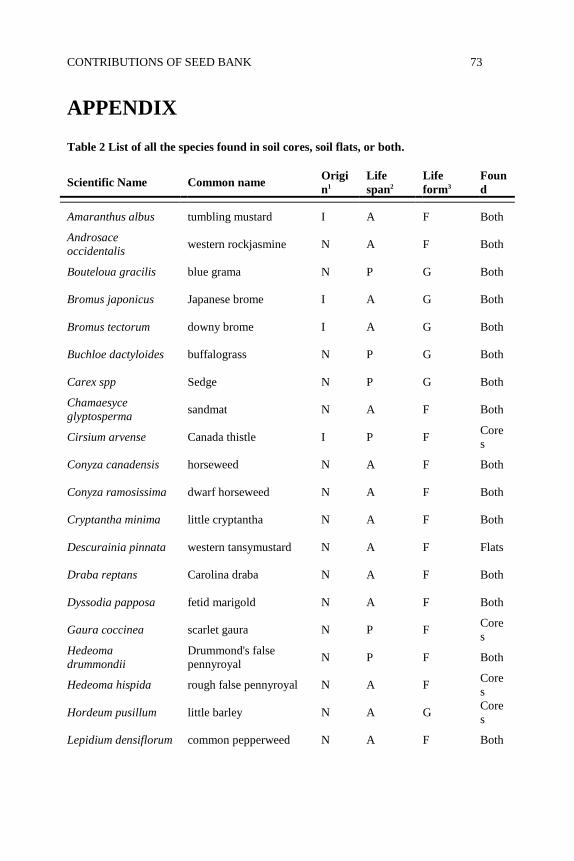
CONTRIBUTIONS OF SEED BANK 73
APPENDIX
Table 2 List of all the species found in soil cores, soil flats, or both.
Scientific Name Common name Origi
n1
Life
span2
Life
form3
Foun
d
Amaranthus albus tumbling mustard I A F Both
Androsace
occidentalis western rockjasmine N A F Both
Bouteloua gracilis blue grama N P G Both
Bromus japonicus Japanese brome I A G Both
Bromus tectorum downy brome I A G Both
Buchloe dactyloides buffalograss N P G Both
Carex spp Sedge N P G Both
Chamaesyce
glyptosperma sandmat N A F Both
Cirsium arvense Canada thistle I P F Core
s
Conyza canadensis horseweed N A F Both
Conyza ramosissima dwarf horseweed N A F Both
Cryptantha minima little cryptantha N A F Both
Descurainia pinnata western tansymustard N A F Flats
Draba reptans Carolina draba N A F Both
Dyssodia papposa fetid marigold N A F Both
Gaura coccinea scarlet gaura N P F Core
s
Hedeoma
drummondii
Drummond's false
pennyroyal N P F Both
Hedeoma hispida rough false pennyroyal N A F Core
s
Hordeum pusillum little barley N A G Core
s
Lepidium densiflorum common pepperweed N A F Both
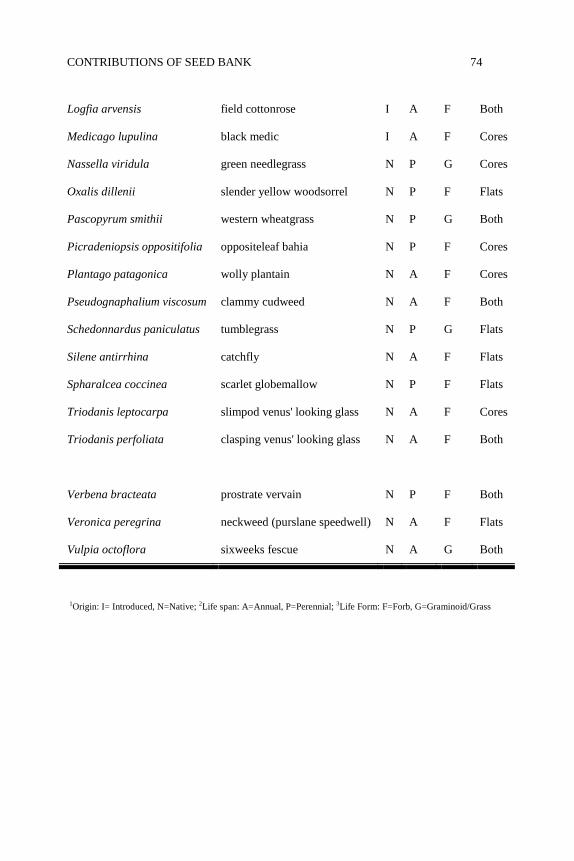
CONTRIBUTIONS OF SEED BANK 74
Logfia arvensis field cottonrose I A F Both
Medicago lupulina black medic I A F Cores
Nassella viridula green needlegrass N P G Cores
Oxalis dillenii slender yellow woodsorrel N P F Flats
Pascopyrum smithii western wheatgrass N P G Both
Picradeniopsis oppositifolia oppositeleaf bahia N P F Cores
Plantago patagonica wolly plantain N A F Cores
Pseudognaphalium viscosum clammy cudweed N A F Both
Schedonnardus paniculatus tumblegrass N P G Flats
Silene antirrhina catchfly N A F Flats
Spharalcea coccinea scarlet globemallow N P F Flats
Triodanis leptocarpa slimpod venus' looking glass N A F Cores
Triodanis perfoliata clasping venus' looking glass N A F Both
Verbena bracteata prostrate vervain N P F Both
Veronica peregrina neckweed (purslane speedwell) N A F Flats
Vulpia octoflora sixweeks fescue N A G Both
1Origin: I= Introduced, N=Native; 2Life span: A=Annual, P=Perennial; 3Life Form: F=Forb, G=Graminoid/Grass
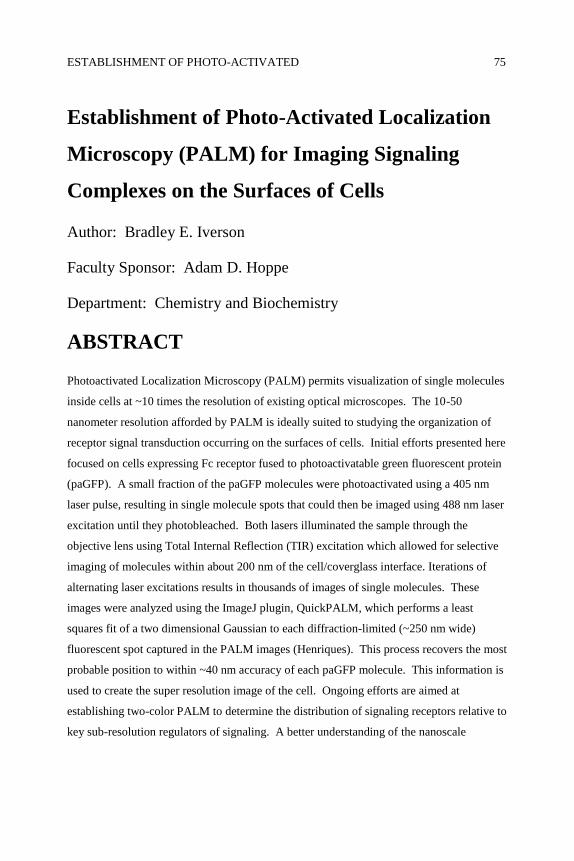
ESTABLISHMENT OF PHOTO-ACTIVATED 75
Establishment of Photo-Activated Localization
Microscopy (PALM) for Imaging Signaling
Complexes on the Surfaces of Cells
Author: Bradley E. Iverson
Faculty Sponsor: Adam D. Hoppe
Department: Chemistry and Biochemistry
ABSTRACT
Photoactivated Localization Microscopy (PALM) permits visualization of single molecules
inside cells at ~10 times the resolution of existing optical microscopes. The 10-50
nanometer resolution afforded by PALM is ideally suited to studying the organization of
receptor signal transduction occurring on the surfaces of cells. Initial efforts presented here
focused on cells expressing Fc receptor fused to photoactivatable green fluorescent protein
(paGFP). A small fraction of the paGFP molecules were photoactivated using a 405 nm
laser pulse, resulting in single molecule spots that could then be imaged using 488 nm laser
excitation until they photobleached. Both lasers illuminated the sample through the
objective lens using Total Internal Reflection (TIR) excitation which allowed for selective
imaging of molecules within about 200 nm of the cell/coverglass interface. Iterations of
alternating laser excitations results in thousands of images of single molecules. These
images were analyzed using the ImageJ plugin, QuickPALM, which performs a least
squares fit of a two dimensional Gaussian to each diffraction-limited (~250 nm wide)
fluorescent spot captured in the PALM images (Henriques). This process recovers the most
probable position to within ~40 nm accuracy of each paGFP molecule. This information is
used to create the super resolution image of the cell. Ongoing efforts are aimed at
establishing two-color PALM to determine the distribution of signaling receptors relative to
key sub-resolution regulators of signaling. A better understanding of the nanoscale
ESTABLISHMENT OF PHOTO-ACTIVATED 76
molecular activities within cells will allow for more in depth studies into many different
fields including biophysics, molecular biology, and medicine.
INTRODUCTION
Photoactivated localization microscopy (PALM) was developed by Eric Betzig and Harald
Hess to surpass the diffraction resolution limit of an optical microscope. The Rayleigh
criteria defines the diffraction limit as: R=0.61λ/NA or ~ 200 nm (Hess). PALM is capable
of resolution on the order of tens of nanometers (Betzig). PALM utilizes photoactivatable
proteins in order to sequentially localize single molecules with very high precision, and,
ultimately, overcomes this limit. Detection of single fluorophores is achieved using two
different lasers, the activation beam and the readout beam. The activation beam causes the
photoactivatable fluorophores such as paGFP or pamCherry to convert from a dark state to
a fluorescent state and the readout beam is used to generate the fluorescence needed for
imaging and to bleach the activated molecules. The goal is to only activate one molecule in
each diffraction limited area (or the area of the point spread function) (Henriques). We
used the Fc- Receptor (FcRIIA) fused to paGFP and the transferrin receptor fused to
pamCherry to establish the PALM method in our lab.
METHODS
In order to perform PALM, cells must first be transfected with plasmid DNA encoding a
photoactivatable protein. The photoactivatable protein we first used was photoactivatable
Green Fluorescent Protein (paGFP). We fused this protein to the Fc receptor and expressed
it in Cos-7 cells. The second photoactivatable protein we used was pamCherry fused to
transferrin receptor and expressed in Cos-7 cells. Once efficient transfection was achieved,
and it was determined that the molecules were indeed photoactivatable after being fused the
Fc receptor or transferrin receptor, it was necessary to fix the cells. The cells were fixed
using chemical crosslinking in 4% paraformaldehyde for seven minutes. This was done in
a dark room with a green light, so that the molecules would not be photo-activated
prematurely. Once the sample was prepared, it was necessary to find a cell expressing the
photoactivatable proteins. When searching for cells transfected with paGFP, it was
discovered that the 488 nm laser activates some of the molecules. In order to image single

ESTABLISHMENT OF PHOTO-ACTIVATED 77
molecules, it was necessary to prebleach the sample with the readout laser. After the
molecules that were activated were bleached away by the readout laser, we started to see
single molecules being activated and subsequently bleached away. This step was not
necessary for pamCherry. Once a cell had been found and any activated molecules
bleached, the PALM acquisition could be made using cycles of activation with 405 nm
excitation and imaging with either 490 nm excitation (paGFP) or 561nm excitation
(pamCherry). An example of the single molecule signatures observed for mCherry are
shown in Figure 1.
Figure 1 Raw PALM data for transferrin receptor-pamCherry. PALM was used to
capture single transferrin receptors fused with pamCherry in the image. Two of these
single molecules can be seen in the red boxes above. A least squares fit as a 2D
Gaussian was used to localize the molecules, using the ImageJ plugin QuickPALM.
The photoactivatable molecules were activated with a 405 nm laser and imaged with a
488 nm laser. Thousands of images must be taken so that enough of these single
molecules can be localized to create a high resolution image. The high resolution
allows for the study of the distribution of single molecules in a cell. The black scale
bar is 1 µm.
The readout beam and activation beam were turned on alternately, in order to activate the
molecules, image them, and then bleach them. In order to recover enough information to
reconstruct a high resolution PALM image, around five to ten thousand images needed to
be obtained. This is because the ideal image reconstruction would require complete
sampling of the paGFP molecules. Furthermore, since the signal of a single molecule is
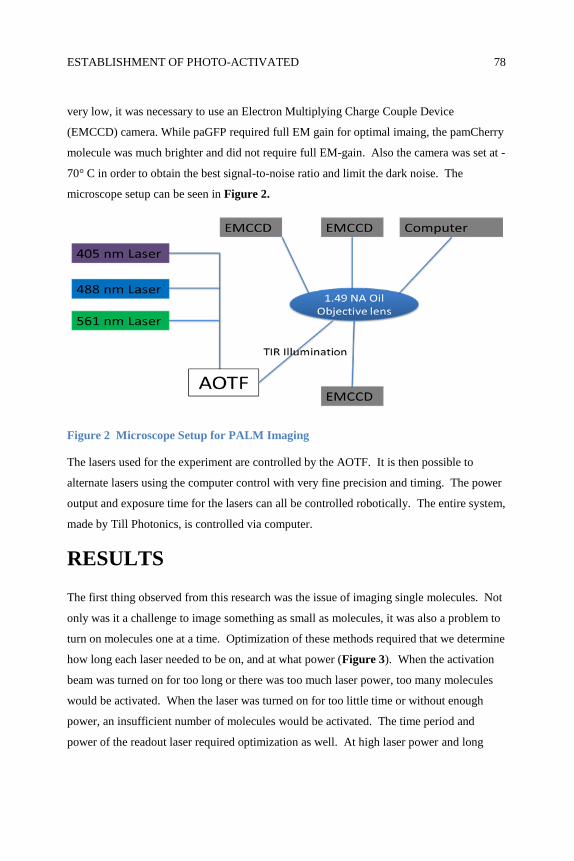
ESTABLISHMENT OF PHOTO-ACTIVATED 78
very low, it was necessary to use an Electron Multiplying Charge Couple Device
(EMCCD) camera. While paGFP required full EM gain for optimal imaing, the pamCherry
molecule was much brighter and did not require full EM-gain. Also the camera was set at -
70° C in order to obtain the best signal-to-noise ratio and limit the dark noise. The
microscope setup can be seen in Figure 2.
Figure 2 Microscope Setup for PALM Imaging
The lasers used for the experiment are controlled by the AOTF. It is then possible to
alternate lasers using the computer control with very fine precision and timing. The power
output and exposure time for the lasers can all be controlled robotically. The entire system,
made by Till Photonics, is controlled via computer.
RESULTS
The first thing observed from this research was the issue of imaging single molecules. Not
only was it a challenge to image something as small as molecules, it was also a problem to
turn on molecules one at a time. Optimization of these methods required that we determine
how long each laser needed to be on, and at what power (Figure 3). When the activation
beam was turned on for too long or there was too much laser power, too many molecules
would be activated. When the laser was turned on for too little time or without enough
power, an insufficient number of molecules would be activated. The time period and
power of the readout laser required optimization as well. At high laser power and long

ESTABLISHMENT OF PHOTO-ACTIVATED 79
exposure time, the molecules would bleach too rapidly, but insufficient exposure time
would result in excess signal and the image would become saturated with photoactivated
molecules.
Figure 3
Figure 4
Laser power and exposure time must be optimized to activate and bleach the correct
number of fluorophores during PALM. Determining the amount of exposure time and laser
power to image single molecules proved to be a difficult task. Figure 3 shows an example
of too much exposure time and laser power which would saturate the detector. Figure 4
shows not enough laser power and exposure time of the activation laser, which leads to low
signal. The correct balance of laser power and exposure time of the readout laser was
equally difficult to determine.
Many trials were performed in order to address the data collection issues. Eventually, the
correct amount of laser power and exposure time for the different photoactivatable
A

ESTABLISHMENT OF PHOTO-ACTIVATED 80
molecules was determined. When the right amount of laser power and exposure time was
determined, useful data started to be obtained. Single molecules were then able to be
resolved. For the two different photoactivatable molecules used in the experiments,
different settings for all aspects of microscope set up were required (Figure 5 and Figure
6).
Figure 5 Raw PALM data for FcR-paGFP
Isolated single molecule emissions can be observed as single spots in these images. The
activation laser was on for 20 ms while the readout laser was on for 500 ms. The three
images above are 50 cycles apart. These molecules were localized and used to reconstruct
a PALM image of the cell. When taking PALM data, thousands of images like the ones
above are captured in order to localize as many of the photactivatable molecules as
possible. A problem with the paGFP was the contrast ratio, because the noise was close to
the level of the signal. The poor contrast ratio of paGFP can be seen when comparing the
fluorescence of single molecules compared to dim fluorescence from the inactivated
molecules in the rest of the cell.

ESTABLISHMENT OF PHOTO-ACTIVATED 81
Figure 6 Raw data for transferrin-pamCherry
The three images were selected from a 5000 image stack used to create a PALM image of
this Cos 7 cell. The pamCherry molecule was much brighter than the paGFP, resulting in
better contrast than for paGFP. The pamCherry molecules were activated easier than the
paGFP using the 405 nm activation laser.
Once single molecules were captured, the data needed to be analyzed. An ImageJ plugin,
QuickPALM, was implemented (Henriques). QuickPALM determines the most probable
position of each molecule using a least squares fit of a two dimensional Gaussian of each
fluorescent spot captured in the PALM image. This process then recovers the most
probable position of each photoactivatable molecule. This information is used to create the
super resolution image of the cell (Figure 7 and Figure 8).

ESTABLISHMENT OF PHOTO-ACTIVATED 82
Figure 7 Reconstructed PALM images of FcR-paGFP
A and B are reconstructed images using the ImageJ plugin, “QuickPalm.” C and D are the
summed images of all of the raw data with no reconstruction, which is the TIRF equivalent
image of the Cos-7 cell. The cell is expressing the FcR receptor fused to paGFP. Over
150,000 molecules were localized to acquire the reconstructed PALM image (A). B shows
a zoomed in view of the PALM image compared to D which is the same section of the cell
but the TIRF equivalent. The better resolution afforded by the PALM reconstruction is
evident when comparing the magnified images.
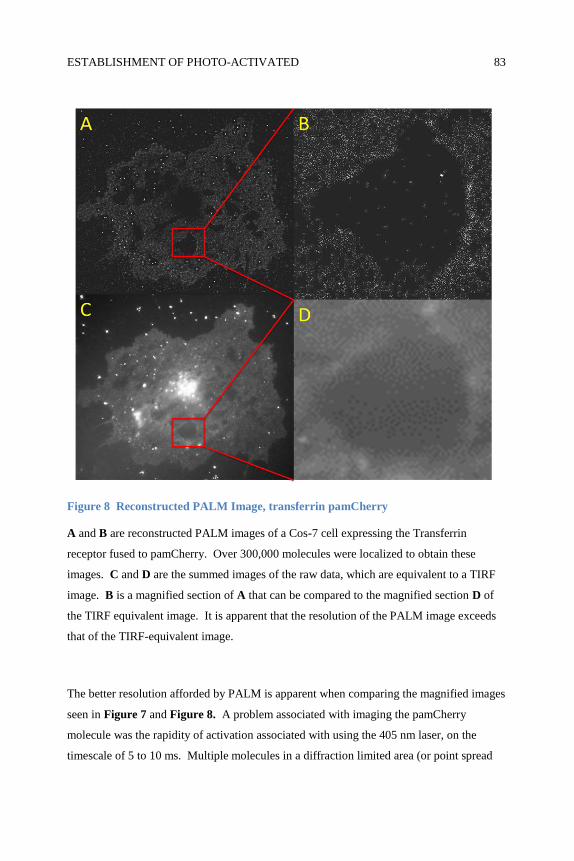
ESTABLISHMENT OF PHOTO-ACTIVATED 83
Figure 8 Reconstructed PALM Image, transferrin pamCherry
A and B are reconstructed PALM images of a Cos-7 cell expressing the Transferrin
receptor fused to pamCherry. Over 300,000 molecules were localized to obtain these
images. C and D are the summed images of the raw data, which are equivalent to a TIRF
image. B is a magnified section of A that can be compared to the magnified section D of
the TIRF equivalent image. It is apparent that the resolution of the PALM image exceeds
that of the TIRF-equivalent image.
The better resolution afforded by PALM is apparent when comparing the magnified images
seen in Figure 7 and Figure 8. A problem associated with imaging the pamCherry
molecule was the rapidity of activation associated with using the 405 nm laser, on the
timescale of 5 to 10 ms. Multiple molecules in a diffraction limited area (or point spread
ESTABLISHMENT OF PHOTO-ACTIVATED 84
function) caused problems in the process of image reconstruction. The goal is to only
activate one molecule per diffraction limited area in order to most efficiently localize as
many molecules per image as possible. Better localization precision yields greater final
resolution. Significant gains were made in developing this method for imaging structures
using PALM. From trial to trial, the resolution improved. More molecules were imaged
and resolved using the technique and it continues to develop into a useful method for
visualization.
DISCUSSION (AND/OR CONCLUSIONS)
The groundwork has been laid for acquiring and analyzing PALM data in the lab. Some
microscope settings still need adjustments but the outlook is good. We will need to
investigate a well-characterized cellular structure, such as a clathrin coated pits in order to
determine how much information can be obtained from sub-diffraction limit PALM
imaging. Future goals include expanding this technique, utilizing the exponentially
decaying evanescent field of total internal reflection fluorescence microscopy. With this
characteristic excitation, we are hoping to utilize intensity measurements of single
molecules to reconstruct three-dimensional super-resolution images. We are also hoping to
establish two-color PALM to determine the distribution of signaling receptors relative to
key subresolution regulators of signaling. It will be a challenge to find a balance in order to
image both the paGFP molecules and the pamCherry molecules at the same time for two
color PALM because of the differences in brightness and sensitivity for photoactivation
between the two molecules.
ACKNOWLEDGEMENTS
This work was supported by the Center for Biological Control and Analysis (BCAAP), a
South Dakota Govener’s 2010 program.
I would also like to thank the Hoppe lab for training, mentorship, and all their help in
completing this project as well as expanding my knowledge in many different fields.

ESTABLISHMENT OF PHOTO-ACTIVATED 85
REFERENCES
Betzig et al. Science 2006; Volume 313: 1642-1645.
Henriques et al. Biopolymers 2011; Volume 95: 322-331. DOI 10.1002/bip.21586
Hess et al. Nat Protoc. 2009; 4(3): 291–308. doi:10.1038/nprot.2008.246.
CARL ORFF’S CARMINA BURANA 86
CARL ORFF’S CARMINA BURANA: A
CONCEPTUAL AND ETHICAL ANALYSIS
Author: Zachary Krueger
Faculty Sponsor: Dr. Michael Walsh
Department: Music
ABSTRACT
This paper addresses the moral and ethical implications of Carl Orff’s masterpiece Carmina
Burana. I begin with a brief introduction, framing the paper and providing some general
background about the piece’s importance. I then delve into discussions about the original
writers of the Carmina text as well as some possible philosophical influence that these
writers could have had on Orff. Next I present some information on Nazi Germany (in
which Orff lived) including the philosophical basis of their cultural policy and some
historical theories that explain the phenomenon of Nazi eugenics. I include a summary of
my research regarding Orff’s connection to the Nazi party as well as some historical
information on Orff and the Carmina. A thematic plot analysis of the piece follows and
then I conclude with some comments about the information as a whole. Throughout the
study of all of the aspects I come to the conclusion that Orff’s piece is layered with
meaning, and is a fascinating study on the inner psyche of oppression and cynicism. The
piece itself reflects many of the external factors acting upon it, but it stands on its own as a
philosophical piece of art. Orff creates his own ethical system that is shaped around what
appears to be a supremely hopeless worldview. I show the connections found in the piece
to these external factors while examining Orff’s own ideas.
INTRODUCTION
Research usually consists of a person or group of persons investigating a singular
phenomenon while weaving together threads of data to create the fabric of a new idea. The
CARL ORFF’S CARMINA BURANA 87
research presented here does exactly the opposite, which is quite typical in the artistic
world. Art is a science like none other. It speaks about the human soul so profoundly that
even the artist himself cannot comprehend completely what is woven into his creation.
Carl Orff’s Carmina Burana is a particularly pertinent example of this complexity. It has
so many threads woven into its fabric that scholars, musicians, and concert-goers are still
puzzling over its origins more than eighty years after its premiere. When researching
something which has had a massive moral, philosophical, and cultural impact on the world
as the Carmina, one cannot simply piece together scraps of information into a scholarly
quilt. Instead one must hold a microscope over the many threads that hold it together and
examine their very fibers. Composed amid the tumultuous years of the Nazi reign in
Germany, the Carmina is a source of endless curiosity and skepticism (Orff himself was
suspected of being a Nazi sympathizer or even party member). While there is no certainty
about Orff’s intentions in composing his masterpiece, I will attempt to break down its many
parts and examine the factors and influences surrounding it to shed more light on what
could possibly have been his mindset when writing this piece. What I am doing here is
creating a patchwork quilt built from scraps; a quilt in which the finished project is not
something brand new at all but instead is a collection of preexisting thought that creates a
compelling whole.
You would be hard-pressed to find a piece of music or literature that has rocked,
scandalized and delighted society like the Carmina Burana. Its blatant illusions to lust,
drunkenness, love, and spiritual longing have enticed audiences for centuries. The libretto
(text) for the work was written by many hands in many regions in 12th century Europe,
giving birth to a widespread literary and philosophical revolution. The actual text of the
manuscript for the Carmina, which contains more than 200 poems and verses which were
compiled into a singular volume by Catholic monks, was stored away in the Bavarian
monastery of Bueron and dropped out of history for several centuries. Carl Orff, inspired
by the scandalous nature and beautiful cadence of the poems, brought them back to the
forefront of creative thought when he chose it as the libretto for his 1948 stylistic cantata,
thus bridging the artistic gap between the modern era and the breakthroughs of western
literature in the Medieval Period. No other work has impacted the artistic world like the
CARL ORFF’S CARMINA BURANA 88
Carmina Burana; it has tied together art and history as it weaves controversy into societies
while at the same time revolutionizing art and creative thought.
THE GOLIARDS AND THE ORIGINS OF
THE TEXT
The origins of the Carmina are somewhat mysterious, as are the poets who composed them.
The composers of the poems are a group oflyricists referred to as the“Goliards.” The name
is derived from the Biblical story of David and the Philestinean king Goliath.P.G. Walsh
notes that the term “Golias”originally came about through a debate between St. Bernard of
Clairvaux and Peter of Abelard (a literary leader and philosopher of the time period). St.
Bernard publically renounced Abelard’s literature and ideas, comparing them and their
power over readers and listeners the monstrous (and seemingly indestructible) figure of
Goliath (a symbol for evil and oppression in the Old Testament). Abelard (who is believed
to have possibly contributed some of his own verses to the Carmina)publically criticized
St. Bernard’s Cistercian Order of monks, referred to as the “Gray Monks,” and created a
series of satirical verses aimed at them. This style of tongue-in-cheek writing unexpectedly
appealed to readers and inspired the creation of a sect of vagrant wanderers who traveled
throughout Europe, spreading the new brand of satirical, romantic and moralizing literature,
much like Abelard’s. The movement is often compared to the hippie movement of the
60’s, and they gladly took on the name and nefarious connotation of Goliards (p. xv).The
most recognized feature of this group was their sophisticated renderings of Latin verse. It
is easy to focus on the group’s offensive material, but further study reveals these crass
writers as master satirists of the state of Medieval Era society and the decay of leadership in
the Catholic Church and moral society in Europe as a whole in the thirteenth century
(Classen, 2009). The movement and large bulk of work resulting from the group sowed
controversy in Medieval Era society, as the writers became more and more outspoken about
their secular themes in an apparent attempt to warp and evolve the sacred “high art” of
poetry and music.
These works have been hailed and studied as literary master works, but Orff did not
haphazardly choose this manuscript to draw text based solely on its reputation. Extensive
CARL ORFF’S CARMINA BURANA 89
study of the meter and rhyme of many of the poems shows that these pieces were more than
likely meant to be sung. The problem with deciphering twelfth century composition is that
vocal parts were transcribed on separate manuscripts. Composers also relied on themselves
and their companions’ ability to memorize lyrics and melodies in order to perform and
spread their works. These factors make it hard to tell if the text held in Munich today is all
that was recorded or if there was in fact musical lines ever written for the texts (Stevens,
1961). Some of the pieces seem too complex and wordy to have been songs, while others
actually have neumes (the ancient form of musical notation most associated with Gregorian
chant music) scribbled in above the words. While some of the poems appear to have been
written out with much care and thought, others have been hurriedly scribbled down as if
from memory (Walsh, 1993). The scribbled characters and the lack of staves (musical staff
on which musical notation rests) with the neumes (Stevens, 1961) combine to make
performance of the original musical works near impossible.
ANALYSIS OF GOLIARD PHILOSOPHY
A study of the history of the text helps us to better understand the depth of the Carmina as
it combines groundbreaking literary history and music, but to better answer the question of
the philosophy Orff presents in his work we must delve briefly into the philosophy of the
original writers. To do this I will speak of the ideologies of two of the most infamous
characters involved in the Goliard movement: Peter Abelard himself and the controversial
Archpoet.
“‘And thereafter,’ said Abelard, ‘I made no new songs of the mysteries of philosophy, but
of Love’s secrets only’” (Waddell, 1934). Abelard, a Medieval scholar, writer and clergy
member, is a hinge character in the history of twelfth century Europe. His unorthodox
ideas of theology and philosophy make him the concentration of much scholarship. His
intellectual might trounced some of the greatest philosophical minds of the era and his
public disputes drew attention to his ideas from the public (Shapiro, 1964). As evidenced
in his statement above, Abelard formed many of his ideas around the framework of love; in
fact one could say that he was obsessed with the concept of love and eventually with love’s
distortion into lust. His stormy romance with a woman named Heloise could be a catalyst
behind the transformation. Underlying his work one can get the sense that he is feverishly
CARL ORFF’S CARMINA BURANA 90
trying to moralize sinful behavior; trying to shed his guilty conscious. The final
consequence of this work was denouncement by the Church as heretic and “an injunction
against any further teaching” (Shapiro). Even so, his body of writing seems to have
inspired many of the scholars and writers who comprised the Goliards and appears to be a
connecting thread between many of the verses in the Carmina..
Shapiro’s book Medieval Philosophy concisely lays out Abelard’s teachings on ethics and
morality. Abelard proposes that sin is a natural consequence of the defect of the human
mind; that we are weak and that God expects our sinful behavior. In fact our sin is the main
conductor of grace into our lives. He then defines sin according to the intention of the
sinner. “We punish facts rather than faults.” (Shapiro, 1964) Abelard wants to draw a line
between the actions of a sin and the circumstances surrounding the action of the sin. To
him, a true mortal sin (a sin that is committed with full knowledge of the wrongness of the
action) is only present when the intentions of the act are based on ill will. God alone can
decipher the intentions behind our actions. There is “no sin save that against conscience”
(Shapiro). This philosophy is apparent in the shocking words of the Goliard manuscripts.
The writers could “guiltlessly” engage their minds in scenarios of moral turpitude. The
verses are able to speak so profoundly of the dark corners of the soul where lust and a
multitude of other sins dwell, and it is the helpless, nearly manic, spirit of Abelard himself
that is kept alive in the sense of helplessness that is written in between the lines of the
poetry.
Now we proceed to our discussion of the Archpoet. Helen Waddell eloquently writes about
the life and impact of the mysterious figure of the Archpoet in her book The Wandering
Scholars. No actual name is associated with the alias Archpoet, though he did inherit the
titles of Primas and Golias as well. The Archpoet is said to have contributed a substantial
body of work left behind by the Goliards; he is in fact considered the embodiment of the
entire movement. It was his influence that infused a particularly irreverent and scathing
brand of satire into their arsenal. He is believed to have been a poor wanderer who often
sold scraps of his own clothing or to compose a few verses for a patron or storeowner in
order to buy bread to eat. He is believed to have traveled through Europe, with the Plague
nipping at his heels (Waddell).

CARL ORFF’S CARMINA BURANA 91
His satire and irreverence added a new element to Abelard’s relativistic moral teachings.
The Archpoet, through his actions and words, encouraged dissent among the scholars. He
set the bar for irreverence and intellectual rebellion in the twelfth century. There was no
room for obedience to authority in the Archpoet’s worldview, and though he is believed to
have spent some of his life in a cloistered society of monks, he constantly attacked the
authority of the Church and European high society. He championed satire as a choice
weapon to combat the society and beliefs he didn’t support. Intellect was a weapon to him
and life was a means to receive pleasure (Waddell). Shades of the Archpoet can be found
in the many drinking songs and distorted liturgical texts found in the Carmina. While
Abelard believed in and feared God, the Archpoet revered the written word and scoffs at
the idea of an omnipotent power. While Abelard showed bitterness towards Church
leadership, he still has his roots in Catholic theology as a monk and teacher. In contrast the
Archpoet is completely irreverent and shows outright contempt for organized religion, and
this influence could be evidenced in the verses that directly parody ecclesiastical hymns.
His mysterious character is glamorized by those who study him now, but when one reads
his work, one can sense a quiet desperation oozing out of the phrases on the page.
ANALYSIS OF NAZISM AND SOCIALIST
NATIONALISM PHILOSOPHY
Since Carl Orff thrived under the Nazi regime, and is in fact suspected of being an outright
supporter, it is necessary to also consider some of the philosophy that permeated German
society during this period of time. Nazism (and Fascism for that matter) falls under the
umbrella of Socialism. Nazism was also largely formulated around cultural politics. In fact
Walter Benjamin wrote essays defining fascism during the days of its reign in Germany,
describing it as “the situation of politics [rendered] aesthetic.” (Bahr, 1995) Hitler’s
administration tended toward a socialistic form of nationalism to explain their tactics of
“cleansing” Germany from perceived cultural blemishes. They used Germany’s rich
history of visual, musical and literary art as a means to justify their lofty vision of German
nationalism. In order to shed a better light on the political philosophy of Nazism, we will
take a look at two points of view: that of historian Ehrhard Bahr and popular modern
philosopher and unapologetic Nazi sympathizer Martin Heidegger.
CARL ORFF’S CARMINA BURANA 92
First we will address the philosophy of Heidegger as discussed in Julian Young’s text
Heidegger Philosophy Nazism. Heidegger was once considered a master of modern
philosophy, but his support for the Nazi party has cast a skeptic shadow over all his work.
He found fame in his meditations of the concept of volk (or people). This concept simply
states that humanity is to be considered as one natural organism. This concept (taken quite
literally) was a fundamental part of the philosophy of Nazism and took on a Darwinian hue.
The organisms that were formed from a group of people were in constant competition, the
stronger obviously pushing others into decline. The Third Reich policies were built around
identifying and propelling the strongest “cells” into the forefront of society and eliminating
the undesired “weaker” cells in order to strengthen the organism as a whole. Once the
organism was at its peak strength it could begin to systematically absorb other frailer
organisms (namely other European nations). (Young, 1998)
The concept of volk is appealing on many levels: spiritual, cultural, economic, and political.
Heidegger claimed that since God’s grand creation is nature and He dictates natural order,
that the philosophy of volk is essentially driven by divine intervention. It is God’s will that
the powerful arise and the weak decline because that is how He created nature. (Young) In
this light it is easy to see the natural ethical implications of Nazi policy.
How that policy was implemented through political means is a necessary piece in this
discussion, a piece that is discussed with some depth by Ehrhard Bahr in a piece of his
writing found in the book National Socialist Cultural Policy. Bahr describes Nazi cultural
politics with two terms: intentionalism vs. functionalism. He opens his argument with a
supremely relevant quote from writer Peter Reichels: Hitler understood aestheticization in
real, though superficial, terms as ‘beautification of life’, as production of a pseudo-reality
which was supposed to influence the perception as well as the image of reality of millions
and concede to them visually and symbolically what was denied to them in reality (5).
Cultural policy was the vehicle that Hitler chose to achieve his ends of altering the reality
of German citizens. The Nazi regime formulated a series of biomedical principles to
legitimize their worldview, referring to these worldviews as “the German norm” (Bahr,
1995). “…Anything deviating from this norm was to be ‘removed’ like a cancer from the
fictitious body of a German people…” (Bahr).
CARL ORFF’S CARMINA BURANA 93
According to Bahr, the ideologies of intentionalism and functionalism are used by
historians to put the tragedy of Nazi control on culture and the eventual extermination of
many Jewish people and other unwanted sects of the German population into context.
Intentionalists claim that Nazi policy was applied to the overall ideology of the party after
1933. Hitler is seen as the main perpetrator in this view. His centrality and influence
directly lead to the phenomenon of “cultural cleansing” and the horrific events of the
Holocaust. This is the traditional view adopted by many historians and political scholars.
Functionalists see a different means to the same end. They see a logical progression from
the beginning of the Nazi party and the early implementations of their policy to the
destructive end. According to this view there are clearly racist and destructive overtones in
the beginning stages of the party that blossomed into discriminatory policies and eventually
to the notorious and brutal extermination of the concentration camps. This view looks at all
the agencies and departments of the Nazi party as equal culprits in the eventual genocide
and that these factors actually limited the role of a central member of the party. (Bahr)
This whole argument has drastic moral implications. Was the barbarism of the Nazi party
based on the psychosis of one man or (even more alarming) the direct goal of a group of
individuals working together to implement policies to usher in the death of millions of
innocent lives? A general observation based on both Bahr and Heidegger’s discussions is
that there is a direct and distinct difference between the National Socialist worldview and
that of the Goliards. Nationalist Socialism champions a singular leading body that upholds
what is perceived to be a social/cultural norm or preference. The Goliards were founded
around a spirit of resistance and relativism. They created their own set of ethical standards
and resisted the policy of governing bodies. Nationalist Socialism worked to solidify
individuals as a communal whole around a singular ideology (in the case of the Nazi party
through propaganda and cultural policy). The Goliards aimed at fragmentation based on
irreverence and intellectualism. Nationalist Socialism worked to limit creativity in art
whereas the Goliards used art as their primary vehicle for advancing their views.
Nationalist Socialism thrives on the ideas of the few and suffers when individuals search
for deep personal meaning in their teachings. Goliardic teachings are brash, dabbling in
relativism (individualistic meaning) that refuses to take in to consideration other points of
view.
CARL ORFF’S CARMINA BURANA 94
The apparent contradictions make these two philosophical bodies an unlikely pair of
influences, but when he decided to create his Carmina Burana, Orff placed himself directly
in between these two ideologies. This surely contributes to the controversy that shrouds the
piece and the man. We must now move to an analysis of the character of Carl Orff and the
actual text and music of the Carmina.
CARL ORFF AND NAZI GERMANY
Carl Orff is a perplexing character in music and cultural history. He is the cause of much
scholarly and ethical debate and his character is still scrutinized. Orff is considered a
genius by some and a pioneer in music, education, and theory. By others he is known as a
bigot, a Fascist anti-Semite whose continued popularity is a disgrace to Germany and
survivors of the Holocaust.
Orff’s place in musical history was cemented for revolutionizing the state of modern
music education (especially for elementary-aged students) by introducing new instruments,
teaching tools and strategies for instruction in music classrooms. He is often overlooked as
a composer, but his work setting the Carmina to music for chorus and orchestra has
reached legendary status (though many don’t realize it was Orff who composed it).Though
Orff is not now considered one of the most pivotal twentieth century composers now, he
was wildly popular in Germany and other areas of Western Europe in the 1930’s and 40’s,
and at the time his work was considered to be very important. Not much is known about
his personal life during this time, which raises some suspicion about Orff’s involvement in
the Nazi party. While Orff championed himself as a heroic dissenter of the Nazi regime
there is substantial evidence and personal accounts that suggest the opposite, including his
widespread popularity among Nazi administrators and subsequent professional success
during the Nazi reign (as well as Nazi party funding). He insisted that the Carmina was
composed in direct opposition to the Third Reich and that he aimed to resurrect the
rebellious nature of the Goliards by using their verses to undermine the oppressive
government, but the fact that the work even existed, and in fact flourished, during the Nazi
reign is damning evidence for the composer.
Barbara Russano Hanning describes the Nazi’s policy on music in her text, Concise
History of Western Music. “The Nazis’ requirements for music were mostly expressed in
CARL ORFF’S CARMINA BURANA 95
negatives: music must not be dissonant, atonal, twelve-tone, ‘chaotic’, intellectual, Jewish,
jazz-influenced, or left wing, which excluded all modernist and most modern music.”
(Hanning, 2006).Basically the Nazi party allowed music that exuded the “national German
pride”, masculine music, music that could become the soundtrack to a flourishing world
power, music that would evidence the superiority of the German race to the whole world,
colorful music that would mask the hideous actions taking place off the radio and behind
the scenes at the concert halls. Orff’s piece seems to do anything but this. He draws on
many Renaissance and modern techniques and dissonances. One could argue that the
majority of the piece is in fact very “chaotic”, but it did debut and receive substantial
funding and airplay on Nazi-run radio programs (Kater, 2000). Michael Kater even writes
that Hitler himself heard and liked the piece (2000). How did Orff dupe the entire Nazi
administration, or is there in fact an undercurrent of Fascism found throughout the piece?
In order to clarify this matter we must discuss the history of Orff’s relationship with the
Nazi party.
Writer and musical historian Michael H. Kater writes extensively about Carl Orff’s
affiliation with the Nazi party and how that relates to the Carmina Burana. Party officials
investigating the piece pre-debut were initially put off by the pseudo-late-Renaissance style
Orff preferred (as one of his primary influences was one of the Renaissance era’s chief
composers, the Italian Claudio Monteverdi), not to mention the nonconformist and
explicitly sexual themes woven into the lyrics. The Nazi’s bigoted view of sex and
negative feelings towards free thinking artists clashed with the Goliardic ideology
presented in the verses. Orff persisted through some serious scrutiny and subsequent
trepidation at the hands of the Third Reich Propaganda Committee and further scrutiny
from other high-seated officials. Not only were the lyrics called into question, but heavy
use of text in Latin and Medieval French did not support the Socialist Nationalism that the
party wanted to promote in German and Austrian art. Only a small portion of the songs are
in German. Orff used influence from some friends within the party to see the piece through
production and its premiere in Frankfurt in June 1937. The piece faltered at first due to
continued skepticism and some unfavorable reviews, but experienced widespread success
later that year (Kater).
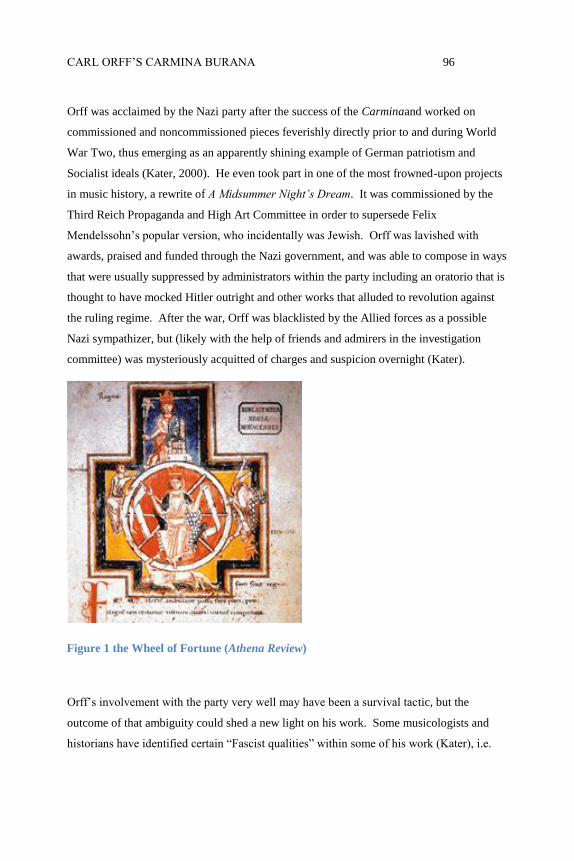
CARL ORFF’S CARMINA BURANA 96
Orff was acclaimed by the Nazi party after the success of the Carminaand worked on
commissioned and noncommissioned pieces feverishly directly prior to and during World
War Two, thus emerging as an apparently shining example of German patriotism and
Socialist ideals (Kater, 2000). He even took part in one of the most frowned-upon projects
in music history, a rewrite of A Midsummer Night’s Dream. It was commissioned by the
Third Reich Propaganda and High Art Committee in order to supersede Felix
Mendelssohn’s popular version, who incidentally was Jewish. Orff was lavished with
awards, praised and funded through the Nazi government, and was able to compose in ways
that were usually suppressed by administrators within the party including an oratorio that is
thought to have mocked Hitler outright and other works that alluded to revolution against
the ruling regime. After the war, Orff was blacklisted by the Allied forces as a possible
Nazi sympathizer, but (likely with the help of friends and admirers in the investigation
committee) was mysteriously acquitted of charges and suspicion overnight (Kater).
Orff’s involvement with the party very well may have been a survival tactic, but the
outcome of that ambiguity could shed a new light on his work. Some musicologists and
historians have identified certain “Fascist qualities” within some of his work (Kater), i.e.
Figure 1 the Wheel of Fortune (Athena Review)
CARL ORFF’S CARMINA BURANA 97
booming full-chorus movements throughout the Carmina (a common characteristic of
compositions found in the propaganda supporting socialist nationalism’s goal of a national
unity). Regardless, Orff labeled himself a threat to the Nazi party; a resistor because of his
belief in a European solidarity, which he states as the reason for the tutti (full-chorus)
passages and multiple languages (Kater). Orff also asserts an ominous concept throughout
the entire work: a person need not strive to take control of their own lives because some
greater force has a tighter hold on one’s fortunes. This concept is hard to interpret. This
idea coupled with the optimistic sections of the piece could indicate ignorant bliss, which is
a common characteristic of propaganda. This could also be reframed if it could be
determined that this statement was directed towards the party leaders. To decide if Orff’s
piece is conformist propaganda or was written to reflect the philosophy of the Goliardic
poets who acted as his librettists, one has to delve deeper into the rich content of the
Carmina.
ORFF’SCARMINA BURANA
Orff’s Carmina Burana has been categorized as a scenic cantata. “A cantata (literally
“sung”, derived from the Italian word “cantare”) is a vocal composition with an
instrumental accompaniment, typically in several movements, often involving a
choir.”(Kennedy, 2006).Orff conceived the idea for the work after stumbling upon an
illustration of the mystic “Wheel of Fortune” found on the Carmina manuscript, which is
pictured here. The stage performance enacted this entire epic plot for the audience. To Orff,
the action on stage was of equal importance with the music (hence the designation
‘scenic’cantata). The staging transcends ballet choreography. It brings character to the
sometimes disturbing sometimes alluring themes of Orff’s piece. The music, movements,
costumes and sets were all meticulously coordinated in order to present all of the themes
vividly and colorfully. His work with different artistic mediums within the piece also
accentuated his recurring theme of universality. (Being as most modern performances of
the piece don’t incorporate the staged portion the plot has for the most part been
disregarded).
The text Orff chose to use in the piece reflects medieval peoples’ fascination with pagan
spiritual figures. A chief character in his piece is the pagan goddess Fortuna, whom he
CARL ORFF’S CARMINA BURANA 98
refersto as the “Imperatrix Mundi.” Her image if found in depiction of the Wheel of
Fortune, sitting in the center, controlling its movement. She embodies this concept of
chance, which is favorable to man one minute and unfavorable the next. The widely-
recognized first movement describes this ominous figure, acting as the driving,
uncontrollable force in the lives of men. She spins the Wheeland carelessly chooses paths
for them with no allegiances or tendencies towards good or evil (Sebesta, 1996). The
movement is full of angst and desperation, the chorus feverously proclaims their fear of the
goddess and her precarious grasp on their lives. The whole work expresses a perceived
helplessness of the human race, and one could claim that it also alludes to unification
through it. The goddess Venus also makes an appearance towards the middle of the piece
as a counterpart to Fortuna. There is reason to believe that the spring time section contrasts
with the first movement in which Fortuna seems to be the ultimate influence in the lives of
men. This new section is playful and carefree, depicting a heart racing out of control.
Venus’s character seems softer, gentler, more alluring; the stuff of raw emotional impulse.
Her control is more persuasive but more subtle throughout the piece.
The Carmina is divided into four sections with a reprise of the first movement at the end of
the piece. All the movements personify different segments of the “Wheel”. Each section is
drastically different, seemingly unconnected, but with Orff’s orchestration and some of the
overarching themes that hover over the action of the text, the piece becomes an epic tale
that speaks of love, loss, jubilation and desperation. Judith Lynn Sebesta’s translation of
and notes based on the original text in her book Carmina Burana: Cantiones Profanane
contributed greatly to my summarization of the plot below.
The first section consists of the first two movements, which assert the authority of Fortuna
and cast a dark note on the rest of the piece. The text bemoans Fortuna’s fickle nature,
declaring “To Fortunes blows I bare my back” (Sebesta). The music, always ominous and
shaded with darkness, is fickle as well; one minute soft the next booming, in one section
block chords stamp as if depicting many feet marching and in a later section the strings and
brass break into frantic melismas (sections of many running notes). The second movement
references Fortuna’s assertion over history when it ends with the line “On her wheel’s axle
clearly;s seen the message: Hecuba [the wife of Priam, King of Troy] WAS queen.”
(Sebesta). Overall one is left quite unsettled after the first four minutes of the piece, feeling
CARL ORFF’S CARMINA BURANA 99
as hopeless as the melancholic poet who first scratched out this text and the composer who
must have agonized over the words as he scribbled out the notation to accompany them.
The second section, often referred to as the “Springtime Section”, contains a small but
famous body of German poetry found in the original manuscript entitled “Auf Dem
Anger”, translated “on the lawn” (Sebesta). The first minutes of the section are mystical,
with barren orchestration and a simple full-chorus voicing. The text is magical, describing
the movements of two more mythical figures, Flora (floral goddess) and Phoebus (the sun
god) as they “embrace” and bid farewell to the bitterness of winter and welcome in spring.
“Tipsy Spring with beaming smile lifts and toast while defeated Winter limps off-field”
(Sebesta). A similarly haunting baritone voice solo follows. The passage sounds like a set
of lips morphing from a stagnant frown to a sly grin. “So men’s hearts awaken to Love
reborn, As the baby archer [cupid] desires…My presence is not absent in your thoughts
(Whoever loves in such a way is like one broke upon the wheel.)” (Sebesta). Even as the
sweetness of spring begins to creep into the orchestration, one must never forget the threat
of Fortuna’s cruel cranking of the wheel.
But forget one seemingly does. The next movement shocks with its joyfulness as the
chorus explores the possibility of escaping from the jurisdiction of Fortune. Venus (the
goddess of love) makes an appearance in this part of the piece as well as Paris (a prince of
Troy). Paris was popular in the Goliard movement as his affair and marriage to Helen was
the ultimate tale of love to the poets. These movements are characterized by their carefree
melodies and singing string parts. The percussion and brass calm and the keys change from
dark forceful minors into light airy majors. The chorus doesn’t seem to be shouting in
desperation any longer but singing for joy instead. Happiness dominates the chords and
lyrics. The response to Venus’ beckons results in eight movements that personify the
beginning stages of love. There is a sense of innocence and naïveté as the chorus surveys
the beautiful scenery. Attention quickly turns from the environment to their companions.
The lyrics and accompaniment interact in a trifling manner towards the end of the “Auf
Dem Anger” section. The eighth movement is shown in its original manuscript on page ten
as an example of this uplifting section of the piece. You can see how Orff allows the parts
to interact independently rather than utilizing the driving block chords that characterize the
first two movements. “This Carmen [chapter or section] originally came from a Passion
CARL ORFF’S CARMINA BURANA 100
play and was sung by Mary Magdalene, generally identified as the harlot who begged
forgiveness from Jesus…” (Sebesta). Orff uses much softer dynamics and higher tessituras
to show flirtatiousness, as if all the anxiety of the first few movements has dissipated. How
dangerous the forgetfulness of a fickle people is.
This section reaches a climax, and Orff begins to subtly undermine Venus’s governance
with a shifting accompaniment, neither joyful nor sad in character. The ninth movement
acts as a pivot point. The orchestration slows down the fast pace of the previous
movements, but then the chorus enters and pushes the tempo once again to its original
feverish pace. The overall character remains uplifting, but there is a sense of loss of
control; the carefree nature of the music begins to dissipate; becoming a fog that is quickly
being pushed away by a portentous breeze before a storm breaks. The last two movements
exert the last shreds of carefree spring.
The eleventh movement launches the next section of the piece “In Taberna”. Fortuna
exposes her trick; the chorus has never been free of her wheel. She turns it mercilessly.
One can almost hear the cracking of spines of the wheel, the agonized moans of her
victims. Some of the most scandalous poetry is found in these movements, as well as some
of the most infamous movements of the entire work. The eleventh movement is considered
the Archpoet’s most famous poem (Sebesta). It rages and shrieks. “Consumed with rage I
yet compress my crescent anger; in discontent beyond redress I decline soul’s deliverance.”
(Sebesta)This section encompasses four movements which culminate in a booming climax
at the end of the fourteenth movement.
The next section comes as a relief from the agonized sighs of the soloists and chorus as the
orchestra’s smooth texture acts as the calming hand of Venus, brushing the ash off of the
shoulders of the tortured souls described in the previous segment. She holds them in a
comforting embrace throughout the fifteen lullaby-esque Carmen.
This section deals entirely with love, referring to the vast number of love songs included in
the original Carmina manuscript. It is also the most intimate section. Movements fifteen
through eighteen deal with the beginning stages of love, picking up where the “Auf Dem
Anger” left off. Soloists serenade the audience, playing the role of young lovers exploring
their feelings. The nineteenth movement pivots once again and love turns to lust. The
CARL ORFF’S CARMINA BURANA 101
lovers find themselves in a secluded space and consummate their relationship. The twenty-
first movement is a barren arrangement in which the soprano soloist fights an interior battle
between modesty and “Love’s subjection” declaring at the end of the movement “To that
sweet slavery I go” (Sebesta).(Thus implying that she has cast aside purity in favor of her
companions’ lustful desire.)
The orchestra erupts in a warped version of the theme from the spring time section. What
was once joyful is torturous. The beautiful flowers rot and thistles prick the skin of the
lovers. There is no relief anymore as the heavy chords become barren once more and the
soprano sings a stirring recitative (a musical device with barren accompaniment and
melodic lines designed to sound like speaking) declaring “My sweetest love, I give myself
to you” (Sebesta). The chorus enters once again with a hymn mocking the Ave Maria,
which is the Latin text of the often-prayed Catholic prayer “Hail, Mary”. However instead
of Mary, they hail Helen of Troy (wife of Paris) and Blanzifor (heroine in a popular
romance tale) (Sebesta), who are also two shining beacons of admiration for the Goliards.
They sing the praises of Venus, who they believe has rewarded them for their submission to
their impulse, but the orchestration becomes destructive once more as the smiling face of
Venus morphs into the hideous countenance of Fortuna. Orff chose to end the piece with a
reprise of the first movement, bringing the chorus full-circle (which may mean that they
have been twisted around a full turn of the wheel). The ending is bleak; leaving the listener
uncomfortable and disconcerted. This bareness sheds much light on Orff’s emotions
towards this piece, perhaps even towards life in general.
CONCLUSIONS
Now that we have the scraps for our “quilt” I will endeavor to pull some threads through
them in order to patch them together as a whole. We have seen the history of the Goliard
poets and scholars, as they are the original authors of the text. We have briefly examined
some moral/ethical philosophy and attitudes to come out of key members of that group.
We looked at some of the ideologies that Nazism was founded upon through the eyes of
scholars and modern German philosopher Martin Heidegger; we also examined Carl Orff
and his relationship with the Nazi party. Finally we delved into the plot and moral
overtones found in Orff’s musical arrangement of the Carmina Burana. I cannot make a
CARL ORFF’S CARMINA BURANA 102
conclusive statement about his intentions in writing the piece. As I mentioned before, art is
beautiful in that each person who takes it in has a different impression. I have found that
this piece is a fascinating study of the mind in an oppressed situation. The piece has so
many layers, and we are missing one of its important aspects if we disregard the philosophy
so beautifully woven into it. In light of this conclusion, I will now add a few comments in
an attempt to thread these scraps together.
Abelard’s influence actually sparked the intellection conflagration known as the Goliard
movement. His moral teachings are woven into the texture of the poems, so he cannot be
dismissed as an undercurrent anywhere that the text is found. Orff’s piece is no exception.
Abelard looked at the external factors working on humanity as a chief cause of sin. Orff’s
music speaks almost exclusively about the external factors on the human experience,
actually suggesting the non-existence of free will altogether. Orff gives no credit
whatsoever to the internal consciousness. His philosophy also aligns with Abelard in that
there is a focus on helplessness without any focus at all on the implications of the actions
the various characters.
Actually Orff’s treatment of the text doesn’t take in to account the moral situation of the
characters at all. One could argue that the dark resolution of the music could imply the
immoral nature of the actions spoken about in the text, though I believe the context refers
more clearly to the overall dominance of Fortuna as well as reflecting Orff’s own cynical
view on life. It seems that he is preoccupied, almost to the point of paranoia, with the depth
of negativity and the shallowness of positivity and optimism. This makes sense from the
vantage point of a citizen living in a suppressive socialist country.
Orff also agrees with Abelard on the prevalence of love, but contradicts Abelard’s views on
its value. Love appears throughout the piece; in fact there is an entire section dedicated to
it. It is so agreeable to the characters that it interrupts the drudgery of living under the rule
of a dictating presence like Fortuna’s. But Abelard’s beliefs in a deep, fulfilling love
contradicts Orff’s implications. Orff’s springtime section drips with honey-dipped new-
found love, but the section proves shallow, artificial, a mask for Fortuna to don when
playing her games. The final section claims that love is in fact a “slavery”, and in the end
the lovers seem to have received some kind of a spiritual lobotomy. The soprano’s final
solo depicts a character who submits to Fortuna’s crank of the wheel in order to feel just a
CARL ORFF’S CARMINA BURANA 103
bit of joy, even if it is only a delusion. Abelard defended love because he believed in its
depth, that it was worthwhile. Orff mocks it and uses it as a vehicle for pain in his piece.
The poetry of the Archpoet is most definitely present in the piece. Many of the verses
involving drinking and debauchery are more than likely influenced or directly written by
him. The middle section deals almost exclusively with these concepts. The Archpoet is
also credited with a substantial body of anger-soaked poetry, which is featured in the third
section. The rage is originally directed at medieval authority, whether it be Church
officials or aristocracy. Orff expresses that rage more than likely at chance’s dominance.
(After all this mood only appears once Fortuna enters back into the text after the Springtime
section.) The listener can hear the frustration of a man who feels he’s had all control taken
away from him in the tortured, desperate chords in the middle of the piece. I believe, based
on implications found in this piece that Orff identifies with the Archpoet more than any of
the other characters influencing his work.
As for the driving force behind Nazi morality, the volk concept, there is little evidence of
Orff’s support of this concept in his piece from my point of view. His piece as a whole
depicts humanity as a whole, not various organisms vying for power; in fact, the whole
human race is powerless. The whole system of existence is too random, too hectic in Orff’s
world to accommodate this concept. Hitler has no power to “cleanse” any organism; in fact
he is Fortuna’s pawn. In Orff’s world Fortuna is simply using Hitler to drag humanity on
its face at the bottom of the wheel.
But one could ask the question: is Fortuna possibly a symbol for the Nazi party, and if so is
it supporting it or opposing it? There is weight in that question. It is a question that is so
hefty that no certain conclusion can be drawn here, only inferences made. In terms of
intentionalism and functionalism, it is hard to apply either of these in a pure form to the
circumstance of humanity according to Carl Orff. Fortuna’s policy imposed on humanity is
not an intentional one because it is not planned. It is random. Fortuna is apathetic in the
truest meaning of the word. She has no set ends in mind; she spins her wheel for
amusement alone. Functionalism also loses its relevance because there is no logical
sequence of events here. Orff’s transitions between movements and sections don’t imply a
logical shift. Orff shows his compositional genius here. The movements musically make
sense. There is a general shift of mood that is unpredictable and interesting but the hectic,
CARL ORFF’S CARMINA BURANA 104
scattered undertones remain intact. The wheel is arbitrary and Orff’s music keeps this in
mind. It is truly a game of chance. There is no connection between cause and effect,
therefore functionalism is rendered ineffective.
So if Orff was using Fortuna as a symbol for the Third Reich, he would contradict
historians about the method of policy implementation. But that leaves the question of
Orff’s attitude towards the Nazi party. If Orff supports the party it is surely by presenting
the complete dominance of Fortuna. Why oppose the party? They have your fate in their
all-powerful hands. They control your love. They even have the ability to take the dawn of
spring time and make it dreary. Propaganda usually presents optimism, but Orff could have
been ingeniously using pessimism as a manipulative tool. Any medium of hopefulness you
may enlist towards resistance is a façade, so remain on the wheel and take any artificial
comfort you are apportioned if you want to thrive. This could be seen in Orff’s actions. He
may not have agreed with the party but threw his support at it and took what he could get
from it because he saw no light in the darkness. If he believed and supported the party
from the start this piece could be a candid threat. The fact that he used modern techniques
could just be Orff altering something that was considered anti-fascist and in fact making it
material for a Nazi anthem.
That is one stance an informed listener could take. Orff could also be using symbolism to
expose the evil of the party. Fortuna is viewed as something to be feared, but she has no
concept of organization. She is playing with others like toys. This could be a blanket
statement about Nazi policy. They are bending the lives of the German people for
enjoyment. They are hungry with power but have no idea how to use it. Fortuna could
even represent Hitler and the wheel the party, as if to say that politics is the tool with which
Hitler is using as a torture device. Maybe through presenting love as an artificial thing Orff
is exposing Nazi propaganda as a fake consolation. Don’t take their offerings. They are
not made out of love. In the end one cannot prosper under this administration.
It is intriguing study to analyze this material in light of some of the findings presented in
this discussion, but a definite conclusion cannot be drawn here, thus the metaphor of the
patchwork quilt. Such is the beauty of art. Ultimately we can conclude that Orff presents a
bleak view in his piece, which undoubtedly reflected his environment. Only Orff can
honestly answer the question of whether his masterpiece supported or resisted the Nazi

CARL ORFF’S CARMINA BURANA 105
party, and since his actions and words are so non-committal, there is no clearly recorded
answer to this question. In the end this piece is a master work that spans many fields. Not
only is it creatively effective, but its moral and philosophical implications leave the listener
puzzling, which makes Orff’s Carmina Burana a modern triumph that is destined to stand
the test of time by entertaining and posing the same questions discussed throughout this
dialogue.

CARL ORFF’S CARMINA BURANA 106
Figure 2 Excerpt from the original mo. 8 manuscript "Charmer gip die vurme mir"
(Orff, 1996)
CARL ORFF’S CARMINA BURANA 107
REFERENCES
Arthur Rubinstein Philharmonic Orchestra, A. Margarethe, A. Dahl, B.,Grek, J. W.
Stupel, I& Arthur Rubinstein Philharmonic Choir (Performers).(2005) Carmina burana.
[Audio Recording] X5 Music Group.
Bahr, E. (1995) Nazi cultural politics: intentionalism vs. functionalism. In Cuomo, G.
(Ed.), National socialist cultural policy (pp. 5-18). New York: Glen R. Cuomo
Carl Orff. In (2011).EBSCOhost megaFILE. Retrieved from
http://http://web.ebscohost.com/ehost/detail?vid=7&hid=17&sid=f07e451e-f975-
4f22b3958d092faf52dc@sessionmgr104&bdata=JnNpdGU9ZWhvc3QtbGl2ZQ==.
Carmina burana. Athena Review, 4(2), 71-73. Retrieved from
http://www.athenapub.com/14carmina.htm.
Classen, A. (2009). The carmina burana: A mirror of latin and vernacular literary traditions
froma cultural-historical perspective. ProQuest5000 , Retrieved from
http://search.proquest.com.excelsior.sdstate.edu/pqrl/docview/603821942/132374F3D
DCA0D20B/2?accountid=28594.
Fassone, A. (2001). “Carl orff”. In The new grove dictionary of music and
musicians London: Macmillan.
Gordiardic songs.In (2010) Retrieved from
http://web.ebscohost.com/ehost/detail?sid=f07e451e-f975-4f22-b395-
8d092faf52dc%40sessionmgr104&vid=5&hid=127&bdata=JnNpdGU9ZWhvc3QtbGl
2ZQ%3d%3d#db=keh&AN=39009174.
Hanning, B.R. (2006). Concise history of western music 3rded. New York: W.W Norton
and Co.
Kater, M.H. (2000). Composers of the Nazi era: Eight portraits New York: Oxford UP.
Kennedy, M. (2006). "Cantata", The Oxford dictionary of music, second edition, revised
New York: Oxford UP.
CARL ORFF’S CARMINA BURANA 108
Orff, C. (Composer). (1997). Excerpt from carmina burana. [Web Graphic]. Retrieved
from http://www.omifacsimiles.com/brochures/orff_carm.html.
Sebesta, J.L. (1996). Carmina burana: Cantiones profanae Wauconda: Bolchazy-
Carducci.
Shapiro, H. (1964) Medieval philosophy New York: The Modern Library.
Stevens, D. (1961). A history of song New York: W.W. Norton.
Waddell, H. (1934). The wandering scholars London: Constable.
Walsh, P.G. (1993) Love lyrics from the carmina burana Chapel Hill: University of North
Carolina.
Young, J. (1998) Heidegger philosophy Nazism New York: Cambridge University Press
TRANSLATION OF VIBRATION 109
Translation of Vibration From a Vibrational
Plate to the Human Body
Author: Lars Mattison
Faculty Sponsors: Dr. Shawn Duan, Dr. Teresa Binkley
Departments: Mechanical Engineering, Ethel Austin Martin
Program in Human Nutrition
Abstract
This study was done to validate the results of our previous study [1] as well as analyze how
the Soloflex Whole Body Vibration Platform translates vibration to the human body. The
purpose of causing vibration within the human body is to increase bone density, possibly by
activating osteoblasts within the bone. When the body is subjected to stress, it adapts as
quickly as possible to counteract this stress. There is evidence that vibration caused by low
magnitude mechanical signals (LMMS) increases bone in children with disabling
conditions [2] and young women (15-20 years) with low bone mineral density [3]. Our
results show that Soloflex dial settings of 0.8g or greater produce frequencies as expected
by the manufacturer. Lower dial settings produce frequencies that are higher than expected
values. The results obtained showed that vibration at the foot had no linear association
with increased acceleration (R = 0.56, p = 0.20), but vibration frequencies increased with
increased acceleration at the hip (R = 0.86. p = 0.01). The mean frequencies measured over
the range of accelerations (0.3-1.1g) were not different between the foot and the hip (56 ± 5
vs. 52 ± 12 Hz, p = 0.45; mean ± SD; respectively). Mean frequencies measured at the four
different locations on the plate over the range of accelerations (0.3 – 1.1g) were not
different when tested by Tukey’s HSD test.
INTRODUCTION
The goal of this project is to help provide evidence of the performance of a LMMS
vibrational plate for future studies that may increase the bone density of children. The
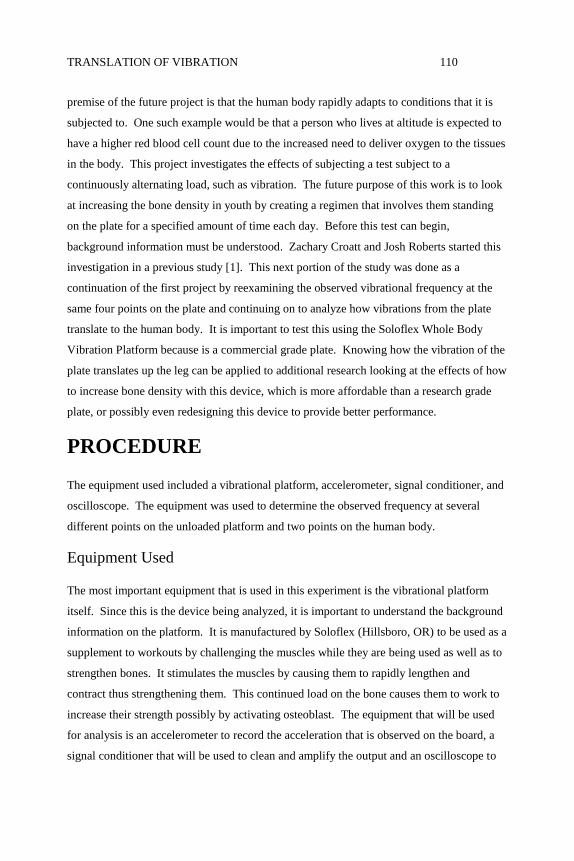
TRANSLATION OF VIBRATION 110
premise of the future project is that the human body rapidly adapts to conditions that it is
subjected to. One such example would be that a person who lives at altitude is expected to
have a higher red blood cell count due to the increased need to deliver oxygen to the tissues
in the body. This project investigates the effects of subjecting a test subject to a
continuously alternating load, such as vibration. The future purpose of this work is to look
at increasing the bone density in youth by creating a regimen that involves them standing
on the plate for a specified amount of time each day. Before this test can begin,
background information must be understood. Zachary Croatt and Josh Roberts started this
investigation in a previous study [1]. This next portion of the study was done as a
continuation of the first project by reexamining the observed vibrational frequency at the
same four points on the plate and continuing on to analyze how vibrations from the plate
translate to the human body. It is important to test this using the Soloflex Whole Body
Vibration Platform because is a commercial grade plate. Knowing how the vibration of the
plate translates up the leg can be applied to additional research looking at the effects of how
to increase bone density with this device, which is more affordable than a research grade
plate, or possibly even redesigning this device to provide better performance.
PROCEDURE
The equipment used included a vibrational platform, accelerometer, signal conditioner, and
oscilloscope. The equipment was used to determine the observed frequency at several
different points on the unloaded platform and two points on the human body.
Equipment Used
The most important equipment that is used in this experiment is the vibrational platform
itself. Since this is the device being analyzed, it is important to understand the background
information on the platform. It is manufactured by Soloflex (Hillsboro, OR) to be used as a
supplement to workouts by challenging the muscles while they are being used as well as to
strengthen bones. It stimulates the muscles by causing them to rapidly lengthen and
contract thus strengthening them. This continued load on the bone causes them to work to
increase their strength possibly by activating osteoblast. The equipment that will be used
for analysis is an accelerometer to record the acceleration that is observed on the board, a
signal conditioner that will be used to clean and amplify the output and an oscilloscope to

TRANSLATION OF VIBRATION 111
visualize the output created by the accelerometer. A complete list of information about the
equipment used can be seen in Table 1 with a picture of the materials seen in Figures 1 and
2.
Table 1: Equipment Used for Project
Equipment Type Brand Model # Serial #
Soloflex Whole Body Vibrational Platform Soloflex n/a n/a
Signal Conditioner Endevco 133 CB71
Four Channel Digital Storage Oscilloscope Tektronics TDS 2024B C03312
Acceleration Control
Signal Conditioner
Oscilloscope
Figure 1: Oscilloscope, Signal Conditioner, and Control Used in Experiment
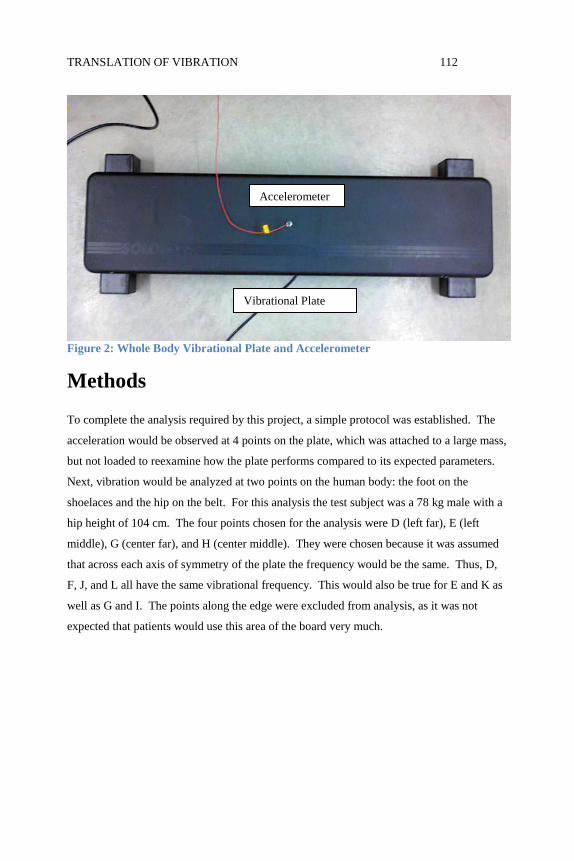
TRANSLATION OF VIBRATION 112
Figure 2: Whole Body Vibrational Plate and Accelerometer
Methods
To complete the analysis required by this project, a simple protocol was established. The
acceleration would be observed at 4 points on the plate, which was attached to a large mass,
but not loaded to reexamine how the plate performs compared to its expected parameters.
Next, vibration would be analyzed at two points on the human body: the foot on the
shoelaces and the hip on the belt. For this analysis the test subject was a 78 kg male with a
hip height of 104 cm. The four points chosen for the analysis were D (left far), E (left
middle), G (center far), and H (center middle). They were chosen because it was assumed
that across each axis of symmetry of the plate the frequency would be the same. Thus, D,
F, J, and L all have the same vibrational frequency. This would also be true for E and K as
well as G and I. The points along the edge were excluded from analysis, as it was not
expected that patients would use this area of the board very much.
Vibrational Plate
Accelerometer
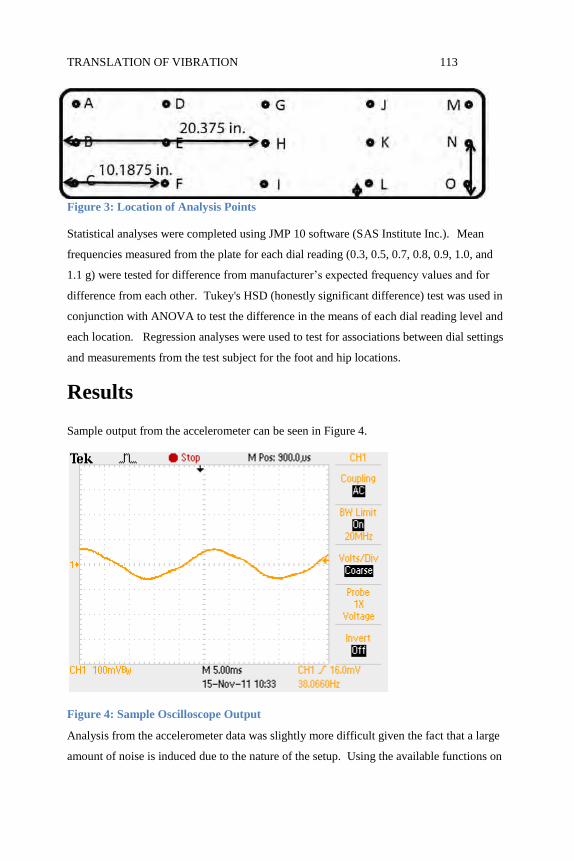
TRANSLATION OF VIBRATION 113
Figure 3: Location of Analysis Points
Statistical analyses were completed using JMP 10 software (SAS Institute Inc.). Mean
frequencies measured from the plate for each dial reading (0.3, 0.5, 0.7, 0.8, 0.9, 1.0, and
1.1 g) were tested for difference from manufacturer’s expected frequency values and for
difference from each other. Tukey's HSD (honestly significant difference) test was used in
conjunction with ANOVA to test the difference in the means of each dial reading level and
each location. Regression analyses were used to test for associations between dial settings
and measurements from the test subject for the foot and hip locations.
Results
Sample output from the accelerometer can be seen in Figure 4.
Figure 4: Sample Oscilloscope Output
Analysis from the accelerometer data was slightly more difficult given the fact that a large
amount of noise is induced due to the nature of the setup. Using the available functions on
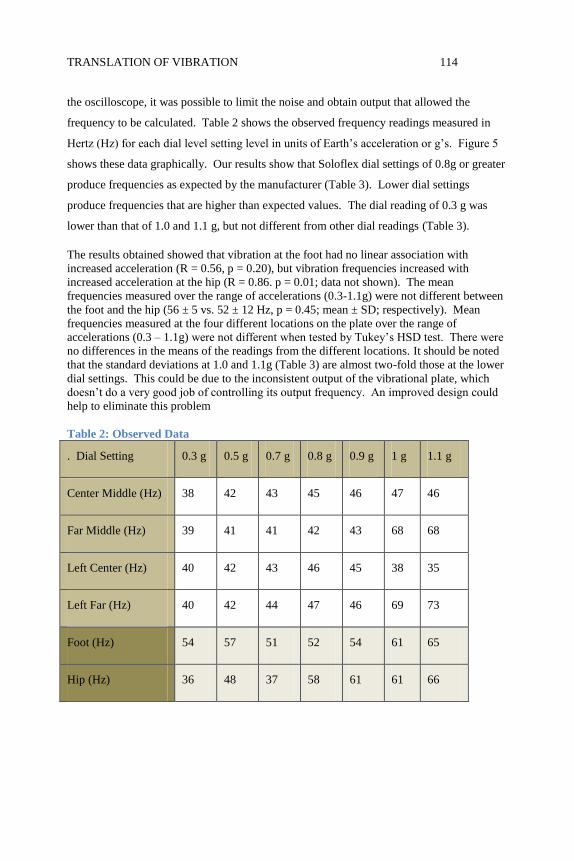
TRANSLATION OF VIBRATION 114
the oscilloscope, it was possible to limit the noise and obtain output that allowed the
frequency to be calculated. Table 2 shows the observed frequency readings measured in
Hertz (Hz) for each dial level setting level in units of Earth’s acceleration or g’s. Figure 5
shows these data graphically. Our results show that Soloflex dial settings of 0.8g or greater
produce frequencies as expected by the manufacturer (Table 3). Lower dial settings
produce frequencies that are higher than expected values. The dial reading of 0.3 g was
lower than that of 1.0 and 1.1 g, but not different from other dial readings (Table 3).
The results obtained showed that vibration at the foot had no linear association with
increased acceleration (R = 0.56, p = 0.20), but vibration frequencies increased with
increased acceleration at the hip (R = 0.86. p = 0.01; data not shown). The mean
frequencies measured over the range of accelerations (0.3-1.1g) were not different between
the foot and the hip (56 ± 5 vs. 52 ± 12 Hz, p = 0.45; mean ± SD; respectively). Mean
frequencies measured at the four different locations on the plate over the range of
accelerations (0.3 – 1.1g) were not different when tested by Tukey’s HSD test. There were
no differences in the means of the readings from the different locations. It should be noted
that the standard deviations at 1.0 and 1.1g (Table 3) are almost two-fold those at the lower
dial settings. This could be due to the inconsistent output of the vibrational plate, which
doesn’t do a very good job of controlling its output frequency. An improved design could
help to eliminate this problem
Table 2: Observed Data
. Dial Setting 0.3 g 0.5 g 0.7 g 0.8 g 0.9 g 1 g 1.1 g
Center Middle (Hz) 38 42 43 45 46 47 46
Far Middle (Hz) 39 41 41 42 43 68 68
Left Center (Hz) 40 42 43 46 45 38 35
Left Far (Hz) 40 42 44 47 46 69 73
Foot (Hz) 54 57 51 52 54 61 65
Hip (Hz) 36 48 37 58 61 61 66
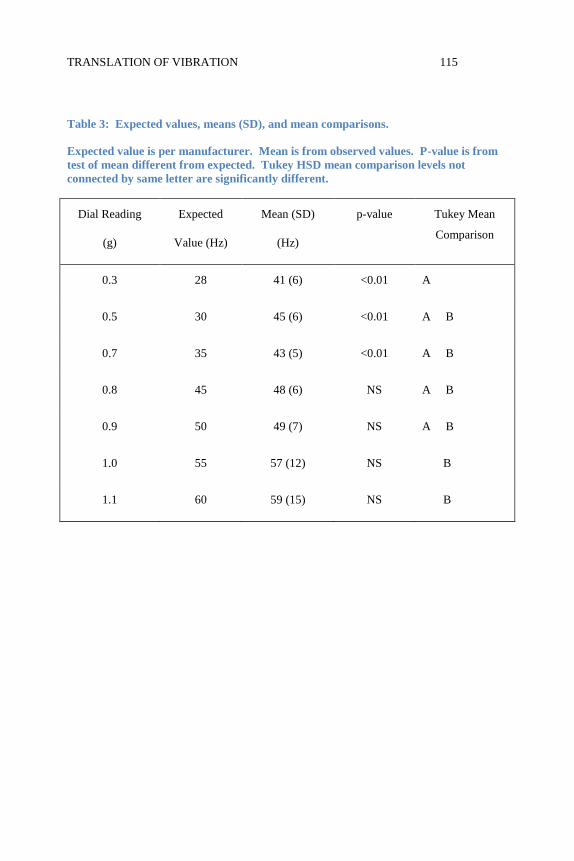
TRANSLATION OF VIBRATION 115
Table 3: Expected values, means (SD), and mean comparisons.
Expected value is per manufacturer. Mean is from observed values. P-value is from
test of mean different from expected. Tukey HSD mean comparison levels not
connected by same letter are significantly different.
Dial Reading
(g)
Expected
Value (Hz)
Mean (SD)
(Hz)
p-value Tukey Mean
Comparison
0.3 28 41 (6) <0.01 A
0.5 30 45 (6) <0.01 A B
0.7 35 43 (5) <0.01 A B
0.8 45 48 (6) NS A B
0.9 50 49 (7) NS A B
1.0 55 57 (12) NS B
1.1 60 59 (15) NS B
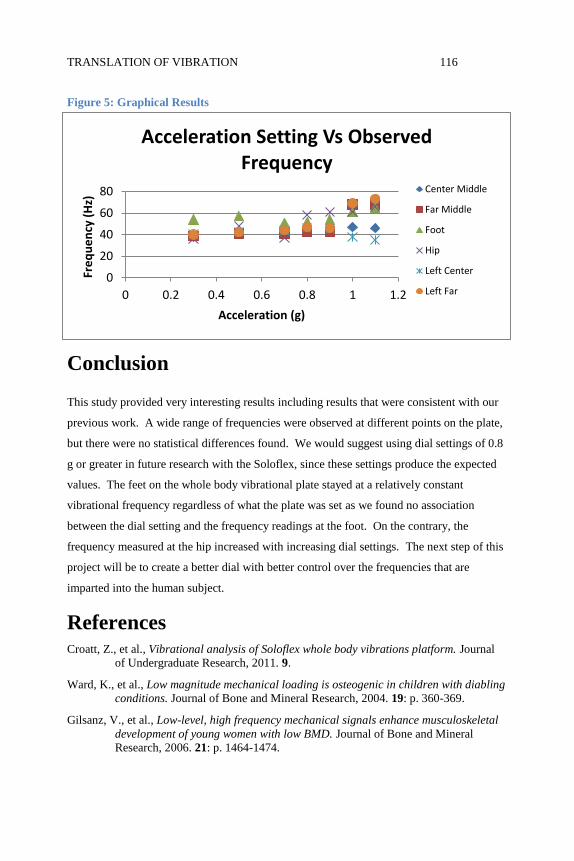
TRANSLATION OF VIBRATION 116
Figure 5: Graphical Results
Conclusion
This study provided very interesting results including results that were consistent with our
previous work. A wide range of frequencies were observed at different points on the plate,
but there were no statistical differences found. We would suggest using dial settings of 0.8
g or greater in future research with the Soloflex, since these settings produce the expected
values. The feet on the whole body vibrational plate stayed at a relatively constant
vibrational frequency regardless of what the plate was set as we found no association
between the dial setting and the frequency readings at the foot. On the contrary, the
frequency measured at the hip increased with increasing dial settings. The next step of this
project will be to create a better dial with better control over the frequencies that are
imparted into the human subject.
References Croatt, Z., et al., Vibrational analysis of Soloflex whole body vibrations platform. Journal
of Undergraduate Research, 2011. 9.
Ward, K., et al., Low magnitude mechanical loading is osteogenic in children with diabling
conditions. Journal of Bone and Mineral Research, 2004. 19: p. 360-369.
Gilsanz, V., et al., Low-level, high frequency mechanical signals enhance musculoskeletal
development of young women with low BMD. Journal of Bone and Mineral
Research, 2006. 21: p. 1464-1474.
0
20
40
60
80
0 0.2 0.4 0.6 0.8 1 1.2
Fre
qu
en
cy (
Hz)
Acceleration (g)
Acceleration Setting Vs Observed Frequency
Center Middle
Far Middle
Foot
Hip
Left Center
Left Far
HYDRAULIC TEST BENCH CIRCUIT 117
Hydraulic Test Bench Circuit Construction,
Testing, and Analysis
Authors: Shane Michelson, Mitch Mueller, Brett Schurman
Faculty Advisor: Dr. Shawn Duan
Department: Mechanical Engineering
ABSTRACT
Hydraulic power control systems are a common and important part of mechanical and
agricultural systems. In hydraulic power system design, power, pressure, flow rates, and
mechanism of circuitry are all important factors when analyzing any hydraulic system.
Pumps, electric motors, reservoirs, working fluid properties, hydraulic circuitry, and a large
variety of valves make up a functional hydraulic system. Applications for hydraulic
systems vary widely from automotive, agricultural, mechanical etc. It is the engineers’ job
to design a hydraulic system that will be functional, efficient, and safe.
INTRODUCTION
This SDSU undergraduate research project consisted of circuit analysis using a Hydraulic
Test Bench which contained a pump and variety of valves. By using different circuits and
pressure gauges our research group was able to analyze the effects of pressure reducing
valves, directional control valves, load testing, hydraulic motors, and sequence valves.
This research was done to test the hydraulic bench capabilities and model a potential
hydraulics laboratory class for mechanical engineering undergraduates at SDSU. In order
to analyze the capabilities of the hydraulic test bench, it was necessary to research
hydraulic circuit diagrams and construct a circuit for each valve to be tested. Once the
hydraulic circuits were constructed the system was run at two different system pressures of
200psia and 400psia. Various qualitative behavioral data and quantitative data of each
circuit were recorded. Continued research will implement servomechanism controls to the
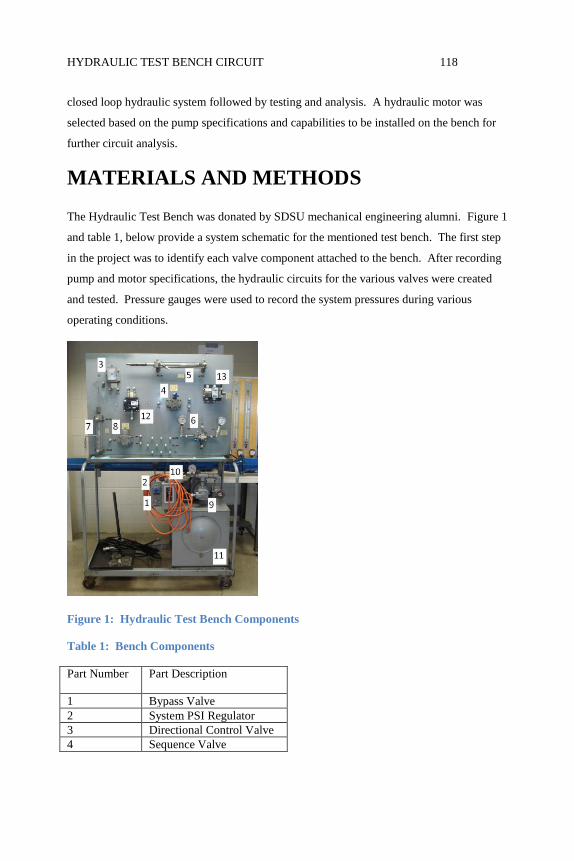
HYDRAULIC TEST BENCH CIRCUIT 118
closed loop hydraulic system followed by testing and analysis. A hydraulic motor was
selected based on the pump specifications and capabilities to be installed on the bench for
further circuit analysis.
MATERIALS AND METHODS
The Hydraulic Test Bench was donated by SDSU mechanical engineering alumni. Figure 1
and table 1, below provide a system schematic for the mentioned test bench. The first step
in the project was to identify each valve component attached to the bench. After recording
pump and motor specifications, the hydraulic circuits for the various valves were created
and tested. Pressure gauges were used to record the system pressures during various
operating conditions.
Figure 1: Hydraulic Test Bench Components
Table 1: Bench Components
Part Number Part Description
1 Bypass Valve
2 System PSI Regulator
3 Directional Control Valve
4 Sequence Valve

HYDRAULIC TEST BENCH CIRCUIT 119
5 Horizontal Cylinder
6 Directional Control Valve
7 Vertical Cylinder
8 Pressure-Reducing Valve
9 Pump
10 Electrical Motor
11 Reservoir
12 Flow Rate Control Valve
13 Hydraulic Motor
Hose 3 40
Hose 6 52
Hose 1 76
RESULTS
Directional Control Circuit
The Directional Control Circuit Part 6 as shown in Figure 2, implemented the use of a
directional control valve. This circuit also included the horizontal extendable cylinder.
The directional control valve contains two ports in which the hydraulic fluid is outputted.
When the fluid was directed to port A the cylinder extended and when directed to Port B,
the cylinder retracted. The running pressures were then recorded for both ports A and B,
along with the final static state pressures. The process was performed at a system pressure
of 200 and 400 psi. The data collected can be seen below in Table 2.

HYDRAULIC TEST BENCH CIRCUIT 120
Figure 2: Directional Control Circuit Diagram
Table 2: Directional Control Circuit
Pressures
Cylinder Position Pump Input System Port A Port B
Static Retracted neg 0.19 Bar 200 PSI 20 PSI 205 PSI
Extending neg 0.19 Bar 110 PSI 75 PSI 30 PSI
Static Fully Extended neg 0.19 Bar 200 PSI 200 PSI 20 PSI
Static Retracted neg 0.19 Bar 400 PSI 20 PSI 405 PSI
Extending neg 0.19 Bar 175 PSI 90 PSI 30 PSI
Static Fully Extended neg 0.19 Bar 400 PSI 400 PSI 20 PSI
Pressure Control Circuit
The Pressure Control Circuit was implemented using pressure-reducing valve 8 which was
outputted to the directional control valve then to the horizontal cylinder. The pressure
reducing valve lowered the pressure input to the directional control valve and operational
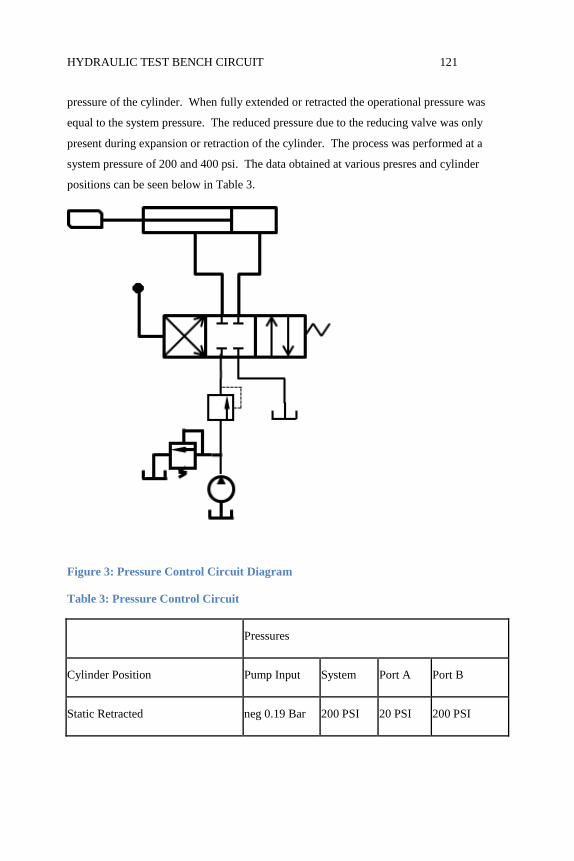
HYDRAULIC TEST BENCH CIRCUIT 121
pressure of the cylinder. When fully extended or retracted the operational pressure was
equal to the system pressure. The reduced pressure due to the reducing valve was only
present during expansion or retraction of the cylinder. The process was performed at a
system pressure of 200 and 400 psi. The data obtained at various presres and cylinder
positions can be seen below in Table 3.
Figure 3: Pressure Control Circuit Diagram
Table 3: Pressure Control Circuit
Pressures
Cylinder Position Pump Input System Port A Port B
Static Retracted neg 0.19 Bar 200 PSI 20 PSI 200 PSI
HYDRAULIC TEST BENCH CIRCUIT 122
Extending neg 0.19 Bar 140 PSI 55 PSI 20 PSI
Static Fully Extended neg 0.19 Bar 200 PSI 200 PSI 20 PSI
Static Retracted neg 0.19 Bar 400 PSI 20 PSI 400 PSI
Extending neg 0.19 Bar 190 PSI 75 PSI 30 PSI
Static Fully Extended neg 0.19 Bar 400 PSI 400 PSI 20 PSI
Load Testing Circuit
Using the Directional Control Valve and the extendable vertical cylinder 7, it was possible
to study the effects of loading on the system. A five pound mount to hold incremental
weights was fabricated and placed onto the vertical cylinder. Taking into account the
mount, 55 and 105 pound loads were raised and lowered at a system pressure of 200psi.
Using the pressure gauges, the operational pressures were recorded illustrating the effects
of the loading on the system. As expected by increasing the loading, the pressure required
to extend the cylinder increased and the pressure required to lower the cylinder decreased.
The operational pressure increased from 110psia to 140psi when loading the cylinder with
105lbs. The decrease in the required retracting pressure is due to the force of the loading
acting in the direction cylinder movement. The recorded pressure with respective loadings
can be seen below in Table 4.
Table 4: Load Testing Data
Vertical Cylinder Load Testing
Weight Raising pressure Lowering pressure
105 lbs 140 PSI 110 PSI
weight holder 5 lbs
weights 2 x 50 lbs

HYDRAULIC TEST BENCH CIRCUIT 123
Flow Rate Control Circuit
The circuit shown in figure 5 implemented a flow rate control circuit using flow rate
control valve 12. Using a flow meter following the valve it is possible to measure the flow
rate of the fluid. If a flow meter is unavailable it is also possible to measure flow rate by
timing the extension and retraction of a hydraulic cylinder following the flow control valve,
by taking the velocity of the fluid and the area of the cylinder. An example of this
calculation can be found in the Fluid Mechanic Analysis section. The results of the flow
control valve circuit are presented in table 4.
Figure 4: Flow Control Circuit
Table 5: Flow Rate Control Valve Data
Fully Open Flow Control Valve
System Pressure (psi) 300 400
Metered Flow Rate ( ) 5.56 5.56
Half Open Flow Control Valve
System Pressure (psi) 300 400
Metered Flow Rate ( ) 4.23 4.28

HYDRAULIC TEST BENCH CIRCUIT 124
Hydraulic Motor
Using the flow rates and systems pressures from the previous circuit test, a hydraulic motor
was tested for functionality. Due to a low powered pump and flow rates, the rotational
output of the motor is low. It was concluded the rotating output shaft of the motor could
easily be used as another flow meter device. The circuit diagram is show below followed
by the data collected. As expected with higher system pressure, higher rotational speeds
are achieved by the output shaft. As pressure is increased more force acts on the impeller
of the hydraulic motor causing increased output speeds if under no load.
Figure 5: Hydraulic Motor Circuit
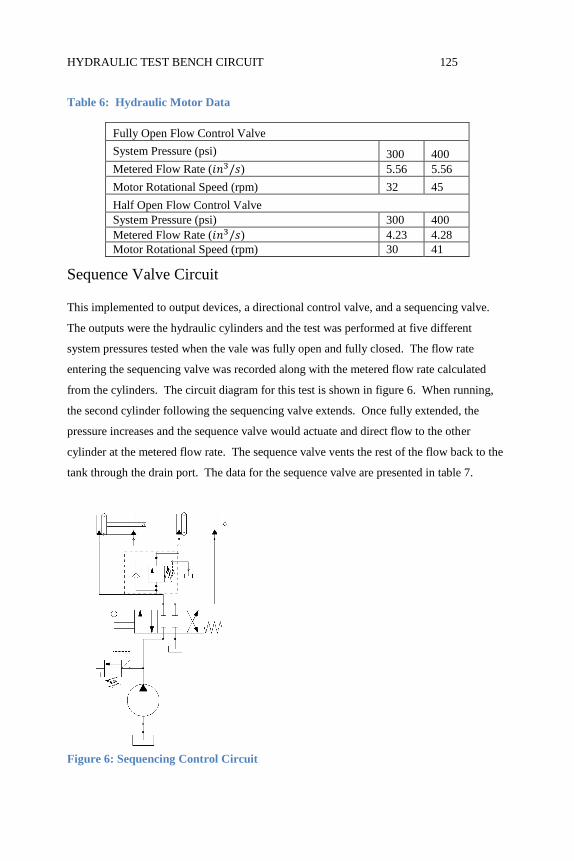
HYDRAULIC TEST BENCH CIRCUIT 125
Table 6: Hydraulic Motor Data
Fully Open Flow Control Valve
System Pressure (psi) 300 400
Metered Flow Rate ( ) 5.56 5.56
Motor Rotational Speed (rpm) 32 45
Half Open Flow Control Valve
System Pressure (psi) 300 400
Metered Flow Rate ( ) 4.23 4.28
Motor Rotational Speed (rpm) 30 41
Sequence Valve Circuit
This implemented to output devices, a directional control valve, and a sequencing valve.
The outputs were the hydraulic cylinders and the test was performed at five different
system pressures tested when the vale was fully open and fully closed. The flow rate
entering the sequencing valve was recorded along with the metered flow rate calculated
from the cylinders. The circuit diagram for this test is shown in figure 6. When running,
the second cylinder following the sequencing valve extends. Once fully extended, the
pressure increases and the sequence valve would actuate and direct flow to the other
cylinder at the metered flow rate. The sequence valve vents the rest of the flow back to the
tank through the drain port. The data for the sequence valve are presented in table 7.
Figure 6: Sequencing Control Circuit

HYDRAULIC TEST BENCH CIRCUIT 126
Table 7: Sequencing Valve Control Circuit Data
Fully Open Valve
System Pressure (psi) 100 200 300 400 500
Flow Rate Entering Valve ( ) 3.44 5.06 5.17 5.32 5.68
Metered Flow Rate ( ) 1.42 2.82 3.8 4.08 4.5
Fully Closed Valve
System Pressure (psi) 100 200 300 400 500
Flow Rate Entering Valve ( ) 3.37 5.21 5.58 5.62 5.65
Metered Flow Rate ( ) 2.05 3.42 4.77 5.48 5.54
Fluid Mechanic Analysis
The flow rate Q of the hydraulic fluid was calculated by measuring the time taken for the
horizontal cylinder to expand and retract. Using this time, travel distance and the
geometric sizes of the cylinder, the flow rate equation was obtained:
(1)
Where V is speed of the cylinder and A is effective area of the cylinder piston. At 200 psia
system pressure: Q= . At 400 psia system pressure: Q= . As expected,
running the directional control valve circuit at higher system pressure resulted in higher
flow rates.
Force F was calculated by the following equation:
(2)
where p is equal to the operating pressure of supply port and A is same as in equation (1).
CONCLUSION
By constructing and testing circuits that implemented the use of each valve and cylinders
on the hydraulic test bench, it was concluded that the bench is 100 percent functional.
Following the procedures used in analyzing the hydraulic circuits completed in this
research would provide a valuable hydraulic lab course structure for the SDSU mechanical
HYDRAULIC TEST BENCH CIRCUIT 127
engineering students. The bench proves to be a useful tool in illustrating the functionality
of sequence, pressure reducing, and directional control valves. The effects of different
system pressures and resulting operational pressures were recorded successfully for the
various circuits. By analyzing the fluid mechanics provided by the hydraulic pump
students can apply hydraulic power and fluid analysis theoretically and validate
experimentally with the test bench. Our research group believes the implementation of
high accuracy flow meters to verify calculations would add significantly to the lab course.
A servo control system would also greatly enhance the research and lab capabilities of the
bench.
REFERENCES
White, Frank M. Fluid Mechanics. 7th ed. New York, NY: McGraw-Hill, 2009. Print.
Zhang, Qin. Basics of Hydraulic Systems. Boca Raton: CRC, 2009. Print.
SHOOT MORPHOLOGY OF ELEVEN 128
Shoot Morphology of Eleven Alfalfa Populations
Author: Jessica A. Schmuck
Faculty Sponsor: Dr. Lan Xu
Department: Natural Resources Management
ABSTRACT
Alfalfa (Medicago sativa L.) is a major component of feed for dairy and beef cattle and one
of the most productive forage species in North America. Alfalfa has been planted on
millions of acres. More than 100 varieties have been developed in North America over the
past 100 years. However, historically, alfalfa persistence under grazing in semiarid
rangeland has generally been poor. Recently, it was discovered that naturally-selected
populations of predominantly yellow-flowered alfalfa have been proven to be adapted to
rangelands of western South Dakota and adjacent areas. A study was initiated in May 2006
to evaluate persistence and vigor of eleven alfalfa populations (conventional-hay type,
pasture type, pure falcata, and predominately falcata) by transplanting seedlings into native
and tame grasslands in South Dakota. The objective of this experiment was to investigate
shoot morphology of eleven alfalfa populations in tame grasslands. The experiment was a
randomized complete block design with three replications of five plants in 1.2 m long
single-row plots. For each population, aboveground biomass of all plants was harvested and
ten stems were randomly selected on July 25, 2008. For each stem, the morphological
characteristics measured included: a) length & basal diameter, b) number of nodes,
branches, pods, c) ratios of leaf to stem, branch to stem, reproductive to vegetative biomass.
The results showed that pure falcata cultivar Don had the shortest and thinnest stem, the
highest proportion of total stem weight in leaves and reproductive to vegetative biomass
ratio, but the lowest stem total biomass. Naturally-selected predominately falcata
population from Wind River Seed Co. had the longest, thickest, heaviest, most branched
and pods produced stem compared to the other populations.

SHOOT MORPHOLOGY OF ELEVEN 129
Keywords: Medicago sativa, M. falcata, yellow-flowered alfalfa, legume, shoot
morphology, persistence
INTRODUCTION
Alfalfa (Medicago sativa L.) is a major component of feed for dairy and beef cattle and one
of the most productive forage species in North America. Alfalfa is native to the Middle
East and Central Asia. It was introduced into the US in the early twentieth century. Alfalfa
has been planted on millions of acres and more than 100 varieties have been developed in
North America over the past 100 years (Rumbaugh, 1982). Historically, alfalfa persistence
under grazing in semiarid rangeland has generally been poor. Recently, it was discovered
that naturally-selected populations of predominantly yellow-flowered alfalfa have been
proven to be adapted to rangelands of western South Dakota and adjacent areas (Xu,
2008a). In 1982, alfalfa was reported to naturally reseed in Utah (Rumbaugh, 1982). In
1997, Norman G. Smith reported alfalfa had naturally reseeded on his ranch in western
South Dakota (Smith, 1997). Then, in 2000, it was found that alfalfa naturally reseeded on
the Grand River National Grassland near Smith ranch (Xu, 2008b).
Alfalfa, a legume, is an important economical forage crop for livestock because it is highly
productive and nutritious. Alfalfa is high in vitamins (e.g., carotene), magnesium,
minerals, fiber, and protein (Balliette, 1998). Interseeding alfalfa into the degraded
pastures has been shown to be an efficient approach to increasing forage production, forage
quality, and animal output in the Northern Great Plains (Smith 1997). Meanwhile,
naturally reseeded alfalfa demonstrates value for rehabilitating depleted rangelands, by
means such as increasing soil nitrogen, organic carbon, which resulted in improving forage
production (Mortenson, 2004).
By evaluating morphological characteristics one can select preferential traits for specific
environmental conditions and utilization purposes and provide useful information for
breeding programs. For example, forage quality of alfalfa is mainly influenced by leaf to
stem ratio, the higher leaf to stem ratio the better quality (Rotili, 2001). Similarly, seed
production highly depends on pods production, larger canopy and highly branched shoots,
and leaf to branch ratio will potentially increase forage production.
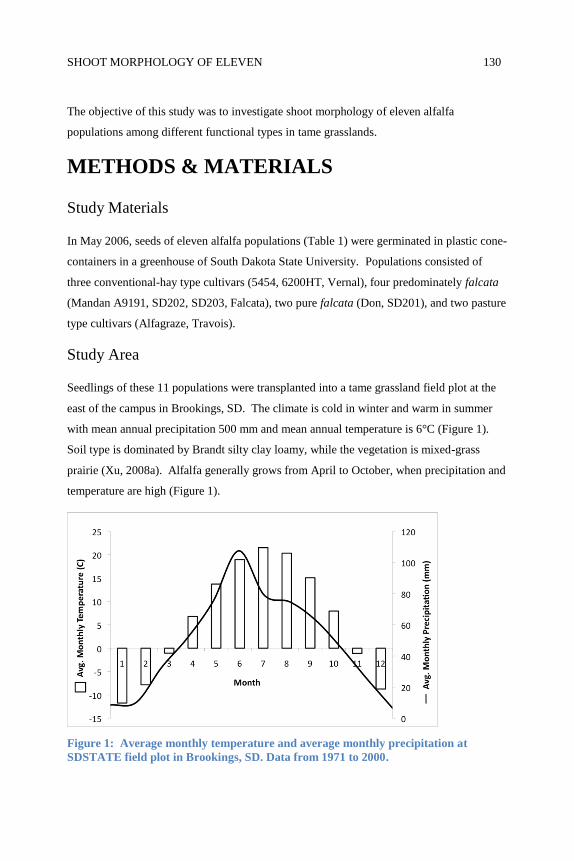
SHOOT MORPHOLOGY OF ELEVEN 130
The objective of this study was to investigate shoot morphology of eleven alfalfa
populations among different functional types in tame grasslands.
METHODS & MATERIALS
Study Materials
In May 2006, seeds of eleven alfalfa populations (Table 1) were germinated in plastic cone-
containers in a greenhouse of South Dakota State University. Populations consisted of
three conventional-hay type cultivars (5454, 6200HT, Vernal), four predominately falcata
(Mandan A9191, SD202, SD203, Falcata), two pure falcata (Don, SD201), and two pasture
type cultivars (Alfagraze, Travois).
Study Area
Seedlings of these 11 populations were transplanted into a tame grassland field plot at the
east of the campus in Brookings, SD. The climate is cold in winter and warm in summer
with mean annual precipitation 500 mm and mean annual temperature is 6°C (Figure 1).
Soil type is dominated by Brandt silty clay loamy, while the vegetation is mixed-grass
prairie (Xu, 2008a). Alfalfa generally grows from April to October, when precipitation and
temperature are high (Figure 1).
Figure 1: Average monthly temperature and average monthly precipitation at
SDSTATE field plot in Brookings, SD. Data from 1971 to 2000.
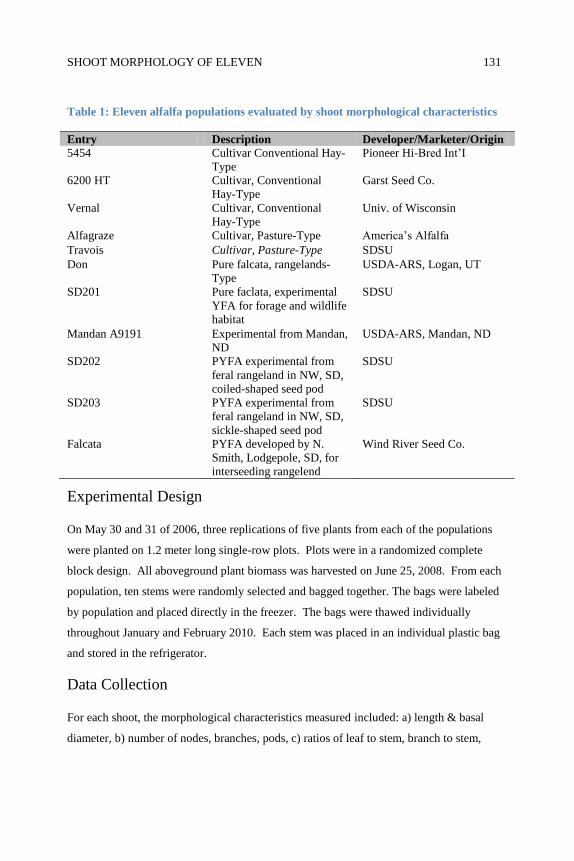
SHOOT MORPHOLOGY OF ELEVEN 131
Table 1: Eleven alfalfa populations evaluated by shoot morphological characteristics
Entry Description Developer/Marketer/Origin 5454 Cultivar Conventional Hay-
Type
Pioneer Hi-Bred Int’I
6200 HT Cultivar, Conventional
Hay-Type
Garst Seed Co.
Vernal Cultivar, Conventional
Hay-Type
Univ. of Wisconsin
Alfagraze Cultivar, Pasture-Type America’s Alfalfa
Travois Cultivar, Pasture-Type SDSU
Don Pure falcata, rangelands-
Type
USDA-ARS, Logan, UT
SD201 Pure faclata, experimental
YFA for forage and wildlife
habitat
SDSU
Mandan A9191 Experimental from Mandan,
ND
USDA-ARS, Mandan, ND
SD202 PYFA experimental from
feral rangeland in NW, SD,
coiled-shaped seed pod
SDSU
SD203 PYFA experimental from
feral rangeland in NW, SD,
sickle-shaped seed pod
SDSU
Falcata PYFA developed by N.
Smith, Lodgepole, SD, for
interseeding rangelend
Wind River Seed Co.
Experimental Design
On May 30 and 31 of 2006, three replications of five plants from each of the populations
were planted on 1.2 meter long single-row plots. Plots were in a randomized complete
block design. All aboveground plant biomass was harvested on June 25, 2008. From each
population, ten stems were randomly selected and bagged together. The bags were labeled
by population and placed directly in the freezer. The bags were thawed individually
throughout January and February 2010. Each stem was placed in an individual plastic bag
and stored in the refrigerator.
Data Collection
For each shoot, the morphological characteristics measured included: a) length & basal
diameter, b) number of nodes, branches, pods, c) ratios of leaf to stem, branch to stem,
SHOOT MORPHOLOGY OF ELEVEN 132
reproductive to vegetative biomass. The main stem length was measured in centimeters
from base to tip with a meter stick. The basal diameter below the first node was measured
with a caliper. The number of nodes on the main stem and the number of primary branches
were counted. The node with the first branch was recorded as first node, second node, etc.
The flower color and pod shape were noted. The branch leaves were bagged separately
from the main stem leaves. The primary branches were removed from the main stem and
placed in a paper bag. The paper bags were placed in a VWR Drying Oven set at 60°C for
at least 72 hours. The biomass of the branches, leaves, stem, and reproductive structures
were then weighed with an Acculab Vicon electronic scale.
Data Analysis
Ratios were calculated as follows: leaf biomass divided by stem biomass, branch biomass
divided by main stem biomass, and reproductive structure biomass divided by vegetative
structure biomass. The data was analyzed using the SAS program, PROC ANOVA. If the
p-values were less than 0.05, they were considered statistically significant.
RESULTS
Pure facata – rangeland type cultivar Don had the significant smallest and thinnest stem
among the 11 populations in terms of stem length and diameter. The rest of 10 populations
had similar stem length and diameter (Fig. 1). But Don had the highest leaf proportion in
total stem biomass and the highest reproductive biomass to vegetative biomass ratio
(P<0.0001).
Naturally-selected predominately falcata population had the most branched stem
(P<0.0001) among the 11 populations. It also produced the most pods (P=0.0191) and the
total stem biomass (P=0.0307).
Conventional-hay type 5454 cultivar had significantly less branches and percentage of leaf
in the total biomass of stem.
SHOOT MORPHOLOGY OF ELEVEN 133
DISCUSSION
From a forage quality standpoint, pure falcata cultivar Don has demonstrated high forage
quality than other populations since it had the fine stems and highest proportion of total
stem weight in leaves. Generally, stem or branches contain fewer nutrients, such as
protein, than leaves (Balliette, 1998). Compared to forage yield, Don had less biomass
production than Conventional-Hay-sativa-type 6200 HT and naturally-selected
predominately falcata. However, the production of the grass-Don mixture (tall fescue-Don
and meadow brome -Don) was significantly higher than the production of the grass
monocultures (Peel et al 2009), which probably contributed to Don’s ability to fix nitrogen
through nodules in its root system, enriching the soil for the grasses. In addition, low
growth habit makes Don more suitable under grazing condition in rangelands.
Predominantly falcata was developed in western of South Dakota near Lodgepole for
interseeding rangeland under grazing. This naturally-selected predominantly falcata
population had the largest and more branched stems than the other populations. It also had
the highest biomass per stem and seed pod production, which led to high seed production.
It is no surprise to observe predominantly falcata had the highest seed pod production since
it was purposely selected and developed for high seed production in order to interseed
degraded rangelands.
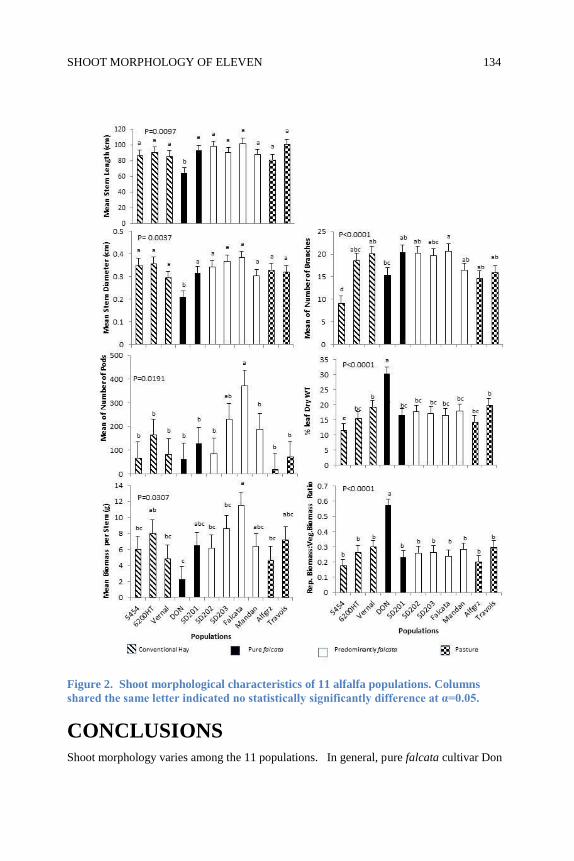
SHOOT MORPHOLOGY OF ELEVEN 134
Figure 2. Shoot morphological characteristics of 11 alfalfa populations. Columns
shared the same letter indicated no statistically significantly difference at α=0.05.
CONCLUSIONS Shoot morphology varies among the 11 populations. In general, pure falcata cultivar Don
SHOOT MORPHOLOGY OF ELEVEN 135
has high forage quality and the capability to improve degraded rangelands and persists
under harsh environments. Predominately falcata type is most productive through
producing large and more branched stems for the forage. Predominately falcate also has
high seed production, which indicates that the predominately falcata has the potential to
persists through recruitment from seedlings and maintain itself through seed bank.
LIMITATIONS To improve on the process of measurement, a more sensitive analytical scale could be used.
It also would have been beneficial to place individual stem in ten separate bags for each
population during the harvest. This would have made measurement more accurate. Leaves
that fell off the stems while in the bag could have been included in measurements if stems
had been separated. It would provide more useful information if the morphology
evaluation under grazing treatments and less precipitation conditions.
ACKNOWLEDGEMENTS The author would like to thank Dr. Lan Xu, Christopher G. Misar, and Eric Boyda for
information and guidance. She would like to acknowledge Dr. Arvid Boe, Dr. Roger N.
Gates, and Dr. Patricia S. Johnson for their work in alfalfa and their information. Also, she
would like to thank Ben Arlt for his assistance in data collection.
REFERENCES Balliette, J. and R. Torell. 1998. Alfalfa for Beef Cows. Cooperative Extension.
University of Nevada at Reno. Available at
www.unce.unr.edu/publications/files/ag/other/fs9323.pdf. Accessed April 25, 2011.
Boe, A., R. Bortnem, K. F. Higgins, A. D. Kruse, K. D. Kephart and S. Selman. 1998.
Breeding yellow-flowered alfalfa for combined wildlife habitat and forage purpose.
Brookings, SD, USA: South Dakota State University, South Dakota Agricultural
Experiment Station, B 727. 12P.
Brookings SD. (2011, Apr 25). National Weather Service. Available at:
http://forecast.weather.gov/MapClick.php?CityName=Brookings&state=SD&site=FS
D&textField1=44.3063&textField2=-96.7862&e=0. Accessed March 19, 2011
SHOOT MORPHOLOGY OF ELEVEN 136
Johnson, H.N. 1919. Alfalfa Growing in Western South Dakota. Monthly Weather Review,
328.
Mortenson, M. C., G. E. Schuman, and L. J. Ingram. 2004. Carbon Sequestration in
Rangelands Interseeded with Yellow-Flowering Alfalfa (Medicago sativa ssp.
falcata). Environmental Management, 33(1), 475-481.
Peel, M. D. , K. H. Asay, B. L. Waldron, K. B. Jensen, J. G. Robins, and I. W. Mott. 2009.
‘Don’, a diploid falcate alfalfa for western U.S. Rangelands. J. of Plant Registrations
3(2):115-118.
Rotili, P., G. Gnocchi, C. Scotti, and D. Kertikova. 2001. Breeding of the Alfalfa Plant
Morphology for Quality. Quality in lucerne and medics for animal production.
Options méditerranéennes, Series A, 45, 25-27.
Rumbaugh, M.D. 1982. Reseeding by eight alfalfa populations in a semiarid pasture.
Journal of Range Management, 35(1), 84-86.
Smith, N.G. 1997. Yellow-Blossomed alfalfa on rangeland in South Dakota. Rangelands,
19(4), 24-25.
South Dakota Climate and Weather. 2010, Mar 23. South Dakota State University.
Available at: http://climate.sdstate.edu/climate_site/climate_page.htm. Accessed
March 23, 2011
Xu, L., A. Boe, R. N. Gates, and P. S. Johnson. 2008a. Evaluating Vigor, Forage
Production, and Persistence of 11 Alfalfa Populations in Semiarid Rangeland.
Proceedings of the South Dakota Academy of Science, Vol. 87; 2008 April 5-6;
Oacoma, SD. South Dakota Academy of Science. p. 344.
Xu, L. A., Boe, R. N. Gates, P. S. Johnson, and Y. Zhang. 2008b. Spatial distribution,
biomass and soil seed bank of a naturalized population of alfalfa in native mixed-grass
prairie. Multifunctional Grasslands in Changing World. (Ed. Organizing Committee
of 2008 IGC/IRC Conference) Vol. I: 211.
GEORGIANA DUCHESS OF DEVONSHIRE 137
Georgiana Duchess of Devonshire:
Spark of the Women’s Rights Movement
Author: Casey Seger
Faculty Sponsor: Dr. Lizabeth Johnson
Department: History
ABSTRACT
The late eighteenth century of Great Britain displayed a society influenced by outside
thinkers, such as Rousseau, and dealing with the results of the American and French
Revolutions. During this time a young women named Georgiana Cavendish began to break
the mold that many aristocratic nobles adhered to for many years. The purpose of looking
at Georgiana’s life and short career in politics is to show that women indeed could
campaign in a very effective way. Though her campaigning got her friend a seat in
Parliament, her exposure to the public during this time caused her and the person she
campaigned for to lose some respect in the eyes of the public.
INTRODUCTION
The life of a wealthy eighteenth century British woman revolved around tasks such as
running the house, looking after children, and planning societal parties. Aristocratic
women began instruction at an early age on the proper social standards. After being
indoctrinated in these standards women adhered to them, and they scarcely deviated from
the ideal social model. One of many of these aristocratic women was a young noblewoman
named Georgiana Spencer. Georgiana Spencer, known later as the Duchess of Devonshire,
brought to English high society a new breed of woman. Coming from a well to do Whig
family Georgiana married a man she believed herself to be in love with, but in time, she
realized there was no love at all. A woman skilled in many languages and well-read in
many of the philosophies of the day, in particular Rousseau, tried to find a diversion that
would fill the void left by her marriage. She soon found that politics held the key to what
GEORGIANA DUCHESS OF DEVONSHIRE 138
she wanted to do with her life. After being head of a political think tank, Georgiana took a
plunge into public politics. During the 1784 British General Election, she started
campaigning for a close friend in an era where politics was strictly a man’s world. In spite
of rumors and widely published political caricatures, women like Georgiana Spencer
Cavendish, Duchess of Devonshire, paved the way for high class women to be more
involved in politics, and not just societal parties. These women stepped outside the normal
boundaries of aristocratic behavior and became more involved in political campaigning. In
the late eighteenth century, Georgiana Spencer was, in many aspects, the spark of the
women’s rights movement that would come full circle almost one hundred years later.
Georgiana threw off one of many societal bonds that restrained women not only during this
century, but also throughout history.
BODY
As with most noble ladies in the eighteenth century, Georgiana had little say over her own
marriage. Georgiana’s parents arranged her marriage to the Duke of Devonshire in the
hopes of catapulting the Spencer family fully into the political spotlight. The Spencer
family lived in Althorp House in Northamptonshire and was very rich thanks to their
history of sheep farming, productive business adventures, and a massive art collection;1
despite being highly regarded in terms of wealth, the family was still new to the realm of
the aristocracy. The Spencer family maintained good social and political standing by being
involved in the Whig Party. Therefore, it seemed only proper to marry their daughter off to
another well respected and honorable Whig noble. William Cavendish, Duke of
Devonshire, was the man that the Spencer family found to be a reasonable match for their
daughter.2 After her parents arranged the match and informed Georgiana, she believed that
she would be happy with the Duke. After her marriage into the Cavendish family,
Georgiana became part of one of the richest and most influential families in all of Great
Britain. However, the marriage that started out well soon became a trap. She had troubles
producing an heir, which led the Duke to deprive her of the attention that she wanted and
1 Amanda Foreman, Georgiana: Duchess of Devonshire (New York: Random House, 1999), 4.
2 Ibid. 18.
GEORGIANA DUCHESS OF DEVONSHIRE 139
needed, and she began amassing a huge debt within a few short years. Soon Georgiana
looked for activities to fill the emptiness within her marriage. First, as reflected by her
increasing debt, she took to gambling as a way to escape the pains of her marriage. Second
and certainly her most well-known undertaking was the involvement in politics.
In the course of her life, Georgiana found politics to be a nice diversion from the dull life
she lived as the Duchess of Devonshire. Soon after her marriage, Georgiana found herself
thrust into the position as leader of the Devonshire House Circle. The Duchess, as mistress
of the house, held parties as a requirement of her duties in being the wife of one of the
richest and most influential men within the Whig party. The Devonshire House Circle
during the eighteenth century acted as the political and social meeting place for the Whigs.
This interaction of societal happenings and public politics is what gave the Devonshire
House Circle the status of a salon and put Georgiana at its head. During this time, she was
holding weekly, if not nightly, parties at Devonshire House. She made her grand entrance
onto the main political stage during the General Election of 1784. During the 1784 election,
she gave women a voice in politics by campaigning for Charles Fox, leader of the Whig
party and her friend, in the borough of Westminster. Incidentally, the first time Georgiana
was in the full political sphere was also the last, the cause of this sudden upheaval can be
seen in the publication of political cartoons during the campaign, which damaged her
public image as well as Fox’s image as a leader.
In order to gain a better understanding of the complexities of high society in the time of
Georgiana Cavendish, and more importantly, why she was divergent from other women
during her time, one would need to examine what the life of a noble woman consisted of
during this era. During the eighteenth century, there were certain standards that women
adhered to in order to conform to societal expectations. One such source for these standards
was a cookbook called The Whole Duty of a Woman Or, an Infallible Guide to the Fair Sex.
The subject of this cookbook was not only the recipes that were common to many English
households at the time, but also certain rules and standards adhered to by the best of British
nobility, which were located in the front of the cookbook. The topics in the cookbook range
from the duties of virgins to the respectable behavior a woman should have towards a
drunk. The book mentions the aspects of a woman’s life concerning her role as wife and her
duties managing the children and the household. The first part of the duty of a wife showed
GEORGIANA DUCHESS OF DEVONSHIRE 140
how her marriage represented an adoption into her husband’s family.3 Having married into
one of the nation’s wealthiest and most influential families, Georgiana would need to
display this sense of duty in a most effective way. It was her job as wife of the Duke, head
of the Cavendish clan, to carry on the duties and customs of her husband’s family. The
guide also shows what duties a wife had to her husband. The three responsibilities stated in
the guide were a duty to his person, his reputation, and his fortune.4 In the section that
pertains to his person, the author makes every attempt to show that love was a most
important factor in carrying this duty out. The author states in this passage that, “it is love
only that cements the hearts, and where the union is wanting, it is but a shadow, a carcass
of marriage.”5 Even more intriguing, the author says that without love, “it is a bargain and
compact, a tyranny, perhaps, on the man’s part, and slavery on the woman’s.”6 The
statements the author put forth in this section indicate that marriage needed an effort of love
in order to work. However, as can be seen in history and in the marriage of Georgiana, love
was not always a factor when it came to a marriage arrangement. The Whole Duty of a
Woman also gave advice with respect to how a woman/wife should run a house. Georgiana
was no different from other high society women in that it would be up to her to oversee the
running of the Cavendish Houses.
Georgiana needed to show the Cavendish family that she indeed was a woman who would
look after her husband’s fortune and reputation. The two sources which describe these
ideals are The Duty of a Woman, and a magazine published in 1736 titled Country
Magazine. A passage from the Country Magazine titled An Epitaph on a noble lady also
described the virtues and actions expected of noble ladies. The author of this little Epitaph
described a woman who in his mind makes up the perfect British woman.7 The author of
the Epitaph takes care to mention that this particular woman was also very patriotic during
3 The Whole Duty of a Woman: Or, an Infallible Guide to the Fair Sex (London, 1737), 108.
4 Ibid. 109.
5 Ibid. 109. The author that wrote this text is unknown to us at this time. Therefore, this pronoun is
simply used for convenience sakes.
6 Ibid. 108.
7The author that wrote this text is unknown to us at this time. Therefore, this pronoun is simply used for convenience sakes.
GEORGIANA DUCHESS OF DEVONSHIRE 141
her life for he says, “A grateful Briton consecrates this stone to hers’ [sic] alone who living
could impart a patriot ardour to the coldest heart.”8 The author indeed showed the reader of
the magazine that patriotism is a most worthy virtue to uphold, and again this idea might
have had an influence on the upbringing of noble ladies at this time. This patriotism would
have been especially important because towards the end of the eighteenth century the
American colonies prepared to sever ties with the mother country. The author wrote that
this lady was, “Friend to all parties, to all parties true Oft for her Church and King she
zealous stood.”9 From this little glimpse, one can see that this woman was honorable for
being completely devoted to the King and Church. Not only was a wife expected to have a
devotion to the King and Church but a wife also had a great many other responsibilities.
These other responsibilities ranged from taking care of the children to housekeeping, but
the Epitaph shows another characteristic that women needed to embrace. This involved
charity and kindness. The author of the Epitaph wrote,
But always steadfast for the public Good: For public Good she lavished ov’r her Store, her
chiefest glory was to chear [sic] the poor; to glad the Heart just breaking with despair to
banish Pain, and Poverty and Care; to sooth in every Breast a various Grief… Partial to
none, her Bounty unconfined, generous she live a Friend to most Mankind: so in Return by
most she live carefree, to Rich as to the Poor a welcome guest…10
In marrying a respectable peer and the Lord High Treasurer of Ireland, Georgiana would
have to display this sense of charity and kindness in order to do homage to her husband’s
reputation and fortune. After her marriage, Georgiana had the opportunity to demonstrate
her sense of charity through her control of the household expenses. Amanda Foreman, one
of the foremost biographers of Georgiana, described this idea of managing finances in her
biography where, “Heaton, (the Dukes’ advisor) had prepared a list of the household
expenses which included the names of the parishioners and tenants who received charity
8“An Epitaph on a Noble Lady,” The Country Magazine: Or, The Gentleman and Lady’s Pocket
Companion, (August 1736), 384.
9Ibid. 384.
10 Ibid.384.
GEORGIANA DUCHESS OF DEVONSHIRE 142
from the estate and whose welfare was now in her trust.”11
Georgiana even started a
charity school for girls in her early days of being Duchess. Foreman described how this
project displayed Georgiana’s sense of charity. Foreman even included a passage from
Georgiana’s grandmother who wrote that when Georgiana would generously give children
her pocket money she “seemed as glad to give [the coins] as they were to have them.”12
Early on, in the marriage, Georgiana was keen to play her social role, as the dutiful,
charitable, patriotic wife, and nothing was more important than the Public Days. Foreman
describes how the new Duchess presided over the Public Days at Chatsworth.13
According
to Foreman, Chatsworth maintained the tradition of holding a Public Day at least once a
week. During these Public Days, the Duke and Duchess would open the doors of
Chatsworth to the tenants and other respectable strangers. Foreman wrote that, “Georgiana
and the Duke stood in the hall wearing their finest clothes, as if attending a state occasion,
and personally greeted every guest.”14
These Public Days were reminiscent of the old
feudal days when vassals and private armies were important to the kingdom. Naturally,
Georgiana’s first Pubic Day caused quite a stir, but after a while, the crowds dwindled.15
These Public Days were also important for another reason. During these Public Days,
Georgiana would have to interact with people of different rank, and knowing the proper
way to approach these people was very important.
Knowing how to portray one’s self to the public in a most respectable manner was the main
goal for all noble women in this time. Not only did Georgiana deal with the Public Days at
Chatsworth, but she also performed daily tasks, as any other woman would have. Country
Magazine detailed the day of an average woman and informed the reader of the proper time
to perform the daily tasks. The advice given in the magazine article is thorough and
11 Foreman, 24.
12 Ibid. 24.
13 Ibid. 23.
14 Ibid. 27.
15 Ibid. 27.
GEORGIANA DUCHESS OF DEVONSHIRE 143
involved everything from when to wake up, to eating, to advice on evening parties.16
The
activities described as being beneficial to a women’s position in the household were short
and concise when listed in the section from Country Magazine. The author of this section
recommended a woman rise no later than nine in the morning.17
During the early times of
the morning, the writer seemed to think that this was the time when women should think for
he wrote, “At nine stretch your arms, and oh, think when alone.”18
This phrase would
strike a modern person as being sexist; however, this was the mindset of the eighteenth
century regarding women. Many men believed that women were not meant to think in
public, but were to save their ideas and thinking for the home. Also, the writer of this
article approved of drinking by women. The writer states, “After dinner two glasses at least
I approve, Name the first to the king the next to your love.”19
Drinking was always a big
part of a party, and in eighteenth-century England, there were no better parties than those of
the stately homes in London. Devonshire House served as one of these stately homes and
Georgiana held no expense back when it came to the parties. It was at these parties that
Georgiana would strengthen her position within the salon and discuss writings by modern
philosophers.
Discussions were all the rage in these stately homes. The houses in London seemed to be
teeming with new ideas during this time and Devonshire House with Georgiana at its’ head
felt very deeply for Rousseau’s’ writings. Many women found the weapon they needed to
prove they could campaign in the writings of Jean-Jacques Rousseau. In Linda Colley’s
book titled Britons: Forging the Nation she brings out the meanings of Rousseau’s works
and what they meant to eighteenth century women. Rousseau, in his writings, describes
how women were just as important to the political machine as men for he states, “the
16 “Advice to a young Lady,” The Country Magazine: Or, The Gentleman and Lady’s Pocket
Companion, December 1736, 635.
17 The author that wrote this text is unknown to us at this time. Therefore, this pronoun is simply used
for convenience sakes.
18 Ibid. 635.
19 Ibid. 635.
GEORGIANA DUCHESS OF DEVONSHIRE 144
legislative hallways would grow silent and empty, or become noisily corrupt.”20
To many
this phrase meant since women were so important in the raising of children, the future
political leaders, they needed to stay in the home. However, to prove that campaigning was
completely within a woman’s sphere women interpreted Rousseau’s writings to show that
their campaigning was indeed justified. Colley writes that,
…citizenship had been linked with the possession of land and/or the ability to bear
arms- in other words, represented as an overwhelmingly masculine prerogative. By
breaking away from this model and stressing instead the connexion between civic
virtue and the family, Rousseau, whether he recognized it or not, supplied women
with a rationale for intervening in political affairs.21
These writings of Rousseau’s would have been available to Georgiana, and indeed Colley
suggests that these writings did indeed influence Georgiana as well as many others such as
Mary Wollstonecraft.22 Using this interpretation of Rousseau’s writings, Georgiana began
securing her position politically and socially within the Devonshire House Circle. The salon
would serve as Georgiana’s springboard into politics.
Devonshire House was a well-known Whig political hotbed in London and soon gave rise
to its own salon known as the Devonshire House Circle. Georgiana Spencer Cavendish
soon became the head of this salon and commanded great respect from the people within.
After her marriage in 1774, the new Duchess began a parade of court appearances, which
were required during this time. Lady Mary Coke recorded the praises that she had for the
Duchess on her politeness and manners while at court and in private meetings.23 In the
presence of the court and other high ranking nobles, Georgiana put to use the upbringing
that she received from her mother. She began making connections within the court as well
as searching out people who shared her ideologies. Georgiana went to these court and
public appearances by herself most of the time because the Duke was preoccupied with
20 Linda Colley, Britons:Forging the Nation 1707-1837 (New Haven: Yale University Press, 2009), 279.
21 Ibid. 279.
22 Ibid. 279.
23 Hugh Stokes, The Devonshire House Circle (New York: McBride, Nast and Company, 1916), 102.
GEORGIANA DUCHESS OF DEVONSHIRE 145
other matters. At first, this absence did not bother Georgiana. She was building up a
network of relationships within the Devonshire House Circle, at court, and at her social
parties, but according to the Honourable Mrs. Boscawen, after the first month it was easy to
see that the Duchess was becoming less happy in her marriage24
and needed something
else to fulfill her life. Georgiana started her career at Devonshire House as the hostess for
many parties. This position of social hostess that Georgiana held as wife to the Duke
would, by the beginning of 1784, develop into her being the political head of the
Devonshire House Circle in London. The Devonshire House Circle was where Whig
politicians came together to talk about politics, and only the most ardent Whig ladies were
allowed into the upper echelon of the Circle. 25
In order to gain access to this top rank of
ladies, Georgiana would have to prove herself to other noble ladies, such as the Ladies
Jersey and Melbourne, that she was a true Whig and that she could build up connections
just like the rest of the ladies.26
Foreman wrote in her book that Lady Melbourne reigned
as leading hostess of the bon ton, which was a gathering outside of Devonshire House.27
After Georgiana made her entry into the society, she befriended Lady Melbourne, much to
her mother’s disappointment.28
Lady Jersey was one of the newer generations of Whigs.
Foreman states in her book that Lady Jersey, “used her irresistible seduction and
fascination to wreck the marriages of her friends. According to a contemporary, she was
clever, unprincipled, but beautiful and fascinating.”29
One of the first steps that helped
push Georgiana to this top tier was securing a seat in the House of Commons for a friend
and burgeoning playwright named Richard Sheridan.30
Georgiana, with the help of her
mother and the Spencer family, was able to get Sheridan a seat in one of the Spencer
24Ibid. 68.
25Ibid. 137.
26Foreman, 46-7.
27 Ibid. 47.
28 Ibid. 47. Lady Spencer loathed Lady Melbourne because in earlier years Lady Melbourne shunned
Lady Spencer in the bon ton group which Lady Spencer never forgot.
29 Ibid. 47.
30 Stokes, 167.
GEORGIANA DUCHESS OF DEVONSHIRE 146
strongholds, Strafford, thus starting a sort of patron-client system.31
Georgiana’s actions
put her on the track to the top. Other steps that helped her to the top were the almost nightly
parties, in which she engaged in discussions on so called “soft” political issues.
The issues discussed in these new salons, as Sarah Richardson describes them, were not
“hard” political issues of the day such as reform of the electoral process or economic
reform, but were a type of “soft” issues, such as rights for Europeans.32
Richardson
describes the salon as being a place where women dominated the political discussions.
Richardson says, “Again, it is British women who viewed women rather than men as the
central participants in the arena of salon politics.”33
This idea of women being more
involved in politics was true of Georgiana in the Devonshire House Circle. She soon
became enthralled in the political debates that were taking place at her parties and was even
more enthusiastic about politics when she would write to her mother. This exchange of
letters was also nothing new to the realm of salon politics for Richardson in her article
states, “Correspondence networks were crucial to the successful operation of the electoral
machine.”34
These correspondences written by many ladies were sometimes the quickest
way to get political information passed onto each other. This point also held true for
Georgiana. The Chatsworth Collection has numerous letters sent by Georgiana to her
mother, the widow Spencer, about different political actions. In many cases Georgiana
wrote to her mother about her nights out at plays. Georgiana wrote in one such case to her
mother that, “It was very full and I had several good political fights.”35
This network of
letters would prove essential in the 1784 election, when Georgiana made her full debut.
Through her constant efforts to convince the other ladies that she was indeed a true Whig,
31 Ibid., 132.
32 Sarah Richardson, “Well-neighboured Houses: the Political Networks of Elite Women, 1780-1860,”
in Women in British Politics, 1760-1860: The Power of the Petticoat, ed. by K. Gleadle and S. Richardson (New York: St. Martin’s Press, Inc., 2000), 66.
33 Ibid., 64.
34 Ibid., 66.
35 Foreman, 136.
GEORGIANA DUCHESS OF DEVONSHIRE 147
Georgiana soon become the undisputed leader of the Devonshire House Circle as a way to
find purpose and happiness in her all too ill-fated marriage.
After successfully putting herself at the head of the Devonshire House Circle, Georgiana
soon made her entrance into public campaigning in the election of 1784. With her charm
and beauty, she supported Charles Fox’s reelection to the Westminster seat in the House of
Commons. Charles James Fox was a leader within the Whig Party for most of Georgiana’s
life. He was a notorious gambler and despised by King George III. In Reid’s book titled
Charles James Fox, he writes that, “The King, being consulted, declared it was his fixed
and unalterable determination not to be bound hand and foot and put into Fox’s hands, and
that rather than submit he would leave the kingdom forever.”36
Fox held a seat in
Parliament in the House of Commons from 1768 until his death in 180637
. However, in the
1784 Election Fox’s seat was anything but guaranteed for Reid says, “To replace Fox, the
Government backed the popular Admiral Hood, whose election was never in doubt, and
Wray. So at the outset the real contest was between Wray and Fox.”38
During the 1784
election, Fox used his ties with Georgiana to promote his agendas and eventually maintain
his seat in the House of Commons. Afterwards, Georgiana retired from public politics, but
maintained a strong political influence in her position within the Devonshire House Circle.
By allowing her to expose herself to the public in this way, however, the men of the Whig
Party created problems, not only for Georgiana, but also for Charles Fox. Women scarcely
campaigned in public before for Members of Parliament (MPs), let alone a woman of such
high rank. Women of high class usually had at least one place when it came to politics
though. This place lay within the family sphere.
Elaine Chalus wrote in her article on elite women that, “Family involvement in
parliamentary politics often demanded some degree of participation from women,
especially in maintaining family interests at the local level, but just having an MP or a
36 Loren Reid, Charles James Fox: A Man for the People (Columbia: University of Missouri Press,
1969), 194.
37 Encyclopædia Britannica Online, s. v. "Charles James Fox," accessed March 19, 2012,
http://www.britannica.com/EBchecked/topic/215350/Charles-James-Fox
38 Ibid. 199.
GEORGIANA DUCHESS OF DEVONSHIRE 148
politically active peer in the family had an impact on women’s lives.”39
Chalus states, in
this phrase, that women were indeed very much a part of the political machine. In
Georgiana’s time, this was no different and as stated earlier she used her influence to get at
least one friend elected to a Spencer stronghold. Numerous times before 1784, Georgiana
campaigned for her brother George in Northamptonshire, which was satisfactory by her
mother’s standards since it was a family issue.40
Indeed, many elite women campaigned for
family members. As a matron of the Cavendish family, Georgiana promoted the family
interest in many different boroughs. Foreman wrote that, “In the eighteenth century the
maintenance of an electoral borough was a family matter; it was part of the estate, as
tangible and valuable as land. The Cavendish influence in parliament depended on the
number of MPs who sat in the family’s “interest”.”41
It was normal for Georgiana to look
after these interests in Derbyshire. She was able to do all the campaigning she wanted to in
these districts. These were familial interest areas, in the countryside, and they were not
hotly contested boroughs. The issue that made Georgiana more vulnerable is that she
campaigned for a non-family member, in a non-family constituency, and in a far less rural
area. 42
She also made matters worse for herself when she would actually get out of the
carriage and talk to people about numerous topics, from how their businesses were doing to
giving advice in rearing children. Georgiana quite frequently got out of her carriage to
mingle with the common person, which was a risky step to take in one of London’s most
democratic boroughs. Foreman refers to these times in her biography of the Duchess for she
says, “She not only chatted with voters and argued cheerfully with them, she also took an
interest in their businesses and families. She met their wives and children, and became
godmother to tens of infants, and impressed the women with her knowledge of such homely
39 Elaine Chalus, “Elite Women, Social Politics, and the Political World of Late Eighteenth-Century
England,” The Historical Journal 43, no.3 (Sept., 2000) 675.
40 Foremen, 143.
41 Ibid. 28. At its height, thirteen MPs owed their seats to the Duke’s financial and political might.
Since his brother-in-law the Duke of Portland controlled ten, when the Cavendishs collaborated they
presented a formidable faction.
42 Ibid. 153.
GEORGIANA DUCHESS OF DEVONSHIRE 149
matters as nursing and discipline.”43
This aspect of Georgiana showed that she was indeed
listening to what the people wanted from their government, and people seemed to think she
was the one to talk to in order to make their opinions heard. Even her mother, the Lady
Spencer, referred to how approachable her daughter could be during this time. “I delight
myself with the Idea that your unaffected good humour, civility and attention to everyone
will draw all hearts towards you,” 44
wrote the Lady Spencer to her daughter during the
election. Georgiana indeed was a person who could talk to people on a very personal basis,
but she also knew that money was king as well. During the 1784 election, it was well noted
that when Georgiana visited a store she overpaid for items. Foreman states Georgiana’s
actions quite nicely when she wrote,
Georgiana also understood the power of money and she went with her friends from shop to
shop making enormous purchases, deliberately overpaying while hinting at the promise of
more if the proprietors voted for Fox. A visit to the milliners’ shops in Tavistock Street
with Harriet and the Ladies Waldegrave turned into a street party with the shopkeepers
hoisting foxskin muffs over their doors as a sign of their support. 45
This travelling around
Westminster showed that Georgiana feared no one in her campaign adventures. Georgiana
maintained her nobility when she was in these places and tried to change campaigning by
bringing other women along with her. In this particular case from Foreman’s book
Georgiana brought her sister, who hardly left her side during the campaign, and the Ladies
Waldegrave, who were important Whig women themselves.46
This showed Georgiana’s
tenacity to bring women into the political sphere and use womanpower to win the seat of
Westminster for Fox. However, the business of campaigning proved to be more fickle than
Georgiana could imagine. During the 1784 election, the Conservative Party had numerous
ties with the newspapers and tried to use those ties to tarnish the reputation of the Duchess.
Of all the numerous propagandas that circulated in the 1784 election one of the most active
and indeed most unscrupulous was that of the newspapers.
43 Ibid. 145.
44 Ibid. 145.
45 Ibid. 145.
46 Ibid. 139.
GEORGIANA DUCHESS OF DEVONSHIRE 150
The newspapers of the time were not about to let this riveting story pass them by, and today
there are at least eighty-nine different political prints involving Georgiana that survived
from April 1784 alone.47
The publication of the prints shows how the canvassing done by
Georgiana was the attention-grabbing topic of the day. The prints that survive from this
election bring out many details that show how far the Conservatives were willing to go to
smear the name of Georgiana Cavendish. During the election, there were numerous
caricatures, and several of them show the Duchess in a most “indelicate situation”. In
Amelia Rauser’s article The Butcher-Kissing Duchess of Devonshire: Between Caricature
and Allegory in 1784, she looks at several prints to see how printmakers portrayed the
figures in the campaign and why they were portrayed this way. One such idea that Rauser
focuses on is the idea of virtue. Rauser found notes from a commenter named William
Combe, and Rauser composed that,
Combe wrote several satires in 1777 that attacked the Duchess for not acting more like the
exemplar of Feminine virtue that she could have been to the British public. He claimed that
her personal failings reflected on the morality of British Women in general, because the
Duchess as one of the highest-ranking ladies in the land was expected to set an example for
British femininity.48
This preview of the Duchess before the election showed that already,
to some people, she lacked credibility when it came to being virtuous.
One way the Foxite printmakers wanted to portray Georgiana was as the steadfast figure of
British virtue. In earlier prints, makers often depicted a female figure with loose clothes and
one breast exposed as the ideal figure of virtue, however, as Rauser states, “Showing her
with breast exposed might align her with allegorical virtue, but, especially in the deeply
ironic context of the Westminster election, it would also risk an inverted reading as mere
personal licentiousness.”49
The problem posed to the Foxite printmakers was how to take a
high ranking Duchess and show her in a positive light when she was doing something that
had hardly been done before. Not only did they have to find a way to show Georgiana as a
47 Amelia Rauser, “The Butcher-Kissing Duchess of Devonshire: Between Caricature and Allegory in
1784,” Eighteenth-Century Studies 36, no. 1 (2002): 23.
48 Ibid. 30.
49 Ibid. 38.
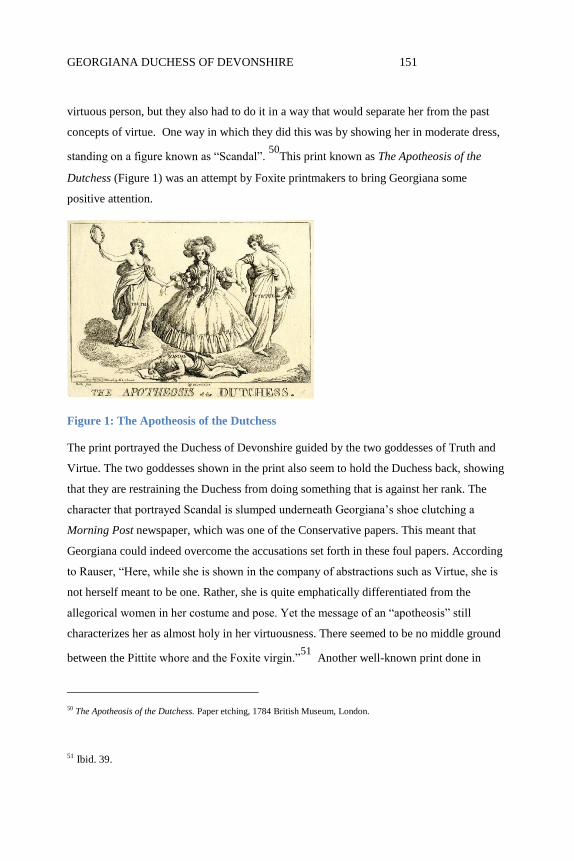
GEORGIANA DUCHESS OF DEVONSHIRE 151
virtuous person, but they also had to do it in a way that would separate her from the past
concepts of virtue. One way in which they did this was by showing her in moderate dress,
standing on a figure known as “Scandal”. 50
This print known as The Apotheosis of the
Dutchess (Figure 1) was an attempt by Foxite printmakers to bring Georgiana some
positive attention.
Figure 1: The Apotheosis of the Dutchess
The print portrayed the Duchess of Devonshire guided by the two goddesses of Truth and
Virtue. The two goddesses shown in the print also seem to hold the Duchess back, showing
that they are restraining the Duchess from doing something that is against her rank. The
character that portrayed Scandal is slumped underneath Georgiana’s shoe clutching a
Morning Post newspaper, which was one of the Conservative papers. This meant that
Georgiana could indeed overcome the accusations set forth in these foul papers. According
to Rauser, “Here, while she is shown in the company of abstractions such as Virtue, she is
not herself meant to be one. Rather, she is quite emphatically differentiated from the
allegorical women in her costume and pose. Yet the message of an “apotheosis” still
characterizes her as almost holy in her virtuousness. There seemed to be no middle ground
between the Pittite whore and the Foxite virgin.”51
Another well-known print done in
50 The Apotheosis of the Dutchess. Paper etching, 1784 British Museum, London.
51 Ibid. 39.
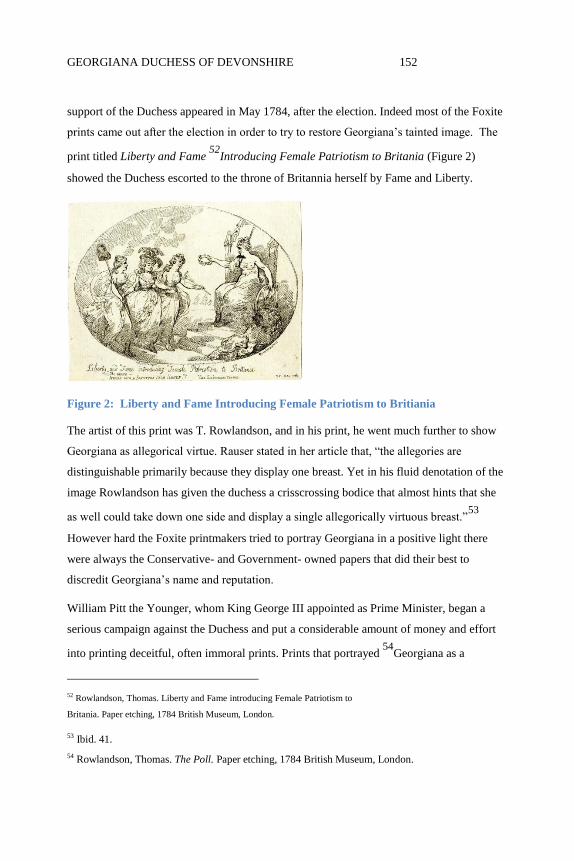
GEORGIANA DUCHESS OF DEVONSHIRE 152
support of the Duchess appeared in May 1784, after the election. Indeed most of the Foxite
prints came out after the election in order to try to restore Georgiana’s tainted image. The
print titled Liberty and Fame 52
Introducing Female Patriotism to Britania (Figure 2)
showed the Duchess escorted to the throne of Britannia herself by Fame and Liberty.
Figure 2: Liberty and Fame Introducing Female Patriotism to Britiania
The artist of this print was T. Rowlandson, and in his print, he went much further to show
Georgiana as allegorical virtue. Rauser stated in her article that, “the allegories are
distinguishable primarily because they display one breast. Yet in his fluid denotation of the
image Rowlandson has given the duchess a crisscrossing bodice that almost hints that she
as well could take down one side and display a single allegorically virtuous breast.”53
However hard the Foxite printmakers tried to portray Georgiana in a positive light there
were always the Conservative- and Government- owned papers that did their best to
discredit Georgiana’s name and reputation.
William Pitt the Younger, whom King George III appointed as Prime Minister, began a
serious campaign against the Duchess and put a considerable amount of money and effort
into printing deceitful, often immoral prints. Prints that portrayed 54
Georgiana as a
52 Rowlandson, Thomas. Liberty and Fame introducing Female Patriotism to
Britania. Paper etching, 1784 British Museum, London.
53 Ibid. 41.
54 Rowlandson, Thomas. The Poll. Paper etching, 1784 British Museum, London.
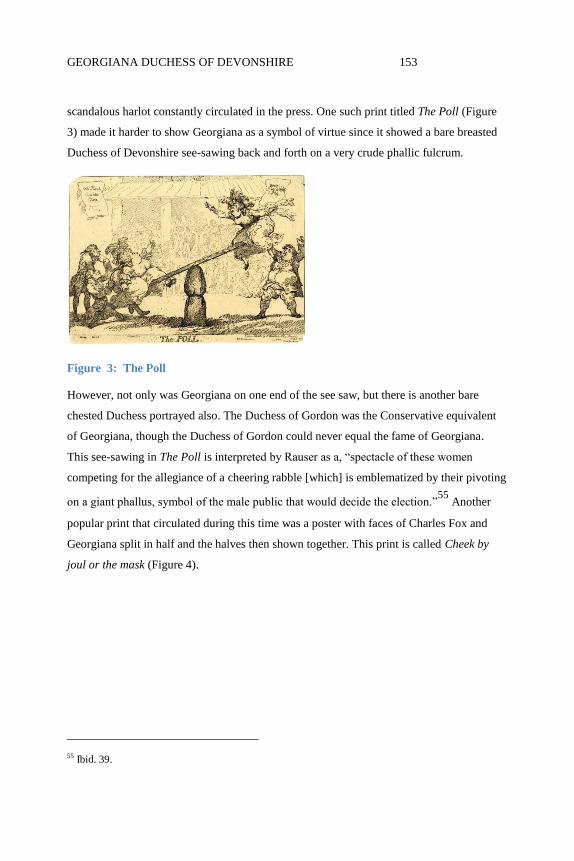
GEORGIANA DUCHESS OF DEVONSHIRE 153
scandalous harlot constantly circulated in the press. One such print titled The Poll (Figure
3) made it harder to show Georgiana as a symbol of virtue since it showed a bare breasted
Duchess of Devonshire see-sawing back and forth on a very crude phallic fulcrum.
Figure 3: The Poll
However, not only was Georgiana on one end of the see saw, but there is another bare
chested Duchess portrayed also. The Duchess of Gordon was the Conservative equivalent
of Georgiana, though the Duchess of Gordon could never equal the fame of Georgiana.
This see-sawing in The Poll is interpreted by Rauser as a, “spectacle of these women
competing for the allegiance of a cheering rabble [which] is emblematized by their pivoting
on a giant phallus, symbol of the male public that would decide the election.”55
Another
popular print that circulated during this time was a poster with faces of Charles Fox and
Georgiana split in half and the halves then shown together. This print is called Cheek by
joul or the mask (Figure 4).
55 Ibid. 39.
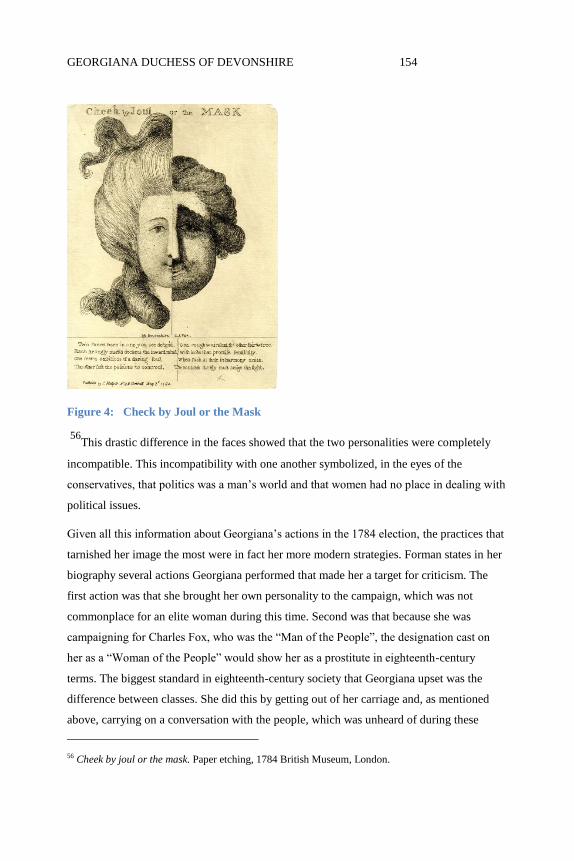
GEORGIANA DUCHESS OF DEVONSHIRE 154
Figure 4: Check by Joul or the Mask
56
This drastic difference in the faces showed that the two personalities were completely
incompatible. This incompatibility with one another symbolized, in the eyes of the
conservatives, that politics was a man’s world and that women had no place in dealing with
political issues.
Given all this information about Georgiana’s actions in the 1784 election, the practices that
tarnished her image the most were in fact her more modern strategies. Forman states in her
biography several actions Georgiana performed that made her a target for criticism. The
first action was that she brought her own personality to the campaign, which was not
commonplace for an elite woman during this time. Second was that because she was
campaigning for Charles Fox, who was the “Man of the People”, the designation cast on
her as a “Woman of the People” would show her as a prostitute in eighteenth-century
terms. The biggest standard in eighteenth-century society that Georgiana upset was the
difference between classes. She did this by getting out of her carriage and, as mentioned
above, carrying on a conversation with the people, which was unheard of during these
56 Cheek by joul or the mask. Paper etching, 1784 British Museum, London.
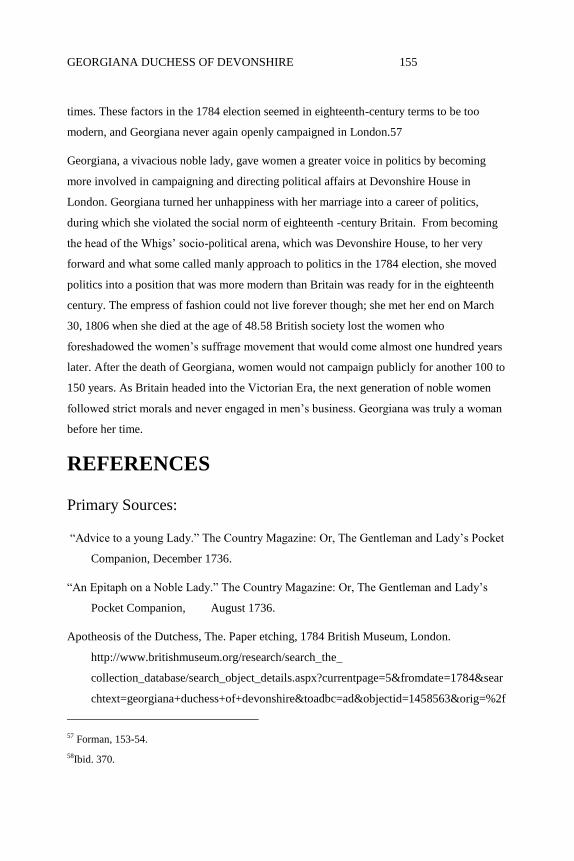
GEORGIANA DUCHESS OF DEVONSHIRE 155
times. These factors in the 1784 election seemed in eighteenth-century terms to be too
modern, and Georgiana never again openly campaigned in London.57
Georgiana, a vivacious noble lady, gave women a greater voice in politics by becoming
more involved in campaigning and directing political affairs at Devonshire House in
London. Georgiana turned her unhappiness with her marriage into a career of politics,
during which she violated the social norm of eighteenth -century Britain. From becoming
the head of the Whigs’ socio-political arena, which was Devonshire House, to her very
forward and what some called manly approach to politics in the 1784 election, she moved
politics into a position that was more modern than Britain was ready for in the eighteenth
century. The empress of fashion could not live forever though; she met her end on March
30, 1806 when she died at the age of 48.58 British society lost the women who
foreshadowed the women’s suffrage movement that would come almost one hundred years
later. After the death of Georgiana, women would not campaign publicly for another 100 to
150 years. As Britain headed into the Victorian Era, the next generation of noble women
followed strict morals and never engaged in men’s business. Georgiana was truly a woman
before her time.
REFERENCES
Primary Sources:
“Advice to a young Lady.” The Country Magazine: Or, The Gentleman and Lady’s Pocket
Companion, December 1736.
“An Epitaph on a Noble Lady.” The Country Magazine: Or, The Gentleman and Lady’s
Pocket Companion, August 1736.
Apotheosis of the Dutchess, The. Paper etching, 1784 British Museum, London.
http://www.britishmuseum.org/research/search_the_
collection_database/search_object_details.aspx?currentpage=5&fromdate=1784&sear
chtext=georgiana+duchess+of+devonshire&toadbc=ad&objectid=1458563&orig=%2f
57 Forman, 153-54.
58Ibid. 370.
GEORGIANA DUCHESS OF DEVONSHIRE 156
research%2fsearch_the_collection_database.aspx&partid=1&todate=1784&fromadbc
=ad&numpages=10 (accessed on December 1, 2011).
Cheek by joul or the mask. Paper etching, 1784 British Museum, London.
http://www.britishmuseum.org/research/search_the_collection_database/search_object
_details.aspx?currentpage=4&fromdate=1784&searchtext=georgiana+duchess+of+de
vonshire&toadbc=ad&objectid=1458464&orig=%2fresearch%2fsearch_the_collection
_database.aspx&partid=1&todate=1784&fromadbc=ad&numpages=10 (accessed on
December 1, 2011).
Rowlandson, Thomas. Liberty and Fame Introducing Female Patriotism to Britania. Paper
etching, 1784 British Museum, London.
http://www.britishmuseum.org/research/search_the_collection_database/search_object
_details.aspx?objectid=1645830&partid=1&searchText=georgiana+duchess+of+devo
nshire&fromDate=1784&fromADBC=ad&toDate=1784&toADBC=ad&numpages=1
0&orig=%2fresearch%2fsearch_the_collection_database.aspx¤tPage=5
(accessed on December 1, 2011).
Rowlandson, Thomas. The Poll. Paper etching, 1784 British Museum,
London.http://www.britishmuseum.org/research/search_the_collection_database/searc
h_object_image.aspx?objectId=1645383&partId=1&searchText=georgiana+duchess+
of+devonshire&orig=%2fresearch%2fsearch_the_collection_database.aspx&numPage
s=10¤tPage=7&asset_id=156333 (accessed on December 1, 2011).
Whole Duty of a Woman: Or, an Infallible Guide to the Fair Sex, The. London: Dogwell-
Court, White Fryers, Fleet Street, 1737.
http://books.google.com/books?id=SncEAAAAYAAJ&pg=PA108&source=gbs_toc_r
&cad=4#v=on epage&q&f=false (accessed October 15, 2011).
Journal Articles
Chalus, Elaine. “Elite Women, Social Politics, and the Political World of Late Eighteenth-
Century England.” The Historical Journal 43, no. 3 (Sep., 2000): 669-697.
Rauser, Amelia. “The Butcher-Kissing Duchess of Devonshire: Between Caricature and
Allegory in 1784.” Eighteenth-Century Studies 36, no.1 (Fall, 2002): 23-46.
GEORGIANA DUCHESS OF DEVONSHIRE 157
Secondary Sources
Colley, Linda. Britons: Forging the Nation 1707-1837. New Haven: Yale University Press,
2009.
Encyclopædia Britannica Online, s. v. "Charles James Fox," accessed March 19,
2012,http://www.britannica.com/EBchecked/topic
/215350/Charles-James-Fox
Foreman, Amanda. Georgiana: Duchess of Devonshire. New York: Random House, Inc.,
2001.
Reid, Loren Dudley. Charles James Fox: a man for the people. Columbia: University of
Missouri Press, 1969.
Richardson, Sarah. “Well-neighboured Houses: the Political Networks of Elite Women,
1780-1860.” In Women in British Politics, 1760-1860: The Power of the Petticoat,
edited by K. Gleadle and S. Richardson. New York: St. Martin’s Press, Inc.,
2000.
Stokes, Hugh. The Devonshire House Circle. New York: McBride, Nast, and Company,
1916.Google Books.http://books.google.com/books?id
=ejGgAAAAMAAJ&pg=PA135&lpg=PA135&dq=devonshire+house+circle+hugh+s
tokes&source=bl&ots=S35yCqYufr&sig=vcgVfND5mdi97-
fb7Uplilqcvw&hl=en&ei=uidsTo-IubJsQKah7TbBA&sa=X
&oi=book_result&ct=result&resnum=4&sqi=2&ved=0CC8Q6AEwAw#v=onepage&
q&f=false (accessed on December 5, 2011).
THE GROWING DEMAND FOR ENERGY 158
The Growing Demand for Energy and Ethanol’s
Role
Author: Kyleen Shields
Faculty Sponsor: Dr. Gary Taylor
Department: Economics
ABSTRACT
With growing demand for fuel ethanol production has become a large player in the market.
This study evaluates the efficient usage of corn as well as how ethanol has contributed to
the US economy.
INTRODUCTION
In forty years the population is expected to increase to 9 billion (World Population 2300).
The current world population is 7 billion (US and World Population Clocks, 2012). How
will farmers meet the challenge of feeding all of these hungry mouths? With the rapid
development of third world countries, the world is using oil at an astronomical rate.
Researchers have found other sources of energy, but the main source of this renewable
energy is one that may sacrifice food. Will we come to the point where using corn for food
is superior to using corn for fuel? With the population growing at a steady rate, it is very
realistic to assume that this decision will need to be made in the near future. With current
dependence on oil and dwindling supplies, does ethanol offer a real solution? Many factors
will need to be considered in the future, and these decisions may be made sooner than
anticipated.
Corn Harvest in 2011
As you drive across the Corn Belt, row crops seem to go on as far as the eye can see.
Agriculture is the backbone of America, but how much of our land is really devoted to
THE GROWING DEMAND FOR ENERGY 159
agriculture and farmland? Of the 2.2 billion acres currently zoned as agriculture land,
44.1% is used for cropland. (US Data Sets, 2012) The 2011 harvest was one of many trials
and tribulations. The Midwest experienced a very wet spring which caused some fields to
be replanted and often, not with corn. The South experienced record breaking temperatures
all summer along with a drought that claimed many acres of crops. Over 93.3 million acres
of corn were planted which was an increase of 4.1 million acres from 2010. (Minchenkov,
2011) Even with the natural hardships that farmers dealt with, the US was able to produce
12,358 million bushels of corn in 2011 (World Agriculture Supply and Demand Estimates,
2012). As one can see, the US produces an impressive amount of corn. The next question
that comes to mind is where is all of this corn being used? Many would think 12,358
million bushels of corn would last a few years. Some of the corn is exported but how do we
account for 12,358 million bushels of corn in the United States?
According to statistics in 2011 12,358 million bushels of corn were harvested. (US Data
Sets, 2012) Corn is also grown in every state in the US. Currently food grade corn is grown
in Iowa, Idaho, Illinois, Indiana, and some in Minnesota. With approximately only 78
million acres of food grade corn being grown, corn for human consumption makes up a
very small percentage of total consumption. Also, corn that is rated food grade is not used
for ethanol production. So to say that corn intended for human consumption is being used
for ethanol is incorrect. Food grade corn is used to make high fructose corn syrup, cereals,
and baby foods among many other products. Some food grade corn is also used for
industrial products such as packing peanuts, plastics, pharmaceuticals, and much more.
(Origin, History and Usage of Corn)
Corn for Feed
Crops are an important aspect of agriculture, but livestock producers also play a large role.
When people hear food versus fuel the common misconception is the corn used for food is
for human consumption. Corn is an important part of our food system in many aspects.
Beef cattle, dairy cattle, hogs, poultry, and miscellaneous small animals depend on the corn
as an energy source. A typical northwest Iowa community elevator may use up to 80 tons
of corn per day just to meet its feed requirement. A hog confinement building housing
2,400 hogs will use approximately 18 tons of feed every three days, or six pounds of feed

THE GROWING DEMAND FOR ENERGY 160
per day. (Bremer, 2012) With over 19 million hogs being raised at any given time in Iowa it
is easy to see that corn for feed use is essential to the livestock market. (Iowa Pork Facts)
The second largest use of corn is corn for fuel, commonly known as ethanol. (US Data Sets,
2012)
Corn for Ethanol
Ethanol has become a necessity of many types of fuel in the US market. The
advocates of ethanol state that it is a means to reduce our dependence on foreign oil,
stimulate the economy, and keep the US fuel supply more diverse. Currently, ethanol is
being used in about ninety percent of the fuel in the US. It has also gained support because
it is harboring 400,000 jobs throughout the United States while 70,000 of these jobs are
directly related to ethanol production and contributed 53 billion dollars to the nations GDP.
Another desirable feature of ethanol is that it reduces greenhouse gas emissions. To put this
into perspective it would be like taking the equivalence of 3.5 million cars off the nation’s
roads. (Ethanol) With the Green movement gaining popularity it is easy to see why ethanol
is a desirable investment in our future. Although the move towards ethanol seems to be a
positive solution, why have we shifted towards ethanol and away from foreign oil?
Oil
The demand for fuel and the dwindling supply of oil is an issue that has been on the minds
of many since the oil crisis of the 70’s. The following graph displays the United States and
China’s consumption of oil in millions of barrels per day. (Energy Statistics)

THE GROWING DEMAND FOR ENERGY 161
Figure 1: Consumption of Oil
Oil usage currently is a debate in our country as well as in the rest of whole world. With oil
being the backbone of many developing and developed countries, it is just as important in
agriculture. Every farm tractor requires diesel or biodiesel. American farmers use
approximately seven gallons of fuel per acre to complete all of their farm work. This would
include cultivating, planting, application of herbicides, and harvesting. With the growth of
developing countries the demand for oil is increasing rapidly. With the increased demand
in oil and the limited supply of oil that we can currently easily access, we must begin
exploring different energy options. During the past decade, there has been a massive swing
towards the use of renewable energy, such as ethanol and wind energy. With respects to
ethanol, it is renewable, corn is plentiful, and corn is already grown in every state in the
US. We see that the shift towards ethanol has already positively affected the US by
producing jobs, increasing the GDP, and helping the environment. Corn yields are
increasing and the technology surrounding ethanol production is quickly advancing, but
will it become efficient enough that we can feed the world and fuel it? Should the US focus
on how to access oil reserves here at home before rushing to make a new technology to
wean itself off the use of ethanol?
18.6
4.5
19.6
8.2
US Oil Consumption China Oil Consumtion
Comsumption of Oil in millions of Barrles per Day
2009 2001
THE GROWING DEMAND FOR ENERGY 162
US OIL RESERVES
The media commonly portrays that the US is sitting on more oil reserves than the Middle
East. With the current oil boom in North Dakota many are demanding we take advantage of
our supply of oil under our feet to lower the price we pay at the pump. Where the
misconception lies is in what type of oil we actually have within reach. There are two large
oil reserves in the continental US: the Bakken Shale Formation in North Dakota and the
Eagle Ford Shale in Texas. These two locations are drilled for their oil, but the oil is held
tightly in the shale and a special extraction process is necessary to remove the oil. Green
River Formation which spreads across Colorado, Wyoming, and Utah contains what is
called oil shale. This is basically oil in the shale, what nature hasn’t finished processing. To
make actual oil out of it, the shale must go through extra processing before it can be
utilized. (Setting the Record Straight on Oil Reserves , 2012) The US currently has 1.442
trillion barrels of recoverable oil waiting to be drilled. (Institute for Engergy Research ,
2011)
With increased EPA policies it may be difficult for companies to ever unleash the full
potential of the fuel we have right under our feet. Even if we were able to establish our own
oil fields, how long would our own oil sustain our demands? From analyzing the
information above, finding an alternative, cleaner burning fuel is something that needs to be
placed high on America’s priority list. But will ethanol hold all of the answers?
Current Efficiency of Ethanol
Currently it takes 2.7 bushels of corn to produce one gallon of ethanol. (Bremer, 2012)
Each bushel of corn used in ethanol production yields 17.5 lbs of nutrient rich livestock
feed, returning 1/3 of the bushel to the market. This feed is called Dried Distillers Grains or
DDG’s and is commonly used at feed mills as a protein source. The corn used for ethanol
does benefit the livestock industry. Syngenta recently released a corn hybrid called Enogen.
This new corn hybrid has additional alpha amylase enzyme bred into the kernel. This
enzyme is required during the fermentation process to change the starches to sugars.
Researchers found this type of bacteria in hot water vents on the ocean floor. One of the
benefits for the ethanol companies is that Enogen will completely change the viscosity of
THE GROWING DEMAND FOR ENERGY 163
corn as it goes through the machines. (Bremer, 2012) As one Enogen representative stated,
“Enogen allows the corn product to flow through the machines like water rather than
oatmeal.” This makes it flow easier and will allow the plant to increase its throughput. Even
though the plant may be capped they can now increase their total production. This
increased efficiency leads to increased profit and production for the plant. The next major
benefit is that Enogen will allow producers to keep their money in the United States. Right
now this enzyme has to be purchased from foreign countries and is quite expensive.
However, Enogen will allow them to keep more money in the American economy. Enogen
also allows farmers to target a certain market and take complete advantage of it. This
allows them to gain a premium for the same crop they would normally just take to the
elevator to be used for livestock feed. This mutual relationship between the ethanol plants
and the farmers could allow technologies like this to flourish and maybe someday end the
food versus fuel debate.
Problems with Ethanol
In 2004 President George W Bush signed the Volumetric Ethanol Excise Tax Credit bill
which became law in 2005. This bill offered fuel companies a 45 cent per gallon subsidy to
use ethanol, also called a “blenders credit.” (Volumetric Ethanol Excise Tax Credit, 2011)
This bill has increased market access of ethanol to the American market, raised the GDP, as
well as stimulated job growth within the US. With the addition of ethanol to fuel, fuel
prices also dropped slightly. (VEETC) There was an increase in tax revenue from ethanol
but before assuming that all of this was straight profit to the US, it needs to take into
consideration that ethanol is subsidized. The government subsidies had to come from
somewhere, and that was from taxpayer’s dollars. To be efficient the benefits of subsidizing
a market need to outweigh the costs.
It is estimated that American taxpayers subsidized over $20 billion dollars in ethanol
production over 30 years, but on January 1st, 2012 that all came to an end when congress
voted to end the ethanol subsidies. Amidst government deficits and high commodity prices,
congress couldn’t justify subsidizing ethanol. Many viewed ethanol as a mature industry
that can fend for itself because 10% of the fuel (gasoline and diesel) in the US has some
relation to ethanol. (After Three Decades, Tax Credit for Ethanol Expires, 2012) The
THE GROWING DEMAND FOR ENERGY 164
ethanol production plants can now fend for themselves, but what does the loss of these
subsidies mean for the American farmers that have been relying on the subsidies and for
Americans at the pump?
EFFECT OF ETHANOL SUBSIDIES ON
FARMERS
Subsidies have lead to a higher demand for corn which in turn has kept prices high. As
stated earlier, corn producers that contract their corn solely for ethanol use received a
premium for their product. Ethanol companies aren’t the only ones that pay a premium for
farmers to plant corn for ethanol production. Seed companies aid in ethanol production by
creating hybrids that are more compatible for ethanol use. Ethanol has created jobs as well
as more marketing options for farmers to gain top dollar for their corn. Implying that the
government was needed as a crutch for ethanol companies in this day of technology isn’t
entirely true when you look at the big picture. When seed companies start to contribute to
the efficiency of the process, there is less pressure on the ethanol companies to immediately
find a remedy for increased efficiency and production. Will the effort from the agriculture
industry be enough to make ethanol productive without government assistance? Since
Americans are paying for these subsidies, what are the direct effects that Americas are
experiencing for their money?
ETHANOL’S EFFECT ON FUEL PRICES IN
THE US DURING THE SUBSIDIES
Studies showed that from January of 2000 to December of 2010, ethanol production saved
Americans an average of 25 cents per gallon of fuel throughout theUS and 39 cents per
gallon in the Midwest. The Midwest has seen the largest benefit of ethanol because it is at
the heart of both corn and ethanol production. It is estimated that without ethanol in the
market, fuel prices would increase by “historic proportions” of 41% and more. (Xiaodong
Du, 2011) Since ethanol hasn’t been taken off the market completely since it emerged, it is
difficult to determine what and how prices fully react. Currently all gasoline fuels are
THE GROWING DEMAND FOR ENERGY 165
mixed with 10% ethanol and some vehicles, Flex Fuel vehicles, operate on fuel that is 85%
ethanol. Fuel that is mixed with ethanol is called super unleaded. After the government
subsidies expired for ethanol companies in January of 2012, it was expected that fuel prices
would rise by approximately four cents per gallon. Although higher ethanol prices are
certain to increase fuel prices, tension in the Middle East, which is much more volatile
could affect fuel prices much quicker. (Woodyard, 2012)
PERFORMANCE OF E85 FUEL VERSUS
REGULAR UNLEADED FUEL
After analyzing ethanol’s effect on fuel prices and the expenses imposed on taxpayers, is
ethanol meeting the public’s expectations? Currently, all gasoline fuel is mixed with at least
10% ethanol. This is because we are trying to move towards a more renewable fuel source.
By using ethanol we are able to relieve some dependence on foreign oil. Flex Fuel vehicles
can operate on regular fuel or fuel that is up to 85% ethanol. If ethanol fuel is cheaper and
is better for the American economy, why aren’t all vehicles created to be E85 operable?
The problem lies in the fuel economy on E85 vehicles. When Flex Fuel vehicles are
operated on regular fuel, they can reach their full mileage potential. However, if these
vehicles are operating on E85 they will only produce 70-80% of the vehicle’s potential
mileage. (E85 and Flex Fuel Vehicles: Technical Highlights , 2009) The following graph
shows the difference between how many gallons of fuel would be used to travel 300 miles
using regular unleaded fuel and ethanol, assuming that the vehicle’s full potential fuel
economy is 20 miles per gallon. The E85 fuel economy of 15 miles per gallon was
calculated by subtracting 25% of 20 miles per gallon fuel efficiency. Fuel prices were $3.79
per gallon and E-85 was $2.95 per gallon as of April 24, 2012 at the Primghar Iowa Pro Go
station. (Iowa E85 Prices, 2012)
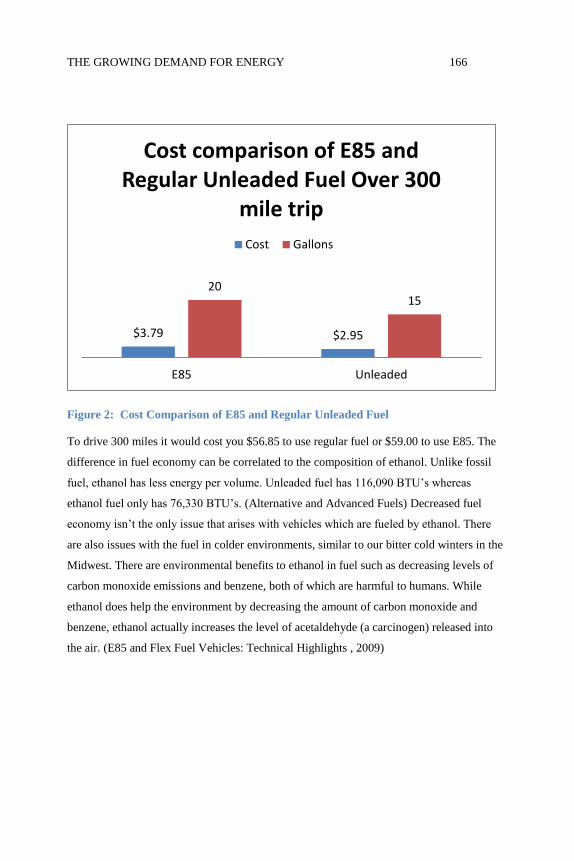
THE GROWING DEMAND FOR ENERGY 166
Figure 2: Cost Comparison of E85 and Regular Unleaded Fuel
To drive 300 miles it would cost you $56.85 to use regular fuel or $59.00 to use E85. The
difference in fuel economy can be correlated to the composition of ethanol. Unlike fossil
fuel, ethanol has less energy per volume. Unleaded fuel has 116,090 BTU’s whereas
ethanol fuel only has 76,330 BTU’s. (Alternative and Advanced Fuels) Decreased fuel
economy isn’t the only issue that arises with vehicles which are fueled by ethanol. There
are also issues with the fuel in colder environments, similar to our bitter cold winters in the
Midwest. There are environmental benefits to ethanol in fuel such as decreasing levels of
carbon monoxide emissions and benzene, both of which are harmful to humans. While
ethanol does help the environment by decreasing the amount of carbon monoxide and
benzene, ethanol actually increases the level of acetaldehyde (a carcinogen) released into
the air. (E85 and Flex Fuel Vehicles: Technical Highlights , 2009)
$3.79 $2.95
20 15
E85 Unleaded
Cost comparison of E85 and Regular Unleaded Fuel Over 300
mile trip
Cost Gallons
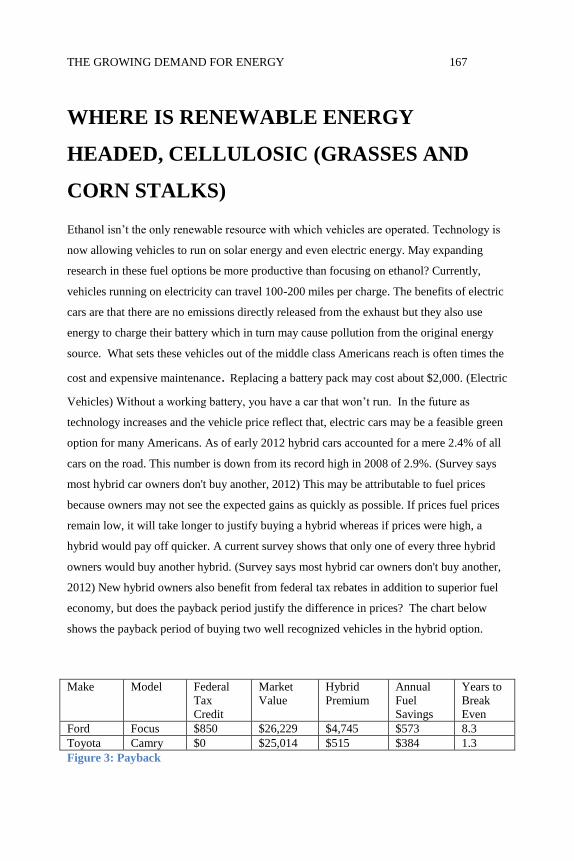
THE GROWING DEMAND FOR ENERGY 167
WHERE IS RENEWABLE ENERGY
HEADED, CELLULOSIC (GRASSES AND
CORN STALKS)
Ethanol isn’t the only renewable resource with which vehicles are operated. Technology is
now allowing vehicles to run on solar energy and even electric energy. May expanding
research in these fuel options be more productive than focusing on ethanol? Currently,
vehicles running on electricity can travel 100-200 miles per charge. The benefits of electric
cars are that there are no emissions directly released from the exhaust but they also use
energy to charge their battery which in turn may cause pollution from the original energy
source. What sets these vehicles out of the middle class Americans reach is often times the
cost and expensive maintenance. Replacing a battery pack may cost about $2,000. (Electric
Vehicles) Without a working battery, you have a car that won’t run. In the future as
technology increases and the vehicle price reflect that, electric cars may be a feasible green
option for many Americans. As of early 2012 hybrid cars accounted for a mere 2.4% of all
cars on the road. This number is down from its record high in 2008 of 2.9%. (Survey says
most hybrid car owners don't buy another, 2012) This may be attributable to fuel prices
because owners may not see the expected gains as quickly as possible. If prices fuel prices
remain low, it will take longer to justify buying a hybrid whereas if prices were high, a
hybrid would pay off quicker. A current survey shows that only one of every three hybrid
owners would buy another hybrid. (Survey says most hybrid car owners don't buy another,
2012) New hybrid owners also benefit from federal tax rebates in addition to superior fuel
economy, but does the payback period justify the difference in prices? The chart below
shows the payback period of buying two well recognized vehicles in the hybrid option.
Make Model Federal
Tax
Credit
Market
Value
Hybrid
Premium
Annual
Fuel
Savings
Years to
Break
Even
Ford Focus $850 $26,229 $4,745 $573 8.3
Toyota Camry $0 $25,014 $515 $384 1.3
Figure 3: Payback
THE GROWING DEMAND FOR ENERGY 168
(Edmunds.com Evaluates Payback Period of Hybrid and Diesel Vehicles , 2010) After
evaluating the cost structure and payback of hybrids, it is apparent that for Americans to
justify the purchase they need to become more efficient. With the rising cost of fuel some
Americans will be able to justify the purchase sooner than others but electric may take a
while to be within everyone’s grasp.
FINDINGS
The US harvested 1.2 billion acres of corn in 2011, 40% of which went into the production
of ethanol which is used in 90% of our fuels.
Developing countries have begun demanding more oil. There are limited supplies in the
world and with increased demand and limited supply comes a price premium. Although the
US has oil reserves it can drill for, not all of it is easily accessible.
To ease the dependence on foreign countries oil, the US has had subsidies and technology
behind ethanol production. Ethanol is also respected by those who are interested in the
green movement and does alleviate some of the pollutants given off by vehicles run on
regular fuel.
When ethanol is added to fuels, the vehicles become less fuel efficient because ethanol has
less energy per volume. There is a tradeoff between being renewable and being efficient.
CONCLUSION
Ethanol does hold the key to unlock many doors but technology must advance before all of
the doors can be opened. Currently the efficiency of E85 vehicles doesn’t break even with
the efficiency of vehicles run on regular fuel, nor do electric vehicles break even quickly
after purchase. The US will need to wean itself off foreign oil in the future, but at the rate
which our technology is advancing and the pressure from developing countries, this
advancement needs to happen more rapidly. With the rising world population and the high
cost of feed, there will come a point when the US will be forced yo make a tough decision.
This decision will be what to rank higher, cheap fuel or affordable food? With 40% of our
current corn production in the US going to fuel this will be a highly debated topic. Ethanol
is a prosperous industry for the US but right now other options need to be focused on in
THE GROWING DEMAND FOR ENERGY 169
addition to ethanol. When taking the efficiency of ethanol and hybrid vehicles, it is
apparent that we have a lot of challenges facing us before we can make these renewable
energy sources a fix all solution.
LIMITATIONS
Due to how current the trends are in renewable energy, it was difficult to find many books
on the current benefits and statistics of ethanol operated in vehicles. Reports listed by the
USDA supplied many statistics and future expected usages of corn. Since no growing
season is the same as the one prior, it makes future expectations of usage difficult. As
technology advances and research increases, there will be more information to build a
conclusion about the efficiency of vehicles operated on renewable energy.
ACKNOWLEDGEMENTS
Dr. Taylor assisted in the structure and topic of the research. I greatly appreciate his
assistance in creating a thought-provoking research paper as well as expanding my ideas on
the topic.
REFERENCES
After Three Decades, Tax Credit for Ethanol Expires. (2012, January 1). Retrieved April
21, 2012, from The New York Times:
http://www.nytimes.com/2012/01/02/business/energy-environment/after-three-
decades-federal-tax-credit-for-ethanol-expires.html
Alternative and Advanced Fuels. (n.d.). Retrieved May 13, 2012, from US Department of
Energy: http://www.afdc.energy.gov/afdc/fuels/properties.html
Bremer, T. (2012, April 12). Syngenta Seed Advisor. (K. Shields, Interviewer)
E85 and Flex Fuel Vehicles: Technical Highlights . (2009, October). Retrieved April 24,
2012, from EPA: http://www.epa.gov/otaq/renewablefuels/420f09065.htm
Edmunds.com Evaluates Payback Period of Hybrid and Diesel Vehicles . (2010, April 1).
Retrieved May 1, 2012, from Business Fleet:
THE GROWING DEMAND FOR ENERGY 170
http://www.businessfleet.com/Channel/Green-Fleet/News/Story/2010/04/Edmunds-
com-Evaluates-Payback-Period-of-Hybrid-and-Diesel-Vehicles.aspx?interstitial=1
Electric Vehicles. (n.d.). Retrieved April 24, 2012, from US Department of Energy :
http://www.fueleconomy.gov/feg/evtech.shtml
Energy Statistics. (n.d.). Retrieved March 9, 2012, from Nation Master:
http://www.nationmaster.com/graph/ene_oil_con-energy-oil-consumption
Ethanol. (n.d.). Retrieved April 13, 2012, from National Corn Growers Association:
http://www.worldofcorn.com/issue-briefs/8-ethanol/
Institute for Engergy Research . (2011, December). Retrieved May 5, 2012, from North
American Energy Inventory : http://energyforamerica.org/wp-
content/uploads/2012/01/Energy-InventoryFINAL.pdf
Iowa E85 Prices. (2012, April 24). Retrieved April 24, 2012, from E85 Prices:
http://e85prices.com/iowa.html
Iowa Pork Facts. (n.d.). Retrieved April 2012, 2012, from Iowa Pork Producer Association
: http://www.iowapork.org/Newsroom/IowaPorkFacts/tabid/704/Default.aspx
Minchenkov, A. (2011, June 30). Corn Acreage is up in 2011, Soybeans slightly down.
Retrieved April 1, 2012, from USDA National Agriculture Statistics Services:
http://www.nass.usda.gov/Newsroom/2011/06_30_2011.asp
Origin, History and Usage of Corn. (n.d.). Retrieved May 5, 2012, from Agronomy Iowa
State: http://www.agron.iastate.edu/courses/agron212/readings/corn_history.htm
Setting the Record Straight on Oil Reserves . (2012, March 26). Retrieved April 22, 2012,
from Consumer Energy Report:
http://www.consumerenergyreport.com/2012/03/26/setting-the-record-straight-on-u-s-
oil-reserves/
Survey says most hybrid car owners don't buy another. (2012, April 9). Retrieved 30 2012,
2012, from Fox News Business : http://www.foxnews.com/leisure/2012/04/09/survey-
says-most-hybrid-car-owners-dont-buy-another/
THE GROWING DEMAND FOR ENERGY 171
US and World Population Clocks. (2012, April 1). Retrieved April 1, 2012, from US
Census Bureau : http://www.census.gov/main/www/popclock.html
US Data Sets. (2012, January 17). Retrieved March 13, 2012, from USDA :
http://www.ers.usda.gov/statefacts/US.HTM
VEETC. (n.d.). Retrieved April 20, 2012, from Americas Renewable Fuel :
http://www.growthenergy.org/ethanol-issues-policy/economy/veetc/
Volumetric Ethanol Excise Tax Credit. (2011, December 31). Retrieved April 22, 2012,
from US Department of Energy: http://www.afdc.energy.gov/afdc/laws/law/US/399
Woodyard, C. (2012, January 1). End of ethanol subsidy could raise gas prices for 2012.
Retrieved April 24, 2012, from USA Today:
http://content.usatoday.com/communities/driveon/post/2012/01/end-of-ethanol-
subsidy-could-raise-gas-prices-for-2012/1#.T5cyXXliqt9
(2012). World Agriculture Supply and Demand Estimates. USDA
http://www.usda.gov/oce/commodity/wasde/latest.pdf.
World Population 2300. (n.d.). Retrieved April 2, 2012, from Department of Economic and
Social Affairs:
http://www.un.org/esa/population/publications/longrange2/WorldPop2300final.pdf
Xiaodong Du, D. J. (2011, April). The Impact of Ethanol Production on US and Regional
Gasoline Markets: An Update to May 2009. Retrieved April 22, 2012, from Center for
Agricultural and Rural Development - Iowa State University :
http://www.card.iastate.edu/publications/synopsis.aspx?id=1160
STOCK INDEX OPTIONS PRICING 172
Stock Index Options Pricing Models
Author: Mark York
Faculty Sponsors: Dr. Zhiguang Wang and Dr. Jung-Han Kimn
Departments: Mathematics & Statistics and Economics
ABSTRACT
The purpose of this research is to apply stochastic modeling methods to determine the
prices of stock index options. In this paper, three models are implemented and compared
for accuracy based on the S&P 500 index (SPX) options data for 1996. These models
include the Black-Scholes Model (BS), a stochastic volatility model (SV) which accounts
for volatility in the underlying stock price, and a stochastic volatility model with jump in
the underlying stock price (SVJ). This jump in the stock index prices is accounted for in the
SVJ model using a compound Poisson distribution. The SV model is nested in the SVJ
model, with jump-related parameters being set to zero. These three mathematical models
are implemented in MATLAB. The models are calibrated using data from one day at a time
for the SPX options on the Chicago Board Options Exchange based on the criteria of the
least sum of squared errors. The models are tested for consistency by calibrating and
measuring the squared error for each day in an entire year's worth of option price data.
Keywords: Computational Finance, Stock, Options, SPX Index, Black-Scholes
INTRODUCTION
According to the Chicago Board Options Exchange (CBOE), S&P 500 index (SPX) options
have been and still are the most actively traded options contracts in the world. SPX options
are employed by both financial institutions and individual investors for the purposes of risk
management and speculations. In this paper, three models for pricing SPX options are
compared empirically in order to decide which model is most appropriate for index options
pricing.
STOCK INDEX OPTIONS PRICING 173
The reason why SPX options are popular among traders is largely due to the popularity of
the underlying index, the S&P 500 index, which is the media-favorite for the overall stock
market activity in the US. Stock index options, like individual stock options can provide
holders with a right, not an obligation to take long (for call options) or short (for put
options) positions on the underlying financial asset. Holding put options can provide
downside protection for investors, whereas holding call options can allow investors to take
advantage of the upside potential in the future. Therefore, options can be employed to
express views about the stock market without immediate possession of the underlying stock
index (or 500 stocks in the case of the SPX).
The most important question for both buyers and sellers of option contracts is how much
these options should be bought and sold for? Both call and put options are valuable before
they expire on the maturity date, usually the third Friday of each calendar month. The value
of an option on the maturity date is max(Asset Price-Exercise Price, 0)for a call and is
max(Exercise Price-Asset Price, 0) for a put. Before the maturity date, the option price
fluctuates over time as the underlying stock prices are dynamically set by the market force.
In 1973, Fischer Black and Myron Scholes developed a model later known as the Black-
Scholes model (BS) to determine what the price of options should be. With this
revolutionary new model, investors had a concrete mathematical way of determining what
price they should buy and sell their options for, rather than relying on intuition. However,
over the years, it became clear that the model generated inaccuracies from time to time.
There are two major deviations of the assumptions of the BS model: the variability of asset
returns is constant and there is no discontinuity in asset prices. To account for these
shortcomings, stochastic volatility and jumps are added to the original BS model (see [1]
Bakshi, Cao and Chen 1997 and [2] Duffie, Pan and Singleton 2000), which are called SV
and SVJ models, respectively.
The purpose of this research is to show how the BS model, along with the SV and SVJ
models, can be implemented using computer programs to model a real market situation, and
to compare these models in order to find a model that best fits the data. Option traders can
employ the methodology derived for the best fitting model in their trading practices.

STOCK INDEX OPTIONS PRICING 174
METHODS
The BS, SV, and SVJ models for index options are described as follows. The log of the
underlying stock index price is denoted as y, the strike price c, the time to maturity T (in
years), and options price X0.
pricestocktheoflognaturaly =
pricestrikec =
)(= yearsinmaturitytotimeT
priceoptionX =0
For simplicity, options data of daily frequency is employed. Therefore the end-of-day
closing prices of the stock index and its options are the relevant prices. Several hundred
options contracts with various combinations of strike price and time to maturity are listed
on any given day.
The BS model has only one input, , also called implied volatility. The infamous Black-
Scholes formula for call option price is
,)()(=),( )(
21
TtrcedNSdNtSC (1)
where )( 1dN represents the cumulative standard normal distribution of 1d , c represents
the strike price, r is the annual risk-free interest rate, which is assumed constant at 0.0319,
([1] Bakshi, Cao, and Chen 1997), t represents the current time, which is set at 0, and S
represents the stock price (or equivalently ey). Within the cumulative normal distributions,
1d and 2d are defined as
tT
tTrc
Sln
d
))(
2()(
=
2
1
.=
))(2
()(
= 1
2
2 tTdtT
tTrc
Sln
d
(2)

STOCK INDEX OPTIONS PRICING 175
The price of a put option can be derived from the call-put parity equation, which is written
as
).,(=),( )( tSCSKetSP tTr
(3)
In (3) above, S and ),( tSC denote the stock price and the call option price calculated from
Equation (1), respectively.
The SV and SVJ models consist of the variables listed above (y, c, T and X0), along with
eight other parameters that characterize the features of stochastic volatility and jumps.
These parameters in the SVJ model and the SV model (in parenthesis) are listed below:
=Leverage effect
=v Long run mean volatility
reversionmeanofSpeedv =
volatilityofVolatilityv =
)0(= SVintosetjumppricestockofdeviationStandardy
)(0= SVinjumpspricestockforparameterratePoissony
)(0= SVinsizejumpMeany
SquaredVolatilityV =
The pricing function for call options for the SV and SVJ models follows[1] Bakshi, Cao
and Chen (1997) and [2] Duffie, Pan and Singleton (2000) appears as
),),(ln(),),(ln(=),,,,( 00,0, TXcGcTXcGVyTcdC ddd , (4)

STOCK INDEX OPTIONS PRICING 176
where d is set to 1 for call options. The variables c, y, T, and X0 are inputs obtained from
the raw data as stated above. The parameter V represents squared volatility and is set to
match the data during the calibration process. G is defined as follows:
dv
v
eTXivbaImTXaTXhG
ivh
ba
),0,,(1
2
),0,,(=),,( 0
0
00,
, (5)
where Im inside the integral is the imaginary part of the function in brackets, and Ψ is a
moment-generating function of the random variable X0,given by:
)),(),((
0 =),,,( VutTuyutTeTtXu
. (6)
The integral in (5) is difficult to compute, but may be approximated a number of different
ways. The approximation used in this project is the Gauss-Laguerre Quadrature, which is
described in the next section. Note that the u in (6) coordinates with the same position in
the G equation, t denotes the current time, and T is the expiration time. Parameters (.) and
(.) in Equation (6) are solutions to two ordinary differential equations (ODE) detailed in
[2] Duffie, Pan, and Singleton (2000). The results read as follows:
,)),(,()(1),(=),(0
0 dsusuuuu
))(1(2
)(1=)(
eb
ea
(7)
by letting:
,= vv kub ),(1= uua ,= 22
vab ,= tT
1.)2
1(=1(1,0)= 2 yyexp
)])(12
[12
()(=),(220
e
bln
bvurru
vv
v
(8)
In Equations (7-8), r is the annual risk-free interest rate and is the dividend yield, which is
assumed to be zero ([1] Bakshi, Cao and Chen 1997).
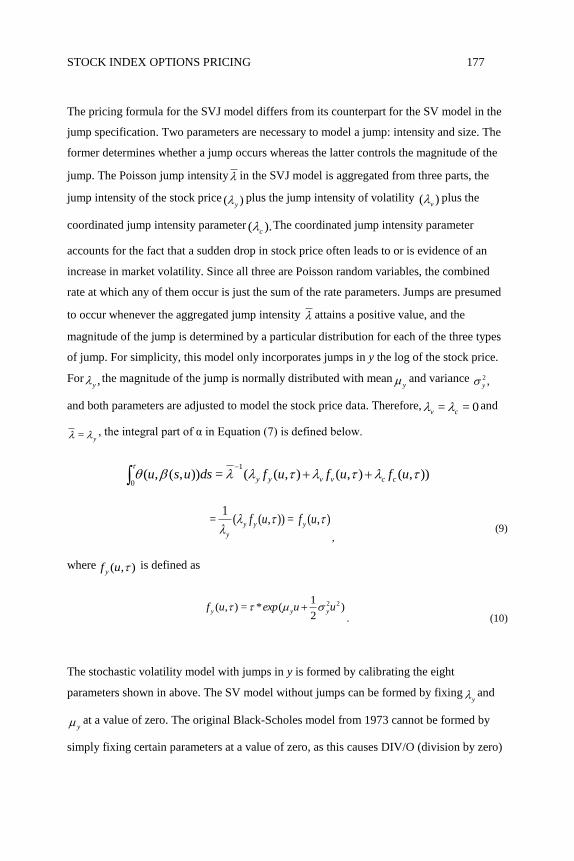
STOCK INDEX OPTIONS PRICING 177
The pricing formula for the SVJ model differs from its counterpart for the SV model in the
jump specification. Two parameters are necessary to model a jump: intensity and size. The
former determines whether a jump occurs whereas the latter controls the magnitude of the
jump. The Poisson jump intensity in the SVJ model is aggregated from three parts, the
jump intensity of the stock price )( y plus the jump intensity of volatility )( v plus the
coordinated jump intensity parameter ).( c The coordinated jump intensity parameter
accounts for the fact that a sudden drop in stock price often leads to or is evidence of an
increase in market volatility. Since all three are Poisson random variables, the combined
rate at which any of them occur is just the sum of the rate parameters. Jumps are presumed
to occur whenever the aggregated jump intensity attains a positive value, and the
magnitude of the jump is determined by a particular distribution for each of the three types
of jump. For simplicity, this model only incorporates jumps in y the log of the stock price.
For ,y the magnitude of the jump is normally distributed with meany and variance ,2
y
and both parameters are adjusted to model the stock price data. Therefore, 0== cv and
y = , the integral part of α in Equation (7) is defined below.
)),(),(),((=)),(,(1
0
ufufufdsusu ccvvyy
),(=)),((1
=
ufuf yyy
y , (9)
where ),( uf y is defined as
)2
1(*=),( 22uuexpuf yyy
. (10)
The stochastic volatility model with jumps in y is formed by calibrating the eight
parameters shown in above. The SV model without jumps can be formed by fixingy and
y at a value of zero. The original Black-Scholes model from 1973 cannot be formed by
simply fixing certain parameters at a value of zero, as this causes DIV/O (division by zero)

STOCK INDEX OPTIONS PRICING 178
situations, and thus it has to be implemented separately using Equation (1). In the next
section, the programming and calibration of all three models are discussed.
IMPLEMENTATION The model is calibrated to fit the SPX stock options data using the criterion of minimum
SSE (Sum of Squared Errors). The eight parameters are calibrated separately for each day
by using the data from that day, starting with the first trading day of 1996 (January 4th).
The accuracy of the model is measured by finding the average SSE per option for each
model. The first trading day has 279 observations, including 139 calls and 140 puts. Calls
and puts are modeled separately, as their prices change in the opposite direction as the
strike price changes. Using the equations above, the SSE criterion seeks to minimize
.))()),(),(),(,((= 2
01= kXvkykTkcdCSSE N
k (11)
where )),(),(),(,( vkykTkcdC is the model’s predicted option price for the kth option, and
)(0 kX is the actual price for the kth option.
The SSE is calculated by programming the compound function described in the previous
section into MATLAB code. In MATLAB, a main function and a series of five sub-
functions are programmed which call one another. Figures 1 and 2 describe how the
functions are called and how the data is passed from one function to another (see the arrow)
for the BS model and the SV/SVJ model, respectively. A detailed explanation of functions
involved in the calibration procedure is reported in Table 1.
The program for the BS model starts with the BlackScholes function, which retrieves data
from BSReadData, then sets an initial value for sigma. BlackScholes then passes the data
for the first day in vector form, along with sigma, to Square, which retrieves the model
prices for each option from BSCalculations, calculates the SSE for the day, and passes it to
BlackScholes. BlackScholes then tries another value for sigma, and repeats itself until it
finds a convergent minimum for the SSE, at which point it moves to the next day.
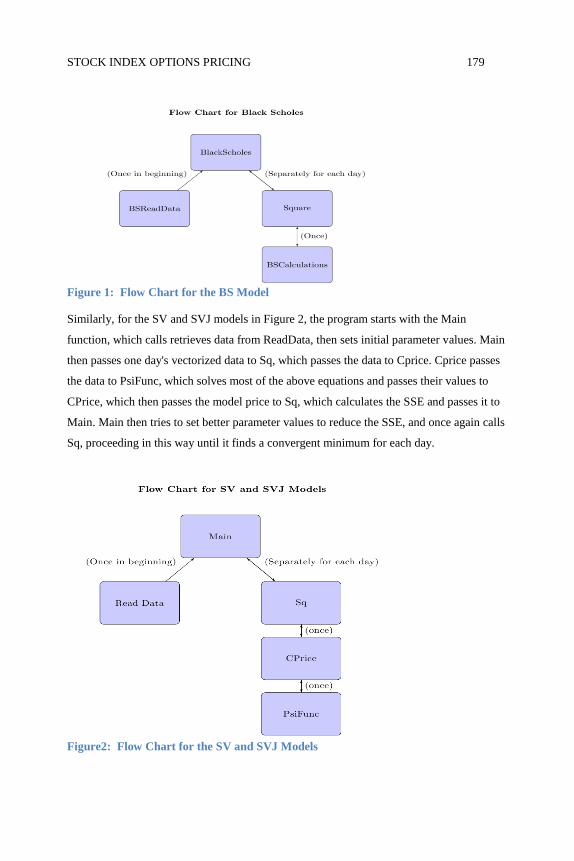
STOCK INDEX OPTIONS PRICING 179
Figure 1: Flow Chart for the BS Model
Similarly, for the SV and SVJ models in Figure 2, the program starts with the Main
function, which calls retrieves data from ReadData, then sets initial parameter values. Main
then passes one day's vectorized data to Sq, which passes the data to Cprice. Cprice passes
the data to PsiFunc, which solves most of the above equations and passes their values to
CPrice, which then passes the model price to Sq, which calculates the SSE and passes it to
Main. Main then tries to set better parameter values to reduce the SSE, and once again calls
Sq, proceeding in this way until it finds a convergent minimum for each day.
Figure2: Flow Chart for the SV and SVJ Models

STOCK INDEX OPTIONS PRICING 180
Table 1: Description of MATLAB Functions for the Calibration Procedure
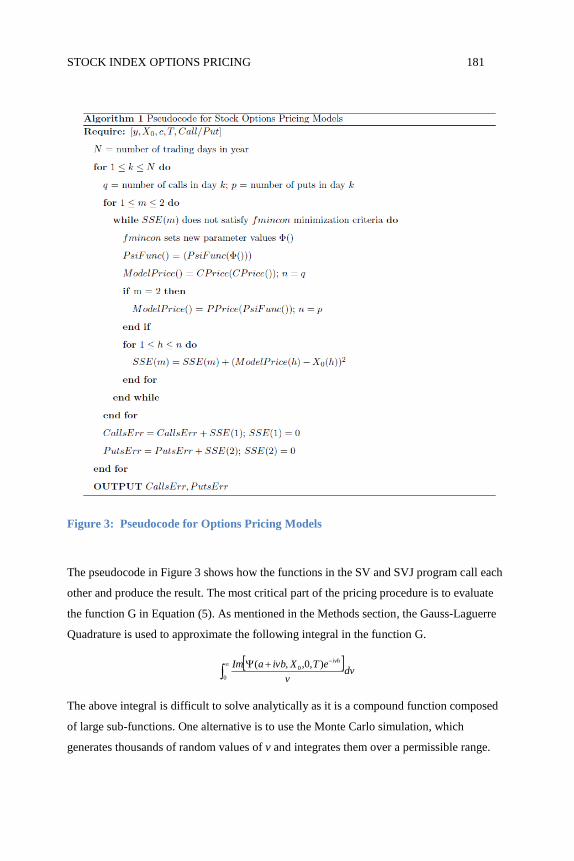
STOCK INDEX OPTIONS PRICING 181
Figure 3: Pseudocode for Options Pricing Models
The pseudocode in Figure 3 shows how the functions in the SV and SVJ program call each
other and produce the result. The most critical part of the pricing procedure is to evaluate
the function G in Equation (5). As mentioned in the Methods section, the Gauss-Laguerre
Quadrature is used to approximate the following integral in the function G.
dv
v
eTXivbaIm ivh
),0,,( 0
0
The above integral is difficult to solve analytically as it is a compound function composed
of large sub-functions. One alternative is to use the Monte Carlo simulation, which
generates thousands of random values of v and integrates them over a permissible range.
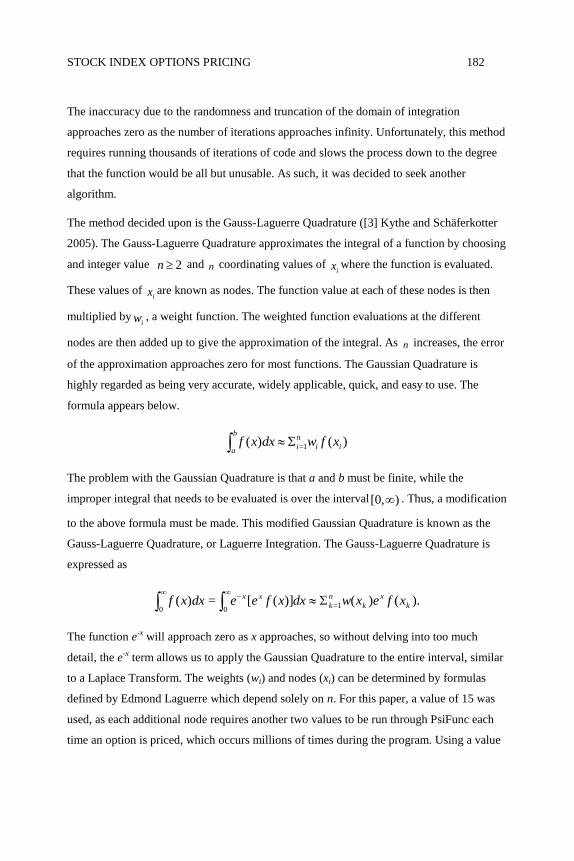
STOCK INDEX OPTIONS PRICING 182
The inaccuracy due to the randomness and truncation of the domain of integration
approaches zero as the number of iterations approaches infinity. Unfortunately, this method
requires running thousands of iterations of code and slows the process down to the degree
that the function would be all but unusable. As such, it was decided to seek another
algorithm.
The method decided upon is the Gauss-Laguerre Quadrature ([3] Kythe and Schäferkotter
2005). The Gauss-Laguerre Quadrature approximates the integral of a function by choosing
and integer value 2n and n coordinating values of ix where the function is evaluated.
These values of ix are known as nodes. The function value at each of these nodes is then
multiplied byiw , a weight function. The weighted function evaluations at the different
nodes are then added up to give the approximation of the integral. As n increases, the error
of the approximation approaches zero for most functions. The Gaussian Quadrature is
highly regarded as being very accurate, widely applicable, quick, and easy to use. The
formula appears below.
)()( 1= ii
n
i
b
axfwdxxf
The problem with the Gaussian Quadrature is that a and b must be finite, while the
improper integral that needs to be evaluated is over the interval )[0, . Thus, a modification
to the above formula must be made. This modified Gaussian Quadrature is known as the
Gauss-Laguerre Quadrature, or Laguerre Integration. The Gauss-Laguerre Quadrature is
expressed as
).()()]([=)( 1=00
k
x
k
n
k
xx xfexwdxxfeedxxf
The function e-x will approach zero as x approaches, so without delving into too much
detail, the e-x term allows us to apply the Gaussian Quadrature to the entire interval, similar
to a Laplace Transform. The weights (wi) and nodes (xi) can be determined by formulas
defined by Edmond Laguerre which depend solely on n. For this paper, a value of 15 was
used, as each additional node requires another two values to be run through PsiFunc each
time an option is priced, which occurs millions of times during the program. Using a value
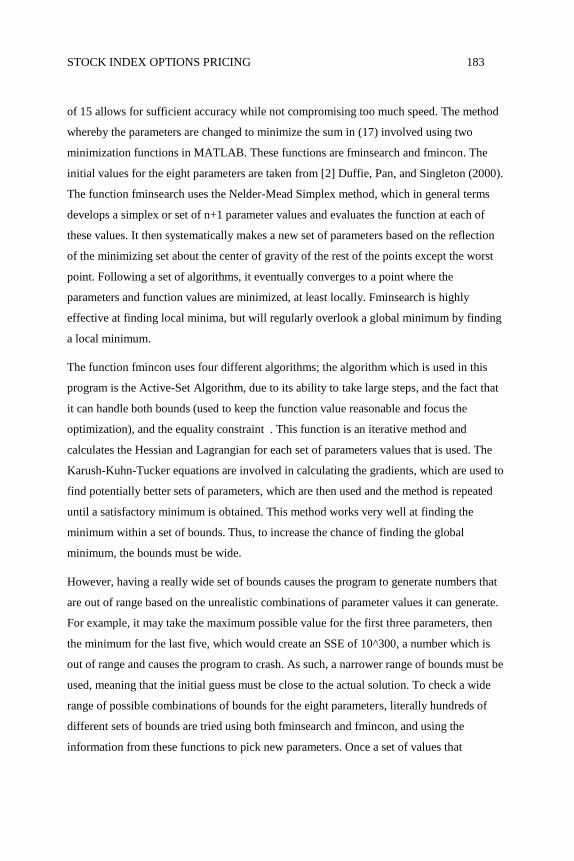
STOCK INDEX OPTIONS PRICING 183
of 15 allows for sufficient accuracy while not compromising too much speed. The method
whereby the parameters are changed to minimize the sum in (17) involved using two
minimization functions in MATLAB. These functions are fminsearch and fmincon. The
initial values for the eight parameters are taken from [2] Duffie, Pan, and Singleton (2000).
The function fminsearch uses the Nelder-Mead Simplex method, which in general terms
develops a simplex or set of n+1 parameter values and evaluates the function at each of
these values. It then systematically makes a new set of parameters based on the reflection
of the minimizing set about the center of gravity of the rest of the points except the worst
point. Following a set of algorithms, it eventually converges to a point where the
parameters and function values are minimized, at least locally. Fminsearch is highly
effective at finding local minima, but will regularly overlook a global minimum by finding
a local minimum.
The function fmincon uses four different algorithms; the algorithm which is used in this
program is the Active-Set Algorithm, due to its ability to take large steps, and the fact that
it can handle both bounds (used to keep the function value reasonable and focus the
optimization), and the equality constraint . This function is an iterative method and
calculates the Hessian and Lagrangian for each set of parameters values that is used. The
Karush-Kuhn-Tucker equations are involved in calculating the gradients, which are used to
find potentially better sets of parameters, which are then used and the method is repeated
until a satisfactory minimum is obtained. This method works very well at finding the
minimum within a set of bounds. Thus, to increase the chance of finding the global
minimum, the bounds must be wide.
However, having a really wide set of bounds causes the program to generate numbers that
are out of range based on the unrealistic combinations of parameter values it can generate.
For example, it may take the maximum possible value for the first three parameters, then
the minimum for the last five, which would create an SSE of 10^300, a number which is
out of range and causes the program to crash. As such, a narrower range of bounds must be
used, meaning that the initial guess must be close to the actual solution. To check a wide
range of possible combinations of bounds for the eight parameters, literally hundreds of
different sets of bounds are tried using both fminsearch and fmincon, and using the
information from these functions to pick new parameters. Once a set of values that
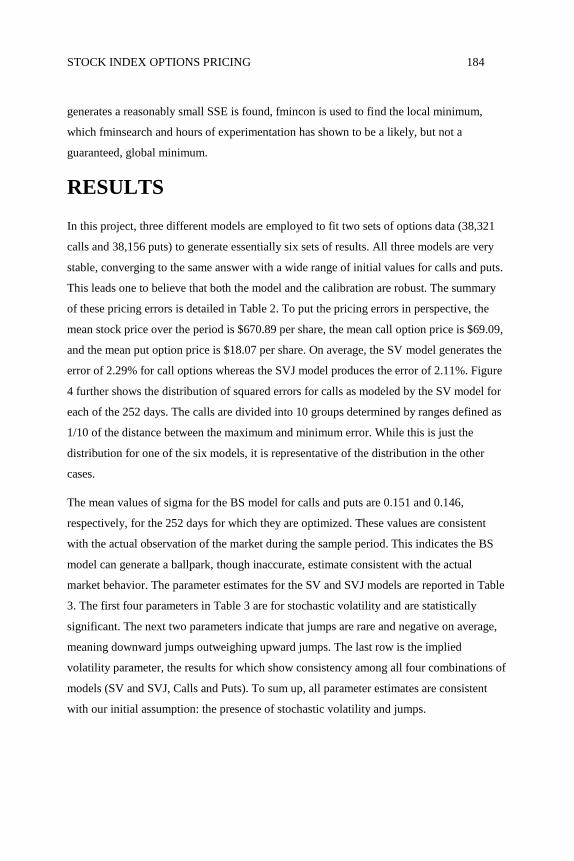
STOCK INDEX OPTIONS PRICING 184
generates a reasonably small SSE is found, fmincon is used to find the local minimum,
which fminsearch and hours of experimentation has shown to be a likely, but not a
guaranteed, global minimum.
RESULTS
In this project, three different models are employed to fit two sets of options data (38,321
calls and 38,156 puts) to generate essentially six sets of results. All three models are very
stable, converging to the same answer with a wide range of initial values for calls and puts.
This leads one to believe that both the model and the calibration are robust. The summary
of these pricing errors is detailed in Table 2. To put the pricing errors in perspective, the
mean stock price over the period is $670.89 per share, the mean call option price is $69.09,
and the mean put option price is $18.07 per share. On average, the SV model generates the
error of 2.29% for call options whereas the SVJ model produces the error of 2.11%. Figure
4 further shows the distribution of squared errors for calls as modeled by the SV model for
each of the 252 days. The calls are divided into 10 groups determined by ranges defined as
1/10 of the distance between the maximum and minimum error. While this is just the
distribution for one of the six models, it is representative of the distribution in the other
cases.
The mean values of sigma for the BS model for calls and puts are 0.151 and 0.146,
respectively, for the 252 days for which they are optimized. These values are consistent
with the actual observation of the market during the sample period. This indicates the BS
model can generate a ballpark, though inaccurate, estimate consistent with the actual
market behavior. The parameter estimates for the SV and SVJ models are reported in Table
3. The first four parameters in Table 3 are for stochastic volatility and are statistically
significant. The next two parameters indicate that jumps are rare and negative on average,
meaning downward jumps outweighing upward jumps. The last row is the implied
volatility parameter, the results for which show consistency among all four combinations of
models (SV and SVJ, Calls and Puts). To sum up, all parameter estimates are consistent
with our initial assumption: the presence of stochastic volatility and jumps.
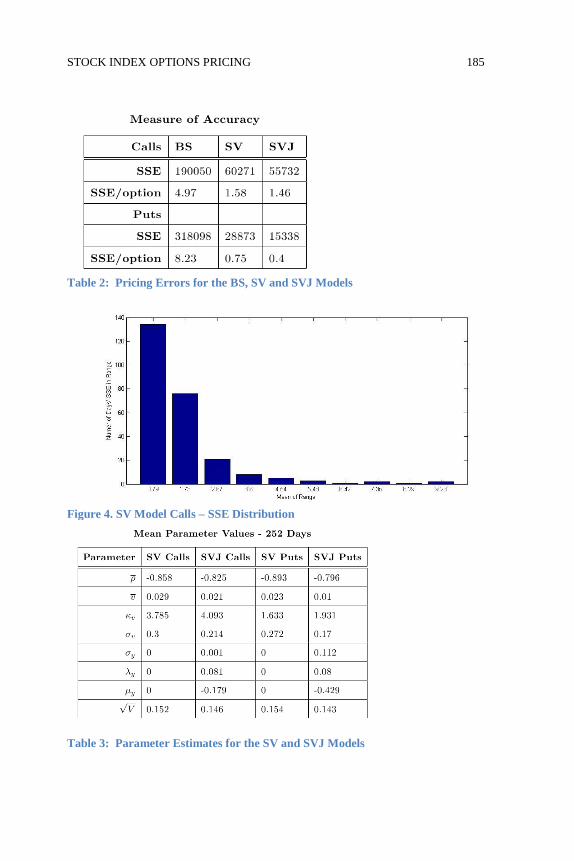
STOCK INDEX OPTIONS PRICING 185
Table 2: Pricing Errors for the BS, SV and SVJ Models
Figure 4. SV Model Calls – SSE Distribution
Table 3: Parameter Estimates for the SV and SVJ Models
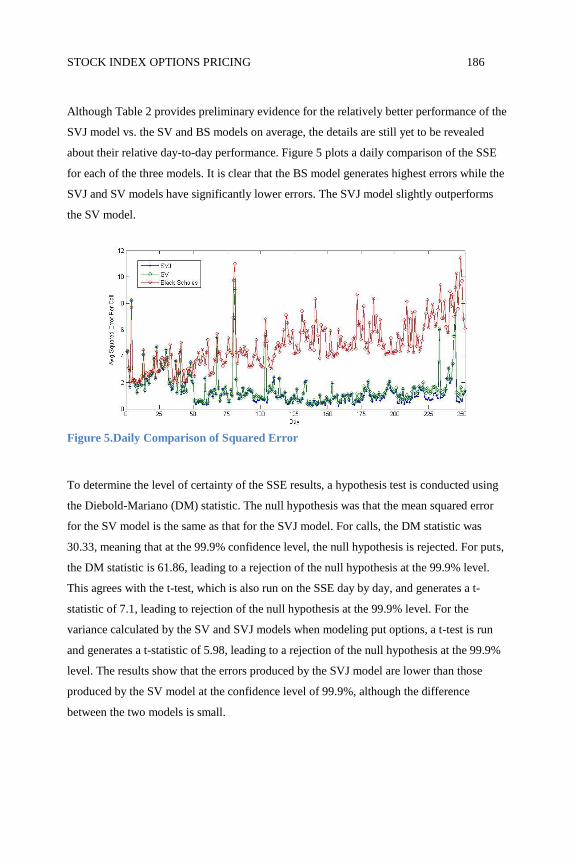
STOCK INDEX OPTIONS PRICING 186
Although Table 2 provides preliminary evidence for the relatively better performance of the
SVJ model vs. the SV and BS models on average, the details are still yet to be revealed
about their relative day-to-day performance. Figure 5 plots a daily comparison of the SSE
for each of the three models. It is clear that the BS model generates highest errors while the
SVJ and SV models have significantly lower errors. The SVJ model slightly outperforms
the SV model.
Figure 5.Daily Comparison of Squared Error
To determine the level of certainty of the SSE results, a hypothesis test is conducted using
the Diebold-Mariano (DM) statistic. The null hypothesis was that the mean squared error
for the SV model is the same as that for the SVJ model. For calls, the DM statistic was
30.33, meaning that at the 99.9% confidence level, the null hypothesis is rejected. For puts,
the DM statistic is 61.86, leading to a rejection of the null hypothesis at the 99.9% level.
This agrees with the t-test, which is also run on the SSE day by day, and generates a t-
statistic of 7.1, leading to rejection of the null hypothesis at the 99.9% level. For the
variance calculated by the SV and SVJ models when modeling put options, a t-test is run
and generates a t-statistic of 5.98, leading to a rejection of the null hypothesis at the 99.9%
level. The results show that the errors produced by the SVJ model are lower than those
produced by the SV model at the confidence level of 99.9%, although the difference
between the two models is small.

STOCK INDEX OPTIONS PRICING 187
CONCLUSIONS Based on the analysis of the empirical results, the SVJ model has a significantly greater
level of accuracy than the SV model, and the SV model is significantly better than the BS
model (although the DM statistics are not presented above, they are greater than those
between SV and SVJ). These results held true when modeling both calls and puts. As SPX
is the most actively traded European option on the index of 500 common stocks, the
modeling technique can be applied to most other European style financial (stock, bonds and
foreign exchange) options.
LIMITATIONS Areas that could be further studied to improve the model include programming in C code
rather than MATLAB, using the MCMC minimization rather than fminsearch and fmincon,
and using multiple years and stocks to further validate the results.
MATLAB code is designed to be easy to use and incredibly versatile, but it is not as fast.
The reason for this is that MATLAB code is a sort of facade code, which runs another
underlying code, causing the program to run much more slowly. Programming in C code
would allay this problem, allowing many more lines of data and different stocks to be run
more quickly than with MATLAB. Programming in C would also require the use of
MCMC minimization since fmincon and fminsearch are not available in C. This
minimization, while more complex, is a robust method and is less prone to finding local
minima in the place of the global minimum than fminsearch and fmincon.
Another improvement which can be made to the current research is to employ multiple
years of stock data and multiple stocks to allow further validation of these results.
ACKNOWLEDGEMENTS
The author would like to take this opportunity to thank Dr. Zhiguang Wang of the SDSU
Department of Economics for introducing him to this subject, supplying the papers with the
models and raw data, and for his many hours of mentorship and guidance through this
research. The author would also like to thank Dr. Jung-Han Kimn of the SDSU Department
of Mathematics & Statistics for his relentless support and expertise.

STOCK INDEX OPTIONS PRICING 188
REFERENCES
[1] Bakshi, G., Cao, C., and Chen, Z. Empirical Performance of Alternative Option Pricing Models.The Journal of Finance.v52 No.5 Dec 1997, 2003-2049.
[2] Duffie, D., Pan, J., and Singleton, K. Transform Analysis and Asset Pricing for Affine Jump-Diffusions.Econometrica.v68 (6 Nov) 2000, 1343-1376.
[3] Kythe, P., and Schäferkotter, M. Handbook of Computational Methods for Integration. Boca Raton,
FL: Chapman & Hall/CRC, 2005.